

Introduction
In sea urchin embryos, cell specifications take place along the two embryonic axes: the animal–vegetal (AV) axis and the oral–aboral (OA) axis. The AV axis can be traced back to the unfertilized egg (Boveri, Reference Boveri1901; Hörstadius, Reference Hörstadius1939), and the OA axis to the zygote (Coffman et al., Reference Coffman, McCarthy, Dickey-Sims and Robertson2004). By the end of the 4th division, three different sizes of blastomeres comprising eight mesomeres, four macromeres and four micromeres are formed and eventually become the ectoderm, the mesoendoderm and the mesoderm, respectively. The vegetal cells, micromeres, emit signals for the macromeres to form the endoderm (Ransick & Davidson, Reference Ransick and Davidson1993), while they themselves develop into skeletogenic cells (Okazaki, Reference Okazaki and Czihak1975). It is generally accepted that these abilities of the micromeres coincide with nuclear localization of β-catenin at the 16-cell stage (Logan et al., Reference Logan, Miller, Ferkowicz and McClay1999), although it is still unclear exactly how the β-catenin enters the nuclei (Davidson et al., Reference Davidson, Rast, Oliveri, Ransick, Calestani, Yuh, Minokawa, Amore, Hinman, Arenas-Mena, Otim, Brown, Livi, Lee, Revilla, Schilstra, Clark, Rust, Pan, Arnone, Rowen, Cameron, McClay, Hood and Bolouri2002). β-Catenin is a multifunctional protein that is involved not only in cell–cell adhesion but also in gene expression (MacDonald et al., Reference MacDonald, Tamai and He2009). In epithelial cells, the cytoplasmic domains of cadherin link to the cortical actin cytoskeleton via α-, β- and γ-catenins (Takeichi, Reference Takeichi1991; Gumbiner, Reference Gumbiner1996). In several cell types, the ‘myristoylated alanine-rich C kinase substrate’ (MARCKS) cross-links actin filaments and thereby anchors the actin network to the plasma membrane (Eliyahu et al., Reference Eliyahu, Tsaadon, Shtraizent and Shalgai2005). In sea urchin eggs, cadherin and β-catenin are co-localized in the cytoplasm and near the plasma membrane, and have been shown to accumulate at the sites of cell–cell contact following fertilization and cleavage (Miller & McClay, Reference Miller and McClay1997a, Reference Miller and McClayb). Thus, the subcellular localization of β-catenin is a significant marker for the control of cell division and gene expression.
In many animals, inositol phospholipid turnover is involved in the regulation of many cellular processes. Phospholipase C (PLC) hydrolyses phosphatidylinositol 4,5-bisphosphate (PIP2) in the plasma membrane to produce 1,2-diacylglycerol (DAG) and inositol 1,4,5-trisphosphate (InsP3). It has been shown that DAG activates protein kinase C (PKC), and that InsP3 promotes an increase in intracellular Ca2+ concentration (Nishizuka, Reference Nishizuka1984; Berridge, Reference Berridge1993). PKC from sea urchin embryos was cloned from Lytechinus pictus (Rakow & Shen, Reference Rakow and Shen1994), and its roles have been well demonstrated during egg activation (Shen & Buck, Reference Shen and Buck1990), skeletogenesis (Mitsunaga et al., Reference Mitsunaga, Shinohara and Yasumasu1990) and apoptosis in gastrulae (Dickey-Sims et al., Reference Dickey-Sims, Robertson, Rupp, McCarthy and Coffman2005). Livingston & Wilt (Reference Livingston and Wilt1992, Reference Livingston and Wilt1995) suggested that the InsP3-PKC signalling pathway played an important role in vegetalizing the ectodermal cells by showing that 10–15 min exposure of the embryos at the 16-cell stage to a PKC activator 12-O-tetradecanoyl phorbol-13-acetate (TPA) is sufficient to vegetalize the embryos. In addition, the presumptive ectoderm blastomeres could be vegetalized by a lithium ion (Li+) that modulates the metabolism of inositol phospholipids, and the vegetalizing effect of lithium was reversed by preinjection of the blastomere with myo-inositol (Livingston & Wilt, Reference Livingston and Wilt1995). However, Li+ is also known to inhibit glycogen synthase kinase 3 (GSK-3), which regulates the activity of the transcription factors and β-catenin (Li et al., Reference Li, Friedman, Zhu, Wang, Boswell, May, Davis and Jope2007), and to increase the levels of DAG and PKC activity (Drummond and Raeburn, Reference Drummond and Raeburn1984).
Sea urchin embryos exhibit polarized Ca2+ influxes in every cell division after fertilization (Yazaki et al., Reference Yazaki, Tosti and Dale1995; Dale et al., Reference Dale, Yazaki and Tosti1997). The micromere-specific Ca2+ influxes occur at the 4th cleavage and are followed by Ca2+oscillation for at least 10 min (Yazaki, Reference Yazaki2001; Yazaki et al., Reference Yazaki, Abe, Santella and Koyama2004). It is plausible that these Ca2+ influxes or their amplified signals could lead to PKC activation. In the present paper, to elucidate the role of PKC activity in the functions of micromere and in the development of embryo, we have used a PKC pseudosubstrate inhibitor (HpPKC-I) constructed from the amino acid sequence of the Hemicentrotus pulcherrimus PKC and a specific antibody against β-catenin of H. pulcherrimus (Hpβ-catenin). First of all, contrary to a previous report (Logan et al., Reference Logan, Miller, Ferkowicz and McClay1999), we found that the initial nuclear entrance of β-catenin takes place in the macromeres, not in the micromeres, as judged by the co-staining of β-catenin and the DNA-binding dye propidium iodide (PI). Secondly, we have found that the inhibition of PKC leads to appreciable deregulation of the cortical actin cytoskeleton in the blastomeres. In addition, we have examined the morphology and the gene expression pattern of embryos after the treatment of with HpPKC-I in the early cleavage stage. We have found that: (i) PKC activity regulates the nuclear localization of β-catenin by means of the cortical actin filaments; (ii) PKC controls the early endoderm induction signal of micromeres by modulating the intercellular adhesion system and intracellular Ca2+ signalling; and (iii) the nuclear β-catenin activates not only the endodermal genes but also ectodermal genes, depending on their timing and location, without interfering with the formation of the animal–vegetal and oral–aboral axes.
Materials and methods
Animals and gametes
Individual animals of Hemicentrotus pulcherrimus were supplied from the Misaki Marine Biological Station, the University of Tokyo, and Paracentrotus lividus from the Stazione Zoologica Anton Dohrn in Naples, Italy. Gametes were obtained by intracoelomic injection of 0.5 M KCl for H. pulcherrimus. P. lividus eggs were released from the dissected gonad into in natural seawater filtered with a Millipore-filter set. Eggs were washed and inseminated in seawater that contained 5 mM p-aminobenzoic acid (PABA-SW). Fertilization envelopes were removed by pipetting, and the embryos were cultured in filtered seawater at 15°C or 18°C (H. pulcherrimus), or at room temperature (20–23°C) for P. lividus.
Preparation of HpPKC inhibitor (HpPKC-I) and anti-Hpβ-catenin antibody
The HpPKC pseudosubstrate domain (FARRGALRQ) was synthesized according to GenBank information on H. pulcherrimus PKC (AB699356, amino acids 11–19) and myristoylated at the N-terminus of the peptide (Peptide Institute Inc., Osaka, Japan) to enable it to permeate cell membranes (Eichholtz et al., Reference Eichholtz, de Bont, de Widt, Liskamp and Ploegh1993). Recombinant protein of Hpβ-catenin was expressed bacterially by using the sequence data from the cDNA clone (AB699355) isolated from the H. pulcherrimus gastrula cDNA library (Fuchikami et al., Reference Fuchikami, Mitsunaga-Nakatsubo, Amemiya, Hosomi, Watanabe, Kurokawa, Kataoka, Harada, Satoh, Kusunoki, Takata, Shimotori, Yamamoto, Sakamoto, Shimada and Akasaka2002). The cDNA fragment encoding the N-terminal region of Hpβ-catenin (1–250 amino acids) was inserted into the pET42b/GST vector and expressed in E. coli BL21 (Stratagene). The overexpressed protein was extracted and purified by affinity chromatography using a ‘GST-Bind Resin’ column (Novagen). The GST-tag was removed using the Thrombin Cleavage Capture Kit (Novagen), and the remaining polypeptide was used to immunize rabbits to generate polyclonal antibodies against Hpβ-catenin.
Immunoblotting
Whole lysate of H. pulcherrimus embryos was prepared by sonication in Laemmli's sample buffer (62.5 mM Tris–HCl, pH 6.8, 2% sodium dodecyl sulphate (SDS), 10% glycerol, 0.005% bromophenol blue, 5% β-mercaptoethanol) and boiled for 5 min. SDS-PAGE was carried out with 10% polyacrylamide gels. Proteins were transferred to polyvinylidene difluoride (PVDF) membranes (Millipore, Bedford, MA, USA) using a semi-dry blotting apparatus. Membranes were probed with the rabbit antiserum against Hpβ-catenin (1:10,000 dilution) and the horseradish peroxidase (HRP)-conjugated swine anti-rabbit IgG (Dako, Glostrup, Denmark). Immunoreactivity signals were detected with the Millipore Immobilon western chemiluminescent HRP substrate (Millipore).
Whole-mount immunostaining
Following the methodology by Logan et al. (Reference Logan, Miller, Ferkowicz and McClay1999), embryos of H. pulcherrimus were fixed in artificial seawater (ASW; 425 mM NaCl, 9.3 mM KCl, 10 mM CaCl2, 24.5 mM MgCl2, 25.5 mM MgSO4, 2.5 mM NaHCO3, pH 8.0) containing 2% paraformaldehyde for 10 min at room temperature, and then passed briefly through 100% MeOH on ice to permeabilize the cell membrane. After three cycles of washing in phosphate-buffered saline (PBS) by sedimentation, embryos were treated with 3% bovine serum albumin in PBS containing 0.1% Tween 20 (TPBS) for 30 min, and then incubated with rabbit polyclonal antiserum against Hpβ-catenin (1:10,000 dilution) for 1 h with gentle agitation. Following one wash in TPBS and three subsequent washes in PBS, embryos were incubated for 1 h in a solution that contained the secondary antibody: the Alexa Fluor 488-conjugated anti-rabbit IgG (Molecular Probe) at 1 μg/ml (1:2000 dilution of the stock solution) in 0.1 M Na-phosphate, 0.1 M NaCl, 5 mM NaN3, pH 7.5. In the last10 min of the immuno-reaction, a DNA-binding dye PI (KPL) was added at the 1:600 dilution ratio of the stock solution (1 mg/ml PBS). After four washes in PBS, the specimens were placed in a well on a glass slide surrounded by lens paper soaked in mineral oil and were monitored with an Olympus laser-scanning confocal microscope (LSM-GB200).
Visualization of F-actin
P. lividus embryos were used for the observation of F-actin in accordance with the method described previously (Kyozuka et al., Reference Kyozuka, Chun, Puppo, Gragnaniello, Garante and Santella2008). Control embryos and the embryos treated with PKC modulators were fixed for 30 min in seawater that contained 4% formaldehyde and 0.1% glutaraldehyde, starting from 20 min after the 4th cleavage. After three cycles of rinse in the washing buffer (50 mM HEPES, pH 7.0, 50 mM PIPES, 600 mM mannitol, 3 mM MgCl2) that contained 0.1% Triton X-100, the embryos were incubated for 30 min with 3–10 U/ml of Alexa Fluor 488-conjugated phalloidin in PBT (137 mM NaCl, 2.7 mM KCl, 15 mM KH2PO4, 8 mM NaHPO4, 0.1% Triton X-100, pH 7.2) and then rinsed in PBT for three times. All steps were performed at room temperature. The embryos stained with fluorescent phalloidin were observed under an Olympus Fluoview 200 laser-scanning microscope using the BP510540 emission filter. Transmitted light and fluorescent images were acquired from the same confocal plane.
Chemical treatments of embryos
LiCl was added to the 4-cell stage H. pulcherrimus embryos at the final concentration of 40 mM as described by Ciapa & Maggio (Reference Ciapa and Maggio1993), and a batch of the embryos were grown up to the 16-cell stage (2.5 h) or until vegetalization (5 h) in the LiCl-seawater. PKC activator, phorbol-12-myristate-13-acetate ester (PMA; CALBIOCHEM) was added 5 min before the 4th cleavage at the final concentration of 8 nM (Livingston & Wilt, Reference Livingston and Wilt1992) and incubated for 20 min. HpPKC-I was added to the embryos 20 min before the 4th division until 20 min after the 6th division with the final concentration of 5–7 μM. A Ca2+-dependent PKC-specific inhibitor, 12-(2-cyanoethyl)-6,7,12,13-tetrahydro-13-methyl-5-oxo-5-idolo (2,3-a)pyrrolo(3,4-c)-carbazole (Gö6976; CALBIOCHEM) was applied at a concentration of 400 nM during the same period as the treatment with HpPKC-I. Gadolinium chloride (GdCl3·6H2O; Sigma), a stretch-activated calcium channel blocker (Yang & Sacks, Reference Yang and Sacks1989), was used for suppression of Ca2+ elevation in the micromeres (Yazaki et al., Reference Yazaki, Abe, Santella and Koyama2004) by application at the concentration of 10–30 μM from 10 min before the 1st, 3rd, 4th and 7th cleavages, respectively.
Ca2+ measurements
Paracentrotus lividus eggs were dejellied with acid seawater and washed in 10 ml seawater that contained 3 mg p-aminobenzoic acid (PABA; Sigma) and then lined on a protamine sulphate-coated dish filled with PABA seawater. A mixture of 10 mg/ml of calcium green® BAPTA conjugated with 10 kDa of dextran (Molecular Probe) and 3 mg/ml of rhodamine red was prepared in the injection buffer (0.45 M KCl, 10 mM HEPES, pH 7.0), and microinjected into eggs within 5 min after fertilization. The eggs were then collected by a mouth pipette and transferred to agar-coated dishes filled with Millipore-filtered natural seawater. About10 min before the 2nd cleavage, zygotes were transferred into the Ca2+-free seawater (CFSW; 530 mM NaCl, 10 mM KCl, 27 mM MgCl2, 29 mM MgSO4, 2 mM NaHCO3, pH 8.0). Blastomeres were separated at the 4-cell stage by gentle pipetting. These cells give rise to quarter embryos, which are able to configure their cells as 1-cell layer: two mesomeres, one macromere and one micromere to enable photometry on each cell. Ca2+ imaging was performed in the period from 5 to20 min after the 4th cleavage, the time of the micromere-specific Ca2+elevation had established in normal embryos, using a charged coupled device (CCD) camera with a ×63 objective and MetaMorph analyzing software. Calcium levels were expressed as the ratios of fluorescence intensities between calcium green® BAPTA (Ex 485 nm/Em 535 nm for 200 ms) and the internal control rhodamine red (Ex 555 nm/Em 565 nm for 100 ms exposure). When a time course measurement was needed, the time resolution was 5 s.
RT-qPCR analysis
Total RNA was extracted from Strongylocentrotus purpuratus embryos at pertinent developmental stages with the RNeasy mini kit columns (Qiagen), and subjected to cDNA synthesis by use of the SuperScript First-Strand Synthesis System (Invitrogen). Polymerase chain reaction (PCR) was carried out with specific primers synthesised from mRNA sequences of target genes in Strongylocentrotus purpuratus. The sequences (5′→3′) of each primer set (forward and reverse) are as follows: Gsc, F_ggattgatggcgatacgact and R_gcagaggaagacaccgagac; Delta, F_tgtgcaataaccagggtgaa and R_tgcaagagtttggtgagtcg; Nodal, F_gacctgctctggacctcttg and R_agtggtcgaagtttggttgg; Lim, F_gtatctttcgggcaaggaca and R_ctcttccatcggatgtggat; Gcm, F_atcgttcaccatcgacaaca and R_aggcatggtaggcagctaag; FoxG, F_gtgaaagtccctcgccatta and R_tcagcttacccgttgtaccc; Brain 1/2/4, F_gacgcattaagctcggctac and R_aagctcaactgcaaggcttc; FoxA, F_caattcgccacagtctctca and R_ctcggacatattcccagcat; NK22, F_actttggttcggttggtcag and R_ttcacggaaaagctcgtctt; Coquilette, F_ctgaccaggcatttcatgtg and R_gtgcaccagggcactatttt; Blimp, F_cagggaatctccgattcaaa and R_tggcacctcctcttctctgt; Deadringer, F_cagagctgcaatcagccata and R_gggaaccagaaggggtatgt; Sm 30, F_caaccagtctggatcggtct and R_ataggggccatcattccttc; Sm 50, F_gccttttcgcaggataatca and R_ccgtttggataagctggtgt; G-cadhedrin, F_cggtggaacttgtgttgatg and R_cgtaaccgttgttgaagctg; Bra, F_aggacacggaattgtggaag and R_gcgatgttagccgagagaac. The automated thermal cycler used was the Chromo4™ Real-Time Detector (Biorad) utilizing Sybr Green in the reaction mixture that is intercalated into double-stranded PCR amplicons and emits fluorescence. For each query transcript, the cycle threshold value (Ct) was normalized to the Ct value obtained on the same cDNA preparations with ubiquitin primers: i.e., Ct = Ct (sample)/Ct (ubiquitin). To evaluate the effect of the PKC modulator on the transcript level of each query gene, the difference (D) between the Ct values of the control and experimental samples were obtained, i.e., D = Ct (control) – Ct (experimental). Thus, positive D values indicate an increase in the transcript after treatment. To convert D into the ratio (R) of the transcript concentrations, we applied the formula R = 1.94 × D, where 1.94 is the mass amplification coefficient per PCR cycle for this particular case.
Statistical analysis
Paired t-test and one-way analysis of variance (ANOVA) with Tukey's multiple comparison test were performed using Prism 6.0 software (Graph Pad Software); P-values less than 0.05 were considered to be statistically significant.
Results
Specificity of the sea urchin-specific PKC inhibitor and anti β-catenin antibody
To study the roles of the PKC pathway in the early development of Hemicentrotus pulcherrimus embryos, we prepared a specific peptide inhibitor of PKC and antibody against β-catenin, which is a potential downstream target of PKC in the micromeres (Livingston & Wilt, Reference Livingston and Wilt1992, Reference Livingston and Wilt1995; Wikramanayake et al., Reference Wikramanayake, Peterson, Chen, Huang, Bince, McClay and Klein2004). As described in Materials and methods, the peptide inhibitor elected from H. pulcherrimus PKC (HpPKC) was completely identical to Lytechinus pictus PKC (LpPKC; Rakow & Shen, Reference Rakow and Shen1994), differing from the human PKC pseudosubstrate by only one amino acid (Fig. 1 A). When HpPKC-I (7 μM) was applied to the embryo 20 min before cleavage, the next cell division stopped, although the nuclear division progressed at the normal schedule (Fig. 2 C). At a lower dose (5 μM), we found that treatment with HpPKC-I strikingly reorganized the actin cytoskeleton in the blastomeres. Whereas the Alexa 488-phalloidin-stained F-actin filaments in the normal blastomeres were localized predominantly at the plasma membrane, the distribution of F-actin in the blastomeres of the HpPKC-I-treated embryos was shifted more towards the cytoplasm (Fig. 1 B). In contrast, when the myristoylated pseudosubstrate of human PKC differing by only one amino acid was used (Calbiochem), cell division of sea urchin embryos was not affected, even at 28 μM (data not shown). This finding suggested that the inhibitory effect on the target enzyme requires highly stringent specificity.
Inhibition of PKC interferes with the normal distribution of actin cytoskeleton in blastomeres. (A) Preparation of the HpPKC inhibitor (HpPKC-I). The amino acid sequence of Hemicentrotus pulcherrimus PKC was aligned with Lytechinus pictus (LpPKC) and human PKC (HuPKC) (1–68) to define the pseudosubstrate region (underlined nine residues). Asterisks denote identical amino acid residues. The synthetic peptides of the pseudosubstrate were myristoylated to use as HpPKC-I. (B) Effects of PKC on actin distribution. F-actin was visualized with Alexa Fluor 488-conjugated phalloidin; 8 nM PMA was added to the embryos (P. lividus) for 20 min starting from 7 min before the 4th division; 5 μM of HpPKC-I was added 20 min before the 4th division. Optical (upper) and fluorescent images (lower) were taken from the same confocal plane. In either case, cell specifications were modified, but cell division progressed normally.

Specificity of the antibody against Hpβ-catenin. (A) Deduced amino acid sequences of β-catenin from H. pulcherrimus (Hpβ) and Lytechinus variegatus (Lvβ; Miller & McClay, Reference Miller and McClay1997b) were aligned. Hpβ-catenin and Lvβ-catenin were 95% identical (shaded amino acid residues). The consensus serine/threonine targets for GSK-3β were marked with asterisks. Hpβ-catenin antibody was prepared by using the underlined region (1–250 amino acids), which included the epitope for Lvβ-catenin antibody (1–173 amino acids). (B) Western blot analysis with anti-Hpβ-catenin antibody: lane 1, molecular weight marker; lane 2, cell lysate prepared from the fertilized eggs of H. pulcherrimus; lane 3, the blot stained with Ponceau-S. Hpβ-catenin protein sized 103 kDa was marked with an arrow. (C) 7 μM HpPKC-I inhibits cell division. HpPKC-I was applied to H. pulcherrimus embryos from 20 min before the 4th cleavage. Embryos were fixed when untreated embryos arrived at the 32-cell stage, and stained with the DNA dye PI (red) and Hpβ-catenin antibody (green). Cytokinesis was blocked, but nuclear division progressed normally.

As to the specificity of the anti-Hpβ-catenin antibody, we used a part of the Hpβ-catenin as the epitope. To this end, the homologous protein to Lytechinus variegatus β-catenin (Lvβ-catenin) (Miller & McClay, Reference Miller and McClay1997a) was cloned and verified by sequence comparison. As shown in Fig. 2 A, the amino acid sequence of Hpβ-catenin (825 amino acids) was 95% homologous to that of Lvβ-catenin (821 amino acids). Antibody to Hpβ-catenin was prepared against amino acids 1–250, in consideration of the antigenic region of Lvβ-catenin (1–173 amino acids, underlined). In this region, four residues of serine/threonine (asterisked) matched the consensus substrate sequences of the glycogen synthase kinase-3β (GSK-3β) (Fig. 2 A). As expected, when a western blot of the proteins extracted from H. pulcherrimus eggs was probed with the Hpβ-catenin antibody, a single band of 103 kDa was recognized as Hpβ-catenin (Fig. 2 B). To the best of our knowledge, this finding is the first information for the molecular weight of sea urchin β-catenin. Taken together, these results assured that our PKC inhibitor and anti β-catenin antibody were highly specific.
Hpβ-catenin initially nucleated in the macromeres at the 16-cell stage
In the normal sea urchin embryos, we found Hpβ-catenin protein localized in the cytoplasm and in the apical and intercellular regions of plasma membrane by the 8-cell stage (Fig. 2 C). This result is consistent with immunostaining with anti-Lvβ-catenin antibody (Miller & McClay, Reference Miller and McClay1997a). From the 16-cell stage, the cell cycle of the embryo became asynchronous; the micromeres took longer time to arrive at the next (5th) cleavage than other blastomeres. To monitor the mitotic phase of blastomeres, every embryo stained with Hpβ-catenin antibody was counterstained with a DNA-binding dye PI. At prophase, the PI stain displayed a thread or spireme to construct chromosomes (Fig. 3 A1, a1). Interestingly, Hpβ-catenin appeared to be concentrated at the place where amphiaster is located (Wilson, Reference Wilson1937). At metaphase, the chromosomal plate was centred while spindles were formed. At anaphase, chromatids were separated within the spindles (Fig. 3 B1, b1). We found Hpβ-catenin either surrounding the equatorial plate of metaphase chromosomes (the right cell marked with asterisk in Fig. 3 B1, B2) or localized in the space between the separating chromosomes (the left cell marked with asterisk in Fig. 3 B1, B2). In the latter case, β-catenin was scarce near the mitotic asters. In Fig. 3 C, four micromeres in the centre were evident with metaphase chromosomes, but the eight surrounding cells were already in telophase. When the chromosomes construct the nuclei in the newly divided cells at telophase, the Hpβ-catenin was evidently outside the constructing nuclei (Fig. 3 c1–c3). In Fig. 3 D, the outer eight macromere derivatives are in interphase, and Hpβ-catenin accumulated in the interphase nuclei (Fig. 3 d1, d2). Hpβ-catenin changed its subcellular distribution during mitosis presumably by its interaction with the actin cytoskeletons through cadherin (Bienz, Reference Bienz2005) rather than with microtubules. Indeed, Hpβ-catenin immunoreactivity was present in the spindle regions but absent in the astral regions (Fig. 3 B, b).
Figure 4 shows the Hpβ-catenin distribution in embryos from the 16- to 56-cell stages. At the 16-cell stage, nuclear β-catenin was usually detected only in the macromeres (Mac) (Fig. 4 A), although in some batches of embryos it was detectable also in the micromeres, but its fluorescence intensity was always much weaker than in the macromeres (data not shown). In the late 16-cell stage (Fig. 4 B), the macromeres and mesomeres entered the next cleavage cycle (anaphase chromosomes were visible in Mac) and the four micromeres (mic) were still in the interphase. At the early 28-cell stage, the micromeres were in metaphase with more condensed stain with PI, while Mac had already divided and attained the telophase. It is noticeable that β-catenin accumulated around the newly formed metaphase chromosomal plates of mic (Fig. 4 C1, C2). When the Mac and meso had completed the 5th division and formed interphase nuclei, the micromeres belatedly entered anaphase of the 5th division, displaying nuclear-β-catenin-like distribution (Fig. 4 D). Nuclear β-catenin was still detected only in the daughter cells of the macromeres. At the 56-cell stage (Fig. 4 E), four small (s-mic) and four large micromeres (l-mic) were formed, and the macromere descendants were located in the veg1 and veg2 cell layers. Nuclear β-catenin was now detected in the interphase nuclei of both s-mic and l-mic, and as well as in the veg2 cell layer. A small weak signal seemed to be present in the nuclei of veg1 cells. However, nuclei of animal cells (an) always exhibited no β-catenin signal.
Distribution of Hpβ-catenin during mitosis. Embryonic cells at various mitotic stages (H. pulcherrimus) were stained with Hpβ-catenin antibody (green) and PI (red). Cells marked with asterisks in each embryo of (A), (B), (C) and (D) respectively were enlarged in the right-side panel (a, b, c, d). (A) At the 56-cell stage, most macromere and all mesomere derivatives shown were in prophase. (B) Cells at metaphase and anaphase in the 28-cell stage embryo. (C) Cells at telophase in the 28-cell stage embryo from the ventral view. Macromeres have just divided to be in telophase, showing an irregular, chambered structure in the process of reconstruction of the daughter nuclei. (D) A ventral view of 28-cell stage embryo. Macromeres were at interphase.

Localization of the nuclear β-catenin in the 16-cell to 56-cell stage embryos. (A1–E1) double staining of propidium iodide (PI) (red) and β-catenin antibody (green). (A2–E2) images of β-catenin staining only. (A3–E3) Drawing of (A1–E1) images to illustrate the nuclei and the contour lines of blastomeres. Abbreviations: mic; micromeres, Mac; macromeres, meso; mesomeres. (A) H. pulcherrimus embryo at the 16-cell stage: all cells were at interphase. Nuclear β-catenin was preferentially present in Mac. (B) Late 16-cell stage: mic remained at the interphase, but Mac progressed to anaphase. No β-catenin was found in mic nuclei. (C) Early 28-cell stage: Mac divided to the telophase, and mic formed chromosomal plate of metaphase. (D) At the 28-cell stage: mic at metaphase or anaphase. Mac and meso derivatives were at interphase. Nuclear β-catenin was detected only in Mac derivatives. (E) At the 56-cell stage: s-mic, small micromeres; l-mic, large micromeres. Veg1 and Veg2 are the macromere derivatives locating at the animal side (an) or next to l-mic, respectively. All cells shown were at interphase, and nuclear β-catenin was detected in every cell except for ‘an (animal side)’ cells. Abbreviations: An, animal side; Vg, vegetal side.

PKC regulates nuclear entrance of Hpβ-catenin
In the 28-cell embryo, nuclear localization of the β-catenin was evident preferentially in the cells at the vegetal side, although the micromeres had not yet arrived at interphase and therefore exhibited no clear sign of nuclear β-catenin (Fig. 4). When the embryos were treated with LiCl, which is a well known vegetalizing agent, the overall immunoreactivity of β-catenin was increased throughout the cytoplasm (Fig. 5 B), and the nuclei were more densely stained in the cells at the vegetal side in comparison with the control, although the nuclei of the cells in the animal side were largely devoid of β-catenin (Fig. 5 B2; Logan et al., Reference Logan, Miller, Ferkowicz and McClay1999). Similarly, addition of the activator of PKC (phorbol 12-myristate 13-acetate, PMA; also known as TPA) markedly increased β-catenin immunoreactivity in the cytoplasm and nucleus, and the cells in the animal side were largely missing β-catenin immunoreactivity in the nucleus (Fig. 5 C). Thus, the addition of LiCl and PMA appeared to intensify the AV gradient of nuclear β-catenin, which is found in the control. By contrast, 5 μM HpPKC-I markedly increased β-catenin predominantly near the plasma membrane with the concomitant decrease in the cytoplasm. In addition, it was noted that β-catenin was present in the nuclei of all blastomeres (Fig. 5 D, E). Embryos treated with another PKC inhibitor Gö6976 produced virtually the same results as in the embryos treated with HpPKC-I (Fig. 5 F). Hence, whereas a pharmacological activator of PKC mimics some of the effects displayed by Li+ in terms of β-catenin distribution, the peptide inhibitor of the PKC interfered with the normal subcellular distribution of β-catenin, negating its cell-specific nuclear localization.
LiCl, PKC activator and PKC inhibitors affect the distribution of β-catenin. Localization of β-catenin (green) and nuclear staining (red) in the H. pulcherrimus embryos at the 16-cell, 28-cell and 56-cell stages. (A) Control embryos. (B) Embryos treated with 40 mM LiCl starting from the 4-cell stage. (C) Embryos exposed to PKC activator (8 nM PMA for 20 min starting from 5 min before the 4th cleavage). (D, E) Embryos exposed to 5 μM HpPKC-I starting from 20 min before the 4th division (16-cell stage). (F) Embryos exposed to 400 nM Gö6976, a calcium-dependent PKC inhibitor, for the same period as HpPKC-I. Abbreviations: An, animal side; Vg, vegetal side; mic; micromeres, Mac; macromeres, meso; mesomeres.

Effects of HpPKC inhibitor on micromere-specific Ca2+ rise and gastrulation
Sea urchin embryos display two types of Ca2+influxes. L-type Ca2+ channels derived from the egg plasma membrane function from the first cleavage and show AV axis polarity (Yazaki et al., Reference Yazaki, Tosti and Dale1995). Ca2+ currents were highest in mesomeres, but nearly absent in micromeres. Another type of Ca2+ influx starts to take place at the 4th cleavage through a stretch-dependent Ca2+ channels in the micromere (Yazaki, Reference Yazaki2001). This micromere-specific Ca2+influx was followed by Ca2+oscillations through the InsP3/PKC signalling pathway, and thereby attained the intracellular Ca2+ level in the micromeres to about 10 % higher than in other blastomeres (Yazaki et al., Reference Yazaki, Abe, Santella and Koyama2004). While the Ca2+ increase is expected to activate the PKC pathway, it is not well known whether PKC in turn may contribute to modulate the intracellular Ca2+ levels in the micromeres. Here we have tested if PKC plays a role in the micromere-specific Ca2+ elevation. Using a fluorescent Ca2+ indicator (see Materials and methods), we have monitored changes in the intracellular Ca2+ levels 5–10 min after the 4th cleavage. The Ca2+ levels of each blastomere were monitored by single photometry at the 16-cell stage (Table 1). As expected from a previous study using intracellular recording (Yazaki, Reference Yazaki2001), the Ca2+ levels in the micromeres (0.99 relative fluorescence unit; RFU) were slightly, but significantly, higher than those of the macromeres (0.91 RFU, p < 0.05) and the mesomeres (0.92 RFU, p < 0.05). In embryos treated with the PKC activator PMA (8 nM), the intracellular Ca2+ levels in all blastomeres were significantly lowered in comparison with the control (P < 0.05; Table 1). In line with this result, the addition of 400 nM Gö6976 (a pharmacological inhibitor of PKC) significantly increased the Ca2+ levels in all blastomeres, and suggested that PKC is involved in intracellular Ca2+ homeostasis. Interestingly, when the embryos were treated with 5 μM HpPKC-I, the disparity of the Ca2+ levels in the three types of blastomeres was abolished, as the level in the micromere was reduced significantly (P < 0.05) to the levels in the macromeres and mesomeres, which were virtually unchanged in comparison with the controls (Table 1).
Effects of HpPKC inhibitors or activator on micromere-specific Ca2+ elevation (P. lividus)

Ca2+ levels of each blastomere were reported as mean ± standard deviation (SD) of the ratios of fluorescence intensity of Ca2+-sensitive dye (calcium green BAPTA) to the intensity of the Ca2+-insensitive internal control dye (rhodamine red) in the same cell. The numbers of monitored cells were given in parentheses.
The earliest function of the micromeres appears to be endoderm induction, as the signal is emitted from the micromeres during the 16–60-cell stages (Ransick & Davidson, Reference Ransick and Davidson1995). We have examined whether the Ca2+ influx and PKC activity are essential for this micromere signal. As the Ca2+ influx at the micromere formation is suppressed with GdCl3, an inhibitor of stretch-activated ion channels (Yazaki et al., Reference Yazaki, Abe, Santella and Koyama2004), we exposed P. lividus embryos to 25 μM GdCl3 and examined the frequency of the embryos that clearly exhibited the expected phenotypes: ingression of the primary mesenchyme cells (PMCs) and gastrulation (Fig. 6 A). We found that gastrulation was delayed by GdCl3 when it was applied at the 4th and 5th cleavages, but not before or after the period. When GdCl3 was added from the 5th cleavage, which included micromere cleavage to form small and large micromeres during treatment, gastrulation was delayed to a lesser extent than when treatment was carried out at the 4th cleavage (Fig. 6 A). By contrast, the ingression of PMCs into the blastocoel was not altered in all treatment schemes.
Inhibition of Ca2+infux and of PKC activity delayed gastrulation, but not PMC ingression. (A) P. lividus embryos were treated with 25 μM GdCl3 for 50 min starting from 15 min before the 2nd, 4th, 5th and 7th cleavages at room temperature. Cell cycles went on every 30–35 min. Control and GdCl3-treated embryos were both fixed at the same time, and the percentage of PMC-ingressed embryos or gastrulation-initiated embryos were calculated from circa 100 embryos from two or three independent experiments, respectively. (B, C) H. pulcherrimus embryos were treated with HpPKC-I at 6 μM (B) or 5 μM (C) during the period indicated by the horizontal bars. Gastrulation levels were estimated only from the side-viewed embryos. Embryos were cultured at 15°C (B), at 18°C (C). The cell cycles of these experiments were 45–48 min (B) and 39 min (C).

Similar to finding with GdCl3, HpPKC-I affected the timing of gastrulation as shown with H. pulcherrimus embryos exposed to 6 μM HpPKC-I (Fig. 6 B, C). To quantify the progression of gastrulation, we rated the embryos into four grades based on the length of the invaginated archenteron: 0G, uninvaginated embryo; 1/4G, embryo with an indent at the vegetal pole; 2/4G, embryo with the archenteron elongated to the midpoint; 4/4G, embryo with the archenteron attained to the animal pole. The control embryos underwent gastrulation by 23 h (Fig. 6 B). About 30% of embryos nearly completed gastrulation (3/4G + 4/4G), and the rest elongated their archenteron and arrived at the 2/4G stage. In contrast, the embryos exposed to HpPKC-I barely started gastrulation by 23 h. Two hours later (Fig. 6 B, at 25 h), all the control embryos had finished gastrulation, but the embryos treated with HpPKC-I were still gastrulating (most embryos were estimated to be at 2/4G). The extent of the delay was not changed by the duration of the treatment, from 70 min (8–16-cell stage) to 150 min (8–60-cell stage). Thus, the delay of gastrulation by HpPKC-I appeared to have a critical period of about 70 min that was between the 8-cell and 16-cell stages. Indeed, inhibition of PKC from the 7th cleavage (124-cell stage) caused no delay in gastrulation (Fig. 6 B), whereas the largest delay in gastrulation was provoked by the treatment during the 8–60-cell stages (Fig. 6 C). In contrast, in all these conditions, PMC ingression took place on a normal schedule (data not shown), analogous to the results obtained with GdCl3 (Fig. 6 A). Hence, inhibition of the stretch-activated Ca2+ channel (GdCl3) and PKC (HpPKC-I) both led to a delay in gastrulation but not to alteration of the micromere specifications.
HpPKC inhibitor enlarged the oral ectoderm in both H. pulcherrimus and P. lividus embryos without affecting mesoendoderm specification
We have studied how HpPKC-I would affect the development of the embryo at later stages. To this end, embryos of H. pulcherrimus and P. lividus were treated with 5 μM HpPKC-I (Fig. 7). In comparison with the control, the embryos treated with HpPKC-I displayed: (i) disruptions of the cell-cell contact in the early blastula; (ii) delay of gastrulation; and (iii) enlargement of the oral ectoderm in the pluteus. However, the gut developed normal in these embryos, and the pigment cells were well discernible. When quartet micromeres isolated from a 16-cell stage embryo were recombined to an animal cap, the plutei that derived from the recombinant embryo displayed a normal distribution of alkaline phosphatase-positive cells (gut marker) and formation of functional guts regardless of pretreatment with HpPKC-I (data not shown). Thus, HpPKC-I does not appear to interfere with the ability of micromeres to induce mesoderm. However, HpPKC-I caused morphological shifts at the pluteus stage. When the skeletal size of plutei was measured with regard to the post-oral rod (por), body rod (br) and antero-lateral rod (alr) (nomenclature identified in Fig. 7 C), the total length of the rod structures in the embryos treated with HpPKC-I was about 10% reduced compared with the control embryos, while the skeleton supporting oral ectoderm, alr, remained the same (Table 2). Thus, the effects of HpPKC-I on the skeleton size were restricted to br and por in the aboral ectoderm region. In contrast, LiCl showed a tendency to suppress skeletogenesis as a whole, whereas another PKC inhibitor, Gö6976, enhanced the growth of skeletons at the concentration used. Instead, the addition of PKC activator, PMA made no difference.
Effects of PKC modulators on the formation of the skeletal rods in the pluteus (P. lividus)

In total, 5 μM HpPKC-I and 400 nM Gö6976 were added to embryos 20 min before the 4th cleavage; 8 nM PMA was added to the 16-cell stage embryos for 20 min, and 40 mM LiCl to the embryos at the 4-cell to 60-cell stages (2.5 h). The numbers of monitored cells are given in parentheses.
HpPKC inhibitor caused similar morphological changes on embryos of H. pulcherrimus and P. lividus. Embryos were treated with 5 μM HpPKC-I from 20 min before the 4th cleavage to 20 min after the 6th cleavage. This period was about 120 min for H. pulcherrimus culturing at 18°C and 100 min for P. lividus at 23°C. Control and HpPKC-I-treated embryos. (A) H. pulcherrimus embryos; early blastulae at 6 h post fertilization (p.f.), gastrulae at 22 h, and plutei at 52 h (B) P. lividus; morulae at 5 h, gastrulae at 21 h, and plutei at 47 h. (C) Names of the skeletal parts of the pluteus.

As mentioned for Fig. 6 C, when HpPKC-I was added to the embryos by the 8-cell stage, the timing of gastrulation was not changed, but it was noted that the shape of embryos seemed to be changed considerably (Fig. 8 B). To discriminate the shape clearly, the embryos marked with asterisks in the left panels were delineated on the right to indicate the oral (arrowheads) and the aboral ectoderms (arrow) in the normal embryos (Fig. 8). When HpPKC-I was added before the 3rd cleavage (4-cell stage), the embryo displayed a much decreased aboral ectoderm in comparison with the control, forming embryos in which the oral ectoderm was disproportionally larger (Fig. 8 B). Similar morphological changes were observed in the embryos treated with HpPKC-I after the 4th cleavage but to a lesser extent (Fig. 8 C). Again, added after the 7th cleavage, HpPKC-I had no effect on the morphology of the embryos (data not shown).
Morphological changes of H. pulcherrimus embryos treated with HpPKC inhibitor before the 8-cell stage. (A) Control embryos. (B) Embryos treated with 5 μM HpPKC-I starting from the 4-cell stage (20 min before the 3rd cleavage) to the end of 8-cell stage. (C) Embryos treated with 5 μM HpPKC starting from 20 min before the 4th cleavage to the end of 16-cell stage. Embryos were cultured at 18°C. The hand-drawn delineations on the right panels represent the embryos marked with asterisks in (A–C). Oral ectoderm area and aboral area were indicated by white arrowheads and black arrows, respectively.

qPCR analysis of the embryos treated with the HpPKC inhibitor
To study the effect of PKC on the expression of the pivotal genes involved in early embryonic development, we examined the changes in levels of the 17 transcripts with or without treatment with HpPKC-I. As summarized in Table 3, the genes normally expressed in the oral ectoderm, Nodal, Deadringer and Lim, markedly increased their expression after the embryos were exposed to HpPKC-I, while the transcripts of the aboral ectoderm genes, NK2.2 and Coquilette, decreased. In accordance with the morphology data (Table 2), the skeletogenic genes also decreased in expression. However, we need to pay special attention to those genes whose expression is linked to the timing of gastrulation. As the addition of HpPKC-I delayed gastrulation, the genes linked to gastrulation are likely to display an altered expression profile in response to HpPKC-I. As expected, the level of Brain1/2/4, a transcription factor that is expressed at the initiation of gastrulation and controls endo16 (Yuh et al., Reference Yuh, Dorman and Davidson2005), was much lower after HpPKC-I treatment (Table 3). We have also found that HpPKC-I increased Nodal but suppressed Deadringer (Dri) transcripts. Together with Lim, Nodal and Deadringer (Dri) are involved in the development of oral ectoderm, but the expression times of these genes are known to be slightly different. In the beginning of gastrulation, Nodal declines by half (Duboc et al., Reference Duboc, Rottinger, Besnardeau and Lepage2004), but Dri increases (Amore et al., Reference Amore, Yavrouian, Peterson, Ransick, McClay and Davidson2003). Likewise, genes involved in aboral ectoderm formation (NK2.2 and Coquilette) are expressed from the blastula stage (Takacs et al., Reference Takacs, Amore, Oliveri, Pouska, Wang, Burke and Peterson2004; Croce et al., Reference Croce, Lhomond and Gache2003), and accordingly we have found that HpPKC-I treatment suppressed their expression. Thus, our data with HpPKC-I are in line with these previous observations, and suggest that PKC signalling may contribute to the fine regulation of gene expression before gastrulation.
qPCR analysis of embryos treated with HpPKC inhibitor
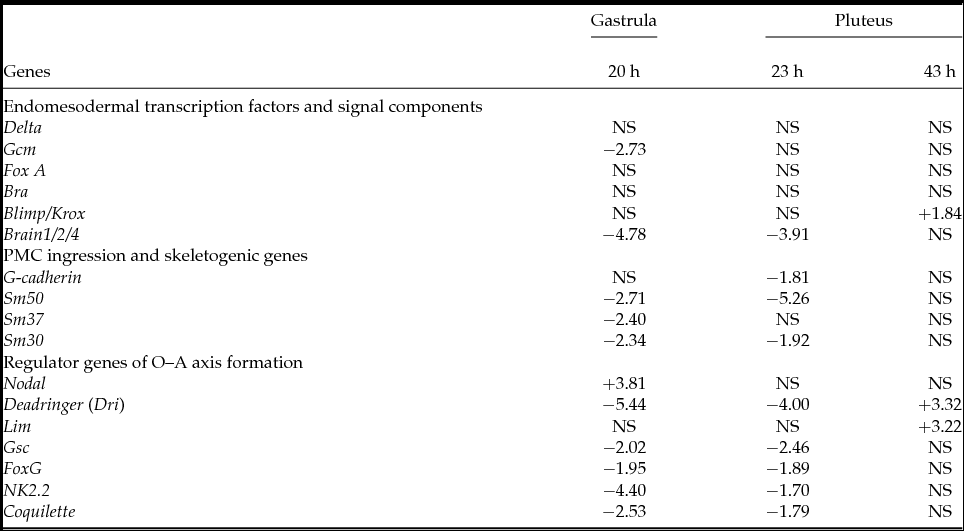
Embryos were treated with 5 μM HpPKC-I starting from 20 min before the 4th cleavage until 20 min after the 6th cleavage. Embryos were harvested at time points 20 h (early gastrula), 23 h (late gastrula or prism) and 43 h (two-armed pluteus) post fertilization. The D values defined in Methods and materials were calculated from the results of qPCR and reported in positive and negative numbers that respectively represent increases and decreases of the transcripts after the treatment with the inhibitor. NS, not significant (P > 0.05).
Discussion
In the present study, we have demonstrated that the PKC pathway plays an important role during the early embryonic development of sea urchin. Suggestive of a conserved mechanism of control, the PKCs from the two species of sea urchins (H. pulcherrimus and P. lividus) shared the same myristoylated pseudosubstrate region that we have employed as a specific PKC inhibitor (HpPKC-I). HpPKC-I was highly effective and completely blocked cell division at 7 μM concentration. At 5 μM, phalloidin-stained F-actin filaments were apparently released from the plasma membrane region, disrupting the intercellular adhesion system (Figs. 1 and 7). Oral ectoderm specifications were also affected by HpPKC-I in both embryos (Fig. 7). Our studies using HpPKC-I have thus revealed that the PKC pathway is involved in the regulation of many aspects of early development such as cytokinesis, dynamic rearrangement of the actin cytoskeleton, nucleation of β-catenin, gastrulation, intracellular Ca2+ signalling, and the expression of the genes accountable for the formation of oral ectoderm. Taken together with previous findings that blastomeres of 16-cell stage sea urchin embryos have Ca2+ influx (Yazaki, Reference Yazaki2001), the results of our studies using HpPKC-I suggested the Ca2+/DAG-dependent protein kinase PKC as the central piece of the signalling pathway that links the intracellular Ca2+ increase to various downstream events in early embryonic development.
Sea urchin embryos specify cell fates along two embryonic axes; animal–vegetal (AV) axis and oral–aboral (OA) axis. Both axes are initially inherent in the cytoarchitecture of the unfertilized egg (Boveri, Reference Boveri1901; Hörstadius, Reference Hörstadius1939; Coffman & Davidson, Reference Coffman and Davidson2001; Croce et al., Reference Croce, Range, Wu, Miranda, Lhomond, Peng, Lepage and McClay2011). β-Catenin is a maternally expressed protein, and its nuclear entrance in the blastomeres sets the tone for the AV axis for cell specification (Wikramanayake et al., Reference Wikramanayake, Huang and Klein1998; Logan et al., Reference Logan, Miller, Ferkowicz and McClay1999; Croce et al., Reference Croce, Range, Wu, Miranda, Lhomond, Peng, Lepage and McClay2011). Nuclear entrance of β-catenin takes place in the micromeres and the macromeres (Fig. 4) on the vegetal side, but not on the animal side (Miller & McClay, Reference Miller and McClay1997a; Logan et al, Reference Logan, Miller, Ferkowicz and McClay1999). One of our major findings in this study is that this tight cell-specific control of nuclear localization of β-catenin is deregulated by the inhibition of PKC, as 5 μM HpPKC-I induced nuclear entrance of β-catenin in all cells at the 16-cell stage (Fig. 5 D, E). In addition, we have found that the initial nuclear localization of β-catenin takes place in the macromeres (Figs. 4 A and 5A). While the significance of this finding is not entirely clear, our result is at variance with a previous study using another sea urchin species L. variegatus in which the initial nuclear entry of β-catenin was reported to take place in the micromeres at the 16-cell stage (Logan et al., Reference Logan, Miller, Ferkowicz and McClay1999). The specificity of our antibody against β-catenin of H. pulcherrimus was demonstrated in western blot analysis, which showed a single band of 103 kDa (Fig. 2 B) that was in general agreement with the molecular weights of the β-catenins in Xenopus (92 kDa) (McCrea & Gumbiner, Reference McCrea and Gumbiner1991) and in starfish embryos (100 kDa) (Miyawaki et al., Reference Miyawaki, Yamamoto, Saito, Saito, Kobayashi and Matsuda2003). Our antibody also visualized the characteristic cytoplasmic and membrane distributions of β-catenin reported in L. variegatus (Miller & McClay, Reference Miller and McClay1997a) up to the 4th cleavage. Thus, this difference does not seem to represent a technical issue on our part. We have checked the subcellular localization of β-catenin in the context of mitotic cell cycle (Fig. 3), and confirmed that nuclear entrance of β-catenin first occurred in the macromeres at the 16-cell stage and then expanded to micromeres at the 32-cell stage, whereas nuclear localization of β-catenin in the micromeres clearly occurred only after the 5th cleavage (Fig. 4). Hence, whether this subtle difference in H. pulcherrimus and L. variegatus arises from a real biological difference in the two sea urchin species or simply reflects methodological limitations is yet to be resolved.
The results of our experiment using HpPKC-I raised intriguing questions as to how PKC regulates subcellular distribution of β-catenin, and as to the roles of nuclear β-catenin. In sea urchin embryos, it has been proposed that the specific nuclear entrance of β-catenin in the cells on the vegetal side is mediated by glycogen synthase kinase 3β (GSK-3β), which is a serine/threonine kinase comprising the Wnt pathway. In line with this idea, Lhomond et al., (Reference Lhomond, McClay, Gache and Croce2012) reported that Wnt6 and its receptor Frizzled 1/2/7 selectively expressed in macromeres were responsible for nuclear localization of β-catenin in macromere daughter cells after the 5th cleavage. In view of the fact that the Wnt/Ca2+ signalling pathway activates Ca2+-dependent kinases such as PKC and CAMK II in vertebrates (Kühl et al., Reference Kühl, Sheldahl, Park, Miller and Moon2000), it is conceivable that PKC may serve as a downstream effector of Wnt and preclude the nuclear entrance of β-catenin in blastomeres on the animal side in sea urchin embryos. Indeed, it has been reported that PKC inactivates GSK-3β by phosphorylation in test tubes and in fibroblasts (Goode et al., Reference Goode, Hughes, Woodgett and Parker1992; Cook et al., Reference Cook, Fry, Hughes, Sumathipala, Woodgett and Dale1996). In addition, β-catenin is phosphorylated by the maternally expressed GSK-3β and rapidly degenerated in blastomeres on the animal side of the 16-cell stage sea urchin embryo, whereas β-catenin is stable in the vegetal cells because GSK-3β is inactivated by Dishevelled (Dsh) protein, a transducer of the canonical Wnt pathway (Weitzel et al., Reference Weitzel, Illiew, Byrum, Xu, Wikramanayake and Ettensohn2004; Croce et al., Reference Croce, Range, Wu, Miranda, Lhomond, Peng, Lepage and McClay2011). The idea that the subcellular localization of β-catenin may be mediated by GSK-3β was further supported by the results of our experiment using LiCl, which has been reported to inhibit GSK-3β activity in vitro (Klein & Melton, Reference Klein and Melton1996) and is thus expected to exert the same effect that PKC has on GSK-3β. We found that the PKC activator PMA and LiCl both stabilized β-catenin in the cytoplasm, whereas 5 μM HpPKC-I appreciably reduced β-catenin in the cytoplasm (Fig. 5 D, E).
In view of the fact that β-catenin entering the nucleus functions as a transcriptional activator of target genes (Miller et al., Reference Miller, Hocking, Brown and Moon1999), it is tempting to speculate that β-catenin in the nucleus of blastomeres on the vegetal side might lead to production of inductive factors that determine the vegetal cell fates (McClay et al., Reference McClay, Peterson, Range, Winter-Vann and Ferkowicz2000). A paired homeodomain transcription factor pmar-1 is expressed exclusively in micromeres and is known to be a direct target of the β-catenin/TCF complex (Oliveri et al., Reference Oliveri, Carrick and Davidson2002). Pmar1 in turn accelerates micromere-selective degradation of SoxB1, which is an ‘animalizing’ transcription factor counteracting β-catenin and thereby carving the patterning of cell fates along the AV axis (Oliveri et al., Reference Oliveri, Davidson and McClay2003, Angerer et al., Reference Angerer, Newman and Angerer2005). Thus, deregulation of β-catenin expression or its translocation to the nucleus was expected to result in alteration of the pattern formation along the AV axis. Indeed, when β-catenin was sequestered in the plasma membrane by overexpression of the intracellular domain of cadherin (ΔLvG-cadherin), (Logan et al., Reference Logan, Miller, Ferkowicz and McClay1999), the failure of β-catenin to enter the nucleus led to development of animalized embryos without formation of endoderm and mesoderm. Overexpression of ΔLvG-cadherin also inhibited SpWnt8 expression in the micromeres, which is essential for endomesoderm formation (Wikramanayake et al., Reference Wikramanayake, Peterson, Chen, Huang, Bince, McClay and Klein2004). In the present study using HpPKC-I, we have found a converse situation in which β-catenin entered the nuclei of all blastomeres at the 16-cell stage (Fig. 5). Although HpPKC-I did not vegetalize the embryo, the treatment led to the development of embryos with reduced aboral ectoderm (Figs. 7 and 8), implying that the nuclear β-catenin in the cells on the animal side may have a functionally different meaning from that on the vegetal side.
Considering the results so far, our conceivable model would be that PKC activity contributes to the nuclear localization of β-catenin in the blastomeres of the vegetal side, establishing the AV axis. Indeed, PKC is thought to be present in the eggs throughout the developmental stages of sea urchin (Rakow & Shen, Reference Rakow and Shen1994); the early embryos exposed to 12-O-tetradecanoyl phorbol-13-acetate (TPA, also called PMA), an activator of PKC, promotes the development of endoderm and mesoderm (Livingston & Wilt, Reference Livingston and Wilt1992). In our study, we have demonstrated that the same PKC activator increased β-catenin in the cytoplasm and enlarged the nuclear entrance of β-catenin more to the animal side, as was observed with LiCl (Fig. 5 B1, C1). In support of the idea that GSK-3β-dependent modulation of β-catenin level is largely responsible for regional specification, overexpression of GSK-3β produced animalized embryos, while the kinase-dead GSK-3β markedly vegetalized embryos (Emily-Fenouil et al., Reference Emily-Fenouil, Ghiglione, Lhomond, Lepage and Gache1998). Consistent with these findings, the major components of the Wnt pathway have also recently been discovered in sea urchin embryos, as SpWnt8 was shown to be selectively expressed in the micromeres at the 16-cell stage, and SpWnt5 in mesomeres and macromeres (Stamateris et al., Reference Stamateris, Rafiq and Ettensohn2010). However, what remains largely unresolved is how LiCl mediates vegetalization. We found that LiCl expanded the nuclear entrance of β-catenin to a more animal side (Fig 5 B), leading to vegetalization of the sea urchin embryo (Logan et al., Reference Logan, Miller, Ferkowicz and McClay1999). LiCl vegetalizes the prospective ectodermal cells, but the effect could be reversed by injection of myo-inositol (Livingston & Wilt, Reference Livingston and Wilt1995). This might be because LiCl inhibits inositol monophosphatase activity (Berridge et al., Reference Berridge, Downes and Hanley1989) and thereby reduces the InsP3 increase that normally takes place in the embryos during mesoderm induction (Maslansky et al., Reference Maslansky, Leshko and Busa1992; Ciapa & Maggio, Reference Ciapa and Maggio1993). Whether this InsP3-dependent pathway of the Li+ effect would converge with the aforementioned GSK-3β pathway is yet to be clarified.
Another important layer of control in early embryogenesis is the changes in intracellular Ca2+ levels in the blastomeres. We have reported previously a polarized distribution of L-type Ca2+ channels along the AV axis of the P. lividus blastula, and that those activities are linked to the cortical actin network (Yazaki et al., Reference Yazaki, Tosti and Dale1995). This channel was activated during M-phase of cell cycles, and displayed Ca2+ current in the mesomeres (7.4 ± 3.8 μA/cm2) and in the macromeres (2.3 ± 2.7 μA/cm2) at the 16-cell stage, but not in the micromeres (Dale et al., Reference Dale, Yazaki and Tosti1997). However, this ion channel might be irrelevant to the PKC pathway that we described. Whereas a L-type channel antagonist Nifedipine delayed cleavage and inhibited spicule formation, 5 μM HpPKC-I did not affect cell division, and the formation of spicule and gut was normal in these embryos (Fig. 6 and Table 2). Instead, the PKC pathway leading to the pattern determination appeared to involve the Ca2+ influx that takes place slightly later at the 4th cleavage through a stretch-dependent Ca2+ channels in the bulging-out region of the micromere and thereby elevates the intracellular Ca2+ levels in the micromeres (Yazaki, Reference Yazaki2001; Yazaki et al., Reference Yazaki, Abe, Santella and Koyama2004). We found that the abolishment of micromere-specific Ca2+ elevation with HpPKC-I (Table 1) and the suppression of the micromere-specific Ca2+ influx with a blocker of stretch-activated ion channel, GdCl3, both led to delayed gastrulation, but not to a delay in ingression of micromere to the PMCs (Fig. 6). Thus, PKC inhibitor blocked the micromere signals without interfering with the self-differentiation of the micromeres. One speculation on the mechanism enabling this outcome is that PKC might contribute to the formation of the gap junction-like adherence junctions, and that the micromeres effect mesoendoderm specifications through these junctions with the macromeres during the 16–60-cell stages. Indeed, the inhibitor for gap junctions 1-octanol markedly delayed gastrulation when added at the 16-cell stage (Temnopleurus hardwicki) or even at the 16- to 60-cell stages (H. pulcherrimus) (Yazaki et al., Reference Yazaki, Dale and Tosti1999). Interestingly, after the 7th cleavage, by which the fully passable gap junctions were already established (Yazaki et al., Reference Yazaki, Dale and Tosti1999), PKC inhibition no longer affected gastrulation nor morphogenesis (Figs. 6 and 7).
In this context, it is noteworthy that HpPKC-I drastically changed the subplasmalemmal actin cytoskeleton (Fig. 1 C). The observation that PKC activity may modulate actin dynamics in a subcellular-specific manner offers two intriguing implications. Firstly, the actin network subjacent the plasma membrane may modulate the functions of adherence junctions. Yazaki (Reference Yazaki1984, Reference Yazaki1991) showed that the sea urchin blastomeres had two membrane domains: the egg-originated apical membrane being lined with cortical actin meshwork and the newly formed membrane by each cleavage that is virtually devoid of actin filaments. The desmosomes in the electron micrograph start in the cell junctions at the 4-cell stage (Spiegel & Howard, Reference Spiegel and Howard1983), but they do not display a network of microfilaments emanating from the desmosomal plaques unlike in the adult epithelium. This unique feature of embryonic desmosomes might facilitate direct cell-to-cell communication. Secondly, the control of the subplasmalemmal actin meshwork by PKC might serve as a way to modulate the activity of the L-type channel and stretch-activated Ca2+ channels (Yazaki et al., Reference Yazaki, Tosti and Dale1995; Yazaki, Reference Yazaki2001) in view of recent findings that the actin cytoskeleton may affect activities of the intracellular Ca2+ channels (reviewed in Chun et al., Reference Chun, Puppo, Vasilev, Gragnaniello, Garante and Santella2010).
In this study, we have also found that inhibition of PKC interfered with gene expression in later embryonic stages (Table 3). HpPKC-I decreased the expression of aboral ectoderm specification genes, NK2.2 and Coquilette. The expression of Brain1/2/4, a regulator for midgut-specific transcriptions, was markedly delayed in agreement with the delay in gastrulation, but it was later expressed to form the gut with the same size and shape as in the control (Figs. 7 and 8). As for the skeletogenic genes, HpPKC-I repressed the skeletal matrix genes, Sm-30, Sm-37 and Sm-50. This finding exhibits a good correlation with the formation of a smaller skeleton (Table 2). Likewise, HpPKC-I suppressed Deadringer (Dri) gene (Table 3), which in sea urchin (SpDri) is first expressed in the precursor cells of PMCs but disappears altogether with PMCs ingression. Just before gastrulation, SpDri restarts its expression in the presumptive oral ectoderm (Amore et al., Reference Amore, Yavrouian, Peterson, Ransick, McClay and Davidson2003). Thus, SpDri suppression in the gastrulae pretreated with HpPKC-I is in line with our observation of delayed gastrulation. Amore et al. (Reference Amore, Yavrouian, Peterson, Ransick, McClay and Davidson2003) found that expression of SpDri in the oral ectoderm is required to impart the pattering information to the skeletogenic PMCs that is needed for oral rod (alr) formation. A chimera that consisted of normal micromeres and micromere-deleted embryo using SpDri morpholino developed into an alr-deficient pluteus. In the present study, we have observed that, as a result of PKC inhibition during the 16–60-cell stages, alr was larger than the other skeletons, br and por (Table 2). Increases in Dri expression should guarantee this preferential growth of alr probably in the cells on the animal side (Table 2). We have also found that HpPKC-I induced a late increase in Lim transcripts by 43 h, in the early pluteus (Table 3). Overexpression of HpLim1 directed all embryonic cells to differentiate into oral ectoderm (Kawasaki et al., Reference Kawasaki, Mitsunaga-Nakatsubo, Takeda, Akasaka and Shimada1999). SpLim1 was expressed in the ciliated band along the oral and aboral ectoderm border with the endoderm of the pluteus (Su et al., Reference Su, Li, Geiss, Longabaugh, Kramer and Davidson2009). We have also found that HpPKC-I increased expression of the oral ectoderm genes, Nodal, Deadringer (Dri) and Lim. Our result suggesting that Nodal gene is modulated by PKC activity is of keen interest, as Nodal is probably the earliest zygotic marker that determines OA polarity following the mitochondrial distribution gradient and the local redox state (Duboc et al., Reference Duboc, Rottinger, Besnardeau and Lepage2004; Coffman et al., Reference Coffman, McCarthy, Dickey-Sims and Robertson2004, Reference Coffman, Coluccio, Planchart and Robertson2009). To establish the OA axis, animal cells also need to receive the vegetal signals after the 4th division to express the aboral ectoderm (Kominami et al., Reference Kominami, Akagawa and Takata2006). Without the vegetal signals, the explant of the animal half develops into an epithelial ball consisting of neurogenic ectoderm, in which the OA axis fails to form due to the deficiency of aboral ectoderm expression, and the oral ectoderm marker molecules express all over the embryo (Hörstadius, Reference Hörstadius and Czihak1975; Wikramanayake et al., Reference Wikramanayake, Brandhorst and Klein1995; Yaguchi et al., Reference Yaguchi, Yaguchi and Burke2006). Interestingly, to express the aboral ectoderm in these embryos, proper expression of β-catenin and Otx are essential (Wikramanayake & Klein, Reference Wikramanayake and Klein1997; Wikramanayake et al., Reference Wikramanayake, Huang and Klein1998; Li et al., Reference Li, Wikramanayake and Klein1999), the latter of which is a transcription factor for aboral ectoderm genes (Mao et al., Reference Mao, Wikramanayake, Gan, Chuang, Summers and Klein1996). Thus, PKC seems to be implicated in the fine regulation of a variety of developmental genes at different times, and in part may well modulate cell fate and pattern formation in the other axis through Nodal and β-catenin. This situation might explain why the oral ectoderm specification was exaggerated if the embryo was treated with HpPKC-I before the 8-cell stage (Fig. 8), although the gastrulation timing and the gut morphology were not changed (Fig. 6 B, C).
In summary, we propose a model in which Ca2+influx conducted and amplified through Wnt/Ca2+ (animal side) and Wnt/β-catenin signalling pathways (vegetal side) may add to activate PKC, whose enzyme activity is further enhanced by DAG that is produced by Ca2+-dependent phospholipase C. From the first cleavage, PKC in the sea urchin embryo may function in association with the actin cytoskeletons to direct various downstream events: (i) regulation of β-catenin localization; (ii) guiding intercellular communications by constructing cell adhesive structures by the 60-cell stage; and (iii) establishment of the embryonic axes, animal–vegetal and oral–aboral axes.
Acknowledgements
We thank the technical staff at the Stazione Zoologica Anton Dohrn: Mr G. Gragnaniello who helped us with the photometrical techniques for calcium measurements, and Mr D. Caramiello who provided the sea urchin, Paracentrotus lividus. We are also grateful to Mr M. Sekifuji and Mrs N. Ito (MMBS, The University of Tokyo) for providing the sea urchin, Hemicentrotus pulcherrimus. We are indebted to Dr T. Minokawa for his recombination experiments of the animal cap and the HpPKC-I-treated micromeres, and to Dr F. Wilt and Dr K. Fukuda for their critical reading of the manuscript.


 Open access

