


Introduction
As one of the most common neurodevelopmental disorders, attention-deficit/hyperactivity disorder (ADHD) is characterized by problems of inattention, impulsivity, and hyperactivity (Battle, Reference Battle2013), which approximately affect 84.7 million individuals worldwide (Collaborators, 2020). Psychostimulants, such as methylphenidate, are widely prescribed to ameliorate ADHD symptoms, at least in improving attention span and reducing distractibility (Janssen et al., Reference Janssen, Bink, Geladé, van Mourik, Maras and Oosterlaan2016). These medications work by increasing levels of specific neurotransmitters in the brain, especially dopamine and norepinephrine. For individuals who respond poorly to stimulants, nonstimulant alternatives may be considered, including norepinephrine modulators like atomoxetine and certain antidepressants such as bupropion. (Mechler, Banaschewski, Hohmann, & Häge, Reference Mechler, Banaschewski, Hohmann and Häge2022). However, individualized management for ADHD cases in clinical settings is still hard to achieve due to the elusive neuropsychological mechanisms of first-line medications. At the same time, the factors of age and sex also complicate individual medication selection as they influence the effectiveness of medication treatment (Childress, Newcorn, & Cutler, Reference Childress, Newcorn and Cutler2019; Dafny & Yang, Reference Dafny and Yang2006; Wigal, Kollins, Childress, & Adeyi, Reference Wigal, Kollins, Childress and Adeyi2010).
From a neurobiological perspective, psychostimulants exert their therapeutic effects as indirect catecholamine agonists by blocking the dopamine transporter (DAT) and norepinephrine transporter (NET), and atomoxetine, the most commonly used nonstimulant for ADHD treatment, is a selective NET inhibitor. Through their common neuropsychological actions and partially overlapping pharmacological targets, both psychostimulants and nonstimulants may mitigate the dysfunctional inhibition and execution processing deficits seen in ADHD (Gilbert et al., Reference Gilbert, Ridel, Sallee, Zhang, Lipps and Wassermann2006). Finding similarities of mechanisms between of stimulants and nonstimulants in clinical application may enhance the understanding of their biochemistry pathways and lead to the development of targeted medications. Functional magnetic resonance imaging (fMRI) studies have found that treatment with methylphenidate and atomoxetine produces clinical improvement for ADHD via both common and divergent neurophysiologic actions in frontoparietal regions. Given that youth with ADHD may have a preferential or atypical response to either stimulants or nonstimulants based on their dissociable therapeutic targets (Elliott et al., Reference Elliott, Johnston, Husereau, Kelly, Eagles, Charach and Wells2020; Schulz et al., Reference Schulz, Fan, Bédard, Clerkin, Ivanov, Tang and Newcorn2012), it is reasonable that approximately 56% of ADHD cases may achieve clinical improvement with stimulants, while 45% of cases achieve so with non-stimulants (Mechler et al., Reference Mechler, Banaschewski, Hohmann and Häge2022; Newcorn et al., Reference Newcorn, Kratochvil, Allen, Casat, Ruff, Moore and Saylor2008).
Regarding various treatment responses among individuals, investigation of their neuropharmacological bases that may facilitate the selection of preferential responders becomes indispensable (Newcorn et al., Reference Newcorn, Kratochvil, Allen, Casat, Ruff, Moore and Saylor2008). Neurobiological studies revealed that increased dopamine (DA) concentration in the prefrontal cortex was observed in individuals taking medications, whether stimulants or nonstimulants (Koda et al., Reference Koda, Ago, Cong, Kita, Takuma and Matsuda2010). Meanwhile, neuroimaging studies have reported inconsistent neuropsychological mechanisms by which stimulants or nonstimulants act to improve ADHD symptomology. Due to localized effects at DAT sites corresponding to the action of stimulants (Ciliax et al., Reference Ciliax, Drash, Staley, Haber, Mobley, Miller and Levey1999; Schou et al., Reference Schou, Halldin, Pike, Mozley, Dobson, Innis and Hall2005), abnormalities of the anterior cingulate cortex (ACC) and supplementary motor area (SMA) regions were normalized along with improved capacity of self-regulatory control (Baldaçara, Borgio, De Lacerda, & Jackowski, Reference Baldaçara, Borgio, De Lacerda and Jackowski2008; Fan, McCandliss, Fossella, Flombaum, & Posner, Reference Fan, McCandliss, Fossella, Flombaum and Posner2005; Posner, Rothbart, Sheese, & Tang, Reference Posner, Rothbart, Sheese and Tang2007; Rubia et al., Reference Rubia, Alegria, Cubillo, Smith, Brammer and Radua2014; Stray, Ellertsen, & Stray, Reference Stray, Ellertsen and Stray2010), and the neuropharmacological effects were associated with increased activation in the brain executive control and attention networks (Farr et al., Reference Farr, Zhang, Hu, Matuskey, Abdelghany, Malison and Li2014; Shafritz, Marchione, Gore, Shaywitz, & Shaywitz, Reference Shafritz, Marchione, Gore, Shaywitz and Shaywitz2004). In contrast, nonstimulants may improve the top-down guidance of attention, thought and working memory in those with ADHD via direct effects on NET in the prefrontal cortex (Borchert et al., Reference Borchert, Rittman, Rae, Passamonti, Jones, Vatansever and Rowe2019; Bymaster et al., Reference Bymaster, Katner, Nelson, Hemrick-Luecke, Threlkeld, Heiligenstein and Perry2002; Lin & Gau, Reference Lin and Gau2015; Mechler et al., Reference Mechler, Banaschewski, Hohmann and Häge2022; Morón, Brockington, Wise, Rocha, & Hope, Reference Morón, Brockington, Wise, Rocha and Hope2002). Besides, they also have downstream effects that modulate the activation patterns of frontoparietal regions through extracellular catecholamine and indirect effects that regulate the brain connectivity patterns of the central executive network and default mode network (Borchert et al., Reference Borchert, Rittman, Rae, Passamonti, Jones, Vatansever and Rowe2019; Farr et al., Reference Farr, Zhang, Hu, Matuskey, Abdelghany, Malison and Li2014; Lin & Gau, Reference Lin and Gau2015; Schulz et al., Reference Schulz, Fan, Bédard, Clerkin, Ivanov, Tang and Newcorn2012; Shafritz et al., Reference Shafritz, Marchione, Gore, Shaywitz and Shaywitz2004). Taken together, both stimulants and nonstimulants may act on brain frontoparietal circuity to ameliorate the dysfunction of cognitive control and attention in ADHD individuals (Cubillo et al., Reference Cubillo, Smith, Barrett, Giampietro, Brammer, Simmons and Rubia2014; Fu et al., Reference Fu, Yuan, Pei, Zhang, Xu, Hu and Cao2022; Tomasi et al., Reference Tomasi, Volkow, Wang, Wang, Telang, Caparelli and Fowler2011), and the normalization effects of stimulants could also modulate the frontolimbic abnormalities (Wiguna, Guerrero, Wibisono, & Sastroasmoro, Reference Wiguna, Guerrero, Wibisono and Sastroasmoro2014).
However, it remains unknown whether dissociable therapeutic responses to medications are mediated by shared or distinct neural underpinnings, and studies that directly compare the neural bases of stimulants and nonstimulants are limited, which poses challenges to statistical power given the concern about the clinical applicability of simultaneously studying ADHD patients taking either stimulants or nonstimulants in real-world scenarios (Chou, Chia, Shang, & Gau, Reference Chou, Chia, Shang and Gau2015; Schulz et al., Reference Schulz, Fan, Bédard, Clerkin, Ivanov, Tang and Newcorn2012, Reference Schulz, Bédard, Fan, Hildebrandt, Stein, Ivanov and Newcorn2017; Smith et al., Reference Smith, Cubillo, Barrett, Giampietro, Simmons, Brammer and Rubia2013). The lack of evidence linking pharmacologic actions to neural correlates and therapeutic improvement provides limited opportunity to understand how these medications work in the brain, which is an essential step in developing targeted approaches to treatment. The approach of neuroimaging meta-analysis provides an objective method for producing higher-level evidence-based reliable findings on its neural mechanisms (Cheung & Vijayakumar, Reference Cheung and Vijayakumar2016). This allows for a judicious selection among conflicting research outcomes and deriving fresh insights from the collective body of evidence on stimulants and nonstimulants in ADHD treatment.
Herein, we hypothesize that differential and overlapping actions for stimulant and nonstimulant treatments of ADHD are derived from alterations in frontoparietal activation patterns. To investigate their normalization effects on neural mechanisms, we performed a comparative meta-analysis on task-based fMRI studies to identify altered brain activation patterns in response to stimulants and nonstimulants. Our neuroimaging findings may help to explain their similar efficacy in treating ADHD, and provide insights for individualized medication strategies and enhance treatment response by improving the precision of therapeutic targets.
Methods and materials
Literature selection and database construction
We pre-registered the research protocol on the Open Scientific Framework (https://osf.io/65vn4, registration DOI: https://doi.org/10.17605/OSF.IO/65VN4) before obtaining datasets. This preregistered systematic review and meta-analysis followed the Preferred Reporting Items for Systematic Reviews and Meta-Analyses (PRISMA) guidelines (Moher, Liberati, Tetzlaff, & Altman, Reference Moher, Liberati, Tetzlaff and Altman2009). The literature search was systematically and comprehensively conducted in the PubMed, Medline and Web of Science databases before May 8, 2022 (literature search strategy in Online Supplementary Appendix 1), and we manually added records based on the reference lists of previous meta-analyses (Rubia et al., Reference Rubia, Alegria, Cubillo, Smith, Brammer and Radua2014). Only studies with task-based fMRI methods were included, and we extracted their coordinate-based whole-brain activation patterns based on reported significant clusters (including nonsignificant results) rather than region of interest (ROI) outcomes. Medication effects were identified in contrasts between (Ma, Reference Ma2015): (1) pre- and post-treatment sessions in within-subject studies; (2) medication group and placebo/control groups in within- or between-subject studies; and (3) group (with or without medication) × time (pre- or post-treatment) interaction in mixed-design studies. Studies were excluded if they (1) were not original articles; (2) lacked ADHD samples; or (3) lacked clear medication categorizations.
For each study, we recorded each study with sample size, age range, sex ratio, medication and dose, scanner parameters (i.e. Tesla and slice thickness), statistical approach (i.e. kernel smoothing and multiple corrections), and their primary findings. Age and sex across stimulant and nonstimulant samples were compared in SPSS Statistics, version 24. Given that a neural circuit may underlie various task paradigms due to their many-to-one relationship, pooling findings across experiments in the cognitive domain might be an objective approach that facilitates the comprehensive investigation of functional responses of ADHD medications (Janiri et al., Reference Janiri, Moser, Doucet, Luber, Rasgon, Lee and Frangou2020; van den Heuvel & Sporns, Reference van den Heuvel and Sporns2019). The task and corresponding Research Domain Criteria (RDoC) construct and domain were labeled for each included fMRI study (Cuthbert, Reference Cuthbert2014; Janiri et al., Reference Janiri, Moser, Doucet, Luber, Rasgon, Lee and Frangou2020; Pan et al., Reference Pan, Wang, Qin, Li, Chen, Zhang and Gong2022) (approach to coding task experiments in Online Supplementary Appendix 2). We evaluated all included studies with a 12-point Imaging Methodology Quality Assessment Checklist for their quality and limitations to infer the importance of those findings (Shepherd, Matheson, Laurens, Carr, & Green, Reference Shepherd, Matheson, Laurens, Carr and Green2012) (for details, see Online Supplementary Appendix 3).
Voxel-based overlapping and comparative meta-analysis
We analyzed the extracted data using anisotropy effect size signed differential mapping (AES-SDM, currently ‘Seed-based d Mapping’, https://www.sdmproject.com/old/) software. AES-SDM is a statistical technique and toolbox to identify neural abnormalities on account of voxel-based neuroimaging meta-analysis (Zhao, Yang, Gong, Cao, & Liu, Reference Zhao, Yang, Gong, Cao and Liu2022). Files containing both the peak coordinates and the corresponding statistical values of brain functional activation patterns were extracted from the included studies. After creating maps of d values and brain variances, we then combined them to create meta-analytic maps during preprocessing. Effect-size statistical maps were generated utilizing a standard random-effects general linear model with an anisotropic nonnormalized Gaussian kernel. For medication-specific analysis, we employed p < 0.005 as the threshold, and only clusters over 10 voxels were counted (Radua et al., Reference Radua, Mataix-Cols, Phillips, El-Hage, Kronhaus, Cardoner and Surguladze2012; Radua & Mataix-Cols, Reference Radua and Mataix-Cols2009).
The conjunctive neuroimaging analysis in the multimodal models was performed to localize the common neuropharmacological substrates across two kinds of medications (i.e. psychostimulants and nonstimulants) (Chavanne & Robinson, Reference Chavanne and Robinson2021; Pan et al., Reference Pan, Wang, Qin, Li, Chen, Zhang and Gong2022), which represents an overlap of the significant clusters in a meta-analytic map based on the between-group contrasts of priori regions of medication-specific analysis (Radua, Romeo, Mataix-Cols, & Fusar-Poli, Reference Radua, Romeo, Mataix-Cols and Fusar-Poli2013). The AES-SDM has the capacity to adjust the raw union of probabilities to curb the false positive rate in the worst-case scenario with regards to the presence of noise in the estimation of statistics (Norman et al., Reference Norman, Carlisi, Lukito, Hart, Mataix-Cols, Radua and Rubia2016; Radua et al., Reference Radua, Romeo, Mataix-Cols and Fusar-Poli2013). In addition, we applied SDM linear models between the two medication groups to perform comparative analyses to assess their distinct responding activation patterns (Long et al., Reference Long, Pan, Ji, Qin, Chen, Zhang and Gong2022; Norman et al., Reference Norman, Carlisi, Lukito, Hart, Mataix-Cols, Radua and Rubia2016). For the above two-modality analysis, we decreased the voxel-wise threshold to a corrected stringent level of p < 0.0025 for four tails (Schulze, Schmahl, & Niedtfeld, Reference Schulze, Schmahl and Niedtfeld2016).
Large-scale network analysis
To uncover potential coactivation patterns of their shared and distinct neuropharmacological mechanisms at the brain network level, we decoded the meta-analytic results using large-scale network analysis (Li et al., Reference Li, Wang, Camilleri, Chen, Li, Stewart and Feng2020). We dropped those identified clusters to seven brain networks that represent a typical integration and segmentation of the cerebral functional parcellation, including the default mode network (DMN), dorsal attention network (DAN), central executive network (CEN), affective network (AFN), sensorimotor network (SMN), ventral attention network (VAN), and visual network (VN) (Yeo et al., Reference Yeo, Krienen, Sepulcre, Sabuncu, Lashkari, Hollinshead and Buckner2011). We calculated the relative distribution that represented the proportion of identified voxels in a given network v. all voxels of the cluster (Li et al., Reference Li, Wang, Camilleri, Chen, Li, Stewart and Feng2020).
Ancillary analyses
To explore the heterogeneity derived from demographic variables, we complemented the meta-regression analysis to examine the modulatory effects of age and sex on altered neural activations. We also conducted subgroup analyses on studies focused on the cognitive control construct and those only involving child samples to further address the heterogeneity among our included studies. We used funnel plots and Egger's test to detect potential publication biases (Egger, Davey Smith, Schneider, & Minder, Reference Egger, Davey Smith, Schneider and Minder1997; Peters, Sutton, Jones, Abrams, & Rushton, Reference Peters, Sutton, Jones, Abrams and Rushton2008). To assess the robustness of our main findings, we performed a Jackknife analysis, which consists of repeating the statistical analyses by discarding one study each time, thus demonstrating the stability of the results (Müller et al., Reference Müller, Cieslik, Laird, Fox, Radua, Mataix-Cols and Eickhoff2018).
Results
Included studies and sample characteristics
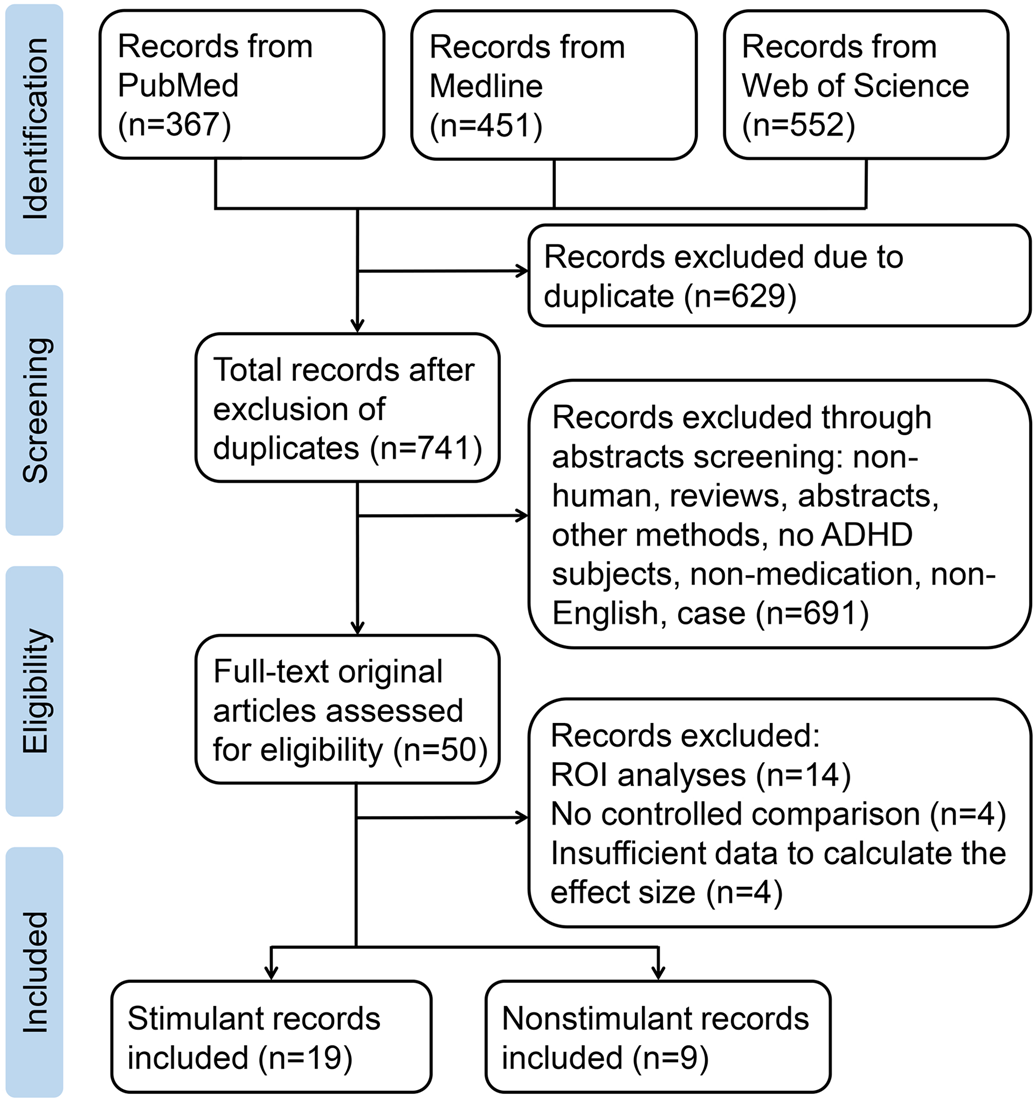
In total, 19 studies specific to stimulants and 9 studies specific to nonstimulants were included after a systematic literature search (procedure of literature search is listed in Fig. 1). These articles incorporated eligible observations from 396 cases in the medication group and 459 cases in the control group (details of the included articles are shown in Table 1). Among 28 samples in the meta-analysis, no significant difference between stimulant and nonstimulant groups was noted in the independent-samples t test in age (15.40 ± 6.52 v. 17.1937 ± 8.46, t = 0.533, p = 0.605), and the type of medication did not differ by sex (90.27% v. 83.85%, χ2 = 3.202, p = 0.074).
Flowcharts of the literature search and selection criteria. Abbreviations: ADHD, attention-deficit/hyperactivity disorder; ROI, region of interest.
Sample characteristics and summary findings of stimulant and nonstimulant studies

Abbreviations: MPH, methylphenidate; ATX, atomoxetine; FWHM, full wave at half maximum; %Male, proportion of males in the whole sample; % Medication, proportion of medicated patients; T, Tesla; RDoC, Research Domain Criteria; CON, control; PCUN, precuneus; IPL, inferior parietal lobule; OFC, orbitofrontal cortex; STG, superior temporal gyrus; IFG, inferior frontal gyrus; HIP, hippocampus; Cereb, cerebellum; SFG, superior frontal gyrus; MTG, middle temporal gyrus; PCC, posterior cingulate cortex; MOG, middle occipital gyrus; INS, insula; TPJ, temporoparietal junction; ACC, anterior cingulate cortex; MFG, middle frontal gyrus; NS, no significance; THAL, thalamus; SPL, superior parietal lobule; posG, postcentral gyrus; MCC, median cingulate gyrus; LING, lingual gyrus; SMG, supramarginal gyrus; preG, precentral gyrus; SMA, supplementary motor area; FUS, fusiform gyrus; AMYG, amygdala.
Shared and distinct neuropharmacological effects
Normalization effects of stimulant or nonstimulant administration for ADHD converged on increased activation patterns of the left SMA (peak coordinates: 0, 20, 44; Z = 1.206; cluster size = 44), and the cluster mainly overlaid the CEN (%relative distribution, %RD: 43.18%) (Table 2 and Fig. 2).
Neuropharmacological effects of stimulants and nonstimulants on neuroimaging phenotypes
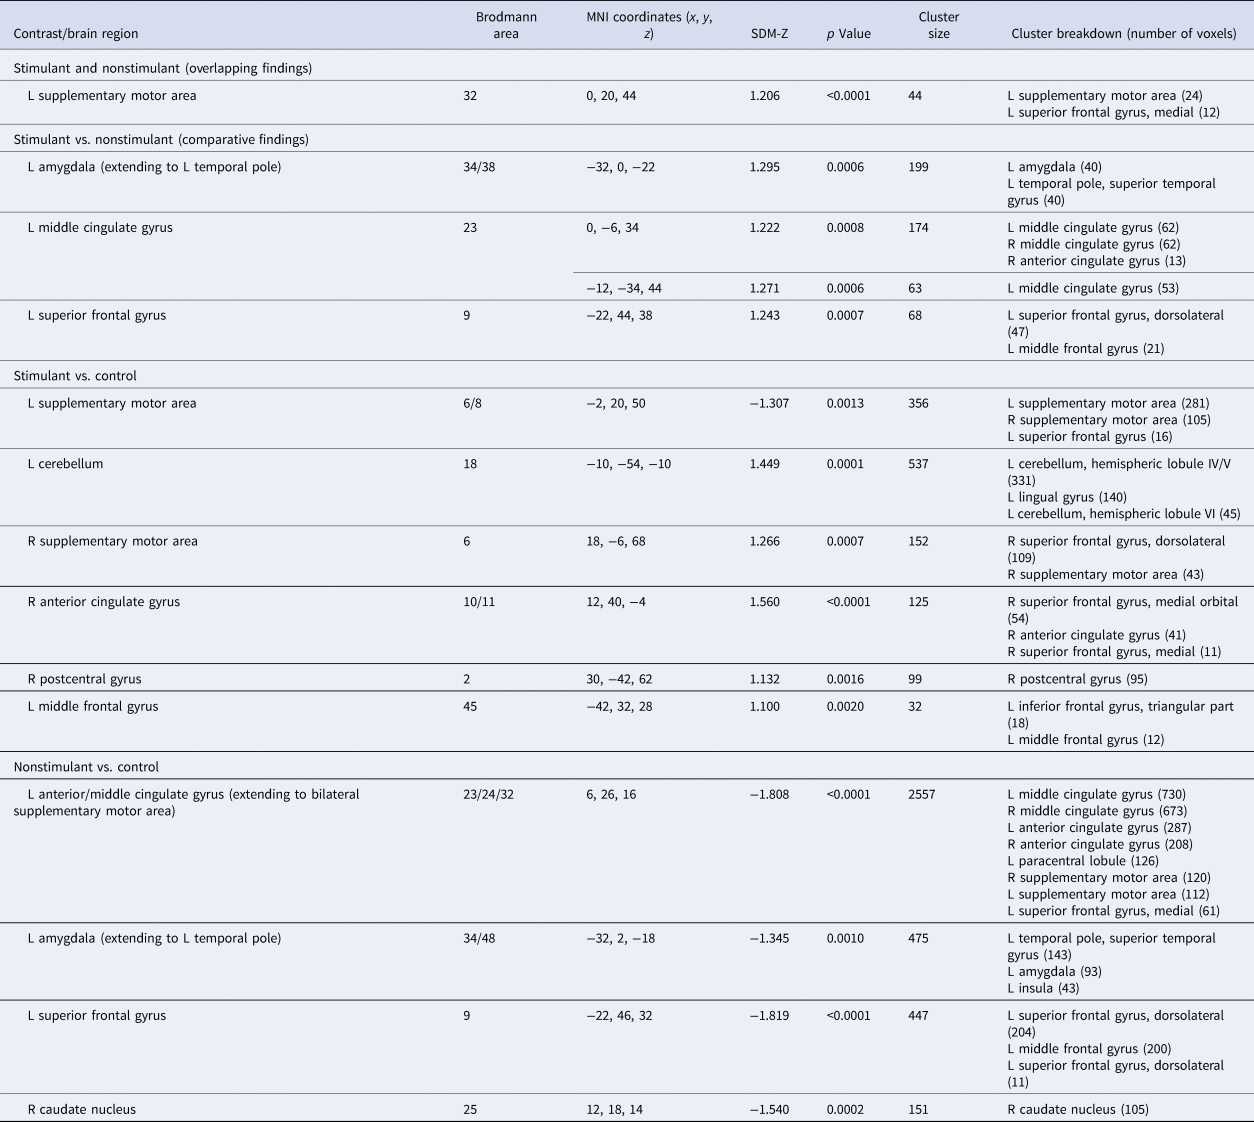
Abbreviations: L, left; R, right; MNI, Montreal Neurological Institute.
Note: Suprathreshold clusters were identified at p < 0.005 and cluster size >20 voxels. The number of cluster breakdowns (>10 voxels) was calculated by adding subclusters reported by SDM software.
Comparative findings of stimulant and nonstimulant effects for ADHD and their corresponding distribution in brain networks. Orange, the same brain region that was affected by both medications. Yellow, more increased activity by stimulants. The radar charts show the effects of the medication on the brain network. Abbreviations: L, left; R, right; SMA, supplementary motor area; AMYG, amygdala; SFG, superior frontal gyrus; MCC, middle cingulate gyrus.
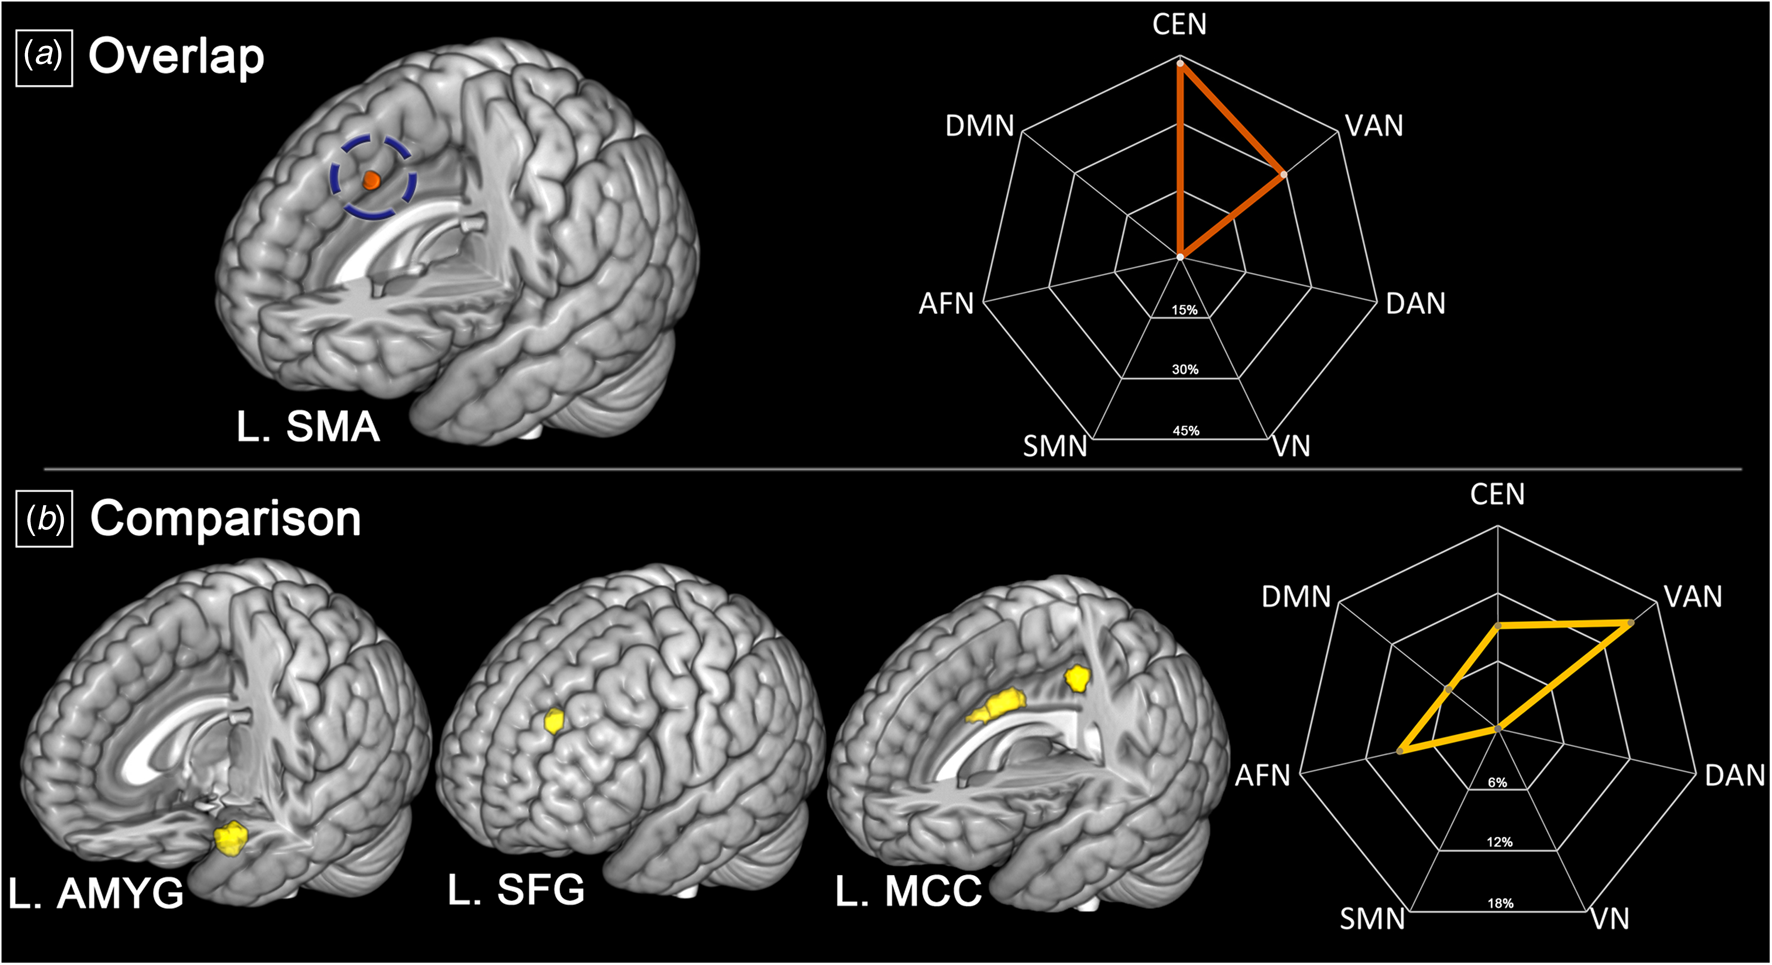
Comparative analysis showed that taking stimulants, relative to nonstimulants, increased brain activations in the left amygdala (peak coordinates: −32, 0, −22; Z = 1.295; cluster size = 199), middle cingulate gyrus (MCC, peak coordinates: 0, −6, 34 and −12, −34, 44; Z = 1.222 and 1.271; cluster size = 174 and 63, respectively), and superior frontal gyrus (SFG, peak coordinates: −22, 44, 38; Z = 1.243; cluster size = 68). These regions are distributed within the VAN (%RD: 15.08%, Table 2 and Fig. 2).
Stimulant- and nonstimulant-specific brain effects
In the medication-specific analysis compared to control groups, the treatment response of stimulants in individuals with ADHD was associated with increased brain activation patterns in the left cerebellum (peak coordinates: −10, −54, −10; Z = 1.449; cluster size = 537), right SMA (peak coordinates: 18, −6, 68; Z = 1.226; cluster size = 152), ACC (peak coordinates: 12, 40, −4; Z = 1.560; cluster size = 125), right postcentral gyrus (posG, peak coordinates: 30, −42, 62; Z = 1.132; cluster size = 99), and left middle frontal gyrus (MFG, peak coordinates: −42, 32, 28; Z = 1.100; cluster size = 32, Table 2 and Fig. 3). Meanwhile, psychostimulant treatment reduced neural responses in the left SMA (peak coordinates: −2, 20, 50; Z = −1.307; cluster size = 356) relative to control conditions.
Medication-specific effects of stimulants or nonstimulants and corresponding distribution in brain networks. Blue, brain regions affected by stimulants. Green, brain regions affected by nonstimulants. The radar charts show the effects of the medication on the brain network. Abbreviations: L, left; R, right; SMA, supplementary motor area; Cereb, cerebellum; ACC, anterior cingulate cortex; posG, postcentral gyrus; MFG, middle frontal gyrus; AMYG, amygdala; SFG, superior frontal gyrus; CAU, caudate nucleus.
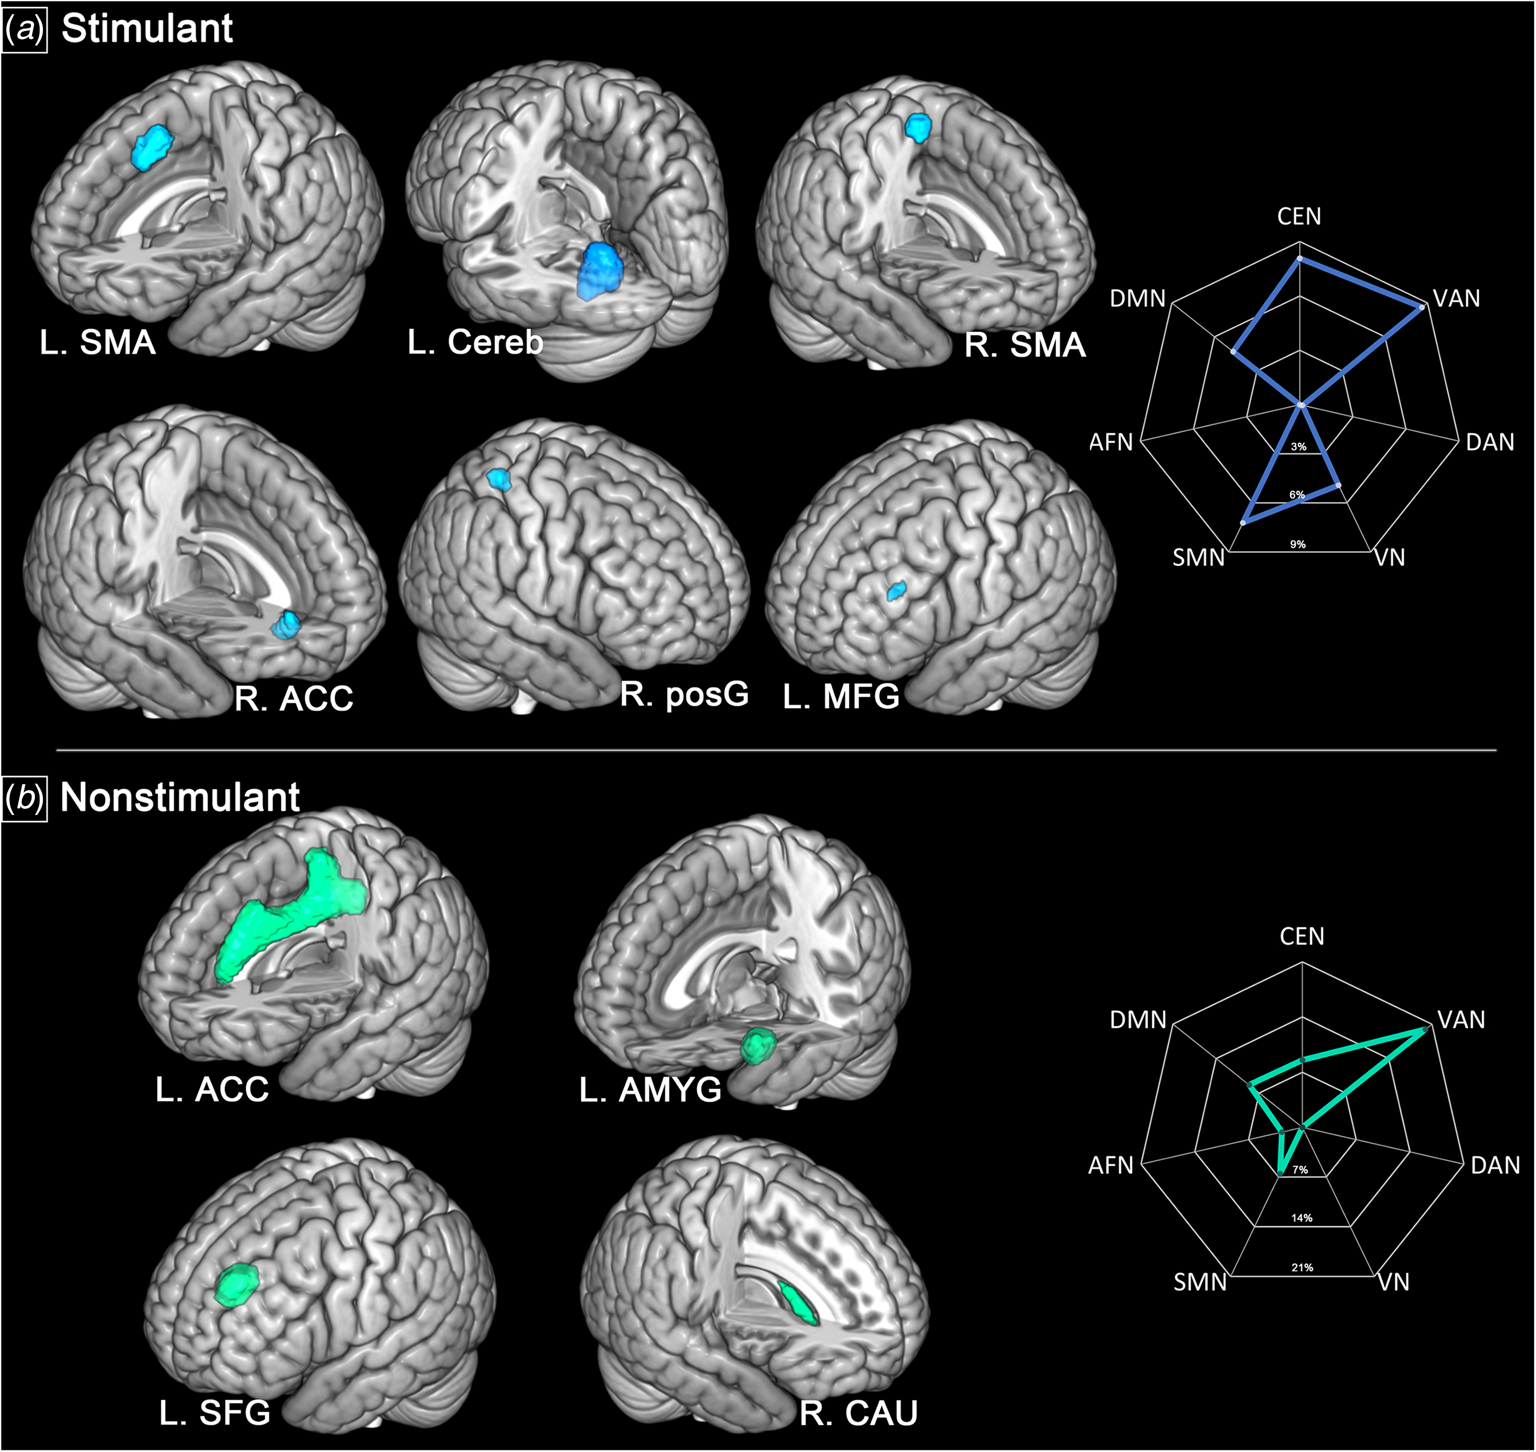
Nonstimulant treatment in ADHD youth changed neural bases by reducing activations in the left MCC (extending to bilateral SMA, peak coordinates: 6, 26, −10; Z = −1.808; cluster size = 2557), left amygdala (extending to left temporal pole, peak coordinates: −32, 2, −18; Z = −1.345; cluster size = 475), left SFG (peak coordinates: −22, 46, 32; Z = −1.819; cluster size = 447), and right caudate nucleus (CAU, peak coordinates: 12, 18, 14; Z = −1.540; cluster size = 151, Table 2 and Fig. 3).
Ancillary findings
Meta-regression analyses revealed that younger age was associated with stimulant-induced reduced activation patterns in the right SMA (peak coordinates: 16, −6, 70). In terms of neuropharmacological effects of nonstimulants, male patients with greater age modulated the reduced activation of the left amygdala (peak coordinates: −32, 2, −18 and −34, 4, −18, Online Supplementary Table S1). Egger's tests revealed no potential publication bias (p > 0.10) identified in the separate analysis of the stimulant group, and funnel plots were found to be symmetric across all clusters (Online Supplementary Table S2). Jackknife sensitivity analyses substantiated the reliability and robustness of our findings (Online Supplementary Table S3). Subgroup analyses results for studies focused on cognitive control and child samples are presented in the Online Supplementary Tables S4 and S5. In studies examining cognitive control, significant clusters of increased activation following stimulant medication were primarily located in the left lingual gyrus (peak coordinates: −12, −50, −8; Z = 1.660; cluster size = 773), while decreased activation was found in the right SMA (peak coordinates: 2, 14, 54; Z = −1.346; cluster size = 454). For nonstimulant medication, the main cluster of increased activation was identified in the right SMA (peak coordinates: 2, −12, 58; Z = 1.893; cluster size = 1801), with decreased activation in the left SFG (peak coordinates: −20, 48, 34; Z = −2.172; cluster size = 654). In the subgroup analyses of children with ADHD, stimulant medication was mainly associated with increased activation in the left cerebellum (peak coordinates: −10, −54, −6; Z = 1.627; cluster size = 984) and decreased activation in the right MCC (peak coordinates: 2, 24, 30; Z = −1.368; cluster size = 841). Nonstimulant medication was primarily associated with increased activation in the right putamen (peak coordinates: 34, −12, −8; Z = 1.094; cluster size = 194) and decreased activation in the left SFG (peak coordinates: −22, 48, 38; Z = −1.825; cluster size = 623).
Discussion
Our comparative meta-analytic analysis showed that stimulants and nonstimulants have overlapping actions on brain activation patterns of the left SMA in individuals diagnosed with ADHD. In contrast, increased activation patterns in the left amygdala, MCC and SFG were more pronounced in individuals who received stimulants compared to those who received nonstimulants, demonstrating their distinct neuropharmacological mechanisms. These shared and distinct substrates may delineate a novel therapeutic target for effective interventions and could account for different therapeutic responses to stimulants and nonstimulants among individuals with ADHD (Newcorn et al., Reference Newcorn, Kratochvil, Allen, Casat, Ruff, Moore and Saylor2008; Schulz et al., Reference Schulz, Fan, Bédard, Clerkin, Ivanov, Tang and Newcorn2012).
Common neuropharmacological effects
In line with previous studies (Schulz et al., Reference Schulz, Fan, Bédard, Clerkin, Ivanov, Tang and Newcorn2012), the overlapping mechanism between the neuropharmacological effects of stimulants and nonstimulants was mapped in the inhibited activation patterns of the left SMA that coactivated with the CEN. As part of the premotor area, SMA sends its output to the primary motor cortex to produce motor sequences (Côté, Elgbeili, Quessy, & Dancause, Reference Côté, Elgbeili, Quessy and Dancause2020; Dum & Strick, Reference Dum and Strick2002). When accounting for the psychological processing of behavioral inhibition, SMA acts as a top-down hub that integrates information from the parietal and frontal lobes (Bari & Robbins, Reference Bari and Robbins2013), corresponding to task selection and behavior control of CEN functioning. Functional hypoactivation and volumetric reduction of the SMA constitute the psychopathological model of ADHD underlying excessively impulsive actions (Cortese et al., Reference Cortese, Kelly, Chabernaud, Proal, Di Martino, Milham and Castellanos2012; Jarczok, Haase, Bluschke, Thiemann, & Bender, Reference Jarczok, Haase, Bluschke, Thiemann and Bender2019). Both stimulant and nonstimulant medications used for ADHD have been shown to decrease cortical inhibition and increase cortical facilitation in the SMA (Gilbert et al., Reference Gilbert, Ridel, Sallee, Zhang, Lipps and Wassermann2006). The normalization of SMA activation patterns may correspond directly to drug action given the massive presence in DAT and NET expression in the motor cortex, while also being associated with indirect and downstream effects modulated by responses of the prefrontal cortex (Lewis et al., Reference Lewis, Melchitzky, Sesack, Whitehead, Auh and Sampson2001; Peterson et al., Reference Peterson, Potenza, Wang, Zhu, Martin, Marsh and Yu2009; Schulz et al., Reference Schulz, Fan, Bédard, Clerkin, Ivanov, Tang and Newcorn2012; Seneca et al., Reference Seneca, Gulyás, Varrone, Schou, Airaksinen, Tauscher and Halldin2006; Tomasi et al., Reference Tomasi, Volkow, Wang, Wang, Telang, Caparelli and Fowler2011). These findings documented similarities in the neural pharmacological effects of stimulants and nonstimulants, which refined the understanding of brain alterations from medication effects that lead to the shared efficacy of both classes of ADHD medications.
Distinct neural responses in ADHD
The treatment responses to stimulants and nonstimulants showed inverse activation patterns in the amygdala, MCC and SFG for ADHD individuals, and the distinct patterns mainly overlaid brain networks of the VAN and AFN. The AFN (also called the limbic system) has long been regarded as having an integral role in emotion-based decision-making, reward and motivation (LeDoux, Reference LeDoux2000; Phelps, Reference Phelps2006). As part of the AFN, aberrant activation patterns of the amygdala in ADHD individuals suggest related deficits in emotional processing, control of impulsivity and reward sensitivity (Gallagher & Chiba, Reference Gallagher and Chiba1996; van Hulst et al., Reference van Hulst, de Zeeuw, Bos, Rijks, Neggers and Durston2017). In treatment, stimulants act on the amygdala, which is distributed with monoamine transporters (i.e. DAT and NET inhabitation) and strengthen the current of cortico-amygdala synapses, which enhance emotional memory retention and learning performance (Smith & Porrino, Reference Smith and Porrino2008; Tye et al., Reference Tye, Tye, Cone, Hekkelman, Janak and Bonci2010). Both stimulants and nonstimulants are posited to be less effective on dysfunction in the bottom-up circuits encompassing the amygdala and ventral striatum (Lenzi, Cortese, Harris, & Masi, Reference Lenzi, Cortese, Harris and Masi2018), and this may reduce the scope of presumed medication action. As it is embedded in the VAN, the MCC is considered a key area of emotion and cognition processing and subserves bottom-up attention diversion. Underactivated MCC in ADHD individuals may be construed as connected with the core symptom of inattention (Emond, Joyal, & Poissant, Reference Emond, Joyal and Poissant2009; Rolls, Reference Rolls2019; Vossel, Geng, & Fink, Reference Vossel, Geng and Fink2014). For ADHD treatment responses, the normalization effects of stimulants aligning with the underactivity of MCC echoes previous evidence that stimulants may improve cingulate dysfunction through bidirectional remediation by dopaminergic modulation, and the DA system controlled by cholinergic receptors in the MCC is a likely target (Murray et al., Reference Murray, Knolle, Ersche, Craig, Abbott, Shabbir and Robbins2019; Vogt, Reference Vogt2019). Regarding the differential findings in the SFG, which has been suggested to be associated with inattention and hyperactivity (Briggs et al., Reference Briggs, Khan, Chakraborty, Abraham, Anderson, Karas and Sughrue2020; King, Floren, Kharas, Thomas, & Dafny, Reference King, Floren, Kharas, Thomas and Dafny2019), stimulants and nonstimulants act to alter the abnormal neural responses in ADHD patients through α2-adrenergic and dopamine D1 receptors to improve cognitive functions through the reactivity of the prefrontal cortex based on its high sensitivity to catecholamines (Gamo, Wang, & Arnsten, Reference Gamo, Wang and Arnsten2010; Schulz et al., Reference Schulz, Fan, Bédard, Clerkin, Ivanov, Tang and Newcorn2012). However, different neural responses toward the two medications have observed, and we argue that these responses might be induced by both normalization and side effects. As per previous evidence, we speculate that reduced activation patterns in the above regions may be therapeutic effects that inhibit excessive neuropsychological functioning, while the hyperactivated responses of these regions may indicate side effects, which could be a consequence of different dopaminergic receptors corresponding to different medication actions.
Medication-specific neural mechanisms
Our study reveals that stimulants may upregulate neuroimaging activation patterns in the left cerebellum compared to controls given their indirect phosphorylation of the glutamate receptor through modulating the release of norepinephrine (Arnsten & Dudley, Reference Arnsten and Dudley2005; Cutando et al., Reference Cutando, Puighermanal, Castell, Tarot, Bertaso, Bonnavion and Valjent2021). In addition, the altered activation of the cerebellum incident to stimulant use may ameliorate problems of dysfunctional control and reward processes based on cerebro-cerebellar interactions (Abdallah, Farrugia, Chirokoff, & Chanraud, Reference Abdallah, Farrugia, Chirokoff and Chanraud2020). In the ADHD group with nonstimulants, activation in the right caudate was inhibited, unlike stimulant action in the same region (Rubia et al., Reference Rubia, Alegria, Cubillo, Smith, Brammer and Radua2014). The disparity in their responses indicates the presence of distinct pathways in the brain for stimulants and nonstimulants. Nonstimulants act on glutaminergic signaling, which affects the dopaminergic neurons in the caudate nucleus (Easton, Marshall, Fone, & Marsden, Reference Easton, Marshall, Fone and Marsden2007; King et al., Reference King, Floren, Kharas, Thomas and Dafny2019), and may in turn, improve deficits in response inhibition and tendencies for impulsive choices in ADHD individuals (Szekely, Sudre, Sharp, Leibenluft, & Shaw, Reference Szekely, Sudre, Sharp, Leibenluft and Shaw2017). The neuropharmacological processes behind them can help choose medications based on the key symptoms that different individuals experience, providing guidance for individualized treatment and ultimately improving outcomes. Additionally, examining the pharmacological mechanisms of stimulants and non-stimulants may reveal new treatment targets that could lead to the development of state-of-the-art ADHD medications.
Modulatory effects of age and sex
Age-related modulatory effects on neuropharmacological alterations were delineated, as youth seen with stimulants showed more reduced neural responses in the right SMA relative to adults, implying they may have a higher sensitivity to stimulants to improve excessive involuntary movements (Carucci et al., Reference Carucci, Balia, Gagliano, Lampis, Buitelaar, Danckaerts and Zuddas2021; Karl et al., Reference Karl, Schaefer, Malta, Dörfel, Rohleder and Werner2006). Longitudinal studies on ADHD patients reported age-dependent amelioration of symptoms of hyperactivity, and those adults may develop hypo-responsiveness or resistance to psychostimulants induced by specified developmental trajectories (Biederman, Mick, & Faraone, Reference Biederman, Mick and Faraone2000; Rubia et al., Reference Rubia, Overmeyer, Taylor, Brammer, Williams, Simmons and Bullmore2000; Santosh & Taylor, Reference Santosh and Taylor2000), suggesting that reduced activations of the right SMA play a role in compensatory mechanisms in ADHD adults and that they may not need the intervention of stimulants to improve hyperactivity deficits (Hart, Radua, Nakao, Mataix-Cols, & Rubia, Reference Hart, Radua, Nakao, Mataix-Cols and Rubia2013).
A negative correlation between age and activation alterations was found in the left amygdala in nonstimulant cases, indicating that nonstimulants may have better inhibitory effects on abnormal affective processes in ADHD adults relative to youth (Aggleton, Reference Aggleton1993; Phelps & LeDoux, Reference Phelps and LeDoux2005; Winstanley, Theobald, Cardinal, & Robbins, Reference Winstanley, Theobald, Cardinal and Robbins2004). Emotional dysregulation is more prevalent in ADHD adults relative to adolescents (Shaw, Stringaris, Nigg, & Leibenluft, Reference Shaw, Stringaris, Nigg and Leibenluft2014), and they may have better treatment responses to nonstimulants in refining affective stability as informed by our neuroimaging findings in the amygdala (Wang, Zuo, Xu, Hao, & Zhang, Reference Wang, Zuo, Xu, Hao and Zhang2021). Similarly, the brain mechanisms of nonstimulants also presented a sex-related difference in the left amygdala wherein there were greater reductions in activation patterns in males than females, which may suggest better therapeutic effects on emotion regulation in ADHD males with nonstimulant use.
Subgroup analyses of cognitive control construct and child samples
To compare findings of subgroup analysis on experiments in cognitive control and pooling findings, we revealed consistent patterns of inhibited neural responses in the right SMA triggered by stimulants and these in the left SFG affected by nonstimulants, even when pooling findings incorporating attention, working memory and reward constructs. Notably, stimulant-induced neuropharmacological effects in the left lingual gyrus were observed exclusively in response to the experiments of cognitive control. The lingual gyrus, a component of the visual cortex underlying word identification and recognition, has also been implicated in irritability and impulsive aggression in subclinical samples (Besteher et al., Reference Besteher, Squarcina, Spalthoff, Bellani, Gaser, Brambilla and Nenadic2017; Mechelli, Humphreys, Mayall, Olson, & Price, Reference Mechelli, Humphreys, Mayall, Olson and Price2000). Thus, medication responses in the lingual gyrus may reflect symptom amelioration of disruptive behavior within the domain of cognitive control. Subgroup analysis on children with ADHD yielded consistent findings in the increased activation in the left cerebellum induced by stimulants and the reduced activation in the left SFG induced by nonstimulant compared to our pooling findings. This consistency indicates that these neuropharmacological bases may be inherent, regardless of their developmental trajectories. However, medication response mechanisms in the reward system, particularly in the right MCC and putamen, only emerged in child samples, suggesting that underdeveloped corticostriatal circuits in children might serve as a potential target for medication treatment (Buckholtz & Meyer-Lindenberg, Reference Buckholtz and Meyer-Lindenberg2012).
Limitations
Even though the results of the sensitivity analysis substantiated the reliability of our meta-analytical findings, our study still has limitations that need to be considered. First, the source of heterogeneity was still noticeable, as most included studies evaluated cognitive control function, while others measured working memory and attention problems. Further investigations may subclassify medication effects on homogenous psychological constructs when more studies emerge. Considering the inclusion of both child and adult samples in our study, it is inevitable to confront the considerable heterogeneity in age within study population when interpreting our findings. Second, various protocol designs of the included studies with both randomized controlled and cross-sectional trials may also contribute to the heterogeneity (Ma, Reference Ma2015). Third, we failed to differentiate the short- and long-term effects of psychostimulants and nonstimulants on brain activity due to the limited number of corresponding studies. Fourth, the neuropharmacological pathways of nonstimulants are notably diverse, yet they all converge on targeting the norepinephrine transporter in some capacity for the treatment of ADHD (Newcorn, Krone, & Dittmann, Reference Newcorn, Krone and Dittmann2022). Lastly, we were unable to obtain clinical ratings to speculate treatment responses of ADHD medications based on reanalyzed neuroimaging datasets, and whether these neuropharmacological effects in ADHD have disorder or diagnostic specificity remains unclear.
Conclusion
This study, to the best of our knowledge, is the first to focus on the overlapping and comparative neuropharmacological mechanisms of stimulants and nonstimulants for ADHD in a meta-analytical approach. The convergence of psychostimulant and nonstimulant effects on the left SMA may delineate a novel therapeutic target for effective interventions for ADHD, and these distinct neural substrates could account for individual differences in therapeutic responses. Our neuroimaging findings may have implications for individualized medication strategies and enhance treatment response by precisely matching therapeutic targets.
Supplementary material
The supplementary material for this article can be found at https://doi.org/10.1017/S003329172400285X
Acknowledgements
We acknowledge and appreciate the efforts of all the authors of the included studies who responded to our requests for further information not included in published manuscripts.
Author contributions
NP and YC designed the study. TM and YL collected the data from previous studies. NP, TM, and YL performed the data analysis and wrote the paper. SZ helped with data processing. SH, AS, HC, YC, and QG revised the paper. All authors contributed to the results' interpretation and discussion and approved the final manuscript.
Funding statement
This study was supported by the National Natural Science Foundation of China (823B2041, 81801358, 81621003, 81820108018 and 82027808) to NP, YC, and QG. The Key research and development project of science and technology, department of Sichuan Province (2022YFS0179) and the Key research and development project of science and technology, department of Chengdu (2022YF0501507SN) to YC also provided support to this study. The authors have declared that no conflict of interest exists.
Data availability statement
The atlas files of the overlapping and distinct mechanisms of psychostimulants and nonstimulants are available at https://osf.io/2wghs/files/, and other data that support the findings of the present study are available from the corresponding author through reasonable request.


 Open access