

Articulating Change at Different Timescales and Levels of Analysis
Genetic social psychology stands in a privileged position to render intelligible both continuity and change in the process of conflict transformation in post-conflict settings and beyond. Observing change in various timescales can render intelligible mechanisms of microgenetic, ontogenetic and sociogenetic change (Duveen & Lloyd, Reference Duveen and Lloyd1990) and possible openings for change. However, it can also identify regressive forces that undermine this potential for change.
Given the complexity of articulating change in these various timescales from a methodological point of view – what Moscovici called ‘methodological polytheism’ – social psychological imagination is necessary. Under the broad umbrella of mixed methodologies, more specific methods look particularly promising. Autobiographical and diary methods (Zittoun & Gillespie, Reference Zittoun, Gillespie, Abbey and Surgan2017) can help interweave significant social interactions, social relations and social influences in a person’s life trajectory with particular turning points in one’s lifespan development whilst at the same time not losing sight of significant historical and technological developments as they unfold in historical time. The analysis of autobiographical narratives has been recently proposed in the context of the Vygotskian tradition as a powerful method for understanding the subjectivity of research subjects and the articulation of microgenetic and ontogenetic processes in their cultural historical context (Ferreira et al., Reference Ferreira, Aléssio and Pedrosa2023; Rego, Reference Rego2022). What one participant selects to narrate as an important point in a life trajectory is important not only for one’s narrative construction of an identity but also because important social relationships in the ontogenetic construction of consciousness and experiences can be located without etic presuppositions. From the perspective of genetic social psychology, we are also interested in how participants change positions in the representational field, as well as instances of significant turning points in one’s life trajectory. In what follows I expose personal details of my own life trajectory to make visible the experience of an internally displaced person from the events of 1974 and maximise the potential of extraction of theoretical insights given that the narration is at the same time an expression of what the theoretical perspective I am developing allows me to make visible. Of course, collecting multiple autobiographical narratives from various research participants can also allow generalisations beyond single-case studies. Such accounts can also be combined with quantitative approaches where meanings behind numbers and correlations can be made transparent. Recently Fonseca and Jovchelovitch (Reference Fonseca and Jovchelovitch2024) applied some of our theoretical ideas in the study of the microgenesis of social representations relating to the reconciliation process in Colombia. The method they used is very promising, since it is a longitudinal qualitative analysis of change with observations, interviews and diaries before, during and after an 11-day visit programme of urban university students to rural communities of ex-guerillas.
Quantitative methods can also help to disentangle age from period and cohort effects provided that there are available datasets, like the European Social Survey (ESS) or World Values Survey (WVS), that afford such analysis. Ethnographic data from the family and educational context that focus on social interactions between peers and students with educators can shed light on the social construction of relations of co-operation and constraint around various objects of representation. Researchers sensitive to the need for interdisciplinary research have recently added important methodological innovations in similar explorations with the use of big data from the internet. For example, Patricia Greenfield used Google’s ngram viewer of Google Books (Michel et al., Reference Michel, Shen, Aiden, Veres, Gray and Aiden2011) (https://books.google.com/ngrams/) to locate value change in China over the last 40 years (Zeng & Greenfield, Reference Zeng and Greenfield2015). If, for example, one runs a comparison of the words ‘co-operation’ and ‘competition’ in the English language edition of books until 2019, it is interesting to note that competition was discussed more than co-operation in the period from 1800 to 1938. With the beginning of the Second World War, co-operation overtakes competition, but then after 1953, with the exception of the period 1968–1979, competition retakes the lead (Figure 5.1).
Comparison of frequency of words ‘co-operation’ and ‘competition’ in the English edition of books until 2019 in ngram viewer.

Figure 5.1 Long description
The x-axis represents the years, spanning from 1800 to 2000, while the y-axis quantifies frequency percentages ranging from 0.0000 to 0.0065% in increments of 0.005 units. Competition curve passes through the following points (1800, 0.0012), (1940, 0.0058), (1970, 0.0045), and (2000, 0.006). The cooperation curve passes through the following points (1800, 0.0001), (1940, 0.0060), (1960, 0.0045), and (2020, 0.0025). Values are estimated.
Findings like the one above suggest there are changing trends of representations and significant structures that could be relating to long-term socio-demographic changes but also more abrupt changes that depend on significant historical turning points (war, fall of Berlin Wall, global financial crisis, COVID-19 pandemic, etc.) that capture the attention of the academic community and writers and make some themes more important for discussion and others less so in specific periods.
Disentangling and articulating changes relating to economic and sociopolitical changes in different timescales and different levels of analysis (Doise, Reference Doise1986; Doise, Reference Doise and Valentim2011; Doise & Valentim, Reference Doise, Valentim and Wright2015) is a real methodological challenge. As we have seen in the previous chapter, value changes that follow predictable patterns given certain socio-demographic changes in each sociocultural context can lead to the emergence of new social representations of the Cyprus problem and its solution. How are other levels of explanation in Doise and Valentim’s (Reference Doise, Valentim and Wright2015) recent theorisation of six levels of analysis articulated in this example?
How does one move from the intersocietal level to the ideological/social representational level, the intergroup/positional, the interpersonal and the intrapersonal down to the neurological level? In the case of Cyprus and the Greek Cypriot (GC) community, we have seen in the previous chapter that there is a portion of the younger GCs who have internalised (intrapsychological level) more individualist or personal values related with the values of stimulation, hedonism and power while they feel alienated not only from the other community but also from political processes and decision-making in their own community. Due to their self-centred, egocentric and apolitical stance, they either fall prey to an uncritical internalisation of the hegemonic representation of the Cyprus issue or take a Machiavellian and cynical stance on the existence of multiple interpretations of the Cyprus issue that could also be described as a relativist stance. With colleagues from Israel we have recently discovered that in Israel, Palestine and the two communities of Cyprus the youth is characteristic for showing lower levels of hope for a settlement of their conflicts (Hasler et al., Reference Hasler, Leshem, Hasson, Landau, Krayem, Blatansky, Cakal, Psaltis and Halperin2023). The mechanism behind this finding appeared to be that older people have a longer perspective on the conflict and its fluctuations whilst younger people have a more static perception of the conflict, which resonates with our suggestion about the role of historical consciousness in Table 2.1.
The time-limited view extends to interpersonal relationships among the youth in Cyprus, who tend to be limited to relationships within the limits and ethical horizons of their own communal group (intragroup level), forming a stance of indifference towards the other community or even avoidance of crossing to the other side of Cyprus, having lower intergroup contact or friendships and distancing themselves from the idea of renewed cohabitation with the other group (intergroup level). This individualist turn (which, in any case, does not represent the majority of the youth) was favoured by neo-liberal policies in the government amid serious financial scandals and geopolitical influences from Russia, whose own national interests were not served by a Cyprus settlement (Drousiotis, Reference Drousiotis2022), despite the best efforts of the EU to support the reunification of Cyprus (intersocietal level). It is interesting to note how Russia uses financial leverage through its oligarchs and the Christian Orthodoxy as the prevailing religion in Cyprus, as well as its connections with Mount Athos in Greece, to expand its soft power over Cypriot laypeople and politics. Religion, traditional values (see Stronski, Reference Stronski2021; Varnava, Reference Varnava2023), magical thinking full of miracles and prophecies about the demise of Turkey and support of extreme right-wing parties in countries of the EU all become a vehicle of Russian geopolitical strategy as they contribute to the formation of a consciousness that undermines co-operative significant structures in Cyprus.
In this book I do not touch on the neurological level of analysis added more recently by Doise and Valentim (Reference Doise, Valentim and Wright2015). I would argue, however, that if one wanted to understand the complexity of intergroup relations at the neurological level, the aim would be to understand how the brain forms functional networks to accommodate the articulation of these levels of analysis in the process of social represention of various forms of significant structures of subject–object–other, like the three basic ones proposed in Chapter 1 (submission, domination, co-operation) that weave together emotions, beliefs and values, extending in time through forms of historical consciousness.
To return to our proposal of the three significant structures (submission, domination, co-operation) of Table 2.1, the struggle for the reunification of Cyprus in the recent period after the opening of the checkpoints has to compete not only with this newly emerging dominance-egocentric structure but also with the older traditional-submissive one premised on the uncritical internalisation of a reified and polarised master narrative of one-sided collective victimisation narratives. This latter one curtails the agency that young people might otherwise cultivate if they were helped to hone their critical skills instead of internalising myths and dogmas of the state and church.
Increased intergroup contact with the other community is key in Cyprus, since its value is now proven empirically, but it does not touch the lives of the majority in both communities. If the youth were to massively and systematically come in contact with the other community, Cyprus could be a different place. They would be emancipated to make meaning of the social world in the past–present–future nexus in a transformative and genetic historical consciousness through a co-operative decentring of their master narratives. As things currently stand in public education, the nonsense of conflict gains meaning by situating oneself in a community whose collective trauma is anchored in a common narrative of trauma (Bekerman & Zembylas, Reference Bekerman, Zembylas, Parkes, Clark, Elmersjö and Vinterek2017) as well as a feeling of perceived collective victimisation (Psaltis et al., Reference Psaltis, Franc, Smeekes, Ioannou, Žeželj, Psaltis, Carretero and Čehajić-Clancy2017; Bar-Tal et al., Reference Bar-Tal, Chernyak-Hai, Schori and Gundar2009) that leads to the formation of a fragile and fearful collective ego that is backward instead of forward looking.
The direction of potential positive change is facilitated in Cyprus by intergovernmental organisations like the EU, the Council of Europe (CoE) and the UN. In the case of the GC community, a major driver forward is the opening of the checkpoints in 2003 and the joining of the EU in 2004, which put in motion a number of changes relating to the institutionalisation of diversity management towards more inclusion in both the legal and educational landscapes of Cyprus relating to alterity (gender equality, immigration, ethnic minorities, Roma, LGBTQ+). Methodologically, rendering intelligible developments at lower levels of analysis can be complemented by institutional analysis and collection of statistical information relating to alterity.
For example, the opening of the checkpoints created millions of opportunities for contact and trade via the ‘Green Line Regulation’.Footnote 1 This EU regulation states that the whole of Cyprus is part of the European Union; however, in the northern part of the island, where the government of the Republic of Cyprus does not exercise effective control, EU legislation is suspended in line with Protocol 10 to the 2003 Act of Accession. The Green line is not considered by the EU as an external border of the EU. Council Regulation 866/2004 (‘Green Line Regulation’) sets out the terms under which persons and goods can cross this line from the non-government-controlled areas into the government-controlled areas. The non-government-controlled areas are outside the EU’s customs and fiscal territory, but this does not affect the personal rights of TCs as EU citizens.
Despite the trade part of the regulation not working optimally due to ‘psychological barriers’ (Ersözer, Reference Ersözer2019) relating to non-recognition of the north, each year millions of people are crossing, thus creating opportunities for intergroup contact between the two communities. Figure 5.2 suggests that an increasing number of crossings, especially after the COVID-19–period closings, is taking place. This is partly due to the recent depreciation of the Turkish lira used in the north, but it is also indicative of a decreasing stigmatisation of crossings in the eyes of GC public despite efforts by nationalist parties and economic lobby groups to close the checkpoints. How one goes from opportunities for contact into the study of the impact of contacts on individual prejudice levels, trust, acceptance of Bizonal Bicommunal Federation or renewed cohabitation is an issue of empirical examination that we will tackle later in this chapter.
Number of crossings through the checkpoints in the period 2003–2022 (according to data published by authorities on both sides of the divide).

Figure 5.2 Long description
The x-axis spans from 2003 to 2022 in increments of 1 unit. The y-axis quantifies crossings, ranging from 0 to 6,000,000 in increments of 1,000,000 units. The curve for number of crossings passes through the following points (2003, 2,500,000), (2007, 1,700,000), (2019, 3,000,000), (2020, 500,000), and (2022, 5,000,000). Values are estimated.
Promising change is not without its own challenges, however. Recent migration flows to Cyprus due to the war in Syria and other international conflicts brought to Cyprus a record number of immigrants and asylum seekers, which led to a new rising tide of xenophobic attitudes in 2022 (UNHCR-Cyprus, 2023), which followed the previous one of the period 2010–2012, largely as the direct outcome of a governmental policy of securitisation by the Anastasiades government. On the positive side of things there is also regular public discussion about issues of gender equality and discrimination, disability and LGBTQ+ rights in both communities of Cyprus, which shows that change that strengthens self-transcendence values can be supported by various aligned groups acting in solidarity.
Financial downturns also indirectly relate to attitudes towards alterity, as they create a fertile ground for xenophobic media to play on feelings of realistic threat (well-being or financial status of the community). Cyprus was one of the main victims of the financial crisis of 2012–2013 that also deepened some social class divisions as it underwent austerity measures, spending cuts and limitations on the renewal of the public service personnel. The 2012–2013 Cypriot financial crisis involved the exposure of Cypriot banks to overleveraged local property companies, the Greek government debt crisis, the downgrading of the Cypriot government’s bond credit rating to junk status by international credit rating agencies, the consequential inability to refund its state expenses from the international markets and the reluctance of the government to restructure the troubled Cypriot financial sector.
On 25 March 2013, a €10 billion international bailout by the Eurogroup, European Commission (EC), European Central Bank (ECB) and International Monetary Fund (IMF) was announced in return for Cyprus agreeing to close the country’s second-largest bank, the Cyprus Popular Bank (also known as Laiki Bank), imposing a one-time bank deposit levy on all uninsured deposits there, and seizing around 48% of uninsured deposits in the Bank of Cyprus (the island’s largest commercial bank).
In regards to the pursuit of the values of a co-operative society, it is clear that one of the main obstacles is Cyprus is the unresolved Cyprus issue that is draining the resources of people for more trusting approaches to the ‘others’, as one of the usual mottos of various bodies and political actors is that ‘the Cyprus issue is our priority’, and other issues such as violations of human rights and discrimination are not actively addressed with the same sensitivity in the public sphere or are seen through the Cyprus issue perspective. A good example of this is the issue of immigration where, after the failure of Crans Montana, a securitisation discourse was promoted by the GC authorities with claims of Turkey instrumentalising immigration flows to the south of Cyprus through the checkpoints, leading to pushbacks on both land and sea and a very strict asylum regime (Trimikliniotis, Reference Trimikliniotis2019).
The almost 50-year geographic separation also allowed corruption in the two communities to run rampant as financial interests from the separation of Cyprus became more vocal in both communities in the past few years, mainly around the real estate sector in both communities and, in the GC community, also around the Golden Passport scheme, tourism, supermarkets, petrol stations and pharmaceuticals. These find their financial interests challenged by crossings made possible after 2003 and the possibility of reunification of Cyprus on the basis of BBF.
On the whole, despite the fact that Cyprus has adopted a significant number of laws in most policy areas that aim at creating a more co-operative society, especially after its joining the EU in 2004, there is a discrepancy between the existence of clear and positive legal framework and its implementation on issues of discrimination. Cyprus has ratified nearly all of the core international human rights treaties. Equality and non-discrimination are extensively regulated in Cyprus, and legislation has been in place for several years, but Cyprus suffers severely on the implementation part. When it comes to the functioning of the judicial system, there are some critical structural weaknesses that need amendment to tackle corruption more efficiently. The recently published Rule of Law report for 2023 is very telling: its recommendations point to some important deficits around issues of tackling corruption and transparency of financing relating to political parties and of media ownership.Footnote 2 Increasing individualism, the financial crisis and the recent scandals around the golden passport scheme have shaken the public trust in all institutions in Cyprus (except universities) as well as what is called generalised trust according to a recent analysis of Round 10 (2020) data of the European Values Survey (ESS) in the GC community.
Articulating Microgenesis, Ontogenesis and Sociogenesis
Articulating microgenesis, ontogenesis and sociogenesis involves understanding the interplay among these processes and recognising their complementary nature in shaping human development. Each of these processes provides a unique perspective on development, and they are interconnected in various ways. It is possible to suggest the following ways of articulating them:
1. Multi-layered perspective: Recognise that human development is a complex and multi-layered process that incorporates moment-to-moment changes (microgenesis), long-term individual development (ontogenesis) and the influence of social and cultural factors in historical time (sociogenesis) at various levels of analysis (Doise & Valentim, Reference Doise, Valentim and Wright2015). Adopting a comprehensive approach that acknowledges the interactions between these processes and articulation of the various levels of analysis can provide a more complex but accurate and nuanced understanding of human development.
2. Integration of timescales: Understand that these processes operate on different timescales, with microgenesis focusing on immediate changes, ontogenesis on life-long development and sociogenesis on historical and cultural changes. By integrating these timescales we can render intelligible the influence of short-term events on long-term development and how social and cultural factors impact individual growth over time.
3. Interdisciplinary approach: Since these processes involve various aspects of human development, it is essential to adopt an interdisciplinary approach that draws on insights and methodology from psychology, sociology, history, politics, anthropology and other related fields. This enables researchers to explore the interconnections between individual, social and cultural factors and understand how they jointly contribute to human development.
4. Contextualising development: Acknowledge that individual development is shaped by the specific social, cultural and historical contexts in which it occurs. By examining the sociogenesis of psychological phenomena, researchers can better understand how individual development is influenced by broader social and cultural factors, and how these factors change over time.
5. Mutual influence: Recognise that microgenesis, ontogenesis and sociogenesis do not occur in isolation but are mutually influential processes. For example, moment-to-moment experiences (microgenesis) can shape long-term development (ontogenesis) and are influenced by historical changes (sociogenesis). Sociogenetic changes can also lead to the setting up of new institutions and infrastructures that support new significant structures (e.g. the Home for Co-operation in Cyprus). Understanding the dynamic interactions between these processes in both directions of change (Psaltis, Reference Psaltis, Psaltis, Gillespie and Perret-Clermont2015) can help researchers to develop more comprehensive models of human development.
To make this articulation possible in the case of the study of these processes in Cyprus, we need to apply a mixed-methods approach that would entail: (1) the collection of representative samples from both communities of Cyprus in different periods of time and of people covering a wide age range; (2) qualitative data from focus groups discussions, interviews collection and analysis of policy documents from different periods and different age groups at different points in time; 3) identifying new ways to understand complex phenomena of change and transformation such as agent-based modelling and hierarchical age-period-cohort (HAPC) analysis.
In the rest of this final empirical chapter I will show how two methodological approaches, one qualitative and one quantitative, can be applied in the Cyprus case to facilitate disentangling and articulating microgenesis, ontogenesis and sociogenesis.
A Case Example: Some Autobiographical Notes
I was born in 1973 in Varosha, the new city next to historic Famagusta, now occupied by the Turkish army, which has been turned into a military zone. Given that nobody has been allowed to inhabit the town after 1974, it turned into a ‘ghost city’ filled with derelict buildings. I was one of the 160,000 internally displaced persons. My mother and father, after months of temporary refuge at various relatives’ homes, settled down in rented accommodations, in Derynia, a village next to old Famagusta and Varosha, that also happened to be my father’s birthplace. Up to the fifth grade of the elementary school, I attended the village school. I still remember some of the financial hardships of the early years after 1974, and I remember my teachers promulgating the discourse of the barbaric Turkish invasion and its consequences, with our duty being to join the in-group collective struggle for justice. I still remember my father waiting by the radio to hear news of the outcomes of the negotiations to solve the Cyprus problem, and the key to our apartment in Varosha that my mother kept in the drawer next to her bed – experiences very common to many internally displaced GCs, as we know from other research (Loizos, Reference Loizos1981; Zetter, Reference Zetter and Calotychos1998).
One of my first memories from living in Derynia is the image in Figure 5.3 that I would see day in and day out for the first 12 years of my life from the balcony of our rented house, sometimes accompanied by my parents’ commentary: ‘You see this building? This is our house.’ ‘We were living in that apartment.’
A view of Varosha from Derynia.
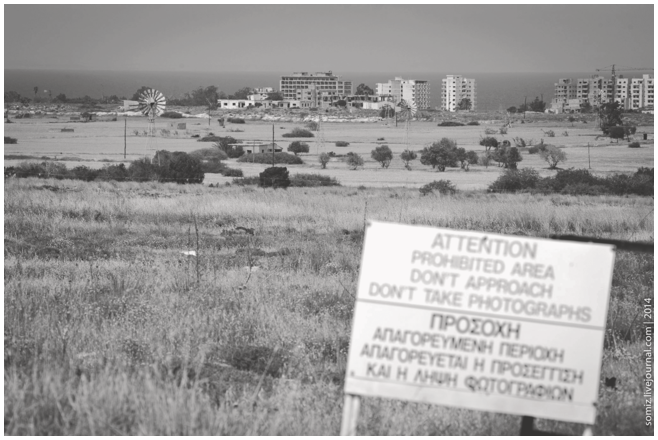
This image was often accompanied by a feeling of loss and sorrow, mixed with resentment towards the Turkish army that occupied my house and a strong will to return. In the work of Ernst Boesch (Reference Boesch2001) and his symbolic action theory we find the distinction between ‘myths and fantasms’ which is relevant here. Myths are the widely held and shared beliefs in a community. In my case, the widely shared myth would be that of the ‘barbaric invasion of expansionist Turkey’ and the duty of a collective struggle ‘for return’ and ‘not forgetting’. Fantasms are the individualised versions of myths that make sense to one particular individual. The image in Figure 5.3 seems to have for me the importance of a ‘fantasm’ that haunts my life since my early childhood, giving orientation and a goal towards striving to return to Varosha. So, this is a fantasm yearning for a fantasm/ghost town. The image in Figure 5.4 captures the sentiment completely. In one of the visits to Varosha a GC internally displaced person left this note on the fence: ‘I LEFT MY SOUL INSIDE. OPEN UP!’
A written note left on the fence of Varosha by a Greek Cypriot Varoshiotis.
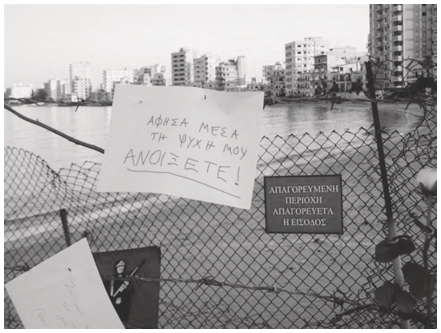
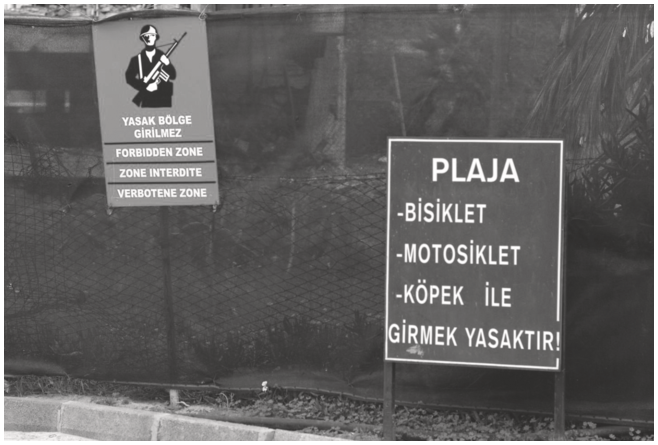
The sign next to the note on the fence states (in Greek, so the GCs would definitely get the meaning): ‘PROHIBITED AREA, ENTRANCE PROHIBITED’, which is an example of what Jaan Valsiner (Reference Valsiner2021) refers to as a hypergeneralised sign. The image is interesting for its contrast of the two signs. Both are hypergeneralised forms that point to different futures for the town. The handwritten one on the left points towards return and the revival of the city while the one on the right points towards the negation of this return in a fine example of what Valsiner described as a demonogenetic representation. It creates the demon of the enemy that scares away GC internally displaced persons from Famagusta, like the scarecrow put in place to keep the birds away. Another variation of this can be found in Figure 5.5, in which the scare function is even clearer.
A military sign by the Turkish army on the fence of Varosha. (Photo taken by Gerard Duveen on a visit to Cyprus in 2007.)
Another of my first memories was visits to my grandparents’ house in Strovilia, a very small ‘enclaved’ village, mostly comprised of a few families, relatives of my father, situated between Varosha and the UK military base of Ayios Nikolaos. Incidentally, this small village figures in the UN Secretary-General (UNSG) reports on the Cyprus issue, every six months, since 2000 when the Turkish troops moved their control a short distance from Varosha up to the UK bases.Footnote 3 This action violated a unique status quo, a no man’s land; before that, a small strip of land in Strovilia was patrolled by two soldiers (a UN peacekeeper and a TC soldier), and my relatives would be obliged every Sunday to confirm, in writing, their presence in the village. My first few visits to this place were a source of horror: I was terrified of the Turkish soldier who patrolled there and resided in a small house, that belonged to my aunt, together with the UN soldier. I remember, years later, to have repeating nightmares until my early adulthood: me being chased by Turkish soldiers in that strip of land and/or the Turkish army moving further forward to kill the whole family, myself included.
A year after 1974, my father was offered a job as a secondary school art teacher. From then on, things started improving financially for our family. My mother stayed at home looking after my sister (born in 1977) and myself. In 1983, my father asked for a transfer to the divided capital, Nicosia, thinking that my sister and I would get better educational opportunities. He was instead transferred to Larnaca, a smaller town; we stayed there for three years. In 1986, the whole family finally moved to Nicosia. Both my sister and I excelled in school.
Just before the end of my studies at the lyceum there were big anti-occupation rallies organised by students, and I remember myself taking part. A student who had lowered a Turkish flag from a poll in Nicosia was celebrated in the press as a new hero from our youth and attracted the admiration of many students.
Becoming an educator back then was considered an excellent career for ‘good students’, as it was a well -paid, secure, civil servant’s job. Hence, I focused on successfully passing the prestigious entry exams that secured me a position at the Pedagogical Academy of Cyprus (a three-year teacher training college). My studies there did not lead to any change of views regarding the bad Turks and certainly did not fill my ignorance gaps regarding TCs, as we never discussed different perspectives nor were able to meet any TCs. Nevertheless, I did start developing an interest in psychology in my studies there.
In terms of my political views, I supported the left-wing patriotic party EDEK (socialists), as I was influenced by my father who was a very active member of the central committee of the party until 1990 and a bold trade-unionist for the same party in his work sphere; his strong involvement meant my attendance of the party’s rallies and anti-occupation marches from a young age. If anything, my political stance, whilst a student at that Pedagogical Academy, had become even more negative towards any solution other than that of a unitary state, with Turkish troops out of Cyprus. I do recall an essay of mine (thought at that time to be a valid research piece, even though my only source of reference was an encyclopedia that I had found on my father’s bookshelf), ‘evidencing’ that federation as a political system did not work in any country, therefore it would be catastrophic if applied to the Cyprus context. In hindsight, the literature review I had provided would have been unacceptable by any academic standard. In my defence, the library of the Pedagogical Academy was an outdated one (called Severios, it also served the historical school Pankyprion, a centre of Hellenic education in Cyprus and with a history of participation in the struggle of EOKA for reunification with Greece) that mainly had old books coming from Greece and not much in terms of current literature.Footnote 4 We also did not have the internet back then. However, I got a very good grade for this ‘research piece’ and warm, public congratulations by our geography teacher, who had made it clear, throughout his teachings, that he was against BBF. I was a thorough opponent of any bicommunal efforts to solve the Cyprus problem. I recollect lashing out at a colleague who revealed that he had contacts with TCs; I accused him of undermining the patriotic fighting spirit that was needed for the anti-occupation struggle. It is now obvious that I was then trapped in a mindset that considered contacts with the ‘other’ as signs of treason and obstructive to the collective struggle that ‘we’ GCs had to sustain to end occupation by Turkey. Back then, I was convinced that the Cyprus problem was ‘solely an issue of invasion and occupation by Turkey’, an oft-cited mantra of the then-EDEK leader, Vassos Lyssarides.
In 1993, I was in my 20s, a graduate of the Cyprus Pedagogical Academy and a qualified primary school teacher. Immediately, I went to complete my military service that I have left unfinished in 1990. During the two years of my military service, I would, every morning, listen to an ultra-nationalist radio show, feeling exhilarated by the radio producer’s militaristic language, extremely nationalistic comments, accusations against expansionist Turkey and his full support of the Kurdish resistance, that last one on the basis of a rationale that ‘the enemy of my enemy is my friend’.
I also applied to become a military officer. I passed the written exams (IQ test and essay writing) and athletic performance with flying colours. I also had to go through an oral examination/interview, during which the strength of my patriotic feelings was evaluated by (1) how hard I hit my foot down when saluting the officers and (2) my capacity to recite from memory a poem about the Greek revolution of 1821. Having passed all tests, I was sent to Sparta, Greece, to train as a cadet.
The Greek military officers treated us Cypriots as Greeks from the periphery of Greece. A particular officer who got the impression that I was not religious enough turned my time there into a living nightmare, with hazing and bullying. The reason? I laughed and said that I am not a real ‘psaltis’ when, after reading my surname, the officer wanted to assign me to sing psalms in the church every Sunday (psaltis is the Greek word for a chanter of religious hymns).
I finished my military service in 1995 with a sense of revulsion for the army and the military mindset, which I considered a degrading experience of wasted human potential and misspent youth. Entering a new chapter in my life, that of a teacher, was a step I anticipated with great joy and relief.
My transition to working as an elementary school teacher could be described as being turned into an active agent of the advancement of the Den Xechno philosophy. I now remember the one-sided kind of history and religious education I taught my students. I was usually following the textbook for each new course and rarely looked for other sources with which to teach my students. I was not even reflective on the propagandistic nature of it. At rare moments of actual reflection I would explain it away by reasoning that we needed to defend ourselves from all-powerful Turkey, so patriotic feelings had to be created in children as a form of resistance to Turkey.
In 1996, I was fortunate enough to take some extra courses for a year at the Pedagogical Institute of Cyprus by academics of the newly founded University of Cyprus as part of a special course that would equalize the three-year pedagogical academy degree with a four-year BA in Education. The influence of Professor Andreas Demetriou, a developmental psychologist (and later colleague and minister in President Demetris Christofias’s cabinet in 2008), was decisive as it furthered my interest in psychology and helped me to grasp what academic rigour and proper research should be. He also sparked my interest in Piaget and cognitive development to the extent that I decided to obtain a second BA in psychology. I prepared again for the national entry exams. Interestingly, my grade in history in the entry exams in 1996 was much lower than in my entry exam in 1990. The reason for this probably was that this time I did not just recite the pages of the textbook and instead tried to elaborate and deepen my thinking. Despite lower scores, I was able to gain admission at the psychology department of Panteion University in Athens. This department had a strong orientation towards social psychology, and in one of my courses I discovered the work of Serge Moscovici and the social Genevans (Doise & Mugny, Reference Doise and Mugny1984) in a Greek translation in a central bookstore in Athens. Having read that book, I knew that this line of research was what I wanted to study for my BA thesis, which I completed in 1999 by reviewing this tradition of research on social interaction and cognitive development.
As soon as I returned to Cyprus, I was seconded for a year at the Educational Psychology Service of the Ministry of Education and Culture, and in the same year I applied for an MSc in Educational Psychology at University College London (UCL). In the spring of 2000, I was invited to interview at UCL as part of their MSc entry processes. Given my plans to visit London, I thought of exploring other possibilities with universities that could accommodate my research interest in the role of social interaction in cognitive development. Searching the internet (dial-up connection just recently made its appearance in Cyprus at that point), I came across the work of Duveen at University of Cambridge, who seemed to be one of the few academics in the United Kingdom who was studying social representations and cognitive development that were my main research interests. I sent him an email, saying I would be traveling to the UK soon and asking for a meeting to discuss a possible collaboration. Being the generous soul that he always was, Duveen replied that he would be happy for us to meet and arranged a meeting at his Corpus Christi College office. When we met, we discussed his work with Patrick Leman, and he said he would be interested to expand that line of research. Upon my professing an enthusiastit interest in this kind of work, Duveen said he would be happy for us to work together if I wanted to apply for an MPhil at Cambridge, which I did. Some months later I was accepted at both UCL and Cambridge and ultimately decided to go to Cambridge for an MPhil in Social and Developmental Psychology. While in the programme, I worked on an empirical investigation of the representations of gender in social interaction around the Piagetian task of the conservation of liquids, which was later published as Psaltis and Duveen (Reference Psaltis and Duveen2006), and overall did well enough to have decided to continue towards a PhD.
Turning Points in Life
Around that time my friendship with Chara Makriyianni, a classmate from the Pedagogical Academy, has turned into a love affair. I was 27 years old. Chara already completed a Master in History Education with Peter Lee at the Institute of Education in London, and she was quite critical of the propagandistic nature of our history teaching in Cyprus. I remember in our first discussions we had disagreements about what the aims of history teaching should be, but once I started reading materials she suggested (and especially the connections of the work of Peter Lee with Piaget that made the epistemological foundations of new history much clearer in my eyes), I started revising my old views.
In the same year I had my first contact with TCs. My best friend arranged for me and Chara to go to a bicommunal workshop in Pyla/Pile, the only mixed village of Cyprus in the Larnaca district, facilitated by Nicos Anastasiou. There we completed an exercise of positioning landmark historical events on a ‘history ladder’ that represented the history of Cyprus. I remember how surprised I was to see how different points were important in the narrations of the two communities and how different a meaning we attributed to events that we all identified on the timeline.
My studies in social developmental psychology at Cambridge helped me to become more critical of our situation in Cyprus and of our educational system. I remember spending many hours in the Cambridge Library locating books on Cyprus history from Turkish, TC and UK perspectives that I never knew existed. In 2002, Chara joined me at Cambridge when she was accepted into a PhD programme at the Department of Education with Professor Peter Cunningham, an expert on oral history. Cohabitation with Chara in Cambridge became a constant source of new readings and discussions for me about nationalism and history, the use and abuse of history and opportunities to attend conferences of the NGO EuroClio where the abuse of history in other parts of the world became very clear in my mind. At one of these meetings Chara discussed with Joke van der Leeuw-Roord, then president of EUROCLIO, the idea of setting up a bicommunal NGO about history teaching in Cyprus, something that would be made possible by the recent opening of the checkpoints in Cyprus. A few months after the opening of the checkpoints in April 2023 we, along with other educator friends, located TC teachers who were interested in the idea. This was not difficult, since TC teachers, along with other trade unionists, had a reputation of always being at the forefront of collective action to reunite Cyprus. This led to the birth of the Association for Historical Dialogue and Research (AHDR), the first bicommunal NGO dealing with the sensitive issue of history teaching in a post-conflict and divided Cyprus. AHDR soon became the local partner of the CoE, and with their support, a number of training seminars for teachers from both communities on history teaching were organised every year. Nationalist press, the media and some right-wing and so-called centre parties trade unionists attacked the work of AHDR from the beginning, and although I understood why they did it, the organised nature of these attacks also made me want to study more institutionalised propaganda in the Cypriot press, which I recently was able to do with a colleague from media studies (Avraamidou & Psaltis, Reference Avraamidou and Psaltis2019).
Given my new reflective stance on nationalism and my study of intergroup relations, once I finished my PhD in 2005, I looked for a way to work in the United Kingdom in a relevant field until my partner would also finish her studies. The perfect opportunity appeared after a discussion with Miles Hewstone at Oxford when he organised a European Association of Social Psychology (EASP) meeting on minority influence in 2003 that I attended; we were approved, for a research grant to study intergroup contact between GCs and TCs in Cyprus, so I started working at the Oxford Centre for the Study of Intergroup Contact with Miles.
Since 2006, I got involved in the study of intergroup relations between GCs and TCs from a social psychological perspective. I remember how many of my stereotypes for TCs and Turks were deconstructed along the way. I now have many TC friends and research partners. A year later I was appointed as a lecturer of social psychology at the University of Cyprus. I was the first GC social psychologist to work in an academic institution in Cyprus. In 2007, I took the initiative to establish the first Association of Social Psychologists in Cyprus on an intercommunal basis, and in 2008 it was officially registered.
That same year we had presidential elections that brought leftist Dimitris Christofias to power, and my colleague Professor Andreas Demetriou was appointed Minister of Education. Demetriou attempted a positive pro-reconciliation educational reform that promoted a culture of co-operation and a policy of contact between students and teachers from both communities. As we were colleagues with Andreas, I had communicated to him several of my research findings about the positive role of contact in prejudice reduction and suggestions by AHDR about history teaching. Members of AHDR during his term in the ministry were seconded in the Pedagogical Institute for the writing of new history textbooks. AHDR also had the support of the government in the establishment of the Home for Co-operation in the UN buffer zone in Nicosia, a bicommunal educational centre for NGOs supported by the European Economic Area (EEA) and Norway Grants financial mechanism. The Home for Co-operation opened its doors on 6 May 2011, with an opening ceremony bringing together the leaders of the GC and TC communities, representatives of civil society and dignitaries from around Europe, including the CoE, Norway, Sweden, Switzerland and the Netherlands, who supported its establishment. As part of a four-day celebration marking the inauguration of the Home, I organised a scientific symposium with the title ‘Human and Societal Development: The role of Social Relationships’ on 9 May 2011. In my talk I explained how Piagetian ideas on social relations of co-operation inspired the establishment and naming of the Home for Co-operation. The talks of the symposium were later published as an edited volume with Alex Gillespie and Anne-Nelly Perret Clermont (Psaltis et al., Reference Psaltis, Franc, Smeekes, Ioannou, Žeželj, Psaltis, Carretero and Čehajić-Clancy2017). The photo in Figure 5.6 is from the conference.
The speakers at the inauguration symposium at the Home for Co-operation.

Unfortunately, Demetriou’s positive policy proposals failed to be fully implemented due to resistance from the church, organised teacher trade unions and teachers in the classroom, but they were nevertheless the first seeds of some positive ideas around contact that would materialise later. AHDR and the Home for Co-operation flourished and became internationally recognised. A testament to this is the three prestigious international awards received: Europa Nostra 2014 Conservation Award, celebrating and aiming to promote excellence in cultural heritage work; Max Van der Stoel Award in 2016 in recognition of extraordinary achievements aimed at improving the position of national minorities in the area of the Organization for Security and Co-operation in Europe (OSCE); and the 2018 Seán MacBride Peace Prize in recognition of its outstanding work for peace, disarmament and human rights. The short documentary produced by OSCE about AHDR and the Home for Co-operation provides a nice summary of this story.Footnote 5
In 2009, Chara and I were married and our son was born. In the same year I was invited to join the Greek Turkish Forum (GTF),Footnote 6 which is a 1.5-trackFootnote 7 diplomacy initiative to discuss informally bilateral political issues (e.g. the Aegean contestation), established in 1998 right after Greece and Turkey came to the brink of war (see Ker-Lindsay, Reference Ker-Lindsay2016 for the history of GTF), in order to facilitate dialogue between Greece and Turkey and promote confidence-building measures (CBMs). The GTF brought together politicians who did not hold a formal position in the administration, retired senior diplomats and military officers, business leaders and other figures from the media and academia. After 2002, GTF took more interest in the Cyprus issue as one of the main issues poisoning Greek–Turkish relations, and in 2006 there was a Cyprus chapter established with a GC and a TC team. I was one of the first GC members invited as an academic in 2008, and in 2014 I became the coordinator of the GC team of the Cyprus chapter of GTF. We had many meetings since 2008 in Athens, Istanbul, Ankara and Nicosia, many times with the acting ministers of foreign affairs of the two countries (Greece and Turkey) and the leaders of the two communities in Cyprus. In this context I was fortunate to understand the core issues of the tensions between Greece and Turkey and the core political underpinnings of the Cyprus issue. Above all, I understood the regional dynamics of the Cyprus issue and the way political developments, election cycles and economic developments influence the agenda of discussions. I also realised that trust at the interpersonal level and co-operative relations can facilitate the production of valuable ideas for confidence-building measures that can be implemented by politicians if they are convinced of their value when they have the support of both communities of Cyprus as well as of Greece and Turkey.
My son is 15 years old when these words are written in 2024. I rarely discuss my home in Varosha with him, but whenever we find ourselves in the southern part of Famagusta during a summer holiday, I do point out that somewhere in the buildings of the ‘ghost town’ is the apartment we left in 1974. I remember my surprise when my son came up to me when he was four years old and said: ‘Dad, Turks are bad.’ I asked, ‘Why do you say that, son?’ ‘Because my grandmother said that Turks came and took our houses back in 1974,’ was the reply. That incident made me realise how early in life children internalise that sense of loss described as the figurative nucleus of the representation of the Cyprus problem discussed in Chapter 3.
When we had the chance to visit Varoshia as a family with my parents and located our apartment in 2022 after the opening of a small part of Varosha to visits, my son found the experience distressing and said he did not want to do it again. He did, however, visit the Home for Co-operation many times with me and Chara from his early childhood and had the chance to meet many of our TC friends and their children. He also took part in a bicommunal meeting at the Home for Co-operation in the UN buffer zone in Nicosia organised specifically for children. This was done with the support of the Ministry of Education. A more permanent contact scheme during school time in the mornings was made possible later in 2017 as an initiative by the newly established Bicommmunal Technical Committee of education as part of the IMAGINE programme which by 2020 had touched the lives of more than 5,000 students.Footnote 8
In the past few years, the work of the committee has been slowed by a number of developments: the Crans Montana failure in July 2017; the COVID-19 pandemic in 2020 that led to the closing of a number of checkpoints; and in the same year a change of leadership in the north that brought nationalist Ersin Tatar as head of government for the TC community, with a subsequent change in TC policy from supporting BBF by Akinci to support of a two-state solution in Cyprus and a change in the number of the TC members of the committee (former members of AHDR and other pro-reconciliation academics and supporters of BBF). The committee nevertheless still functions, but the TC side unilaterally decided to end the IMAGINE programme. One does not need a lot of imagination to understand that this programme goes against the separatist views of those in power in the TC community.
This autobiographical analysis could be used both as a window into personal experience and the way personal meanings and fantasms (Boesch, Reference Boesch2001) orient people to certain actions. They are also invaluable in rendering intelligible intergenerational influences and the slow but crucial process of ideological conversion. In the story told in the previous sections one can identify various meetings with alterity that introduced doubt in my subjectivity as suggested by Duveen (Reference Duveen2002). As suggested by Kadianaki and Gillespie (Reference Kadianaki and Gillespie2015), the meeting with alterity can take various forms: (1) rupture with the physical world (alterity in action), (2) social contact (alterity in other), (3) movement between contexts (alterity in self) and (4) semiotic dialogicality (alterity in the structure of knowledge). In my case the feeling of loss of our house in Varosha was formed early on through processes of intergenerational transmission and was reinforced by the educational policy of Den Xechno. Until my attendance of my first bicommunal workshop in Pyla and the exercise on the history line I had developed good defensive mechanisms (semantic barriers) to downplay alternative representations of the Cyprus issue as unpatriotic, still under the spell of an ethos of conflict. Meeting TCs for the first time and encountering their own perspective (alterity in other) were the beginning of a life-changing experience. Then came meetings with other alterities (my wife, professors, colleagues, etc.). Moving abroad to study further changed the social context for me by introducing me to networks of people with an outsider’s perspective on the Cyprus problem. Changing my role from student to university teacher also allowed me to meet alterity in self. My readings about the Cyprus problem from various perspectives increased my multiperspectivity and introduced alterity in my structure of knowledge. Finally, my visits to the other side of the island after 2003 offered plenty of opportunities for rupture with the physical world (alterity in action) that made me deconstruct many misconceptions about the everyday life of the other community.
This narrative analysis can also help in transitioning into a more quantitative analysis that more systematically examines the interaction of age with historical events. Going back in time, compared to my autobiographical note, let us take, for example, the birth cohort of my parents to understand at what age they experienced some important historical turning points. For the quantitative analysis that will follow in this chapter I have created 5-year-band birth cohorts as shown in Table 5.1. Following this categorisation, I fall into cohort 9 and my parents fall into cohort 3, as they were born in 1944.
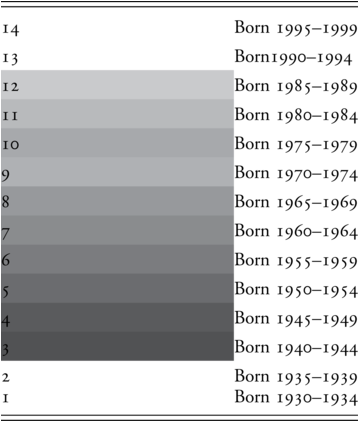
Table 5.1 Long description
The table lists 14 cohorts identified in the study of two communities in Cyprus, with data collected in 2007, 2010, and 2017. Each cohort is defined by a range of birth years, from oldest (Cohort 1) to youngest (Cohort 14).
Cohort 14 is born between 1995 to 1999.
Cohort 13 is born between 1990 to 1994.
Cohort 12 is born between 1985 to 1989.
Cohort 11 is born between 1980 to 1984.
Cohort 10 is born between 1975 to 1979.
Cohort 9 is born between 1970 to 1974.
Cohort 8 is born between 1965 to 1969.
Cohort 7 is born between 1960 to 1964.
Cohort 6 is born between 1955 to 1959.
Cohort 5 is born between 1950 to 1954.
Cohort 4 is born between 1945 to 1949.
Cohort 3 is born between 1940 to 1944.
Cohort 2 is born between 1935 to 1939.
Cohort 1 is born between 1930 to 1934.
NB. Shades connect to Table 5.2 in page 176
A Reconstruction of Important Historical Events for the Cohort Born 1940–1944
According to renowned anthropologist Peter Loizos, the first half of the 20th century in Cyprus was a period of rapid sociodemographic and structural changes (Loizos, Reference Loizos1975, Reference Loizos2001). Whilst in 1878, 9 out of every 10 Cypriots was a villager, in 1955 this figure was closer to 6 out of every 10. In the same period the population increased two and a half times, from 186,000 to more than 450,000. In the meantime, while 18.6% of Cypriots aged 15–24 were illiterate in 1931, this figure fell to just 5.9% by 1946. In his reflection on this period Loizos is especially concerned with transformation of relations of authority, which, according to him, are to be found ‘embedded in central political, economic, religious and social ideas about relations of all kinds-relations between people and their gods, between men and women, between parents and children, masters and servants, employers and employees, rich and poor, between racial and cultural groups, ideas about justice, property and marriage’ (Loizos, Reference Loizos2001, p. 128). His words describe this period eloquently:
So a series of challenges take place within our period. The British displaced the Ottomans and challenged the church. Sons challenge fathers. Workers, challenge employers. Communism and socialism challenge the church and its traditional leadership in both ethical and political life. Women challenge men, at first by their educational and occupational achievements, then by direct confrontation. But later as militant Greek Cypriots came to challenge the legitimacy of the British colonial rule, then those schoolgirls mobilized by EOKA came to confront men of the British security forces.
Of course, these indications of challenging authority were only the first signs of challenging a traditional culture of honour and shame characteristic of Mediterranean societies described through ethnographic work in the Greek Cypriot Pitsilia Highland village of Alona in 1954 by Peristiany (Reference Peristiany1966). This work was foundational in the field, as it was among the first to systematically examine how honour and shame function as central social values that shape interpersonal relationships, gender roles, social structure and community dynamics in these societies.
To return to significant historical periods in the life of the cohort born 1940–1944, their childhood would coincide with the Second World War. Growing up under the British colonial rule, the sociopolitical atmosphere of the island would be charged, with the undercurrents of nationalistic sentiments for enosis (union of Cyprus with Greece) growing stronger. The left–right ideological polarisation would be a defining period in their childhood years, charting trajectories and networks of social interactions of socialisation that could involve closer or more distant relationships with members of the other community. Leftists organised under AKEL and youth or worker organisations in the GC community would be often persecuted or threatened by EOKA members in their teen years, although they would tend to have closer and better relations with TCs. Youth of more centrist and leftist political views (although not AKEL members) would tend to have more ambivalent feelings towards the EOKA struggle given the dominant position of the church and the overwhelming majority of GCs taking active part in religious practices at the time. On the whole, the GC perspective towards TCs during this time would be of a marginal minority and financially worse-off community that should have no say in what GCs as the majority considered their legitimate national aspirations. Another defining experience of these years would be for those who lived in mixed villages who had the chance to establish co-operative and everyday relationships with members of the other community versus areas with no mixed population where opportunities for intergroup contact and co-operation would be much more rare.
Adolescence (1950s): Their teenage years would be marked by the armed struggle of EOKA for the union of Cyprus with Greece. This period would shape their understanding of nationalistic aspirations and the reactions from the British colonial power. Right-wing EOKA supporters would have the chance to be actively involved in the enosis struggle of GCs, but leftists would not. In the TC community there was a much wider acceptance of the TC resistance organisation Türk Mukavemet Teşkilatı (TMT) as a legitimate resistance organisation that could block GC efforts for enosis (Ktoris, Reference Ktoris2013).
Early Adulthood (1960s): The establishment of the Republic of Cyprus in 1960 would be a significant milestone. The subsequent intercommunal clashes would further shape their perceptions and experiences. The propaganda on both sides generated an intense enmity between the members of the two communities and encouraged a number of violent acts across the island. In coffee shops around the island, both GCs and TCs used exaggerated talk, echoing the extremist language and propaganda used in most of the press of both communities (Packard, Reference Packard2008). Children in the mixed villages who had once played together now fought, taunted and threw stones at each other if they met by chance in the street (Patrick, Reference Patrick, Bater and Preston1976a). The educational systems of the two communities in the period continued to be separate, since the 1960 constitution gave responsibility for education to the two communal chambers. The orientation of both systems in the period 1960–1974 continued to be towards their corresponding and opposed national aims of enosis and taksim (Pavlou, Reference Pavlou2015), respectively, with most textbooks imported by the so-called motherlands (Greece and Turkey) that were seen as the ‘national centre’.
However, not all of the population was polarised, nor did the entirety of it blindly followed the extremist groups. Some accounts report that GC villagers were often suspicious and wary of the old EOKA network, as it was claimed that they had connections with the criminal underclass (Packard, Reference Packard2008, p. 90). Similarly, not all TCs blindly followed TMT, as some accounts report that TC leaders in some villages forbade any friendly relations with the GCs, and any TCs caught being friendly with GCs or walking or enjoying themselves in Greek areas were penalised with heavy fines, imprisonment or even whipping (see also Patrick, Reference Patrick, Bater and Preston1976a, p. 133; Drousiotis, Reference Drousiotis2005). There are also accounts that report that TCs in mixed villages were not allowed by their leaders to use the postal services of the government, as this was considered not only to promote fraternisation with the other community but also to be a sign of recognition (Patrick, Reference Patrick, Bater and Preston1976a, p. 112) of the GC-run state. Lastly, there is evidence that in some cases in late 1964, local paramilitary commanders resorted to armed threats, and even to murder, in order to keep TC refugees from moving into areas controlled by the Cyprus government (Patrick, Reference Patrick, Bater and Preston1976b, p. 345).
As a result of the intercommunal violence, many TCs were forced (either by TMT members or simply due to insecurity) to leave their homes in mixed villages and sought refuge in enclaves. These enclaves were predominantly TC areas where they could seek protection from the violence and live in relative safety. The creation of enclaves essentially led to a physical division of the island along ethnic lines, which would later be solidified by the Turkish invasion in 1974. There were many enclaves across the island, ranging in size from small villages to large urban centers. Some of the larger enclaves included Famagusta, Lefka and the Bogaz area between Kyrenia and Nicosia. The number and size of enclaves changed over time as the situation on the ground evolved. These enclaves functioned as states within states for about 10 years until the war of 1974, with internal organisation and economy supported by Turkey and minimal to no contact between members of the two communities, since they were guarded by TC fighters and GCs could not enter these areas. Many of the TCs who spent their early adulthood in enclaves would be deprived of opportunities to study, as they took fighter duties with TMT, although some would get the chance after 1968 to study in Turkey – an important socialisation experience, since many of them would be socialised in the leftist circles of Istanbul in the period around 1968 (Moudouros, Reference Moudouros2020), a period of progressive student activism that was even more strongly felt in other European countries at the same time. GC students who went to study abroad usually report the 1968 events as important political socialisation years, especially in the United Kingdom and Czechoslovakia (where leftist students would also often go to study supported by AKEL in Cyprus). The youth from AKEL families would also often go to study in the USSR on scholarships, but the experience of the USSR was different, to say the least, from the student movement in Western Europe.
Middle Age (1970s–1980s): The 1974 Turkish invasion/intervention would occur when they were 30–34 years old. Like the previous cohort, many would likely have participated in the conflict, and about 30% would experience displacement. This would be a challenging period, especially for those with young families or those who had recently settled into their homes. The 1974 events would be collectively experienced by GCs as a collective trauma but by TCs with an elation of almost apocalyptic proportions because it ended the more difficult 10 years of their lives in enclaves (Bryant, Reference Bryant2010).
Later Life (1990s–2000s): As they transitioned into their older age, the unresolved nature of the Cyprus issue and a history of repeated failures to solve the problem that was becoming protracted would be a significant concern. The opening of the checkpoints in 2003 and Cyprus’s EU accession in 2004 are the events they would witness with a lifetime of experience and understanding. Most GCs and TCs of this birth cohort would take advantage of the newfound opportunity in 2003 to revisit their properties and homes that they left during their early 30s. Those that used to live in mixed villages would get the chance to see childhood and adolescent friends from the other community with whom they probably lost contact since 1963 when they were 19–23 years old. At the same time it was reported that some people with direct involvement in paramilitary organisations and intercommunal conflict would avoid crossing to the other side due to fear of retaliations more than 40 years after the ‘troubles’.
Articulating Microgenesis, Ontogenesis and Sociogenesis through Disentangling Age, Period and Cohort Effects
Three possible effects are at play when data are collected from participants of different age cohorts at different points in time: age, period and cohort. The three variables relate to one another in an exact linear fashion. For example, for each age and calendar year there is a unique birth cohort. This causes the well-known identification problem in modelling. However, the HAPC modelling framework does not incur the identification problem because the three effects are not assumed to be linear and additive at the same level of analysis. HAPC models can capture the contextual effects of periods and cohorts and thus stimulate new conceptualisations of processes of change.
The repeated cross-sectional design (representative sample surveys taking place in different periods with different participants but with same questionnaire such as ESS or WVS) is in fact a multilevel design in which individual-level observations are nested in, and cross-classified simultaneously by, the two higher-level social contexts defined by time period of data collection and birth cohort. Global descriptions of generations and cohorts like, for example, the Millennials, Baby Boomers and the Silent Generation make no sense in the context of Cyprus, since generations are never discussed publicly in this context. However, the original discussion by Mannheim that we covered in Chapter 3 on generations is certainly relevant in this context, especially his insight that big events like war can be a defining moment of rapture that could create groupings of people that self-identify with these categories (e.g. born before or after 1974). A more detailed analysis that would allow for the detection of aggregate generational differences between the various cohorts described in Table 5.1, and specifically comparisons of all other cohorts with the one described in detail earlier (1940–1944), follows below. The data used for the analysis that follows come from three large-N bicommunal representative sample surveys of data collected in 2007, 2010 and 2017. The method was multistage stratified sampling, and more details on the methodology can be found in published work (Psaltis, Reference Psaltis, Marková and Gillespie2012a), OSF (open-source cloud-based project management platform)Footnote 9 and Appendix B, Table B.1.
Disentangling Age, Period and Cohort Effects
The analytical strategy followed here was to test various HAPC models predicting in turn: Prejudice, Trust, Acceptance of Bizonal Bicommunal Federation as the position agreed by leaders since 1977 and Readiness for renewed Cohabitation. Each cohort (different shades in Table 5.1 above) can be located in the accounting model below shown in Table 5.2. The table below presents the mean level of prejudice towards the other community measured with the feeling thermometer ranging from 0 (cold/very negative) to 100 (warm/very positive). A score of 50 indicates neutral feelings.
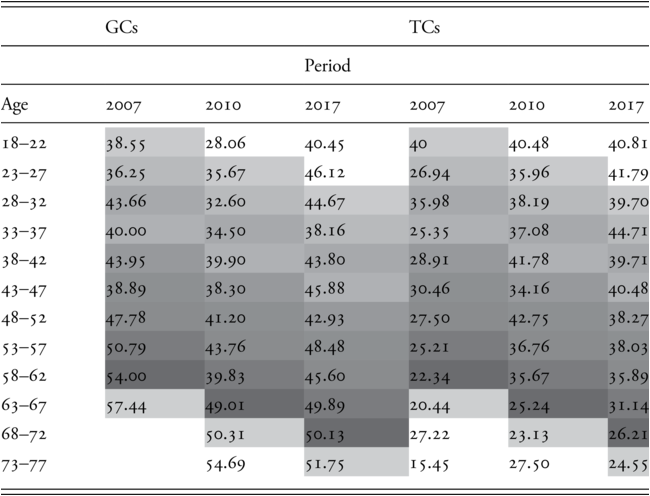
Table 5.2 Long description
The table presents data categorized by age groups from 18 to 22 up to 73 to 77 and shows values for G Cs and T Cs over three periods, 2007, 2010, and 2017.
Below are the values organized by age group and period:
Age 18 to 22:
G Cs: 2007: 38.55, 2010: 28.06, 2017: 40.45
T Cs: 2007: 40.00, 2010: 40.48, 2017: 40.81
Age 23 to 27:
G Cs: 2007: 36.25, 2010: 35.67, 2017: 46.12
T Cs: 2007: 26.94, 2010: 35.96, 2017: 41.79
Age 28 to 32:
G Cs: 2007: 43.66, 2010: 32.60, 2017: 44.67
T Cs: 2007: 35.98, 2010: 38.19, 2017: 39.70
Age 33 to 37:
G Cs: 2007: 44.00, 2010: 34.50, 2017: 38.16
T Cs: 2007: 28.35, 2010: 37.08, 2017: 44.71
Age 38 to 42:
G Cs: 2007: 43.95, 2010: 39.90, 2017: 43.80
T Cs: 2007: 29.91, 2010: 41.78, 2017: 39.71
Age 43 to 47:
G Cs: 2007: 38.89, 2010: 38.30, 2017: 45.88
T Cs: 2007: 34.16, 2010: 34.16, 2017: 40.48
Age 48 to 52:
G Cs: 2007: 47.78, 2010: 41.20, 2017: 42.93
T Cs: 2007: 27.50, 2010: 42.75, 2017: 38.27
Age 53 to 57:
G Cs: 2007: 50.79, 2010: 43.76, 2017: 48.48
T Cs: 2007: 25.21, 2010: 36.76, 2017: 38.03
Age 58 to 62:
G Cs: 2007: 54.00, 2010: 39.83, 2017: 45.60
T Cs: 2007: 22.34, 2010: 35.67, 2017: 35.89
Age 63 to 67:
G Cs: 2007: 57.44, 2010: 49.01, 2017: 49.89
T Cs: 2007: 20.44, 2010: 25.24, 2017: 31.14
Age 68 to 72:
G Cs: 2007: no entry, 2010: 50.31, 2017: 50.13
T Cs: 2007: 27.22, 2010: 23.13, 2017: 26.21
Age 73 to 77:
G Cs: 2007: no entry, 2010: 54.69, 2017: 51.75
T Cs: 2007: 15.45, 2010: 27.50, 2017: 24.55
For each dependent variable six models in total were tested. The first one was a basic model including as predictors only the following demographic variables: Age, Age Squared, Education, Living in Urban or Rural area, IDP status (either first or later generation IDP), Gender, Period of Data Collection (2007, 2010 or 2017) and Recoded Birth Cohorts. A subset of the 14 cohorts presented in the Table 5.2 that satisfied the criterion of having measurements in all three periods was used, excluding cohorts 1, 2 and 12, 13 from the analysis due to the incompleteness of data.
The second was a variation of testing the same variables with period as a fixed factor and recoded cohort as a random factor. The third was a model with the same variables but treating both period and recoded cohort as random factors as suggested by Yang and Lund (Reference Yang and Land2013) in chapter 7 of their authoritative book on age, period and cohort analysis using mixed lineal models.
The fourth, fifth and sixth models tested followed the rationale of a hierarchical regression model and included all the demographic variables tested in the first three models but additionally several social psychological variables that were expected to significantly predict the outcomes. For the models predicting feelings towards the other community and intergroup trust, these were the social psychological predictors: Quantity of Contact with members of the other community, Number of Outgroup friendships, Strength of Communal Identification, Threats (Realistic and Symbolic) and Importance of Religion in their life. Contact and friendships are a good indication of what is happening at the interpersonal level of analysis, and microgenetic processes, strength of communal identification and religiosity capture to some extent the embedding of self in the collectivity and part–whole relationships and affinity to tradition, honour, and shame values and threats that are a good indicator of intergroup dynamics at the intergroup level of analysis.
For the models predicting Acceptance of BBF and Readiness for Cohabitation, two additional predictors were added: Feelings towards the other community, Trust for ordinary people from the other community. This strategy would allow the comparison of basic demographic HAPC models with the more comprehensive models so that we could establish whether any of possible Age, Period or Cohort Effects would still be significant after the inclusion of this set of social psychological variables as predictors, given our hypothesis that political decisions that could influence the restructuring of institutions would be at least partly mediated by the quality of intergroup relations.
Predicting Positive Feelings towards the Other Community
Greek Cypriot Community
From the basic model (see Table 5.3) we see that education, area of residency (urban or rural), gender, period and cohort are significant predictors of positive feelings (reduced prejudice) towards TCs. The higher the education, the more positive the feelings towards TCs. Living in an urban area and being male are also related to more positive feelings towards the other community. There is a linear trend of cohorts so that the older the cohort, the more positive the feelings towards TCs In 2010, there was a significant negative dip in feelings towards TCs that by 2017 has recovered in levels comparable to 2007. The total variance explained by this model was adj R2 = 0.06.
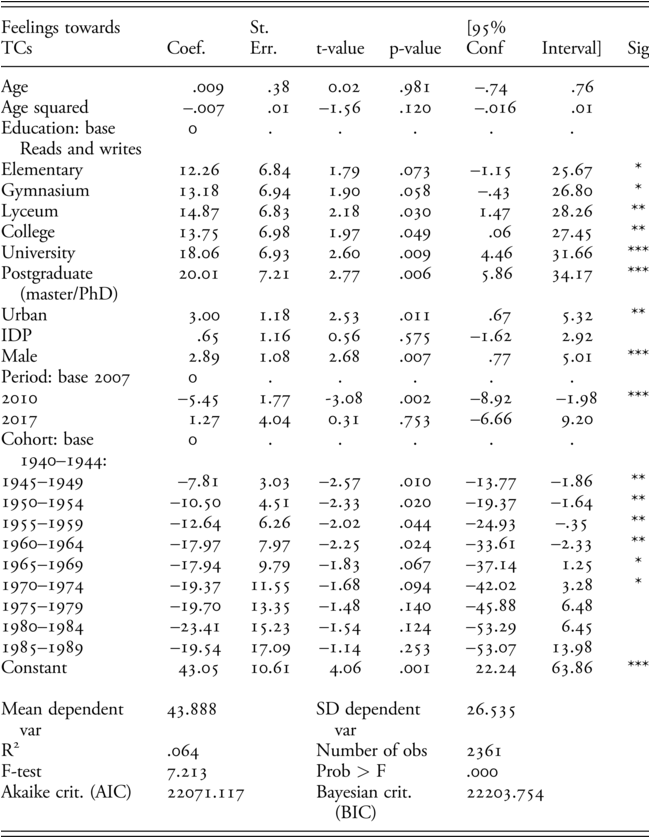
Table 5.3 Long description
The regression output table analyzes predictors of the variable labeled feeling towards T Cs. Each row lists a predictor variable along with its coefficient, standard error, t-value, p-value, ninety-five percent confidence interval, and significance level.
For age, the coefficient is 0.009, with a standard error of 0.38. The t-value is 0.02, and the p-value is 0.981. The 95 percent confidence interval ranges from negative 0.74 to 0.76. This result is not statistically significant.
For age squared, the coefficient is negative 0.007, with a standard error of 0.01. The t-value is negative 1.56, and the p-value is 0.120. The 95 percent confidence interval ranges from negative 0.016 to 0.01. This result is not statistically significant.
For elementary education, the coefficient is 12.26, with a standard error of 6.84. The t-value is 1.79, and the p-value is 0.073. The 95 percent confidence interval ranges from negative 1.15 to 25.67. This result is statistically significant at the 10 percent level, indicated by a single asterisk.
For gymnasium education, the coefficient is 13.18, with a standard error of 6.94. The t-value is 1.90, and the p-value is 0.058. The 95 percent confidence interval ranges from negative 0.43 to 26.80. This result is statistically significant at the 10 percent level, indicated by a single asterisk.
For lyceum education, the coefficient is 14.87, with a standard error of 6.83. The t-value is 2.18, and the p-value is 0.030. The 95 percent confidence interval ranges from 1.47 to 28.26. This result is statistically significant at the 5 percent level, indicated by two asterisks.
For college education, the coefficient is 13.75, with a standard error of 6.98. The t-value is 1.97, and the p-value is 0.049. The 95 percent confidence interval ranges from 0.06 to 27.45. This result is statistically significant at the 5 percent level, indicated by two asterisks.
For university education, the coefficient is 18.06, with a standard error of 6.93. The t-value is 2.60, and the p-value is 0.009. The 95 percent confidence interval ranges from 4.46 to 31.66. This result is statistically significant at the 1 percent level, indicated by three asterisks.
For postgraduate (master’s or P h D) education, the coefficient is 20.01, with a standard error of 7.21. The t-value is 2.77, and the p-value is 0.006. The 95 percent confidence interval ranges from 5.86 to 34.17. This result is statistically significant at the 1 percent level, indicated by three asterisks.
For urban areas, the coefficient is 3.00, with a standard error of 1.18. The t-value is 2.53, and the p-value is 0.011. The 95 percent confidence interval ranges from 0.67 to 5.32. This result is statistically significant at the 5 percent level, indicated by two asterisks.
For I D P, the coefficient is 0.65, with a standard error of 1.16. The t-value is 0.56, and the p-value is 0.575. The 95 percent confidence interval ranges from negative 1.62 to 2.92. This result is not statistically significant.
For male, the coefficient is 2.89, with a standard error of 1.08. The t-value is 2.68, and the p-value is 0.007. The 95 percent confidence interval ranges from 0.77 to 5.01. This result is statistically significant at the 1 percent level, indicated by three asterisks.
For 2010, the coefficient is negative 5.45, with a standard error of 1.77. The t-value is negative 3.08, and the p-value is 0.002. The 95 percent confidence interval ranges from negative 8.92 to negative 1.98. This result is statistically significant at the 1 percent level, indicated by three asterisks.
For 2017, the coefficient is 1.27, with a standard error of 4.04. The t-value is 0.31, and the p-value is 0.753. The 95 percent confidence interval ranges from negative 6.66 to 9.20. This result is not statistically significant.
For 1940 to 1944, the coefficient is negative 7.81, with a standard error of 3.03. The t-value is negative 2.58, and the p-value is 0.010. The 95 percent confidence interval ranges from negative 13.77 to negative 1.86. This result is statistically significant at the 5 percent level, indicated by two asterisks.
For 1945 to 1949, the coefficient is negative 10.50, with a standard error of 4.51. The t-value is negative 2.33, and the p-value is 0.020. The 95 percent confidence interval ranges from negative 19.37 to negative 1.64. This result is statistically significant at the 5 percent level, indicated by two asterisks.
For 1950 to 1954, the coefficient is negative 12.04, with a standard error of 5.17. The t-value is negative 2.33, and the p-value is 0.020. The 95 percent confidence interval ranges from negative 22.18 to negative 1.90. This result is statistically significant at the 5 percent level, indicated by two asterisks.
For 1955 to 1959, the coefficient is negative 16.84, with a standard error of 6.26. The t-value is negative 2.69, and the p-value is 0.007. The 95 percent confidence interval ranges from negative 29.35 to negative 4.33. This result is statistically significant at the 1 percent level, indicated by three asterisks.
For 1960 to 1964, the coefficient is negative 19.97, with a standard error of 6.22. The t-value is negative 3.21, and the p-value is 0.001. The 95 percent confidence interval ranges from negative 32.21 to negative 7.73. This result is statistically significant at the 1 percent level, indicated by three asterisks.
For 1965 to 1969, the coefficient is negative 17.94, with a standard error of 7.95. The t-value is negative 2.26, and the p-value is 0.024. The 95 percent confidence interval ranges from negative 33.61 to negative 2.28. This result is statistically significant at the 5 percent level, indicated by two asterisks.
For 1970 to 1974, the coefficient is negative 9.34, with a standard error of 9.73. The t-value is negative 0.96, and the p-value is 0.337. The 95 percent confidence interval ranges from negative 28.31 to 9.62. This result is not statistically significant.
For 1975 to 1979, the coefficient is negative 13.25, with a standard error of 9.15. The t-value is negative 1.45, and the p-value is 0.147. The 95 percent confidence interval ranges from negative 31.19 to 4.69. This result is not statistically significant.
For 1980 to 1984, the coefficient is negative 15.33, with a standard error of 10.57. The t-value is negative 1.48, and the p-value is 0.144. The 95 percent confidence interval ranges from negative 35.88 to 5.21. This result is not statistically significant.
For 1985 to 1989, the coefficient is negative 19.54, with a standard error of 17.09. The t-value is negative 1.14, and the p-value is 0.253. The 95 percent confidence interval ranges from negative 53.07 to 13.98. This result is not statistically significant.
For constant, the coefficient is 23.41, with a standard error of 10.61. The t-value is 2.21, and the p-value is 0.028. The 95 percent confidence interval ranges from 2.24 to 63.86. This result is statistically significant at the 1 percent level, indicated by three asterisks.
The mean dependent variable is 43.888. S D dependent variable is 26.535. R-squared is 0.064. The number of observations is 2361. F-test is 7.213. The probability greater than F is 0.000. Akaike crit. A I C is 22071.117. Bayesian crit B I C is 22203.754.
*** p < .01, ** p < .05, * p < .1
When the social psychological variables were entered in the model (see Table 5.4), the total variance explained by the model was significantly increased (adj R2 = 0.30). Interestingly, all significant predictors in Table 5.3 except period became non-significant, which suggests that area of residency, education and cohort are having their effects on the outcome (Positive Feelings towards TCs) through the social psychological variables that are significant predictors in this model. These are out-group friendships and threats. There was also a trend for those who are more religious to be more prejudiced towards TCs.

Table 5.4 Long description
The regression output table analyzes predictors of the variable labeled Thermo O G. Each row lists a predictor variable along with its coefficient, standard error, t-value, p-value, ninety-five percent confidence interval, and significance level.
For age, the coefficient is 0.43, with a standard error of 0.33. The t-value is 1.31, and the p-value is 0.19. The 95 percent confidence interval ranges from negative 0.22 to 1.09. This result is not statistically significant.
For age squared, the coefficient is negative 0.01, with a standard error of 0.01. The t-value is negative 0.96, and the p-value is 0.33. The 95 percent confidence interval ranges from negative 0.012 to 0.01. This result is not statistically significant.
For elementary education, the coefficient is 8.04, with a standard error of 5.93. The t-value is 1.36, and the p-value is 0.17. The 95 percent confidence interval ranges from negative 3.58 to 19.67. This result is not statistically significant.
For gymnasium education, the coefficient is 9.46, with a standard error of 6.01. The t-value is 1.57, and the p-value is 0.11. The 95 percent confidence interval ranges from negative 2.31 to 21.26. This result is not statistically significant.
For lyceum education, the coefficient is 10.61, with a standard error of 5.92. The t-value is 1.79, and the p-value is 0.09. The 95 percent confidence interval ranges from negative 1.64 to 22.86. This result is statistically significant at the 10 percent level, indicated by a single asterisk.
For college education, the coefficient is 9.87, with a standard error of 6.05. The t-value is 1.63, and the p-value is 0.10. The 95 percent confidence interval ranges from negative 2.01 to 21.74. This result is not statistically significant.
For university education, the coefficient is 11.10, with a standard error of 6.02. The t-value is 1.84, and the p-value is 0.03. The 95 percent confidence interval ranges from 0.70 to 22.90. This result is statistically significant at the 10 percent level, indicated by a single asterisk.
For postgraduate (master’s or P h D) education, the coefficient is 5.37, with a standard error of 6.28. The t-value is 0.86, and the p-value is 0.39. The 95 percent confidence interval ranges from negative 6.94 to 17.69. This result is not statistically significant.
For urban areas, the coefficient is 0.99, with a standard error of 1.04. The t-value is 0.95, and the p-value is 0.34. The 95 percent confidence interval ranges from negative 1.05 to 3.03. This result is not statistically significant.
For I D P, the coefficient is 0.57, with a standard error of 1.02. The t-value is 1.05, and the p-value is 0.29. The 95 percent confidence interval ranges from negative 0.93 to 3.06. This result is not statistically significant.
For male, the coefficient is 0.07, with a standard error of 0.97. The t-value is 0.07, and the p-value is 0.94. The 95 percent confidence interval ranges from negative 1.82 to 1.97. This result is not statistically significant.
For quantity of contact, the coefficient is 0.35, with a standard error of 1.00. The t-value is 0.35, and the p-value is 0.72. The 95 percent confidence interval ranges from negative 1.62 to 2.32. This result is not statistically significant.
For friendships, the coefficient is 6.68, with a standard error of 0.75. The t-value is 8.89, and the p-value is 0.00. The 95 percent confidence interval ranges from 5.20 to 8.15. This result is statistically significant at the 1 percent level, indicated by three asterisks.
For communal I D, the coefficient is negative 1.59, with a standard error of 0.75. The t-value is negative 2.14, and the p-value is 0.03. The 95 percent confidence interval ranges from negative 3.07 to negative 0.11. This result is statistically significant at the 10 percent level, indicated by a single asterisk.
For threats, the coefficient is negative 13.33, with a standard error of 2.03. The t-value is negative 6.56, and the p-value is 0.00. The 95 percent confidence interval ranges from negative 14.61 to negative 12.04. This result is statistically significant at the 1 percent level, indicated by three asterisks.
For religiosity, the coefficient is negative 0.87, with a standard error of 0.51. The t-value is negative 1.71, and the p-value is 0.08. The 95 percent confidence interval ranges from negative 1.88 to 0.12. This result is statistically significant at the 10 percent level, indicated by a single asterisk.
For the period 2010, with the base year being 2007, the coefficient is negative 5.52, with a standard error of 1.00. The t-value is negative 5.52, and the p-value is 0.00. The 95 percent confidence interval ranges from negative 11.60 to negative 5.52. This result is statistically significant at the 1 percent level, indicated by three asterisks.
For period 2017, the coefficient is negative 3.67, with a standard error of 3.57. The t-value is negative 1.02, and the p-value is 0.24. The 95 percent confidence interval ranges from negative 11.17 to 2.84. This result is not statistically significant.
For 1945 to 1949, the coefficient is 2.66, with a standard error of 7.97. The t-value is 0.33, and the p-value is 0.74. The 95 percent confidence interval ranges from negative 13.00 to 18.32. This result is not statistically significant.
For 1950 to 1954, the coefficient is 2.58, with a standard error of 3.96. The t-value is 0.56, and the p-value is 0.57. The 95 percent confidence interval ranges from negative 10.07 to 5.40. This result is not statistically significant.
For 1955 to 1959, the coefficient is 2.30, with a standard error of 5.49. The t-value is 0.46, and the p-value is 0.64. The 95 percent confidence interval ranges from negative 8.30 to 8.22. This result is not statistically significant.
For 1960 to 1964, the coefficient is 2.54, with a standard error of 6.98. The t-value is 0.72, and the p-value is 0.47. The 95 percent confidence interval ranges from negative 8.72 to 8.66. This result is not statistically significant.
For 1965 to 1969, the coefficient is 5.03, with a standard error of 8.57. The t-value is 0.31, and the p-value is 0.75. The 95 percent confidence interval ranges from negative 19.49 to 14.12. This result is not statistically significant.
For 1970 to 1974, the coefficient is 2.89, with a standard error of 10.11. The t-value is 0.03, and the p-value is 0.98. The 95 percent confidence interval ranges from negative 19.23 to 25.01. This result is not statistically significant.
For 1975 to 1979, the coefficient is 2.12, with a standard error of 11.68. The t-value is 0.19, and the p-value is 0.91. The 95 percent confidence interval ranges from negative 21.71 to 27.09. This result is not statistically significant.
For 1980 to 1984, the coefficient is 1.74, with a standard error of 13.92. The t-value is 0.12, and the p-value is 0.90. The 95 percent confidence interval ranges from negative 24.88 to 27.37. This result is not statistically significant.
For 1985 to 1989, the coefficient is 3.77, with a standard error of 14.94. The t-value is 0.25, and the p-value is 0.80. The 95 percent confidence interval ranges from negative 25.52 to 33.07. This result is not statistically significant.
For constant, the coefficient is 86.67 with a standard error of 10.03. The t-value is 8.63, and the p-value is 0. The 95 percent confidence interval ranges from negative 66.99 to 106.36. This result is statistically significant at the 1 percent level, indicated by three asterisks.
The mean dependent variable is 43.87. S D dependent variable is 26.51. R-squared is 0.30. The number of observations is 2326. F-test is 36.28. The probability greater than F is 0.000. Akaike crit. A I C is 21077.03. Bayesian crit B I C is 21238.09.
*** p < .01, ** p < .05, * p < .1
Turkish Cypriot Community
From the basic model (see Table 5.5) we see that age squared, education and IDP status are significant predictors of feelings towards GCs. The age squared significant findings suggest that older generations of TCs were especially negative towards GCs The period effect was significant, indicating higher scores for years 2010 and 2017 compared to 2007 The total variance explained by this model was adj R2 = 0.06.

Table 5.5 Long description
The regression output table analyzes predictors of the variable labeled Thermo O G. Each row lists a predictor variable along with its coefficient, standard error, t-value, p-value, ninety-five percent confidence interval, and significance level.
For age, the coefficient is negative 0.59, with a standard error of 0.37. The t-value is negative 1.59, and the p-value is 0.11. The 95 percent confidence interval ranges from negative 1.32 to 0.13. This result is statistically significant at the 10 percent level, indicated by a single asterisk.
For age squared, the coefficient is negative 0.010, with a standard error of 0.01. The t-value is negative 1.93, and the p-value is 0.05. The 95 percent confidence interval ranges from negative 0.019 to negative 0.01. This result is statistically significant at the 10 percent level, indicated by a single asterisk.
For elementary education, the coefficient is negative 2.91, with a standard error of 4.15. The t-value is negative 0.70, and the p-value is 0.48. The 95 percent confidence interval ranges from negative 11.06 to 5.24. This result is not statistically significant.
For gymnasium education, the coefficient is negative 5.43, with a standard error of 4.07. The t-value is negative 1.33, and the p-value is 0.18. The 95 percent confidence interval ranges from negative 13.43 to 2.56. This result is not statistically significant.
For lyceum education, the coefficient is negative 3.42, with a standard error of 3.99. The t-value is negative 0.86, and the p-value is 0.39. The 95 percent confidence interval ranges from negative 11.24 to 4.40. This result is not statistically significant.
For college education, the coefficient is negative 3.72, with a standard error of 4.24. The t-value is negative 0.88, and the p-value is 0.38. The 95 percent confidence interval ranges from negative 21.04 to 4.59. This result is not statistically significant.
For university education, the coefficient is negative 0.42, with a standard error of 4.07. The t-value is negative 0.01, and the p-value is 0.94. The 95 percent confidence interval ranges from negative 8.04 to 7.95. This result is not statistically significant.
For postgraduate (master or P h D) education, the coefficient is 10.37, with a standard error of 5.13. The t-value is 2.03, and the p-value is 0.04. The 95 percent confidence interval ranges from 0.29 to 20.44. This result is statistically significant at the 5 percent level, indicated by two asterisks.
For urban, the coefficient is negative 1.05, with a standard error of 1.08. The t-value is negative 0.98, and the p-value is 0.33. The 95 percent confidence interval ranges from negative 3.17 to 1.06. This result is not statistically significant.
For I D P, the coefficient is 2.90, with a standard error of 1.23. The t-value is 2.36, and the p-value is 0.01. The 95 percent confidence interval ranges from 0.48 to 5.31. This result is statistically significant at the 5 percent level, indicated by two asterisks.
For male, the coefficient is negative 1.67, with a standard error of 1.05. The t-value is negative 1.59, and the p-value is 0.11. The 95 percent confidence interval ranges from negative 3.73 to 0.39. This result is not statistically significant.
For 2010, the coefficient is 7.21, with a standard error of 1.83. The t-value is 3.94, and the p-value is 0.00. The 95 percent confidence interval ranges from 3.62 to 10.80. This result is statistically significant at the 1 percent level, indicated by three asterisks.
For 2017, the coefficient is 13.83, with a standard error of 3.90. The t-value is 3.54, and the p-value is 0.01. The 95 percent confidence interval ranges from 6.17 to 21.50. This result is statistically significant at the 1 percent level, indicated by three asterisks.
For 1945 to 1949, the coefficient is negative 5.20, with a standard error of 4.20. The t-value is negative 1.24, and the p-value is 0.21. The 95 percent confidence interval ranges from negative 13.45 to 3.04. This result is not statistically significant.
For 1950 to 1954, the coefficient is negative 4.63, with a standard error of 5.43. The t-value is negative 0.85, and the p-value is 0.39. The 95 percent confidence interval ranges from negative 15.30 to 6.02. This result is not statistically significant.
For 1955 to 1959, the coefficient is negative 0.43, with a standard error of 6.93. The t-value is negative 0.62, and the p-value is 0.53. The 95 percent confidence interval ranges from negative 17.91 to 9.30. This result is not statistically significant.
For 1960 to 1964, the coefficient is negative 7.35, with a standard error of 8.67. The t-value is negative 0.86, and the p-value is 0.39. The 95 percent confidence interval ranges from negative 24.36 to 9.65. This result is not statistically significant.
For 1965 to 1969, the coefficient is negative 11.16, with a standard error of 10.12. The t-value is negative 1.10, and the p-value is 0.27. The 95 percent confidence interval ranges from negative 31.55 to 9.21. This result is not statistically significant.
For 1970 to 1974, the coefficient is negative 12.10, with a standard error of 12.10. The t-value is negative 1.14, and the p-value is 0.25. The 95 percent confidence interval ranges from negative 37.46 to 9.99. This result is not statistically significant.
For 1975 to 1979, the coefficient is negative 13.73, with a standard error of 7.93. The t-value is negative 1.73, and the p-value is 0.08. The 95 percent confidence interval ranges from negative 29.74 to 2.28. This result is statistically significant at the 10 percent level, indicated by a single asterisk.
For 1980 to 1984, the coefficient is negative 12.74, with a standard error of 7.34. The t-value is negative 1.74, and the p-value is 0.08. The 95 percent confidence interval ranges from negative 26.17 to 0.67. This result is statistically significant at the 10 percent level, indicated by a single asterisk.
For 1985 to 1989, the coefficient is negative 17.08, with a standard error of 6.03. The t-value is negative 2.83, and the p-value is 0.00. The 95 percent confidence interval ranges from negative 29.61 to negative 4.55. This result is statistically significant at the 1 percent level, indicated by three asterisks.
For constant, the coefficient is 42.65, with a standard error of 9.75. The t-value is 4.37, and the p-value is 0.01. The 95 percent confidence interval ranges from 23.52 to 61.77. This result is statistically significant at the 1 percent level, indicated by three asterisks.
The mean dependent variable is 34.388. S D dependent variable is 25.05. R-squared is 0.06. The number of observations is 2224. F-test is 6.73. The probability greater than F is 0.000. Akaike crit. A I C is 20537.95. Bayesian crit B I C is 20669.21.
*** p < .01, ** p < .05, * p < .1
When the social psychological variables were entered in the model (see Table 5.6), the total variance explained by the model was significantly increased (adj R2 = 0.26). Interestingly, the effect of education became non-significant, which suggests that having a master or PhD probably makes people more resistant to succumbing to the ethos of conflict (captured by the social psychological variables). Similarly, the effect of IDP status became non-significant, which probably also suggests some mediation by social psychological variables. The effect of age squared remained close to significance and an age trend was also present. Some demographic variables also became significant, specifically Area of residency and gender. Males were more prejudiced compared to females and those living in urban areas were more prejudiced compared to those living in rural areas. The social psychological variables that are significant predictors in this model are quantity of contact, outgroup friendships and threats, all in the predicted direction. There was also a significant effect for religiosity, suggesting that TCs who are more religious are more prejudiced towards GCs. Finally, running an HAPC model with period and cohort as random effects revealed that age, age squared, period and cohort significant effects were present, with younger TCs and younger cohorts being related to more positive feelings towards GCs and 2010 and 2017 feelings being more positive than the 2007 feelings.
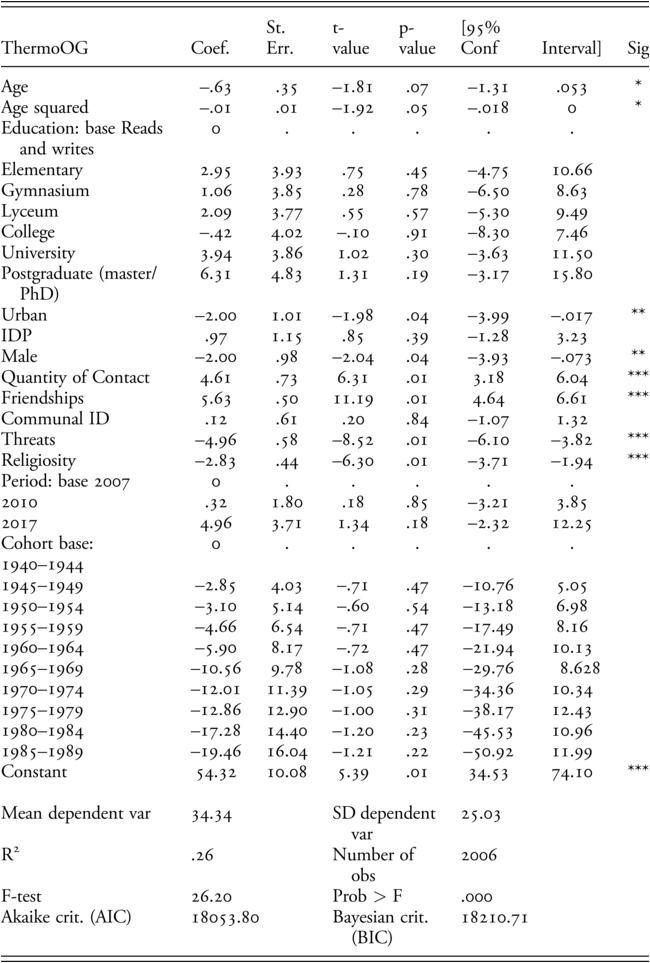
Table 5.6 Long description
The regression output table analyzes predictors of the variable labeled Thermo O G. Each row lists a predictor variable along with its coefficient, standard error, t-value, p-value, ninety-five percent confidence interval, and significance level.
For age, the coefficient is negative 0.63, with a standard error of 0.35. The t-value is negative 1.81, and the p-value is 0.07. The 95 percent confidence interval ranges from negative 1.31 to 0.053. This result is statistically significant at the 10 percent level, indicated by a single asterisk.
For age squared, the coefficient is negative 0.01, with a standard error of 0.01. The t-value is negative 1.92, and the p-value is 0.05. The 95 percent confidence interval ranges from negative 0.018 to 0. This result is statistically significant at the 10 percent level, indicated by a single asterisk.
For elementary education, the coefficient is 2.95, with a standard error of 3.93. The t-value is 0.75, and the p-value is 0.45. The 95 percent confidence interval ranges from negative 4.75 to 10.66. This result is not statistically significant.
For gymnasium education, the coefficient is 1.06, with a standard error of 3.85. The t-value is 0.28, and the p-value is 0.78. The 95 percent confidence interval ranges from negative 6.50 to 8.63. This result is not statistically significant.
For lyceum education, the coefficient is 2.09, with a standard error of 3.77. The t-value is 0.55, and the p-value is 0.57. The 95 percent confidence interval ranges from negative 5.30 to 9.49. This result is not statistically significant.
For college education, the coefficient is negative .042, with a standard error of 4.02. The t-value is negative 0.10, and the p-value is 0.91. The 95 percent confidence interval ranges from negative 8.30 to 7.46. This result is not statistically significant.
For university education, the coefficient is 3.94, with a standard error of 3.86. The t-value is 1.02, and the p-value is 0.30. The 95 percent confidence interval ranges from negative 3.63 to 11.50. This result is not statistically significant.
For postgraduate (master’s or P h D) education, the coefficient is 6.31, with a standard error of 4.83. The t-value is 1.31, and the p-value is 0.19. The 95 percent confidence interval ranges from negative 3.17 to 15.08. This result is statistically significant at the 5 percent level, indicated by two asterisks.
For urban, the coefficient is negative 2.00, with a standard error of 1.01. The t-value is negative 1.98, and the p-value is 0.04. The 95 percent confidence interval ranges from negative 3.99 to negative 0.017. This result is statistically significant at the 5 percent level, indicated by two asterisks.
For I D P, the coefficient is 0.97, with a standard error of 1.15. The t-value is 0.85, and the p-value is 0.39. The 95 percent confidence interval ranges from negative 1.28 to 3.23. This result is not statistically significant.
For male, the coefficient is negative 2.00, with a standard error of 0.98. The t-value is negative 2.04, and the p-value is 0.04. The 95 percent confidence interval ranges from negative 3.93 to negative 0.073. This result is statistically significant at the 5 percent level, indicated by two asterisks.
For the quantity of contact, the coefficient is 4.61, with a standard error of 0.73. The t-value is 6.31, and the p-value is 0.01. The 95 percent confidence interval ranges from 3.18 to 6.04. This result is statistically significant at the 1 percent level, indicated by three asterisks.
For friendships, the coefficient is 5.63, with a standard error of 0.50. The t-value is 11.19, and the p-value is 0.01. The 95 percent confidence interval ranges from 4.64 to 6.61. This result is statistically significant at the 1 percent level, indicated by three asterisks.
For communal I D, the coefficient is 0.12, with a standard error of 0.61. The t-value is 0.20, and the p-value is 0.84. The 95 percent confidence interval ranges from negative 1.07 to 1.32. This result is not statistically significant.
For threats, the coefficient is negative 4.96, with a standard error of 0.58. The t-value is negative 8.52, and the p-value is 0.01. The 95 percent confidence interval ranges from negative 6.10 to negative 3.82. This result is statistically significant at the 1 percent level, indicated by three asterisks.
For religiosity, the coefficient is negative 2.83, with a standard error of 0.44. The t-value is negative 6.30, and the p-value is 0.01. The 95 percent confidence interval ranges from negative 3.71 to negative 1.94. This result is statistically significant at the 1 percent level, indicated by three asterisks.
For 2010, the coefficient is 0.32, with a standard error of 1.80. The t-value is 0.18, and the p-value is 0.85. The 95 percent confidence interval ranges from negative 3.21 to 3.85. This result is not statistically significant.
For 2017, the coefficient is 4.96, with a standard error of 3.71. The t-value is 1.34, and the p-value is 0.18. The 95 percent confidence interval ranges from negative 2.32 to 12.25. This result is not statistically significant.
Cohort (base: 1940 to 1944)
For 1945 to 1949, the coefficient is negative 2.85, with a standard error of 4.03. The t-value is negative 0.71, and the p-value is 0.47. The 95 percent confidence interval ranges from negative 10.76 to 5.05. This result is not statistically significant.
For 1950 to 1954, the coefficient is negative 3.10, with a standard error of 5.14. The t-value is negative 0.06, and the p-value is 0.54. The 95 percent confidence interval ranges from negative 13.18 to 6.98. This result is not statistically significant.
For 1955 to 1959, the coefficient is negative 4.66, with a standard error of 6.54. The t-value is negative 0.71, and the p-value is 0.47. The 95 percent confidence interval ranges from negative 17.49 to 8.16. This result is not statistically significant.
For 1960 to 1964, the coefficient is negative 5.90, with a standard error of 8.17. The t-value is negative 0.72, and the p-value is 0.47. The 95 percent confidence interval ranges from negative 21.94 to 10.13. This result is not statistically significant.
For 1965 to 1969, the coefficient is negative 10.56, with a standard error of 9.78. The t-value is negative 1.08, and the p-value is 0.28. The 95 percent confidence interval ranges from negative 29.76 to 8.628. This result is not statistically significant.
For 1970 to 1974, the coefficient is negative 12.01, with a standard error of 11.39. The t-value is negative 1.05, and the p-value is 0.29. The 95 percent confidence interval ranges from negative 34.36 to 10.34. This result is not statistically significant.
For 1975 to 1979, the coefficient is negative 12.86, with a standard error of 12.90. The t-value is negative 1.00, and the p-value is 0.31. The 95 percent confidence interval ranges from negative 38.17 to 12.43. This result is not statistically significant.
For 1980 to 1984, the coefficient is negative 17.28, with a standard error of 14.40. The t-value is negative 1.20, and the p-value is 0.23. The 95 percent confidence interval ranges from negative 45.53 to negative 10.96. This result is not statistically significant.
For 1985 to 1989, the coefficient is negative 19.46, with a standard error of 16.04. The t-value is negative 1.21, and the p-value is 0.22. The 95 percent confidence interval ranges from negative 50.92 to negative 11.99. This result is not statistically significant.
For Constant, the coefficient is 54.32, with a standard error of 10.08. The t-value is 5.39, and the p-value is 0.01. The 95 percent confidence interval ranges from 34.53 to 74.10. This result is statistically significant at the 1 percent level, indicated by three asterisks.
The mean dependent variable is 34.34. S D dependent variable is 25.03. R-squared is 0.26. The number of observations is 2006. F-test is 26.20. The probability greater than F is 0.000. Akaike crit. A I C is 18053.80. Bayesian crit B I C is 18210.71.
*** p < .01, ** p < .05, * p < .1
Predicting Intergroup Trust, Support for Bizonal Bicommunal Federation and Renewed Cohabitation
Applying the same analytical strategy with three additional outcome variables, the findings are generally in the same direction as the findings about feelings towards the other community reported in the previous section (Table 5.7).
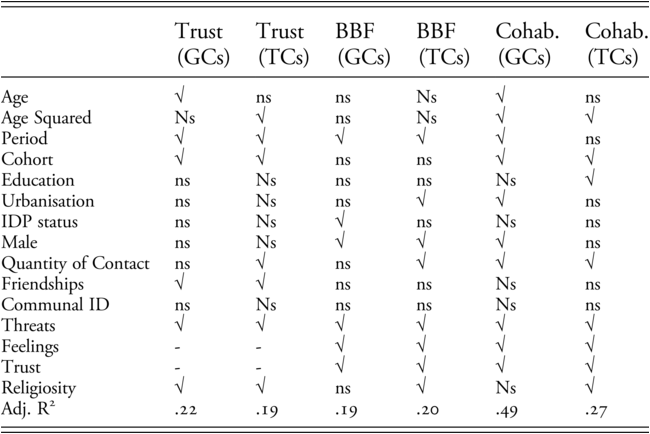
√: Significant ns: Non Significant
Predicting Trust towards TCs in the Greek Cypriot Community
From the basic model testing only the demographic variables as predictors and treating period and cohort as fixed effects, a significant finding is revealed only for education and gender. Those with a master or PhD are more trustful of TC ordinary people compared to the uneducated. Male participants are more likely to exhibit trust compared to women. The total variance explained by this model was adj R2 = .04.
When the social psychological variables were entered in the model, the total variance explained by the model was significantly increased (adj R2 = .22). Interestingly, age and cohort became significant with older people and those of older cohort showing significantly higher levels of trust compared to younger participants and generations. Indeed, HAPC analysis treating both period and cohort as random effects revealed that there were significant random effects for both variables and a significant effect for age. The social psychological variables that are significant predictors in this model were outgroup friendships and threats in the expected direction. Religiosity was also significant, indicating that those who considered religion important in their life were more likely to show less trust towards TCs.
Predicting Trust towards GCs in the Turkish Cypriot Community
From the basic model testing only the demographic variables as predictors and treating period and cohort as fixed effects, a significant finding is revealed for age squared, area of residency and period. Those living in urban areas showed more trust compared to those living in rural areas. The mean score for data collected in 2010 on the dependent variable was significantly higher compared to the same in 2007. The total variance explained by this model was adj R2 = .08.
When the social psychological variables were entered in the model, the total variance explained by the model was significantly increased (adj R2 = .19). Interestingly, age squared remained significant, but area of residence became non-significant. An HAPC analysis treating both period and cohort as random effects revealed that there were significant random effects for both whilst the age squared effect was still significant. The predicted values of intergroup trust indicated an increased trust in the younger compared to the older cohorts, with a higher rate of increase for cohorts 3–6. Predicted values of intergroup trust were also higher in both the 2010 and 2017 period compared to the same in 2007. The social psychological variables that are significant predictors in this model were quantity of contact and outgroup friendships and threats all in the expected direction. There was also a significant finding for religiosity with those who were more religious being less trustful of members of the other community.
Predicting Acceptance of BBF in the Greek Cypriot Community
From the basic model we see that education, IDP status, gender and period are significant predictors. Higher education (and especially having a master or PhD) increases the odds of acceptance of BBF compared to the odds of no support for BBF. For example, the odds for acceptance of BBF by a master or PhD holder is almost three times (2.89) the odds of somebody who only reads and writes. The male’s odds of accepting BBF are 1.5 times compared to females. The odds of accepting BBF being IDP is 1.19 times the odds of supporting BBF when not being IDP. The findings from this model are significant because, when controlling for period, there is neither an age nor a cohort effect that would show diminishing possibilities for support for BBF in the younger generations as one might expect from our discussion in the previous chapter, and that a partitionist mentality in the Greek Cypriot community seems to be more closely linked with the younger generation and the findings in this chapter about a generational gap in prejudice and trust levels in the GC community. All these go to suggest that the model of BBF is a versatile model of governance that accommodates both centrifugal and centripetal ways of thinking about the future institutional governance of Cyprus.
The effects of period were, however, significant given that acceptance of BBF increased steadily in the period 2007–2017. This increasing trend is in fact continuing after the year 2017 according to more recent research findings (Psaltis et al., Reference Psaltis, Halperin, Loizides, Stefanovic, Leshem and Cakal2021). In fact, the increasing support in recent years is clearly linear (58.1% in 2018, 65% in 2019, 76% in 2020 and 80.5% in 2023) (see also Appendix A), which suggests large dependence on recent political developments.
When the social psychological variables were entered in the models, the total variance explained by the model was significantly increased (pseudo R2 = .137). Interestingly, the IDP status, gender and period effects remained significant, but education became non-significant, which suggests that probably education is having its effects on the outcome (acceptance of BBF) through the social psychological variables that are significant predictors in this model. These are feelings towards the other community (prejudice), intergroup trust and threats.
Predicting Acceptance of BBF in the Turkish Cypriot Community
From the basic model we see that gender, area of living (urban or rural) and period are significant predictors. Living in an urban area increases the odds of acceptance of BBF compared to the odds for those living in rural areas. For example, the odds for acceptance of urban dwellers are 1.32 times the odds for somebody who lives in rural areas. The male’s odds of accepting BBF are 1.22 times compared to females. In the period 2007–2017 there is, as in the case of GCs, a significant increase in the percentage of people who would accept BBF.
The period effect was significant and its effect of big magnitude with a significant linear improvement in the period 2007–2017. Data from the later period (2020–2023) (see Appendix A) suggest that there was a decrease in acceptance levels of BFF at 71.2%, which might relate to the policy turn of newly elected Ersin Tatar, backed by Turkey, away from BBF and towards recognition of separate sovereignty for TCs or two states but the acceptance bounced back (79.8%) in 2023.
When the social psychological variables were entered in the model, the total variance explained by the model was significantly increased (pseudo R2 = 0.19). Interestingly, the area of residency, gender and period effects remained significant. The social psychological variables that are significant predictors in this model are quantity of contact and intergroup trust in the expected direction. There was also a significant finding for religious importance with more religious people being less likely to support BBF.
Predicting Willingness for Renewed Cohabitation in the Greek Cypriot Community
From the basic model testing only the demographic variables as predictors and treating period and cohort as fixed effects, a significant finding is revealed for age and age squared, gender, place of residence (urban or rural) and period. Male participants, those living in urban areas and older GCs are more likely to support renewed cohabitation. Also, the mean score for data collected in 2010 on the dependent variable was significantly lower compared to the same in 2007. The total variance explained by this model was adj R2 = .08.
When the social psychological variables were entered in the model, the total variance explained by the model was significantly increased (adj R2 = .49). Interestingly, age and age squared, gender, place of residence (urban or rural) and period effects remained significant. Additionally, a significant cohort effect was revealed. Indeed, HAPC analysis treating both period and cohort as random effects revealed that there were significant random effects for both variables, with older participants being more ready for renewed cohabitation compared to younger. The social psychological variables that are significant predictors in this model were quantity of contact, feelings towards the other community (prejudice), intergroup trust and threats all in the expected direction.
Predicting Willingness for Renewed Cohabitation in the Turkish Cypriot Community
From the basic model testing only the demographic variables as predictors and treating period and cohort as fixed effects, a significant finding is revealed for age squared, education and period. More educated and younger TCs are more likely to support renewed cohabitation. Also, the mean score for data collected in 2010 and 2017 on the dependent variable was significantly higher compared to the same in 2007, exhibiting an increasing linear trend of support for cohabitation in time. The total variance explained by this model was adj R2 = .04).
When the social psychological variables were entered in the model, the total variance explained by the model was significantly increased (adj R2 = .27). Interestingly, age squared and education effects remained significant, but period effects became non-significant. An HAPC analysis treating both period and cohort as random effects revealed that there were significant random effects only for cohort, whilst the age squared effect became non-significant. The predicted values of cohabitation indicated an increased appetite for renewed cohabitation in the younger compared to the older cohorts. The social psychological variables that are significant predictors in this model were feelings towards the other community (prejudice), intergroup trust and threats all in the expected direction. There was also a trend for those having more contact to be more ready for renewed cohabitation, whilst those who were more religious tended to be less ready for cohabitation.
Summary of Findings and Policy Implications for CBMs, BBF Design and Referendums
All in all, the findings suggest that the social psychological variables of prejudice, trust, threats and contact play a crucial role in regulating the wish for renewed cohabitation and, to a lesser extent, the acceptance of BBF that appears to depend also on political developments and IDP status for GCs (on IDPs and their stance, see Psaltis et al., Reference Psaltis, Cakal, Loizides and Kuşçu Bonnenfant2020). As the negative role of prejudice and distrust is important, policymakers need to realise that there are two major routes for prejudice reduction, intergroup contact and threat reduction, and they both depend on mood in public debate in the media (Avraamidou & Psaltis, 2020; Karayianni & Psaltis, Reference Karayianni and Psaltis2023) and, in the longer term, on good-quality education mostly at the post-graduate level and probably study experiences abroad. Despite the presence of ethnocentric narratives in both communities, education has a positive impact on prejudice reduction. The fact that the effects are more pronounced at the higher levels of education is suggestive of the greater potential of higher education to become critical and reflective of master narratives of conflict compared to the elementary and secondary schools that are still hostages to the propaganda of master narratives.
Cohort effects can be located in the GC community for both prejudice, trust towards TCs and wish for renewed cohabitation showing an increasing alienation of the younger generation of GCs from the other community. On the contrary, the older generation of TCs is more alienated from GCs. Alienation from the other community in terms of trusting relations is higher in rural compared to urban areas where more traditional and conservative values (religiosity included) create a heightened sense of difference through symbolic threats.
Positive period effects relating to decreasing prejudice and distrust since 2007 have been clearly present in the TC community and seem to be related to more contact opportunities with the GC community, thus deconstructing the enemy image that existed since intercommunal strife in the 1960s and the following separatist Rauf Denktas narrative that ‘we cannot live with Greek Cypriots’. Here it is interesting to note that after the Crans Montana failure in two measurements in 2020 and 2023, a majority of TCs for the first time stated that they could accept a unitary state, which also puts in question the policy followed by Ersin Tatar and Turkey recently. Of course, this is a policy not supported by the UN security council resolution on Cyprus, but it is indicative of a trend in the public that goes against the followed policy.
In the GC community there was a temporary worsening of prejudice in the year 2010, which probably relates to the isolation of the ruling leftist party which actively supported rapprochement efforts and the consequent reactionary backlash against the left (Trimikliniotis & Bozkurt, Reference Trimikliniotis and Bozkurt2012). Also, one year earlier, in 2009, saw the rise of nationalist Derviş Eroğlu as prime minister in the north, which could have also influenced the GC view about the wish of TCs for a solution. The period 2010–2012 was also marred by financial hardships and heightened xenophobic attitudes towards immigrants in the GC press (see Kadianaki et al., Reference Kadianaki, Avraamidou, Ioannou and Panagiotou2018), which might have spilled over to bicommunal attitudes also. The election of Mustafa Akinci in 2015, however, completely reversed this picture with an impressive improvement of attitudes that still holds until today, even after the Crans Montana failure. These findings point to an important regulator of prejudice levels in each community which has to do with the outcome of elections, beyond any effects of contact well documented already. When a pro-reconciliation leader is elected in one community on a clear mandate for a compromise solution like BBF, there seems to be a positive impact on the public opinion of the other community, since they probably read the positive outcome of the elections as a collective will for peace within the out-group, thus reducing threats. It is interesting to note here that the election of nationalist Ersin Tatar in 2020 did not seem to negatively influence the emotions of GCs towards TCs, which is probably due to the fact that Mustafa Akinci lost the election by fewer than 5,000 votes and only after significant intervention from Ankara in favour of Tatar, which was interpreted by GCs as not a significant change of the will of the TC laypeople for peace.
Attitude towards BBF mostly depends on two factors. The first is social psychological relating to contact and reduced prejudice, threats and distrust. The second is political developments in the last 20 years that increased the federalist mentality of the two communities, even partly through pragmatic concerns relating to regional tensions or the legitimate wish to return to lost homes among older GC IDPs for whom the emotional connection with their lost home is still alive (see Psaltis et al., Reference Psaltis, Cakal, Loizides and Kuşçu Bonnenfant2020). The increasing alienation of the younger generations of GCs from TCs registered in this and the previous chapter seems to leave unchanged the increasing support for BBF in the past few years. One could legitimately hypothesise, given the versatility of interpretations BBF can accommodate, that a more decentralised form of BBF and bizonality would not be particularly repulsive to the younger generation of GCs compared to the older generation of the same community, given their higher alienation levels from TCs. A decentralised federation might be more acceptable if there were a referendum tomorrow, but of course this does not mean it will be the best model in the long term for the sustainability of the future of reunited Cyprus. What is certain from the current findings in Appendices A and B is that the only model supported by the UN resolution and that could be accepted by a clear majority in both communities is that of BBF.
When it comes to referendums, the dynamics of the voters’ decisions will naturally depend on prejudice levels, trust, stance on renewed cohabitation and BBF, but there are additional factors that will need to be taken into account like the Yes and No campaigns organisation and content, their funding and dynamic, the stance of political parties, not to mention interference by foreign states, influence from political leaders and, of course, the final content of the peace package (Loizides, Reference Loizides2014). In some of our research we asked people of the two communities about their general stance on a possible referendum scenario at various points in time (see Appendices A and B, Figures A.7 and B.7). Despite the variability observed, which partially depends on the state of public debate about the negotiations at a given point, some observations are noteworthy. For example, there was a negative turn around January 2017 (Avraamidou & Psaltis, 2020) in the GC press compared to a much more positive climate in 2015 and 2016 (see Karayianni & Psaltis, Reference Karayianni and Psaltis2023), which is reflected in Figure A.7 of Appendix A. However, by April 2017, and only three months before Crans Montana, those trending to Yes in the GC community were almost double those trending to No. Beyond the aforementioned fluctuation, it is worthwhile noting that in the GC community the dominant trend was for those trending to Yes to outnumber those who trended to No by a 2:1 ratio.Footnote 10 In the TC community the picture was generally not so hopeful, which, compared to the results of the referendum in 2004, was suggestive of a reversal that might have given Akinci a hard time if there was eventually a referendum. Given lower prejudice levels towards GCs in the TC community recently compared to 2007, we have to conclude that the negative stance of TCs on referendum had to do with some provisions in the Guterres framework that they found difficult to accept, and not the quality of their intercommunal relations.
However, beyond speculation, what is more important in the case of exploring referendum intentions is to specify as concretely as possible the content of the peace package before asking people to position themselves with a Yes or a No. In our most recent research we applied the method of conjoint analysis to do exactly that in specifying varieties of all dimensions of the Guterres framework, and we were in a position to identify at least two variations in the framework that could garner a majority vote in both communities simultaneously (see Loizides et al., Reference Loizides, Psaltis, Morgan-Jones, Sudulich, Popp and Baykiz2022). Online dialogues that are now made possible by AI-facilitated platforms can also offer quick and valuable feedback to policymakers about the wish of the two communities and the formulation of a peace package that will be accepted by both communities in a referendum.Footnote 11
Immediate and long-term CBMs with direct impact on the core mediating variables of our findings (e.g. threats) are of crucial importance, as they will facilitate reconciliation prefiguring a reunited Cyprus. The implementation of microgenetic processes through intergroup contact and the revision of one-sided victimisation narratives need to take priority. Our ideas of intergroup contact as microgenesis were recently applied in post-settlement Colombia (Fonseca & Jovchelovitch, Reference Fonseca and Jovchelovitch2024), where urban university students lived for 11 days with former guerillas in rural areas, with impressive transformations of the representations of students about their identities as peacemakers, deconstructing the enemy image of the other and the representation of peace and reconciliation itself. A similar programme of hospitality in houses of the other community on a mass scale can be designed in Cyprus in the pre-settlement period, which is expected to bring the positive effects of contact at massive levels in a short time through direct and indirect forms of contact (Yucel & Psaltis, Reference Yucel and Psaltis2020; Donno et al., Reference Donno, Psaltis and Zarpli2021).
Such CBMs are needed not only to prepare the ground for renewed negotiations and a successful outcome but also for the longer sustainability of living together and co-operating in a BBF. In this sense it is very unfortunate that the IMAGINE programme was halted and that the two communities did not find the way to promote history teaching on both sides of the divide free from nationalistic and one-sided victimisation narratives. One idea that is gaining support in both communities of CyprusFootnote 12 is the writing of school history textbooks by a group of historians and educators from both communities. About 70% of respondents from the GC community and 82% from the TC community accepted this idea in 2023. These high levels of acceptance were another indicator of the positive transformation that took place after the opening of the checkpoints in terms of bicommunal relations and the work of the AHDR in civil society that started more than 20 years prior.
The current statistics about the frequency of checkpoint crossings can also be significantly improved. In the same bicommunal research completed in 2023 (see Appendix B, Table B.1 for its methodology) mentioned in the previous paragraph we also asked two questions relating to crossings. The first was if they visited the other side after the opening of checkpoints in 2003 and, if yes, how many times. In the GC community 31% never crossed to the north of the divide. Those who have crossed only once accounted for 18.9% of the group, 22.7% crossed two to three times, 9.4% crossed four to six times and 18% crossed seven or more times. In the TC community, 19.5% never crossed, 8.1% crossed once, 8.8% crossed two to three times, 6.9% crossed four to six times and 56.6% crossed seven or more times.
Table 5.8 suggests that the stigmatisation of crossing to the north still holds for the majority of the GC community, who either never crossed or crossed only once and did not intend to cross again. Only about 30% of GCs cross at least a few times a year with some regularity. In the TC community the situation is much different, with less than 20% having never crossed, and among those who do, 84% cross at least a few times a year. This translates into about 68% of the overall population crossing regularly. There is even a small percentage (1.4%) of TCs who work in the south and cross on a daily basis.

Clearly there is much more to be done in the GC community to facilitate contacts between the two communities and de-stigmatise crossing to the north.
In terms of the demographic variables, the youth and women need to significantly increase their participation in discussions about the Cyprus problem and bicommunal activities, as well as people living in rural areas and people of lower socio-economic status. IDPs who have ‘skin in the game’ also need to be included in the negotiations. Obviously the educational systems can do much more in not only promoting contact and revising history textbooks or promoting multiperspectivity but also promoting civic education of students and increasing their knowledge about federal systems in the world and basic rules of their functioning. Given some spillover effects from the migration issue to the Cyprus issue, if negotiations are to restart, the xenophobic climate against migration that was purposefully cultivated by the previous government in the south through a securitisation discourse (Trimikliniotis, Reference Trimikliniotis2019; UNHCR-Cyprus, 2023) will need to be defused and alternative narratives of cultural enrichment through diversity and financial benefits will need to be promoted. A national strategy for integration of immigrants could go a long way in helping in this direction. The role of the media is crucial in reducing realistic and symbolic threats towards alterity more generally. Drastic measures in the media landscape in the direction of peace journalism are also urgently needed.
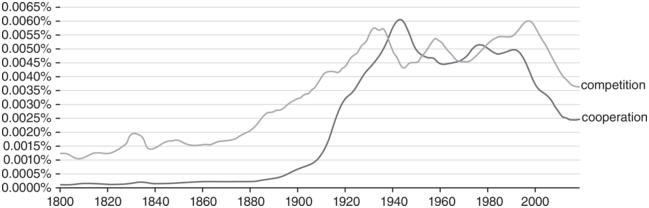
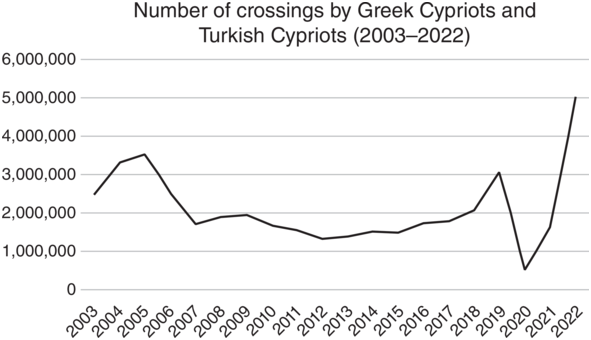


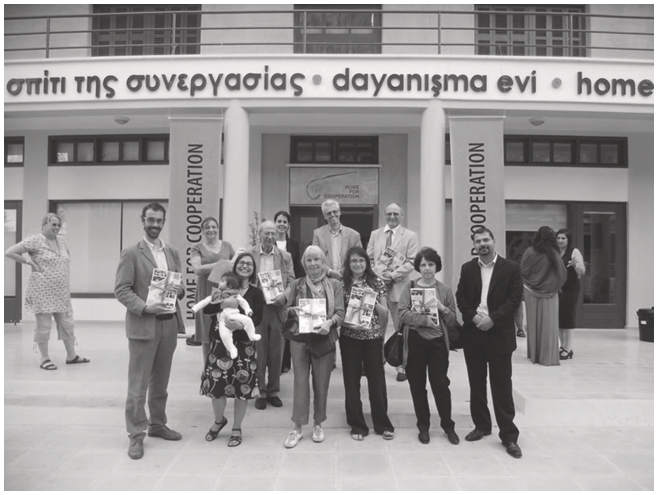


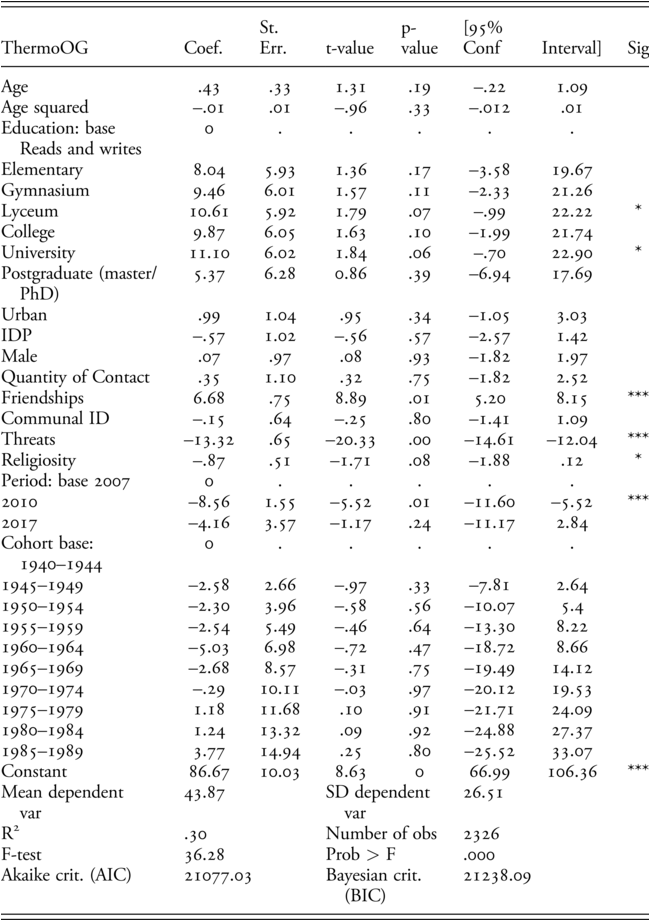
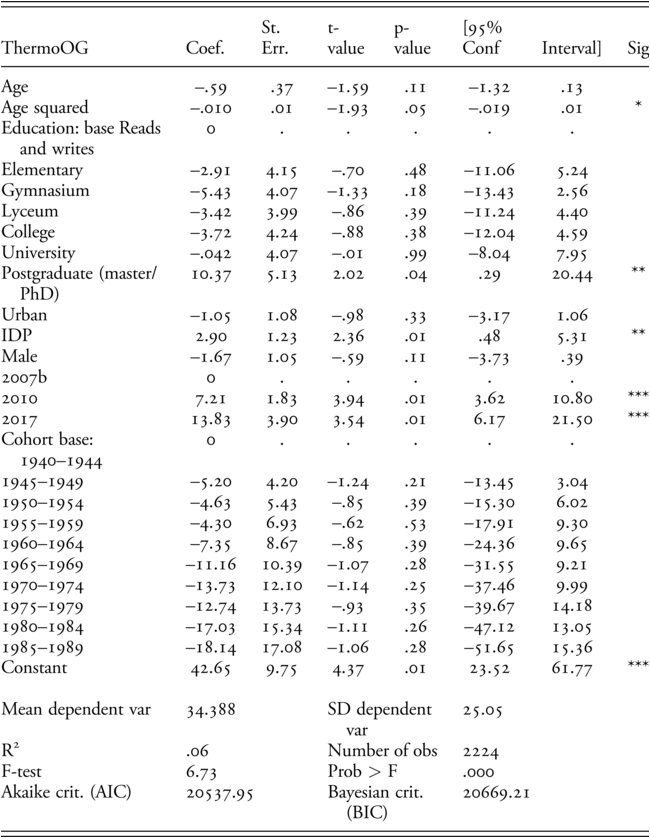


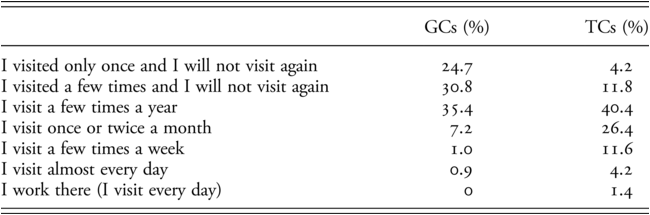

 Open access