


1. Introduction
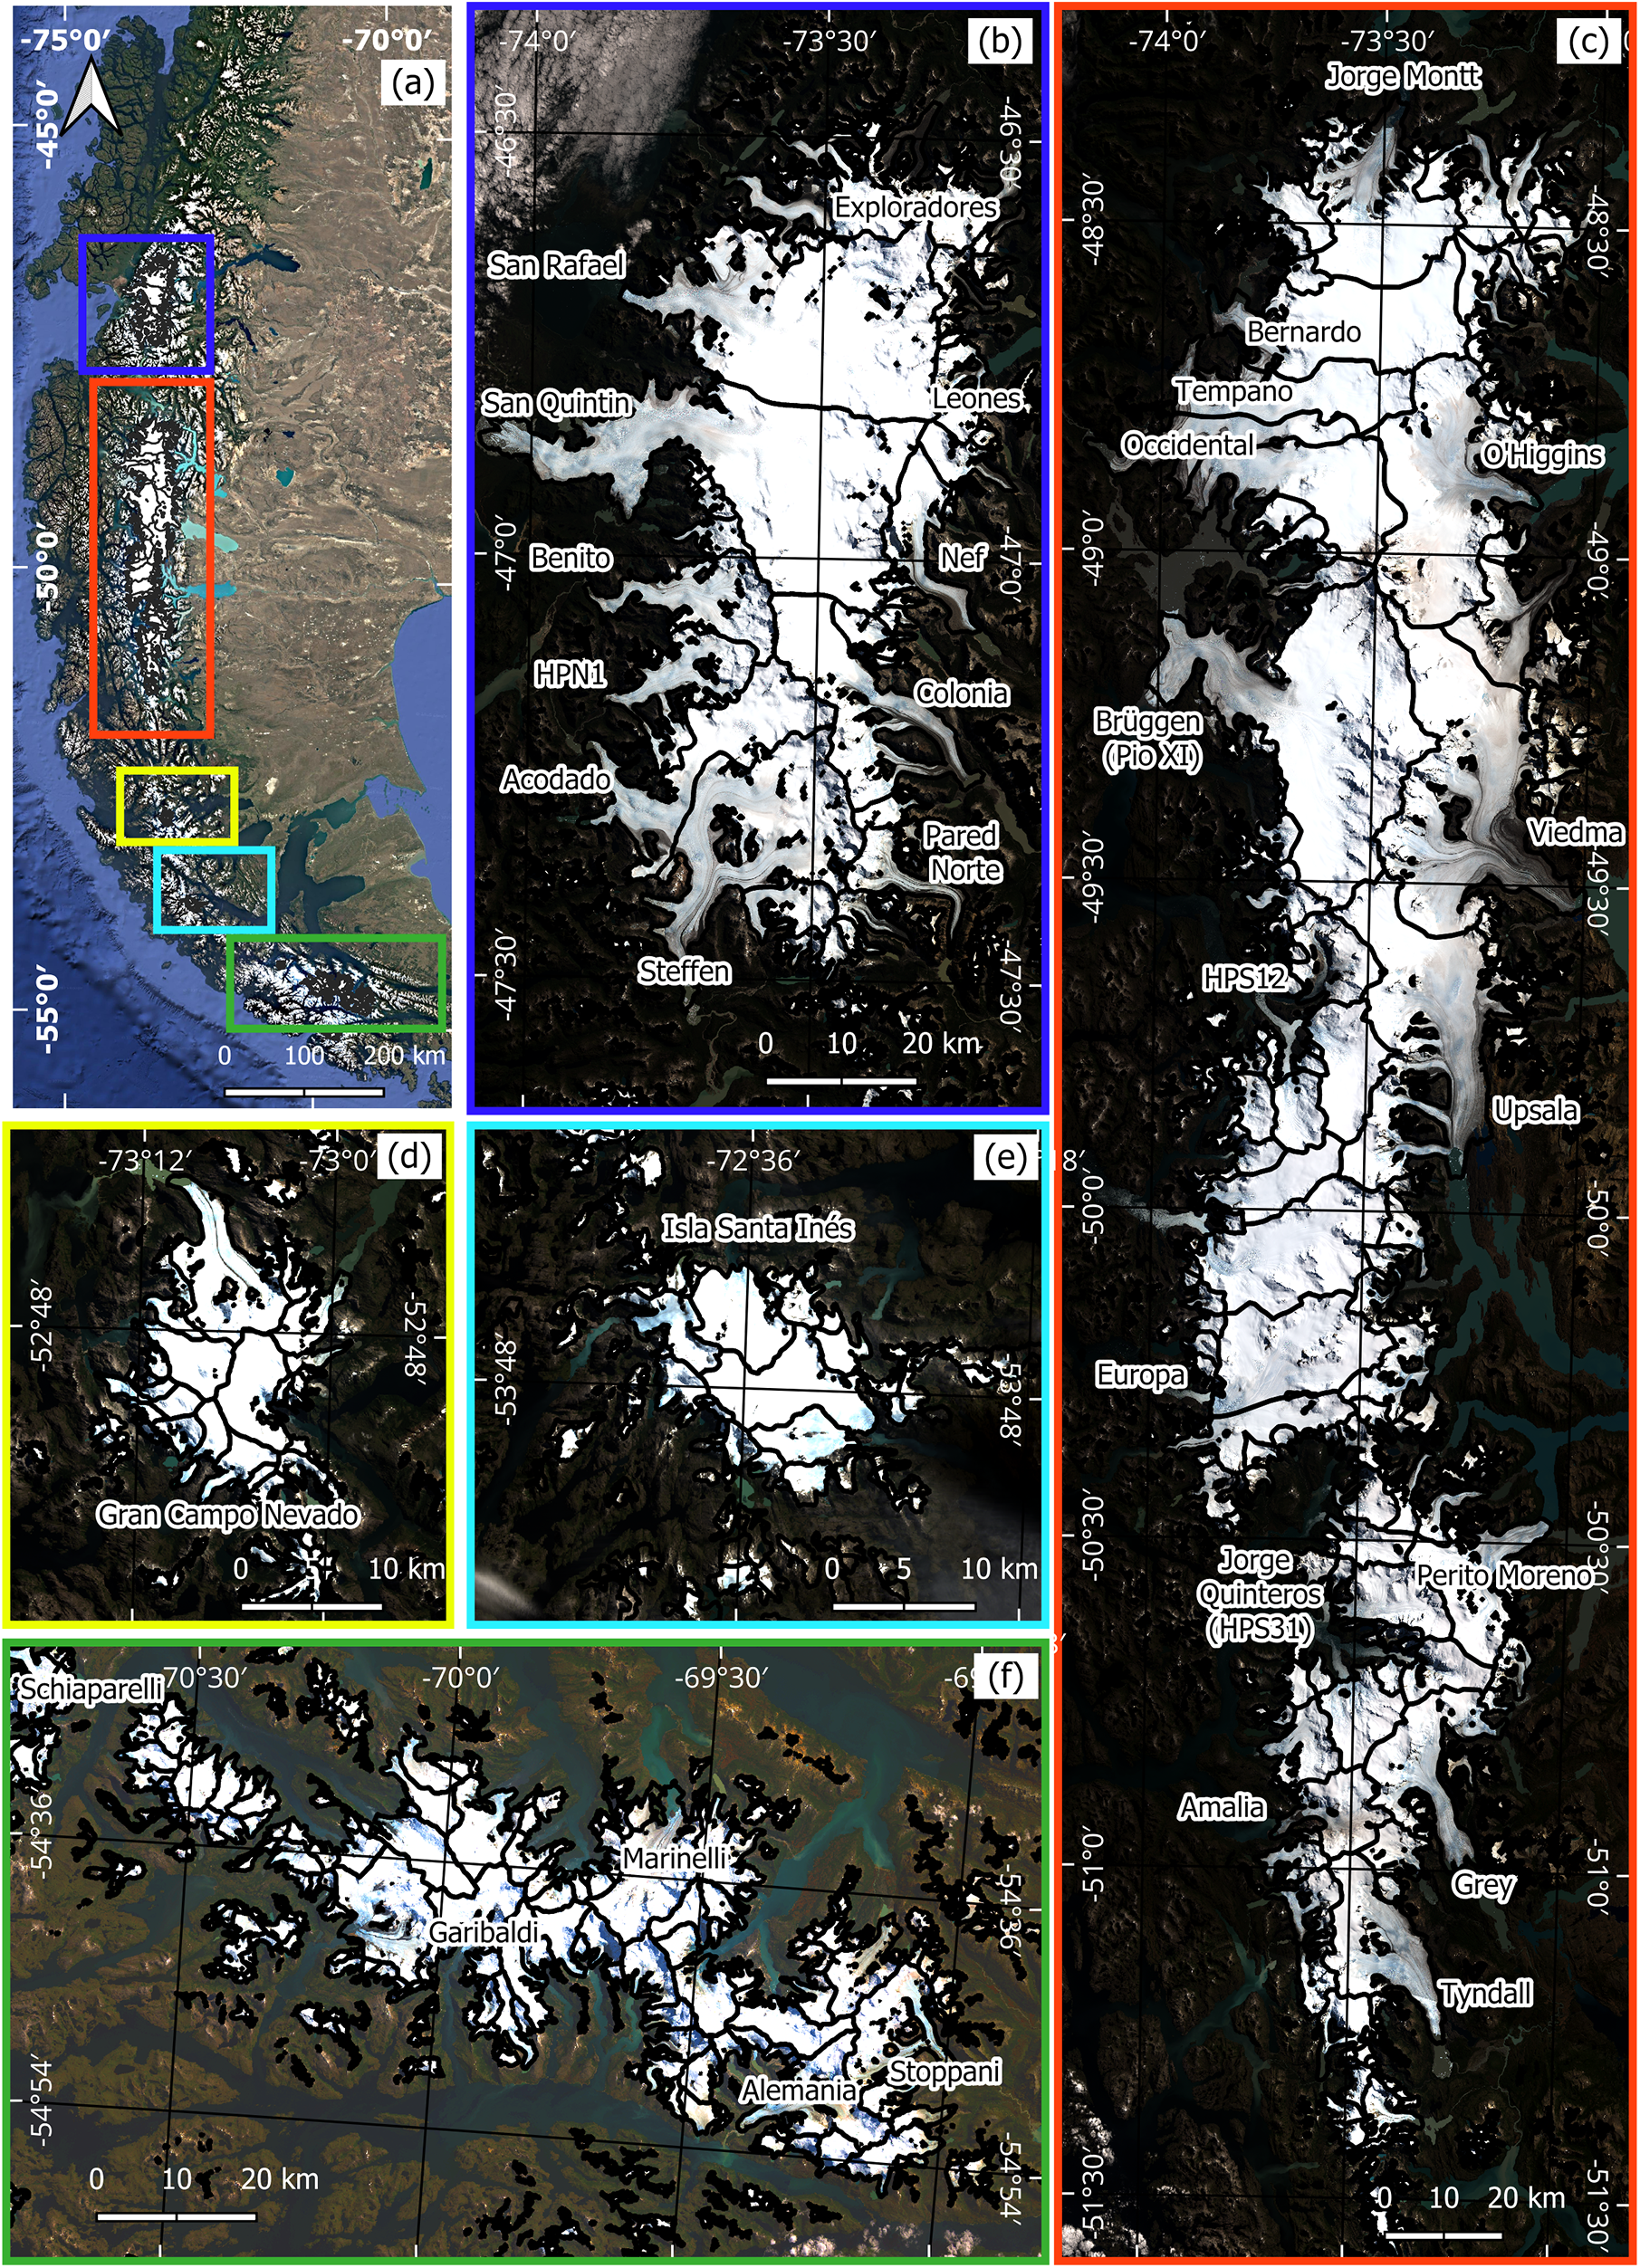
Glaciers within the Patagonia and Tierra del Fuego region—hereafter referred to as Fuego-Patagonia, a term established in the mid-19th century (Auer, Reference Auer1959)—span from 45°S to 56°S and cover approximately 25 000 km2. This region encompasses the largest icefields in the Southern Hemisphere outside of Antarctica, including the Northern and Southern Patagonia Icefields (NPI and SPI), the Cordillera Darwin and numerous peripheral glaciers, representing around 80% of the total glacierised area in South America (Pfeffer and others, Reference Pfeffer2014; Fig. 1).
(a) Location of Patagonia and Tierra del Fuego (background: Google Earth image); (b) Northern Patagonia Icefield (NPI); (c) Southern Patagonia Icefield (SPI); (d) Gran Campo Nevado (GCN); (e) Isla Santa Inés (ISI) and (f) Cordillera Darwin (background: Landsat images from 2016 to 2021). Panels (d) and (e) are shown within the yellow box in panel (a).

The Fuego-Patagonia glaciers are highly sensitive to climatic and environmental changes, as reflected in widespread negative trends in glacier area and surface elevation (Rivera and others, Reference Rivera, Benham, Casassa, Bamber and Dowdeswell2007; Braun and others, Reference Braun2019; Dussaillant and others, Reference Dussaillant2019). These dynamic changes drive several associated phenomena, such as increased debris coverage, landslides, glacial lake outburst floods and proglacial lake expansion (Iribarren and others, Reference Iribarren Anacona, Mackintosh and Norton2014; Glasser and others, Reference Glasser, Holt, Evans, Davies, Pelto and Harrison2016). Despite substantial advances in understanding the region’s glaciological evolution and its implications for climate and local communities, significant knowledge gaps remain. Key uncertainties persist in precipitation patterns (Bravo and others, Reference Bravo2019; Sauter, Reference Sauter2020), climatic mass balance estimation (Schaefer and others, Reference Schaefer, Machguth, Falvey, Casassa and Rignot2015), and ice thickness distribution (Fürst and others, Reference Fürst2024), particularly in areas lacking direct observational data (Minowa and others, Reference Minowa, Schaefer, Sugiyama, Sakakibara and Skvarca2021).
Addressing these challenges requires high-quality, freely accessible datasets that adhere to the Findable, Accessible, Interoperable and Reusable (FAIR) principles (Wilkinson and others, Reference Wilkinson2016). Open-access geospatial data—such as satellite imagery, terrain models and climate records—play a crucial role in improving glacier and glacio-hydrological models, quantifying glacier changes and evaluating potential hazards and sea-level rise contributions. Ensuring continuous access to such data fosters inclusivity in research, enables more accurate model refinement and enhances our understanding of glacial dynamics and their broader climatic implications.
The Fuego-Patagonia region offers a unique opportunity to study glacial responses to volcanic, tectonic, atmospheric and climatic variability in the Southern Hemisphere. Here, we introduce the QFuego-Patagonia dataset, the first freely available geospatial compilation for this region, integrated into a Geographic Information System (QGIS environment). Following the example set by initiatives such as Quantarctica and QGreenland (Matsuoka and others, Reference Matsuoka2021; Moon and others, Reference Moon, Fisher, Stafford and Thurber2023), this dataset consolidates and visualises essential data on Fuego-Patagonian glaciers to enhance accessibility and collaboration within the scientific community. By developing open, well-structured datasets, we aim to support widespread scientific inquiry and facilitate engagement from researchers, stakeholders and the broader public in discussions on the impacts of climate change in this region.
2. Methods
2.1. QFuego-Patagonia GIS data and web mapping portal
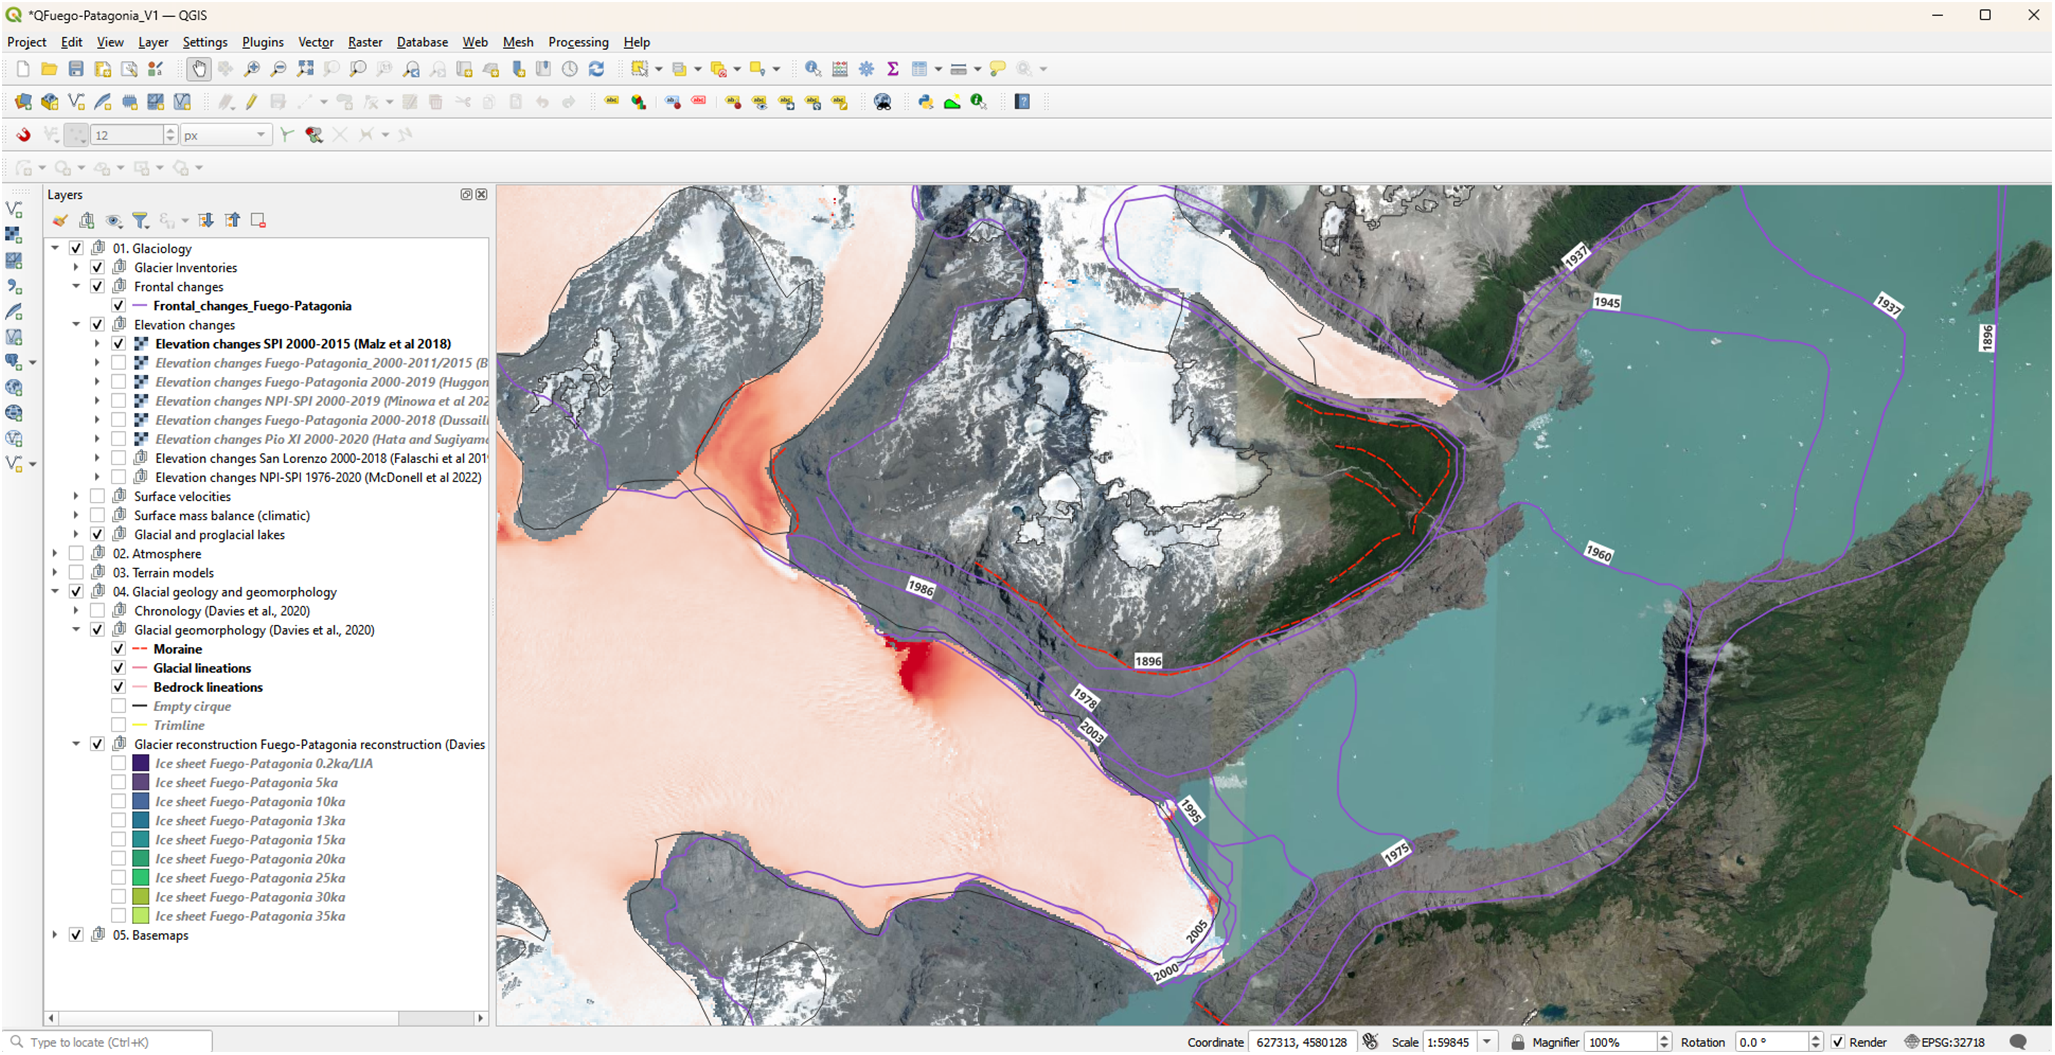
QFuego-Patagonia is both a free GIS data compilation for Tierra del Fuego and Patagonia and an interactive web portal that enables downloading data and conducting simple online analyses for this region. The free mapping tool and interactive website will support interdisciplinary research, teaching and scientific collaboration in Tierra del Fuego and Patagonia. The GIS data compilation comprises key glacier datasets in a unified, all-in-one open-source GIS environment, which can be visualised offline and online (Fig. 2). The interactive web portal contains the same dataset as the GIS dataset, allowing users to visualise the layers individually.
Example view of the QFuego-Patagonia dataset stored in QGIS (Figure 1c). The layers can be displayed by clicking on the selection box on the left. The colour scale represents the values of each specific field (e.g. the ‘elevation changes’ field). Users can display and rearrange the order of data layers that lie on top of basemaps, satellite imagery and terrain models at a user-chosen, continuously adjustable map scale.

2.2. Software selection
QGIS (https://qgis.org/) was chosen for the same purpose as the reference projects Quantarctica and QGreenland (Matsuoka and others, Reference Matsuoka2021; Moon and others, Reference Moon, Fisher, Stafford and Thurber2023). Aligned with the outlined methodology (Matsuoka and others, Reference Matsuoka2021), QGIS proves to be a valuable tool due to the following advantages: (i) it is freely available, (ii) compatible with most computer operating systems, (iii) usable offline, (iv) features a user-friendly interface, (v) offers a wide array of tools, (vi) supports common geographical data formats, (vii) enables advanced cartographic capabilities, (viii) allows for high-quality map production, (ix) is actively maintained and developed, (x) follows a transparent bug-fixing process, (xi) benefits from an active user community and extensive knowledge base and (xii) can be bundled with datasets for standalone offline use.
2.3. Data selection
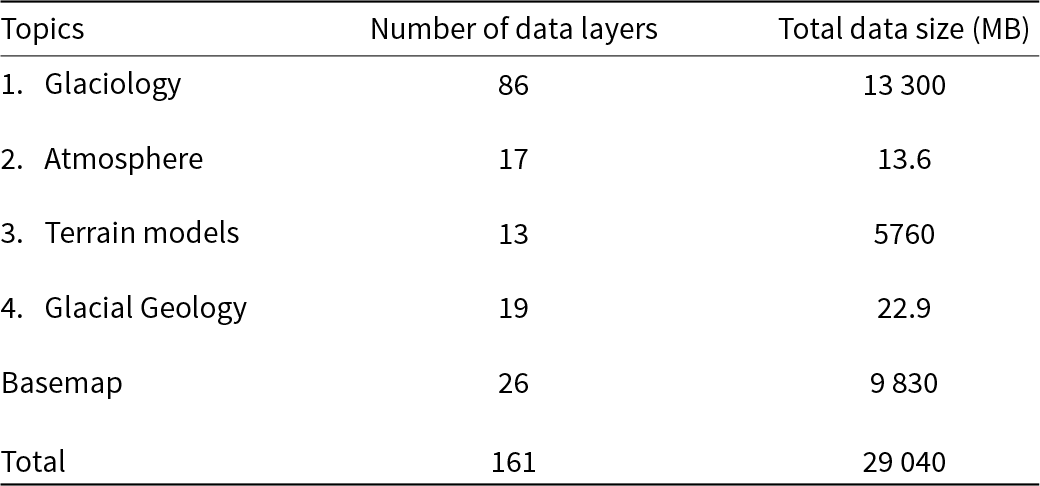
The interconnected disciplines in the scope of the QFuego-Patagonia project were identified and prioritised to build the database using a two-step methodology: (1) freely accessible and publicly available data in different repositories were reviewed, and then, (2) our project contributors and editorial team provided additional data from the included topics. In the first version, QFuego-Patagonia comprised 161 data layers, of which 135 represented four glacier-related scientific datasets (Table 1) to establish a long-term dataset that will require further revisions as future QFuego-Patagonia versions are developed. The first version consists of several regional datasets (e.g. atmosphere) that are compiled into a single dataset in upcoming versions to improve their usability. The data used for basemaps, satellite data and miscellaneous base layers were selected from a wide range of available products, prioritising those most up-to-date in terms of detail, integrity and relevance.
Overview of the topics and basemaps included in the QFuego-Patagonia dataset.

2.4. Mapping reference system and file format
The EPSG:32718 and EPSG:32719 coordinate systems were primarily used for this project, corresponding to UTM zones 18S and 19S. Also, the EPSG:4326 coordinate system was used to extend the study area (e.g. atmospheric data). The datasets were obtained from diverse sources, resulting in two file formats. To ensure uniformity, all vector data were maintained in Shapefile format, and all raster data were kept in GeoTIFF format. It is worth noting that, except for reprojection, the original data remains unchanged.
2.5. Metadata
The metadata contains an overview of the dataset’s general information, including references to the source scientific publication, comments and other details about the data. Additionally, it includes essential attributes such as dataset identification, the dataset’s categories, access information, licenses, restrictions on use, the dataset author’s contact information and a link to the project’s website. The quality and impact of datasets like QFuego-Patagonia heavily depend on freely accessible, contributed data. Therefore, we strongly encourage citing the original data source and QFuego-Patagonia when these are used in scientific work and publications. This citation information is provided in the abstract section of the metadata.
2.6. Implementation of the web mapping
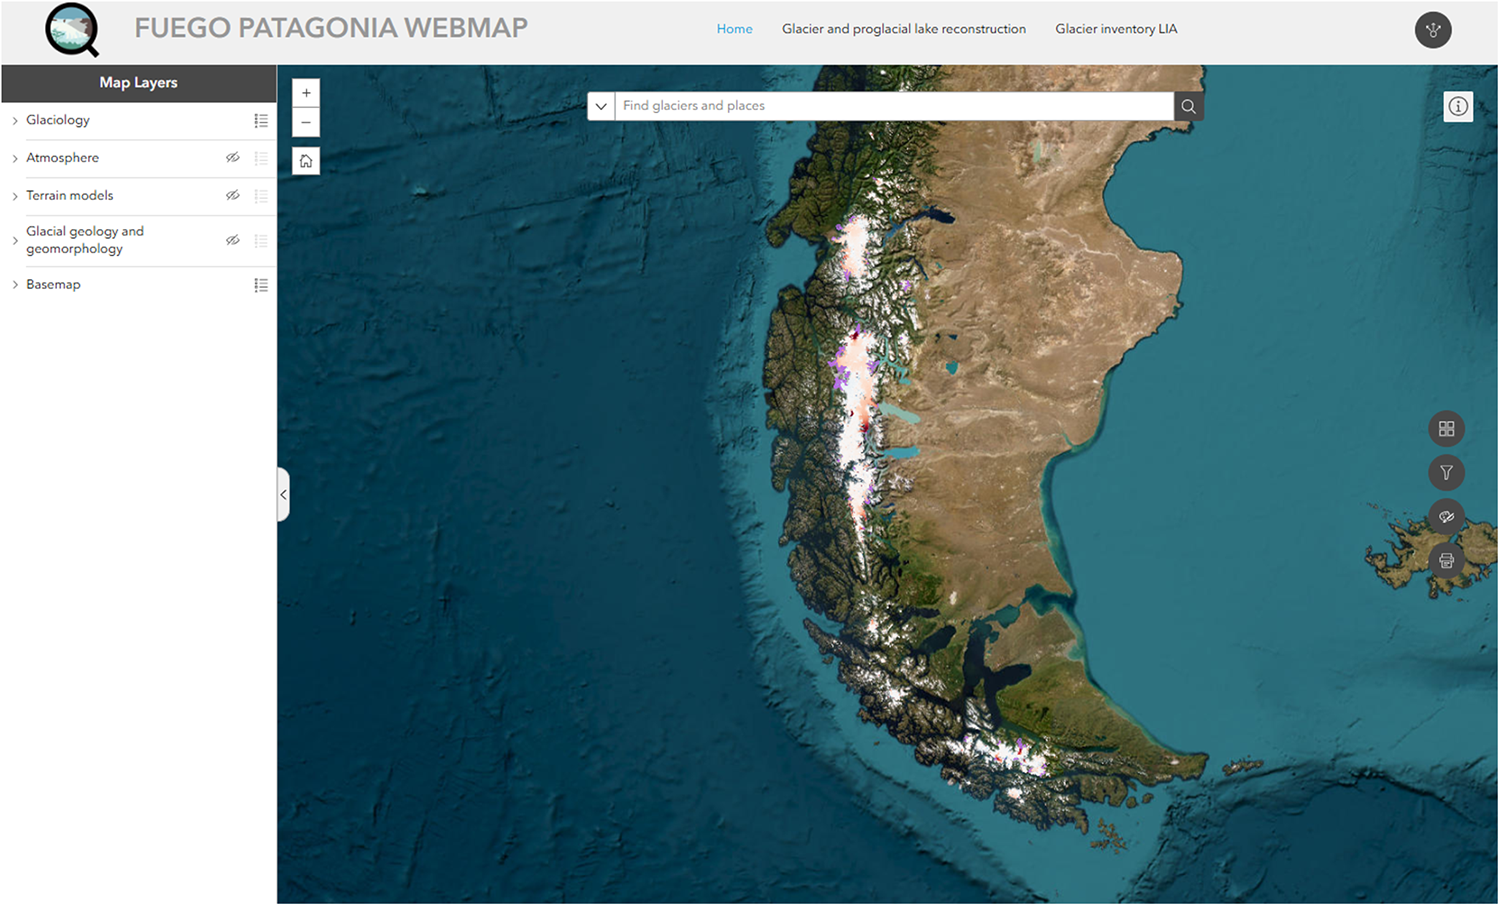
ESRI ArcGIS products were used to develop the web mapping interface for the QFuego-Patagonia platform (Fig. 3). First, the datasets were assembled on a single platform; second, the original files were adapted and modified to comply with ESRI system requirements, refining the scope and enhancing functionality. The project was consistently integrated into the online platform. To optimise performance, raster data were converted into image tile caches. Leveraging ArcGIS Experience Builder facilitated the seamless construction of the web map, eliminating the need for manual coding. This tool offers templates and an intuitive drag-and-drop interface, enabling the creation of immersive web experiences adaptable to diverse screen sizes.
Example view of the QFuego-Patagonia web map. This online map provides a visualisation of existing data, enabling easy, rapid analysis.

3. Datasets
The first version of the QFuego-Patagonia includes four glacier-related disciplines in a GIS environment (Fig. 2 and Table 1). All data layers are stored in a folder structure, allowing individual data files and their associated metadata to be easily located. The complete list of data included in QFuego-Patagonia is provided in Tables S1–S5. A user guide was also provided to adjust QGIS to the QFuego-Patagonia workspace.
3.1. Glaciology data
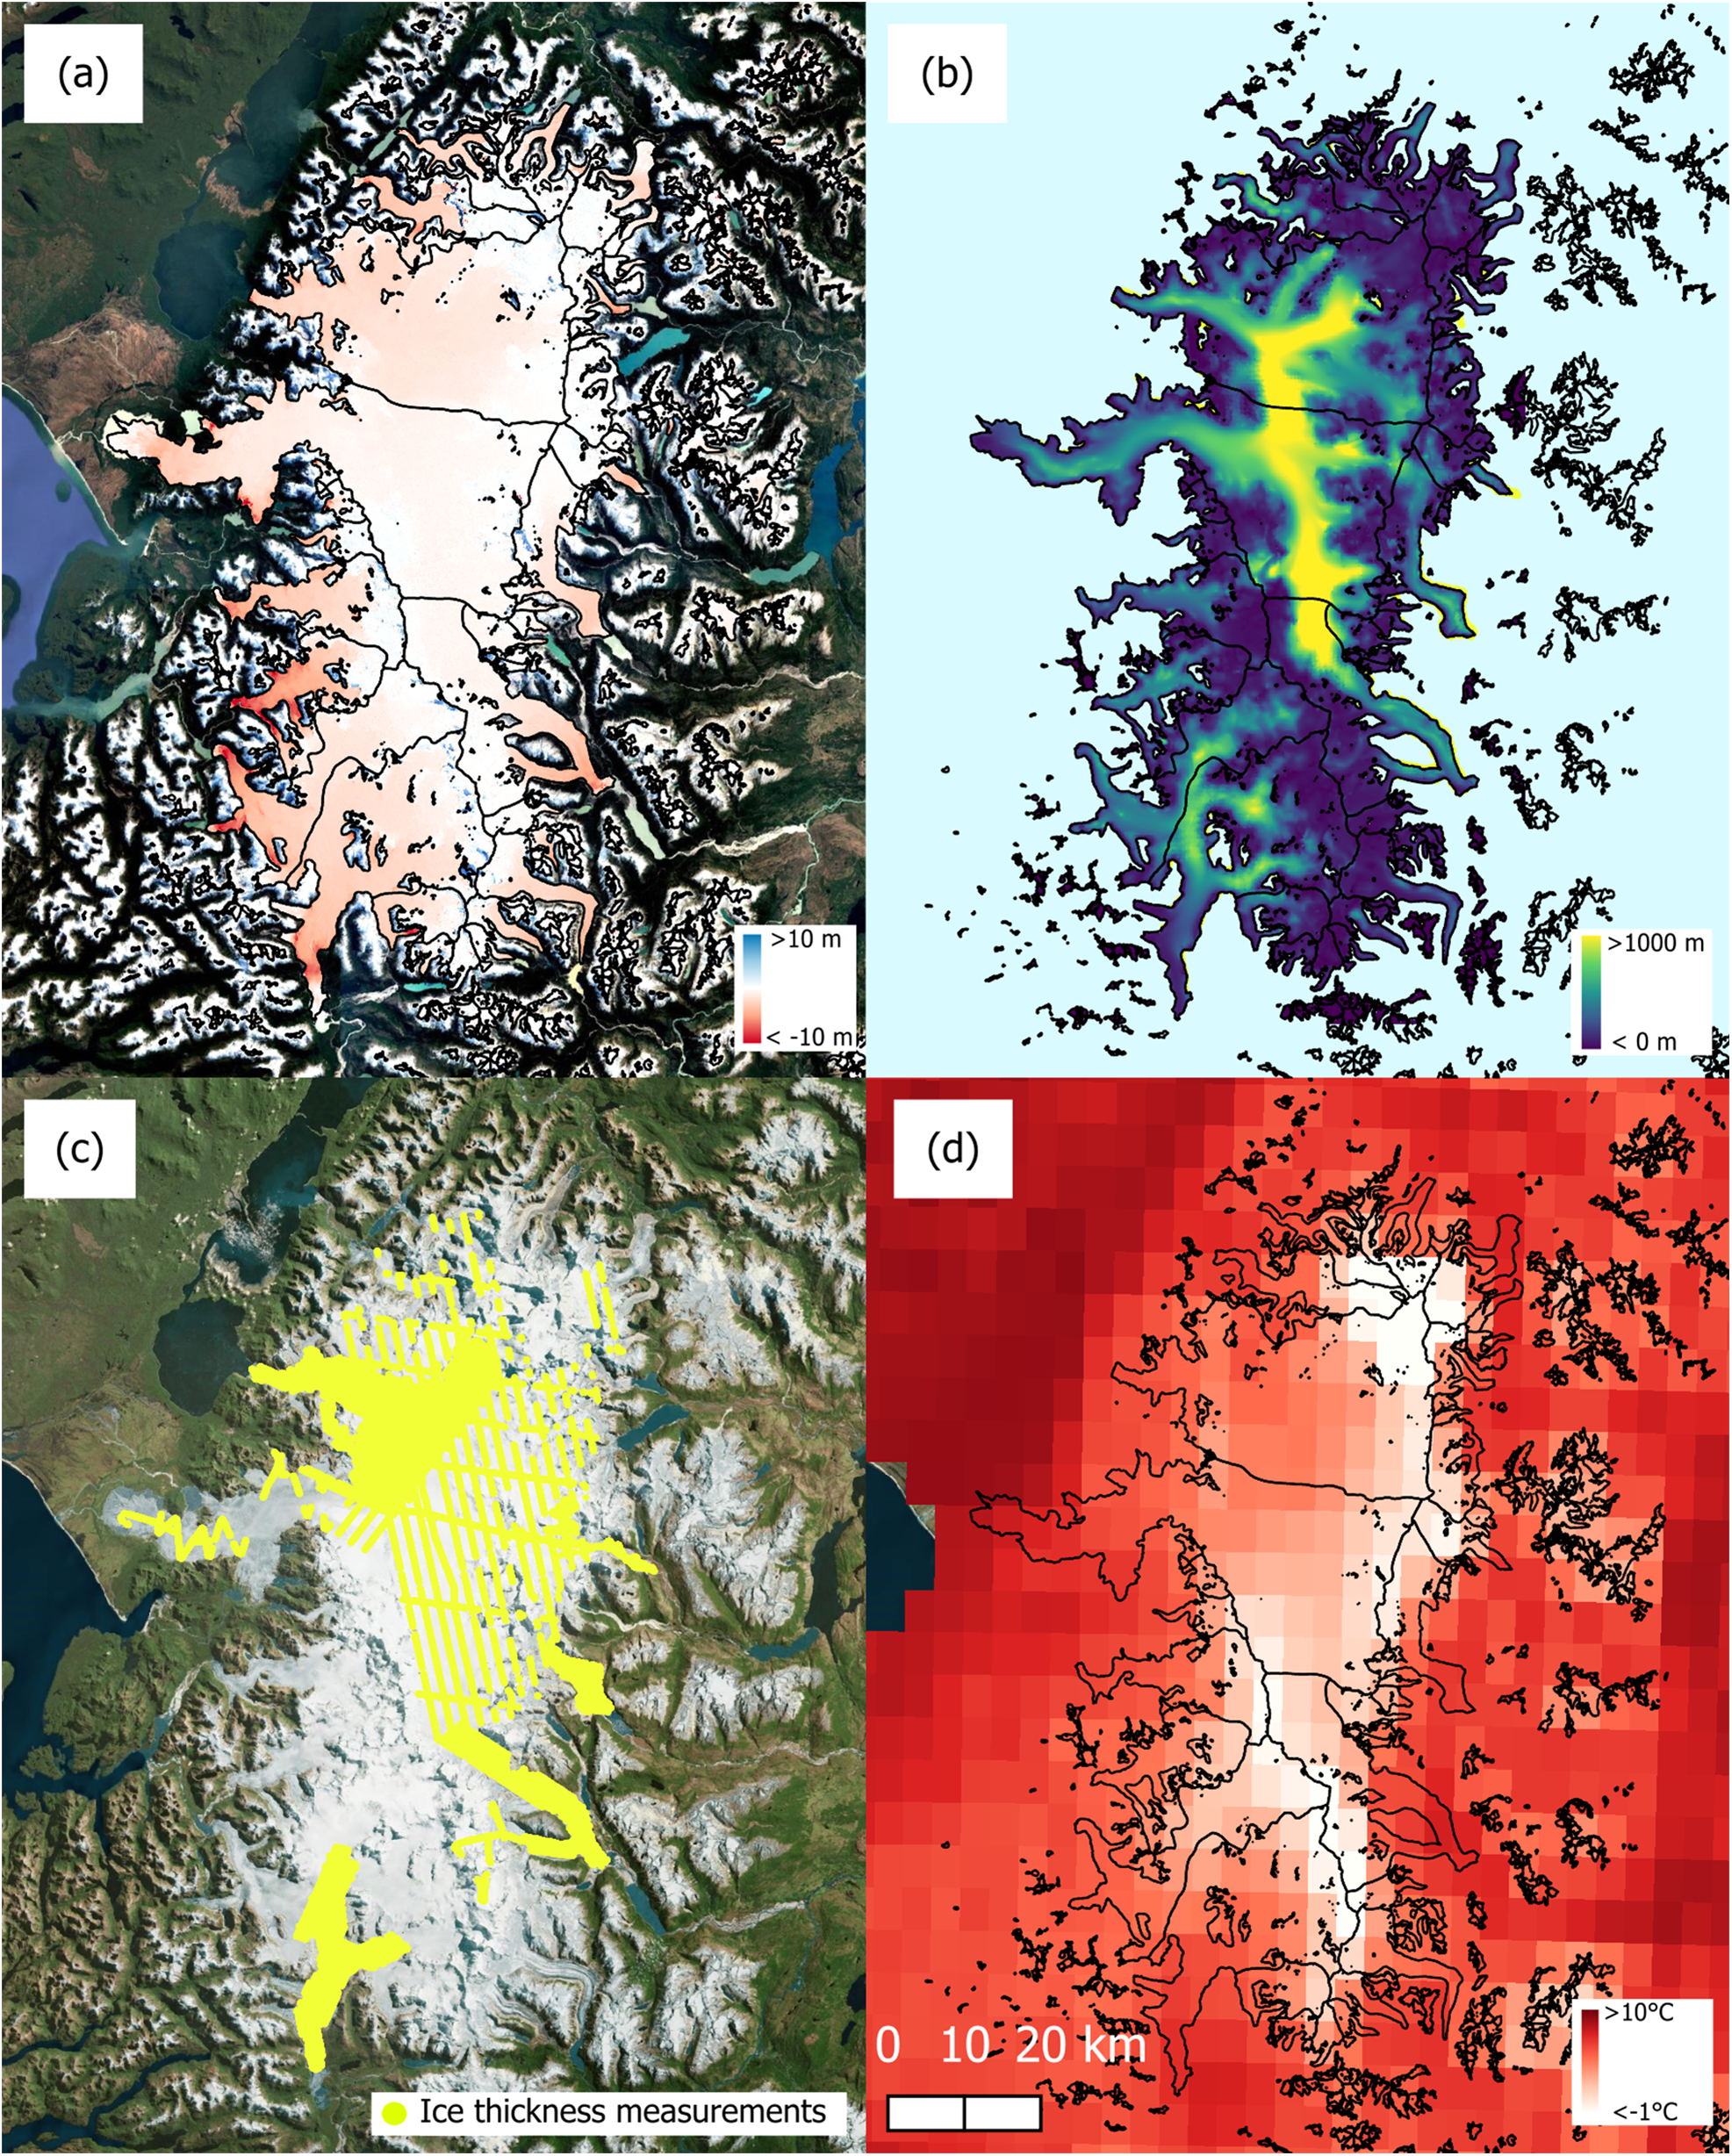
Glaciological data comprise the most extensive volume of data in QFuego-Patagonia, composed of several sub-fields, such as (1) glacier inventories, (2) frontal changes, (3) elevation changes, (4) surface velocities, (5) surface mass balance (SMB), and (6) glacial and proglacial lakes (Table S1). Studies on elevation changes and mass changes conducted in this region have employed diverse techniques, mostly estimated by differencing digital elevation models (DEMs) generated with interferometry techniques like Shuttle Radar Topography Mission (SRTM) and TerraSAR-X-Add-on for Digital Elevation Measurements (TanDEM-X; Malz and others, Reference Malz, Meier, Casassa, Jaña, Skvarca and Braun2018; Abdel Jaber and others, Reference Abdel Jaber, Rott, Floricioiu, Wuite and Miranda2019; Braun and others, Reference Braun2019) or photogrammetric methods utilising Advanced Spaceborne Thermal Emission and Reflection Radiometer (ASTER), declassified satellite images (e.g. KH-9), and SPOT images, but with different post-processing techniques (Willis and others, Reference Willis, Melkonian, Pritchard and Ramage2012; Dussaillant and others, Reference Dussaillant2019; Hugonnet and others, Reference Hugonnet2021; Minowa and others, Reference Minowa, Schaefer, Sugiyama, Sakakibara and Skvarca2021; McDonnell and others, Reference McDonnell, Rupper and Forster2022). The dataset resolution for these fields is 30 m. Figure 4a illustrates an example of the elevation changes of NPI.
Example data contained in the QFuego-Patagonia for NPI: (a) elevation changes (Braun and others, Reference Braun2019), (b) modelled ice thickness (Fürst and others, Reference Fürst2024), (c) compilation the tracks of the effective ice thickness measurements (Table S3 shows the list of the studies) and (d) mean annual temperature °C (Aguayo and others, Reference Aguayo2024a).

Glacier inventories and frontal changes have been estimated by several authors (e.g. Aniya, Reference Aniya1988; Rivera and Casassa, Reference Rivera and Casassa2004; Reference Rivera, Benham, Casassa, Bamber and Dowdeswell2007; Reference Rivera, Bown, Acuña and Ordenes2008; Bown and others, Reference Bown, Rivera, Zenteno, Bravo and Cawkwell2014). These datasets have been generated using remote sensing techniques ranging from band ratios and band-composition methods to historical reports and aerial photograph interpretation (Rivera and Casassa, Reference Rivera and Casassa2004; Rivera and others, Reference Rivera, Benham, Casassa, Bamber and Dowdeswell2007, Reference Rivera, Bown, Acuña and Ordenes2008, Reference Rivera, Koppes, Bravo and Aravena2012; DGA, 2011; Bown and others, Reference Bown, Rivera, Zenteno, Bravo and Cawkwell2014). QFuego-Patagonia includes two versions of glacier inventories (IPG2014_v1 and IPG2022_v2) of the Dirección General de Aguas (DGA) of Chile (DGA, 2022), the Argentinian glacier inventory stored in GLIMS (Global Land Ice Measurements from Space) (Zalazar and others, Reference Zalazar2020) and the glacier inventory by Meier and others (Reference Meier, Grießinger, Hochreuther and Braun2018), who mapped glacier extension from the Little Ice Age to the present. The Randolph Glacier Inventory version 6 (Pfeffer and others, Reference Pfeffer2014; RGI Consortium, 2017), which has been widely used for global estimates of elevation changes and surface velocities, was also included (Friedl and others, Reference Friedl, Seehaus and Braun2021; Hugonnet and others, Reference Hugonnet2021).
Surface velocities are provided in GeoTIFF format with resolutions ranging from 50 to 200 m. Most studies used radar and optical remote sensing techniques to estimate surface velocities across the Fuego-Patagonia region (Mouginot and Rignot, Reference Mouginot and Rignot2015; Friedl and others, Reference Friedl, Seehaus and Braun2021; Minowa and others, Reference Minowa, Schaefer, Sugiyama, Sakakibara and Skvarca2021; Millan and others, Reference Millan, Mouginot, Rabatel and Morlighem2022). QFuego-Patagonia includes regional velocities from two authors (Friedl and others, Reference Friedl, Seehaus and Braun2021; Millan and others, Reference Millan, Mouginot, Rabatel and Morlighem2022), while the remainder are from NPI and SPI only (Mouginot and Rignot, Reference Mouginot and Rignot2015; Minowa and others, Reference Minowa, Schaefer, Sugiyama, Sakakibara and Skvarca2021).
SMB data from direct mass-balance measurements using glaciological methods are scarce for individual glaciers in the Fuego-Patagonia region. Various modelling efforts, utilising downscaled global climate data and applying SMB models of varying complexities, have been undertaken only in NPI and SPI, which are included in QFuego-Patagonia (Schaefer and others, Reference Schaefer, Machguth, Falvey and Casassa2013; Reference Schaefer, Machguth, Falvey, Casassa and Rignot2015; DGA, 2014; Bravo and others, Reference Bravo, Bozkurt, Ross and Quincey2021; Carrasco-Escaff and others, Reference Carrasco-Escaff, Rojas, Garreaud, Bozkurt and Schaefer2023). Accumulation estimations (Schaefer and others, Reference Schaefer, Machguth, Falvey and Casassa2013; Reference Schaefer, Machguth, Falvey, Casassa and Rignot2015; Bravo, Reference Bravo2019; Carrasco-Escaff and others, Reference Carrasco-Escaff, Rojas, Garreaud, Bozkurt and Schaefer2023) and SMB projections using different RCP scenarios (Bravo and others, Reference Bravo, Bozkurt, Ross and Quincey2021) were also included in the SMB field. Observations and simulations of SMB for the Tierra del Fuego are available for Sarmiento Massif (Temme and others, Reference Temme2023) and the entire Cordillera Darwin (Temme and others, Reference Temme2025).
Glacial and proglacial lakes include two sub-fields. Glacial and proglacial lake inventories were compiled using the aforementioned remote sensing techniques and historical reports (e.g. Loriaux and others, Reference Loriaux and Casassa2013; Wilson and others, Reference Wilson2018). The files include those of Wilson and others (Reference Wilson2018), a point shapefile of changes in lake area, and Loriaux and Casassa (Reference Loriaux and Casassa2013), which document changes in lakes between 1944/45 and 2011 at NPI (Table S1).
3.2. Atmospheric data
The atmospheric dataset in QFuego-Patagonia is primarily based on the PatagoniaMet v1.1 grid, which provides a reliable representation of mean precipitation and temperature across the Fuego-Patagonia region (Aguayo and others, Reference Aguayo2024a). It includes annual mean precipitation and temperature data (0.05° resolution, 1990–2019) and seasonal values (Aguayo and others, Reference Aguayo2024a). The dataset also integrates additional precipitation grids (Schaefer and others, Reference Schaefer, Machguth, Falvey and Casassa2013; Reference Schaefer, Machguth, Falvey, Casassa and Rignot2015; Carrasco-Escaff and others, Reference Carrasco-Escaff, Rojas, Garreaud, Bozkurt and Schaefer2023), covering NPI and SPI. Figure 4d is an example of the gridded mean temperature at 2 m for NPI (Aguayo and others, Reference Aguayo2024a).
The dataset’s value lies in its inclusion of data from various sources, providing a comprehensive view of atmospheric conditions (Table S2). However, there is potential for expanding the spatial and temporal coverage in future versions. Collaborative efforts to include more atmospheric variables, enhance modelling techniques and acquire additional data at higher elevations (e.g. icefield plateaus) would improve its utility for climate studies and reduce uncertainties in hydrological projections (Aguayo and others, Reference Aguayo2024b).
3.3. Terrain models data
Terrain model data in QFuego-Patagonia include modelled ice thickness, ice thickness measurements, subglacial topography and bathymetry (Table S3). Modelled ice thicknesses were obtained through mass conservation, perfect plasticity assumptions and the shallow-ice approximation (SIA; Carrivick and others, Reference Carrivick, Davies, James, Quincey and Glasser2016; Farinotti and others, Reference Farinotti2019; Millan and others, Reference Millan, Mouginot, Rabatel and Morlighem2022; Fürst and others, Reference Fürst2024), some of which include ground-truth data (Millan and others, Reference Millan, Mouginot, Rabatel and Morlighem2022; Fürst and others, Reference Fürst2024). These models provide critical insights into ice dynamics, though data gaps in certain regions (e.g. the Cordillera Darwin) underscore the need for further investigation.
Ice thickness observations, primarily collected via terrestrial or airborne ground-penetrating radar, seismic measurements and gravimetry, provide important validation of modelled ice thicknesses—initial attempts included gravimetric point measurements on Nef and Soler glaciers (e.g. Casassa, Reference Casassa1987). NPI and SPI were measured using the Warm Ice Experiment Sounder (WISE) radar sounder (Rignot and others, Reference Rignot, Mouginot, Larsen, Gim and Kirchner2013). Airborne gravimetry surveys in 2012 and 2016 provided extensive spatial coverage for the interior of the Northern Patagonian Icefield (NPI; Millan and others, Reference Millan2019). Figures 4b and 4c show examples of the modelled ice thickness and NPI thickness measurements.
Ground Penetrating Radar measurements dating back to 1990 have been conducted on Tyndall Glacier and Paso Cuatro Glaciares (Casassa, Reference Casassa1992; Casassa and Rivera, Reference Casassa and Rivera1998; Rivera and Casassa, Reference Rivera and Casassa2002). Dense ice-thickness grid surveys on several NPI and SPI glaciers using helicopter-borne radar are included (Blindow and others, Reference Blindow, Salat and Casassa2012; DGA, 2012, 2016; Pętlicki and others, Reference Pętlicki, Rivera, Oberreuter, Uribe, Reinthaler and Bown2023). However, NPI presents a better helicopter-borne radar coverage than SPI. A few samples of seismic cross-profiles in the Perito Moreno glacier were also included in this dataset (Stuefer, Reference Stuefer1999; Sugiyama and others, Reference Sugiyama2011). As for Cordillera Darwin, there are no ice thickness measurements; only a small section of Schiaparelli Glacier was measured in the near-front area (Gacitúa and others, Reference Gacitúa, Schneider, Arigony, González, Jaña and Casassa2021). This highlights the importance of collaborative efforts to expand the coverage and reliability of ice thickness data.
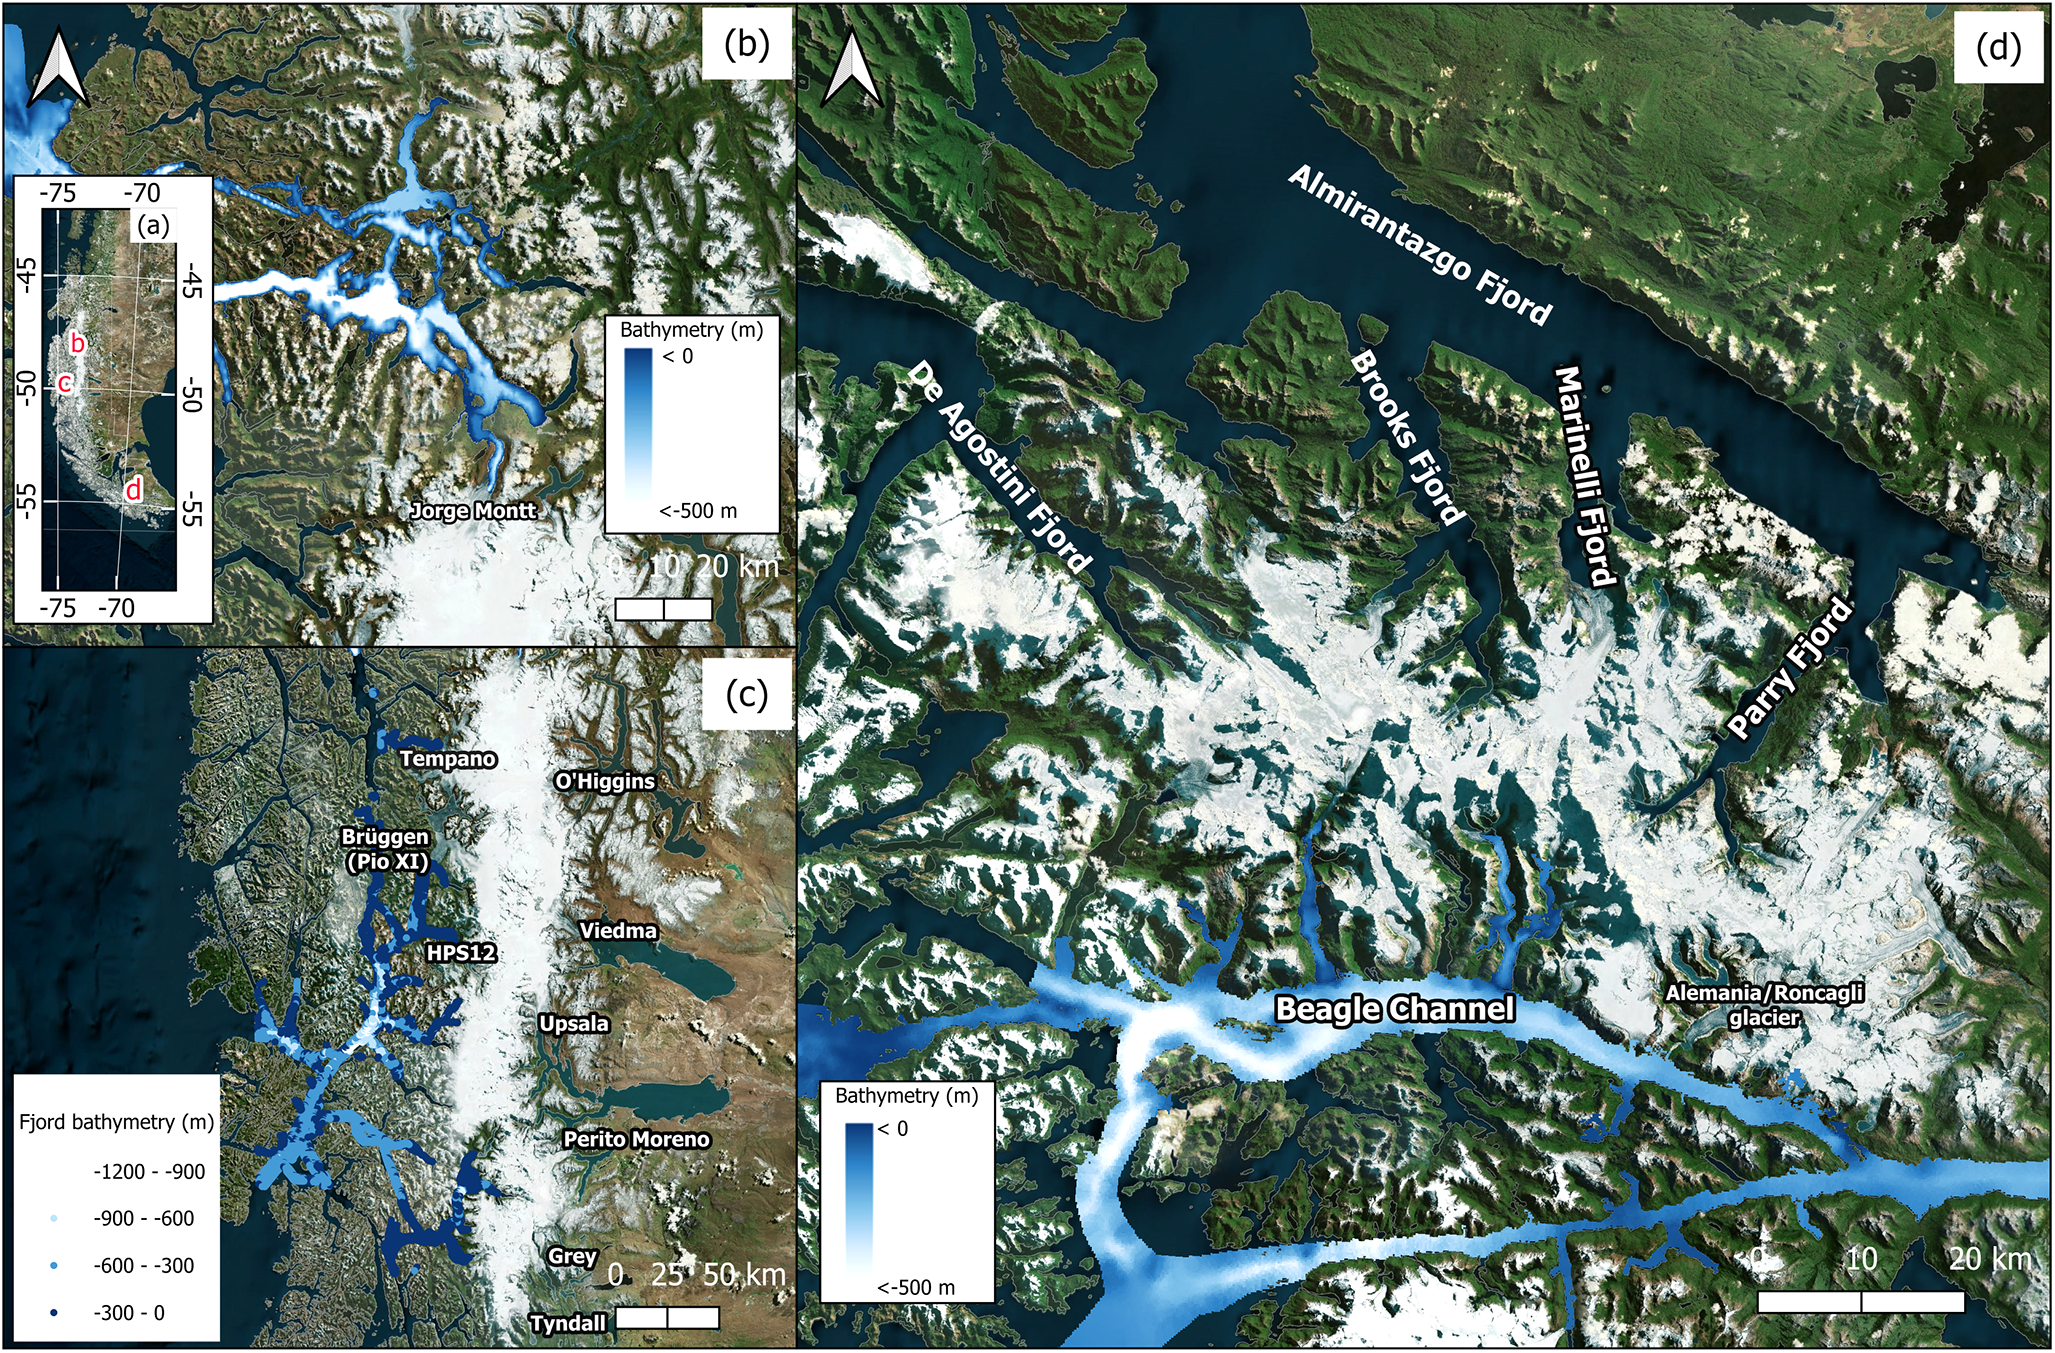
Bathymetry data consists of fjord, glacial and proglacial lake measurements. The dataset integrates various oceanographic observations from cruises and historical records, providing a detailed perspective on the underwater landscape. The bathymetric fjords data are composed of three large regional datasets: (1) Baker-Martinez fjord bathymetry (Piret and others, Reference Piret, Bertrand, Vandekerkhove, Harada, Moffat and Rivera2017), (2) Beagle channel bathymetry (Giesecke and others, Reference Giesecke2021) and (3) a compilation of depth sounding acquired over many years by the Hydrographic service of the Chilean Navy (SHOA) in the western fjords of SPI. The Baker-Martinez fjord data set (Fig. 5a) is a comprehensive ensemble of diverse bathymetric data sets compiled by Piret and others (Reference Piret, Bertrand, Vandekerkhove, Harada, Moffat and Rivera2017). It includes multibeam echosounder data from Baker channel and Steffen fjord and Baker River delta, single beam echosounder data from Martinez channel (R/V Sur-Austral 2015/2016) and Jorge Montt fjord (Rivera and others, Reference Rivera, Koppes, Bravo and Aravena2012; Moffat, Reference Moffat2014), as well as additional bathymetric data contributed by C. Moffat and individual points digitised from two SHOA nautical charts (SHOA). The Beagle Channel is a vital interoceanic passage spanning approximately 270 km and is connected to the glaciers of Cordillera Darwin through tributary fjords. The Beagle Channel bathymetry measurement (Fig. 5b) was generated by Giesecke and others (Reference Giesecke2021), who used an ensemble of different oceanographic observations derived from cruises and historical records. The bathymetric data provided by SHOA for the region west of the SPI is a shapefile containing depth soundings surveyed by hydrographic vessels used in nautical charts of the area, and therefore presents a minimum depth in their vicinity.
Bathymetric datasets included in QFuego-Patagonia: (a) general location of the data coverage, (b) Baker-Martinez Fjord bathymetry (Piret and others, Reference Piret, Bertrand, Vandekerkhove, Harada, Moffat and Rivera2017), (c) soundings from nautical charts of the Hydrographic service of the Chilean Navy (SHOA) and (d) Beagle Channel (Giesecke and others, Reference Giesecke2021).

The other sub-field, (2) glacial lake bathymetry, mainly includes recent data from glaciers in the eastern part of SPI, such as O’Higgins, Viedma, Perito Moreno, Grey and Tyndall (Sugiyama and others, Reference Sugiyama2016, Reference Sugiyama2021; Minowa and others, Reference Minowa, Schaefer and Skvarca2023). The bathymetric datasets exhibit varying degrees of coverage. These datasets are essential for understanding the interaction between glaciers and their surrounding aquatic environments. Efforts to fill data gaps, enhance resolution and expand spatial coverage, particularly in the glacial lake bathymetry, will further improve the dataset’s utility. Emerging technologies, such as autonomous underwater vehicles, can play a crucial role in future iterations of the dataset.
3.4. Glacial Geology and geomorphology
The geological data layers integrated into QFuego-Patagonia originate from the PATICE project (Davies and others, Reference Davies2020), a GIS database that compiles Patagonian glacial geomorphology and recalibrated chronological data from various studies across the region. Three key subfields from PATICE were incorporated: (1) chronology, (2) glacial geomorphology and (3) glacier reconstructions (Table S4).
The chronology subfield encompasses dating techniques such as dendrochronology, cosmogenic exposure dating using 10Be, 26Al, 36Cl and 3He, optically stimulated luminescence, and radiocarbon dating. These datasets provide a temporal framework for past glaciations and landscape evolution. The curation process involved integrating disparate dating records into a standardised format, ensuring chronological accuracy and geospatial consistency.
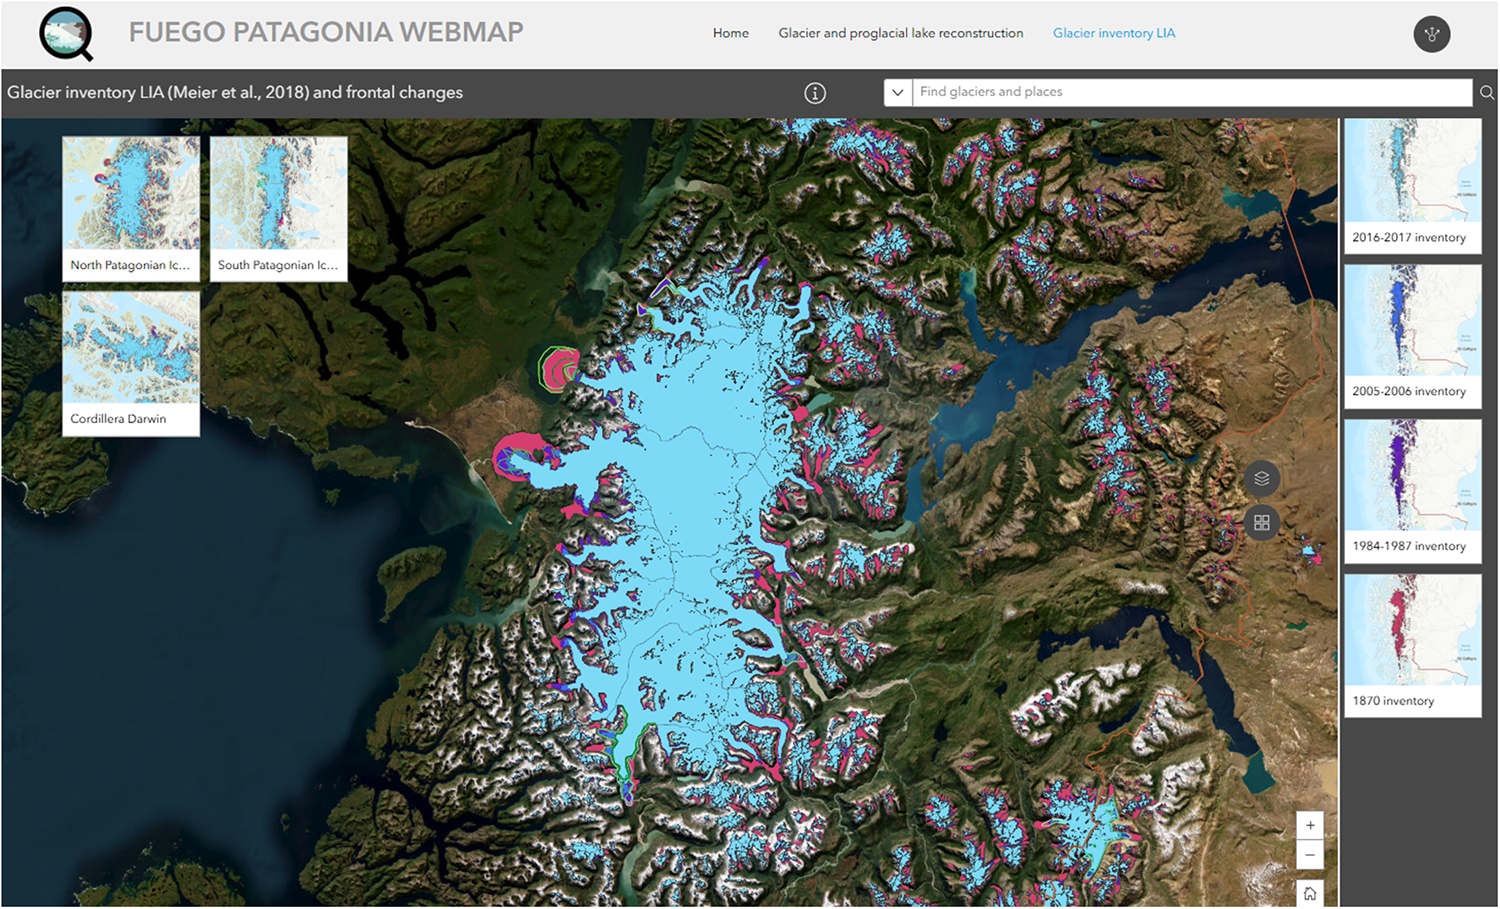
The glacier reconstruction subfield provides insights into historical glacial extents and lake formations over the past 10 000–35 000 years, as well as reconstructions of the Fuego-Patagonia Ice Sheet over the last 35 000 years (Davies and others, Reference Davies2020) (Fig. 6). The curation process included refining spatial boundaries to align with QFuego-Patagonia’s study area, thereby ensuring the dataset’s relevance to the region.
Visualisation example showing glacier reconstruction and frontal shifts from the Little Ice Age (Meier and others, Reference Meier, Grießinger, Hochreuther and Braun2018).

The integration of these geological datasets into QFuego-Patagonia facilitates multi-disciplinary studies on glacier history, landscape evolution and paleoclimate reconstructions (Glasser and others, Reference Glasser, Jansson, Harrison and Kleman2008; Davies and others, Reference Davies2020). Future work should prioritise expanding chronological records and refining spatial reconstructions using emerging dating techniques and high-resolution geomorphic mapping.
3.5. Basemaps
The basemap layers include data that allow intercomparison, planning and visualization, including satellite images, toponymy information and UTM grids (Table S5). A separate RGI V6 layer is also included, serving as a common reference area for various estimations such as elevation changes, velocities, ice thickness and more.
4. Conclusions
QFuego-Patagonia is a free glacier-related GIS Package for Tierra del Fuego and Patagonia (45°–56 S°) compatible with QGIS 3.16 on multiple platforms, without an internet connection. The GIS package comprises 135 layers across four topics and 26 basemap layers. The compressed package is ∼3.5GB, while the uncompressed dataset is ∼29GB. The QFuego-Patagonia package is available for download from the official website and from PANGAEA. An interactive version is hosted on the ESRI platform and can be accessed without requiring a local download. This project provides a diverse set of datasets derived using different techniques, enriching options for model calibration, data comparison and use in specific tasks or teaching. The database aims to offer an extensive data collection that (1) facilitates an overview of the current state of knowledge in the study region, where the integration of multiple datasets enhances the understanding of present-day glacial dynamics; (2) promotes intercomparison of data with different spatial and temporal resolutions and (3) helps identify priorities for future research.
In the era of big data, the availability of free and accessible datasets in QFuego-Patagonia not only enriches our understanding of the Fuego-Patagonia glaciers but also exemplifies a commitment to harnessing the transformative potential of data for the betterment of society. Furthermore, data accessibility fosters collaboration among diverse stakeholders, including scientists, policymakers and local communities, thereby promoting inclusivity in the scientific process and facilitating the development of effective mitigation and adaptation strategies. We are committed to enhancing QFuego-Patagonia by continually integrating and consolidating the package with new datasets and by cultivating a cutting-edge knowledge repository for the region, which provides a clear overview of our current knowledge and emerging high-quality studies.
Supplementary material
The supplementary material for this article can be found at https://doi.org/10.1017/jog.2025.10110.
Data availability statement
The QFuego-Patagonia package is available for download at the official website (https://qfuego-patagonia.org/download-data/), as well as PANGAEA (https://doi.pangaea.de/10.1594/PANGAEA.983754) under the Creative Commons Attribution-NonCommercial 4.0 International licensed. An interactive version of the package is hosted on the ESRI platform and can be accessed at: https://experience.arcgis.com/experience/be61ce26335e4f02967071a6479e0dff/
Acknowledgements
QFuego-Patagonia project development started in 2022 with initial support from Friedrich-Alexander-Universität Erlangen-Nürnberg, Germany, with their Emerging Talent Initiative (ETI) funding. We acknowledge support from the Mountain Research Initiative via GEO Mountains under the Adaptation at Altitude Programme (Swiss Agency for Development and Cooperation Project Number: 7F-10208.01.02) with its small Grant Program 2023. D.F.-B. was funded by the German Research Foundation (DFG) within the MAGIC and ITERATE projects (FU1032/5-1, BR2105/28-1, FU1032/12-1) as well as the ANID Subvención a la instalación a la academia (SIA85220007), and Fondecyt N°3230146. Finally, we thank the Chief Editor, Hester Jiskoot, the two anonymous reviewers and Kenichi Matsuoka, whose suggestions and comments helped to significantly improve the manuscript.
Authors contributions
D.F.B and M.H.B initiated the project and development of the concept. D.F.B. designed the study and led the study and supported by M.S. and M.H.B. For data acquisition, all co-authors contributed.
Competing interests
The authors declare no competing interests.


 Open access