


1. Introduction
The close eclipsing binary stars S Ant and
 $\varepsilon$
CrA are examples of the relatively plentiful ‘contact’ (sometimes overcontact) systems associated with the smoothly varying EW, or W UMa, class of light curve (LC). Within this grouping, S Ant and
$\varepsilon$
CrA are examples of the relatively plentiful ‘contact’ (sometimes overcontact) systems associated with the smoothly varying EW, or W UMa, class of light curve (LC). Within this grouping, S Ant and
 $\varepsilon$
CrA are of Binnendijk’s (1966) ‘A’ type, or class, characterised by the primary minimum resulting from the eclipse of the bigger, more massive, and higher mean surface temperature component. This is distinguished from the more frequently found ‘W’ type, where the primary minimum is caused by the eclipse of the smaller, hotter, star (Binnendijk Reference Binnendijk1966).
$\varepsilon$
CrA are of Binnendijk’s (1966) ‘A’ type, or class, characterised by the primary minimum resulting from the eclipse of the bigger, more massive, and higher mean surface temperature component. This is distinguished from the more frequently found ‘W’ type, where the primary minimum is caused by the eclipse of the smaller, hotter, star (Binnendijk Reference Binnendijk1966).
 $\varepsilon$
Coronae Australis is the brightest known example of the W UMa stars. Eker et al. (Reference Eker, Bilir, Yaz, Demircan and Helvaci2009) gave the mass ratio (q) of
$\varepsilon$
Coronae Australis is the brightest known example of the W UMa stars. Eker et al. (Reference Eker, Bilir, Yaz, Demircan and Helvaci2009) gave the mass ratio (q) of
 $\varepsilon$
CrA as 0.128, which is very similar to that found by Goecking & Duerbeck (Reference Goecking and Duerbeck1993). The mass ratio was recently confirmed in the detailed spectroscopic analysis of Ruciński (2020). This low secondary mass at once points to peculiarity given that the component luminosities are not greatly different from each other. The mass ratio for the comparable system S Ant is also fairly low at
$\varepsilon$
CrA as 0.128, which is very similar to that found by Goecking & Duerbeck (Reference Goecking and Duerbeck1993). The mass ratio was recently confirmed in the detailed spectroscopic analysis of Ruciński (2020). This low secondary mass at once points to peculiarity given that the component luminosities are not greatly different from each other. The mass ratio for the comparable system S Ant is also fairly low at
 $q = 0.33 \pm 0.02$
(Duerbeck & Ruciński 2007). S Ant is similarly a bright A class system, also well to the south in declination. The availability of good signal-to-noise ratios in a high spectral resolution context, along with indications that both binaries are engaged in a mass transfer process, thus commends attention to these relatively neglected objects.
$q = 0.33 \pm 0.02$
(Duerbeck & Ruciński 2007). S Ant is similarly a bright A class system, also well to the south in declination. The availability of good signal-to-noise ratios in a high spectral resolution context, along with indications that both binaries are engaged in a mass transfer process, thus commends attention to these relatively neglected objects.
It has been generally taken that the outer layers of binaries like S Ant and
 $\varepsilon$
CrA are in physical contact, with a common envelope surrounding two mass concentrations. Such a model explains the general shape of the LC, which has to involve relatively close proximity of the two mass centres given the strong tidal distortions evident from the markedly changing received light fluxes with the orbital phase. The common envelope may then account for the comparability of the two luminosities on the basis of energy transferred between the underlying stars (Mochnacki Reference Mochnacki1981; Hilditch, King, & Mc-Farlane 1988). Such a picture has been discussed for decades, with the availability of decisive evidence generally insufficient to unequivocally settle the modelling (see Yakut & Eggleton Reference Yakut and Eggleton2005, and the many references therein). The direct association of physical characteristics with LC type is ambiguous, particularly with the smooth, quasi-sinusoidal EW LCs, where physically different configurations may show similar forms of photometric variation. Analyses of such LCs indicate that the components have dimensions that would put them close to theoretical surfaces of limiting stability, but some such binaries might just be detached pairs whose components happen to be relatively close to this limit; for example, V831 Cen (Budding et al. Reference Budding, Erdem, Inlek and Demircan2010).
$\varepsilon$
CrA are in physical contact, with a common envelope surrounding two mass concentrations. Such a model explains the general shape of the LC, which has to involve relatively close proximity of the two mass centres given the strong tidal distortions evident from the markedly changing received light fluxes with the orbital phase. The common envelope may then account for the comparability of the two luminosities on the basis of energy transferred between the underlying stars (Mochnacki Reference Mochnacki1981; Hilditch, King, & Mc-Farlane 1988). Such a picture has been discussed for decades, with the availability of decisive evidence generally insufficient to unequivocally settle the modelling (see Yakut & Eggleton Reference Yakut and Eggleton2005, and the many references therein). The direct association of physical characteristics with LC type is ambiguous, particularly with the smooth, quasi-sinusoidal EW LCs, where physically different configurations may show similar forms of photometric variation. Analyses of such LCs indicate that the components have dimensions that would put them close to theoretical surfaces of limiting stability, but some such binaries might just be detached pairs whose components happen to be relatively close to this limit; for example, V831 Cen (Budding et al. Reference Budding, Erdem, Inlek and Demircan2010).
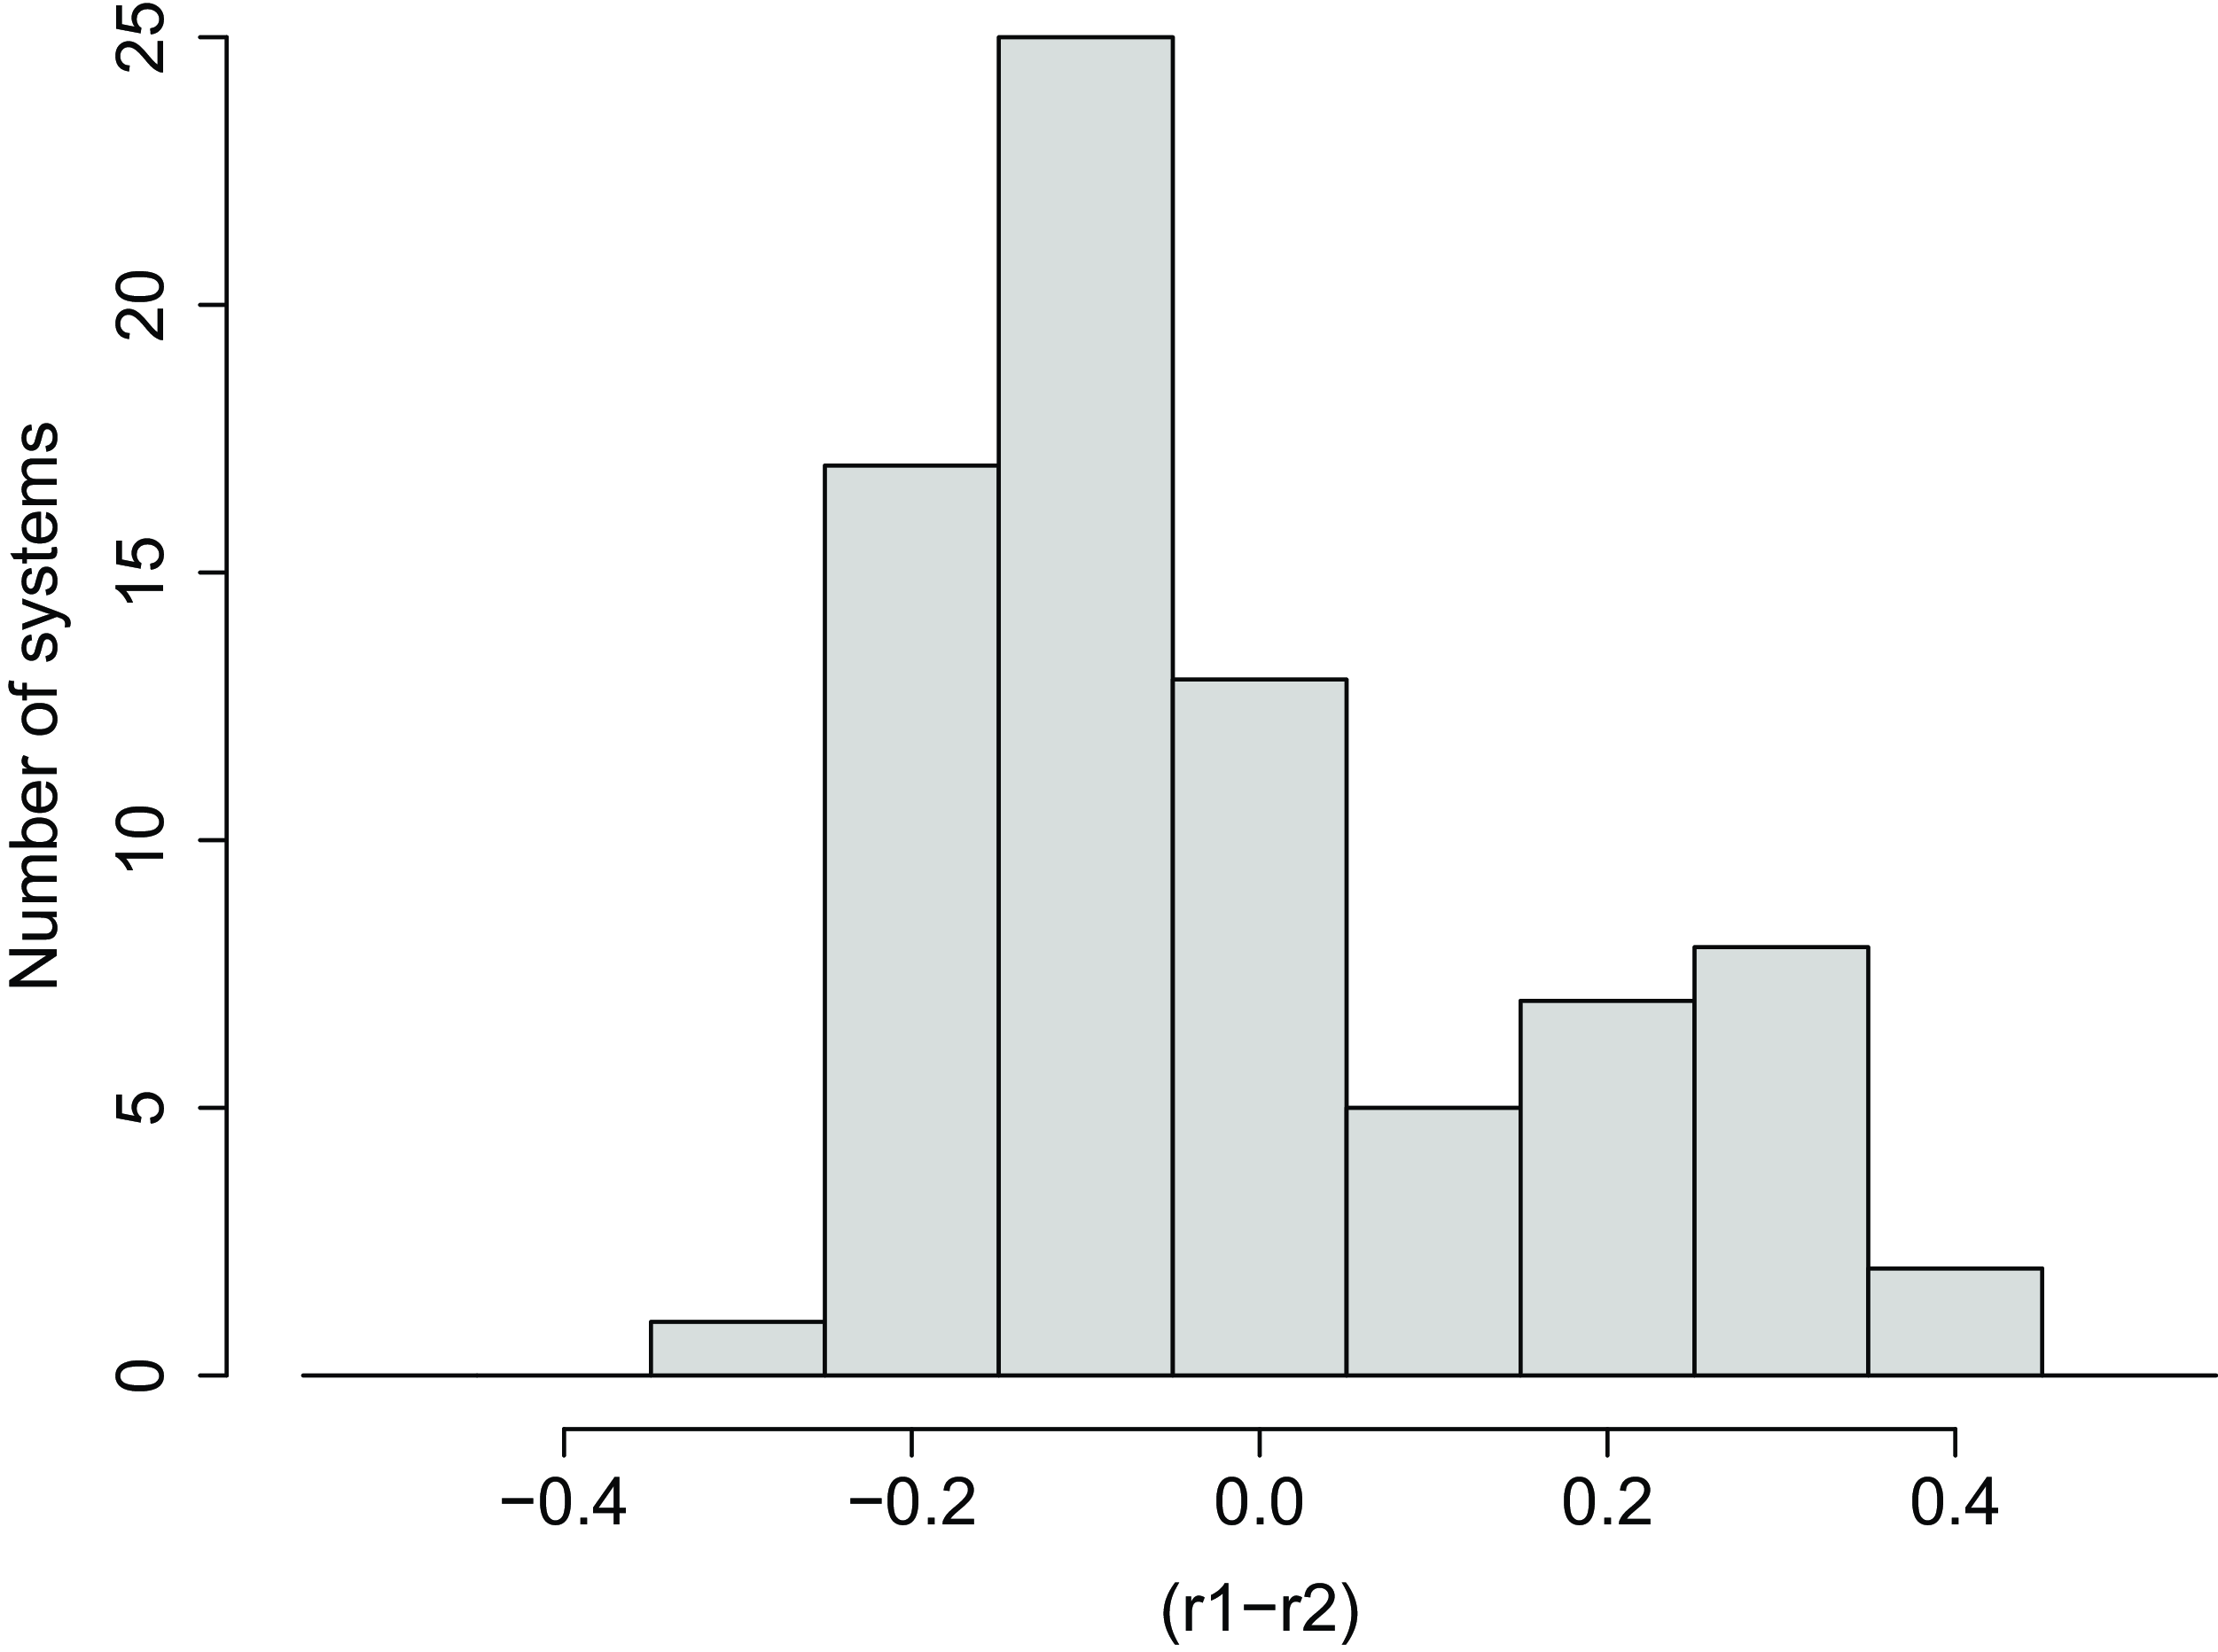
In Fig. 1 we plot the frequencies of the difference in relative radii
 $r_1 - r_2$
(i.e. stellar mean radius divided by the separation of the mass centres) from Maceroni & van ’t Veer (1996)’s catalogue of well-studied contact binaries. Here we set
$r_1 - r_2$
(i.e. stellar mean radius divided by the separation of the mass centres) from Maceroni & van ’t Veer (1996)’s catalogue of well-studied contact binaries. Here we set
 $r_1$
to correspond to the hotter component: the one eclipsed at primary minimum, so A-type systems are on the right of the origin and W-types on the left. This difference is also a measure of the difference in the mass ratio q (usually given in the sense mass
$r_1$
to correspond to the hotter component: the one eclipsed at primary minimum, so A-type systems are on the right of the origin and W-types on the left. This difference is also a measure of the difference in the mass ratio q (usually given in the sense mass
 $_\mathrm{smaller}$
/mass
$_\mathrm{smaller}$
/mass
 $_\mathrm{greater}$
) from unity, as, for contact binaries, the relative radii are fixed by q.Footnote a
$_\mathrm{greater}$
) from unity, as, for contact binaries, the relative radii are fixed by q.Footnote a
Distribution of differences in the relative radii of 78 well-studied EW-type binaries from the catalogue of Maceroni & van ’t Veer (1996).
 $r_1$
is the radius of the hotter star, as a fraction of the separation of the two mass centres. The A-type systems are to the right and the W types are to the left of the central axis.
$r_1$
is the radius of the hotter star, as a fraction of the separation of the two mass centres. The A-type systems are to the right and the W types are to the left of the central axis.
It should be noted that here we are using the ‘photometric’ identification of
 $r_1$
as the relative radius of the star of greater surface brightness: the star eclipsed at the primary minimum, as in the catalogue of Maceroni & van ’t Veer (1996). In spectroscopic contexts the ’primary’ normally refers to the more massive star, These spectroscopic and photometric primary stars are not necessarily the same object. For contact binaries there is the added constraint that the larger star is the more massive one, so if it is also the hotter one we must be dealing with an A-type system, having
$r_1$
as the relative radius of the star of greater surface brightness: the star eclipsed at the primary minimum, as in the catalogue of Maceroni & van ’t Veer (1996). In spectroscopic contexts the ’primary’ normally refers to the more massive star, These spectroscopic and photometric primary stars are not necessarily the same object. For contact binaries there is the added constraint that the larger star is the more massive one, so if it is also the hotter one we must be dealing with an A-type system, having
 $r_1 \gt r_2$
. If the hotter star is smaller,
$r_1 \gt r_2$
. If the hotter star is smaller,
 $r_1 \lt r_2$
corresponding to the W type. Binnendijk (Reference Binnendijk1966) followed the spectroscopic convention with
$r_1 \lt r_2$
corresponding to the W type. Binnendijk (Reference Binnendijk1966) followed the spectroscopic convention with
 $r_1$
applying to the more massive star, and so
$r_1$
applying to the more massive star, and so
 $q \lt 1$
. Binnendijk (Reference Binnendijk1966) also had (in his notation)
$q \lt 1$
. Binnendijk (Reference Binnendijk1966) also had (in his notation)
 $L_1 \gt L_2$
, as an empirical finding. That would be certainly true for the A type systems. For W type systems, since
$L_1 \gt L_2$
, as an empirical finding. That would be certainly true for the A type systems. For W type systems, since
 $T_1$
and
$T_1$
and
 $T_2$
are usually quite similar, if
$T_2$
are usually quite similar, if
 $r_1$
is significantly bigger then
$r_1$
is significantly bigger then
 $r_2$
then
$r_2$
then
 $L_1 \gt L_2$
would be likely also for the W-types, but this is not rigorously established in general.
$L_1 \gt L_2$
would be likely also for the W-types, but this is not rigorously established in general.
The distribution in Fig. 1 shows the existence of the two distinct clumps of W and A types, with a general prevalence of q-values not too far from unity.Footnote b It suggests some basic differences in the mechanisms leading up to the W and A types rather than a single continuum of formation see Fig. 1.
Extreme mass ratios disappear from the population relatively quickly, and none are found below a certain limiting mass ratio. This point, although possibly influenced by selection effects, was noted by van t’ Veer (1994), and discussed by Rasio (Reference Rasio1995) and Li & Zhang (Reference Li and Zhang2006), who showed that contact binary models would be subject to dynamical instability if the mass ratio (lesser/greater) was less than about 0.09. This is slightly greater than the value 0.075 cited by Ruciński (1972) for AW UMa. The predicted result of the mass ratio falling below the limit is a merger of the components into one rapidly rotating object, V1309 Sco being an example (Tylenda et al. Reference Tylenda2011). If we use the fact that
 $r_1 + r_2 \approx 0.75$
(Kopal Reference Kopal1959), then the drop-off in the distribution at
$r_1 + r_2 \approx 0.75$
(Kopal Reference Kopal1959), then the drop-off in the distribution at
 $|r_1 - r_2| \approx 0.3$
supports a swift decline in the number of contact binaries when q drops below about 0.15. Keeping in mind observational uncertainties, the absence of systems for which
$|r_1 - r_2| \approx 0.3$
supports a swift decline in the number of contact binaries when q drops below about 0.15. Keeping in mind observational uncertainties, the absence of systems for which
 $|r_1 - r_2| \gt 0.5$
confirms the absence of systems in this sample for which q is less than at least 0.05, although this was recently challenged by Li et al. (Reference Li, Chen, Ge, Chen and Han2023).
$|r_1 - r_2| \gt 0.5$
confirms the absence of systems in this sample for which q is less than at least 0.05, although this was recently challenged by Li et al. (Reference Li, Chen, Ge, Chen and Han2023).
In another development, Stepien (Reference Stepien2009) considered a mass transfer, as generally recognised in the Algol-type binaries. Such a model posits the present secondary in W UMa systems to be at a more advanced evolutionary stage than the primary. The initially Main-Sequence-like primary expands beyond its critical surface so as to generate a mass-transferring stream. Coriolis forces deflect the stream from the line of centres of the two stars as well as preventing matter from the primary attaining a high latitude on the secondary star. The movement of mass is confined to a central zone about the equator. In this scheme, the stream, with its associated thermal energy, circulates around the secondary and may then return to the primary. The model predicts that spectroscopic observations should be able to detect this flow. Observations consistent with such motions were reported by Rucinski in two cases: AW UMa (Ruciński 2015) and
 $\varepsilon$
CrA (Ruciński 2020). Substantiation of this picture forms a clear motivation for the present study.
$\varepsilon$
CrA (Ruciński 2020). Substantiation of this picture forms a clear motivation for the present study.
Short literature reviews of the two binary systems S Ant and
 $\varepsilon$
CrA follow. Given the importance of the mass ratio to the parametrization of contact binaries, the introduction is followed by the spectrometric section that determines the mass ratio from the radial velocity (RV) data. We present and analyse new photometry in Section 3. Indications of trends of period variation for both binaries follow in Section 4. Absolute parameters are given in Section 5, and we discuss relevant issues in the final section.
$\varepsilon$
CrA follow. Given the importance of the mass ratio to the parametrization of contact binaries, the introduction is followed by the spectrometric section that determines the mass ratio from the radial velocity (RV) data. We present and analyse new photometry in Section 3. Indications of trends of period variation for both binaries follow in Section 4. Absolute parameters are given in Section 5, and we discuss relevant issues in the final section.
1.1 S Antliae
S Ant (= HD 62810; HIP 46810, HR 3798) is a mag V
 $\approx$
6.5, B – V
$\approx$
6.5, B – V
 $\approx$
0.32;
$\approx$
0.32;
 $\lambda$
 $\approx$
258.5,
$\approx$
258.5,
 $\beta$
 $\approx$
+16.6 (SIMBAD, Wenger et al. Reference Wenger2000) F3V dwarf eclipsing binary with a short period (
$\approx$
+16.6 (SIMBAD, Wenger et al. Reference Wenger2000) F3V dwarf eclipsing binary with a short period (
 $P \approx 0.6483~d$
). The period appears to be slowly increasing (Kreiner, Kim, & Nha Reference Kreiner, Kim and Nha2001), suggesting a long-term widening out of the two stars, to preserve angular momentum, with mass transfer from the secondary in a ‘semi-detached’ state. In saying that, it is noteworthy that various physical factors affect the stellar interaction processes, including magnetic braking, short-term flow instabilities or dissipative effects. Without additional evidence, the interpretation of apparent period variation over a relatively short time interval remains speculative.
$P \approx 0.6483~d$
). The period appears to be slowly increasing (Kreiner, Kim, & Nha Reference Kreiner, Kim and Nha2001), suggesting a long-term widening out of the two stars, to preserve angular momentum, with mass transfer from the secondary in a ‘semi-detached’ state. In saying that, it is noteworthy that various physical factors affect the stellar interaction processes, including magnetic braking, short-term flow instabilities or dissipative effects. Without additional evidence, the interpretation of apparent period variation over a relatively short time interval remains speculative.
S Ant has been the subject of various studies since its discovery (Paul Reference Paul1891), though the star has been considered a ‘difficult’ object (Joy Reference Joy1926; Popper Reference Popper1956) and received relatively limited spectroscopic attention hitherto. Joy (Reference Joy1926) observed S Ant between 1917 and 1921 from Mount Wilson and confirmed its identification as an eclipsing binary. A further 26 spectra were obtained from Mount Wilson in 1954, but researchers struggled to identify features other than the hydrogen Balmer lines of the primary, due to the high degree of rotational broadening and blending (Popper Reference Popper1956).
Duerbeck & Ruciński (2007) produced RV amplitudes for S Ant of
 $K_1 = 77.8$
,
$K_1 = 77.8$
,
 $K_2 = 234.1$
, and
$K_2 = 234.1$
, and
 $V_{\gamma}$
= 26.2 km s
$V_{\gamma}$
= 26.2 km s
 $^{-1}$
, with error estimates of about 3 km s
$^{-1}$
, with error estimates of about 3 km s
 $^{-1}$
, on the basis of a small number of reliable data-points (6 for the primary and 4 for the secondary) that were gathered in 1996 with the ESO 1.52m telescope at La Silla. This is significantly different from the solution of Popper (Reference Popper1956), who claimed
$^{-1}$
, on the basis of a small number of reliable data-points (6 for the primary and 4 for the secondary) that were gathered in 1996 with the ESO 1.52m telescope at La Silla. This is significantly different from the solution of Popper (Reference Popper1956), who claimed
 $K_1 = 92.3$
and
$K_1 = 92.3$
and
 $V_{\gamma} = -1.2$
km/s, with uncertainty estimates of about 1 km s
$V_{\gamma} = -1.2$
km/s, with uncertainty estimates of about 1 km s
 $^{-1}$
. Duerbeck & Ruciński (2007) referred to the previous photometric analysis of Russo et al. (Reference Russo, Sollazzo, Maceroni and Milano1982), who found inconsistencies with the results of their LC modelling using the wd code of Wilson & Devinney (Reference Wilson and Devinney1971). Influenced by Popper’s spectroscopic results, Russo et al. reported a photometric mass-ratio of
$^{-1}$
. Duerbeck & Ruciński (2007) referred to the previous photometric analysis of Russo et al. (Reference Russo, Sollazzo, Maceroni and Milano1982), who found inconsistencies with the results of their LC modelling using the wd code of Wilson & Devinney (Reference Wilson and Devinney1971). Influenced by Popper’s spectroscopic results, Russo et al. reported a photometric mass-ratio of
 $0.59 \pm 0.02$
, though this is significantly at odds with the mass ratio given by Duerbeck & Ruciński (
$0.59 \pm 0.02$
, though this is significantly at odds with the mass ratio given by Duerbeck & Ruciński (
 $q = 0.33 \pm 0.02$
). The latter mentioned a ‘notorious unreliability’ of contact binary mass ratios estimated from photometry alone. Duerbeck &Ruciński preferred the later spectral type of F3V assigned by Houk (Reference Houk1982), rather than the A8 classification of Joy (Reference Joy1926), recalled by Abt (Reference Abt2005). The use of their broadening function technique to determine more reliable RV values is noteworthy (see the papers of Ruciński 2015, 2020 dealing with AW UMa and
$q = 0.33 \pm 0.02$
). The latter mentioned a ‘notorious unreliability’ of contact binary mass ratios estimated from photometry alone. Duerbeck &Ruciński preferred the later spectral type of F3V assigned by Houk (Reference Houk1982), rather than the A8 classification of Joy (Reference Joy1926), recalled by Abt (Reference Abt2005). The use of their broadening function technique to determine more reliable RV values is noteworthy (see the papers of Ruciński 2015, 2020 dealing with AW UMa and
 $\varepsilon$
CrA).
$\varepsilon$
CrA).
One aim of our present work is to report spectroscopic data of suitable quality that will improve the parametrization of both S Ant and
 $\varepsilon$
CrA. To this end, these data are combined with high-precision photometry from the TESS satellite (Ricker et al. Reference Ricker2015), as well as supporting ground-based BVI photometry.
$\varepsilon$
CrA. To this end, these data are combined with high-precision photometry from the TESS satellite (Ricker et al. Reference Ricker2015), as well as supporting ground-based BVI photometry.
1.2
 $\varepsilon$
Corona Australis
$\varepsilon$
Corona Australis

 $\varepsilon$
CrA (= HD 175813; HR 7152; mag V
$\varepsilon$
CrA (= HD 175813; HR 7152; mag V
 $\approx$
4.8, B-V
$\approx$
4.8, B-V
 $\approx$
0.36, P
$\approx$
0.36, P
 $\approx$
0.591 d) is a bright F4V type star, at a distance of about 31 pc. The binary is reported to have a relatively high systemic velocity of close to 58 km s
$\approx$
0.591 d) is a bright F4V type star, at a distance of about 31 pc. The binary is reported to have a relatively high systemic velocity of close to 58 km s
 $^{-1}$
(SIMBAD, Wenger et al., Reference Wenger2000). It has received rather less published attention than S Ant, although sharing similar A-class contact binary system properties. Cousins & Cox (Reference Cousins and Cox1950) observed its eclipsing binary nature and later produced a report (Cousins Reference Cousins1964). The LCs of Knipe (Reference Knipe1967) and Tapia (Reference Tapia1969) were modelled by Twigg (Reference Twigg1979) and Wilson & Raichur (Reference Wilson and Raichur2011), both finding an orbital inclination of
$^{-1}$
(SIMBAD, Wenger et al., Reference Wenger2000). It has received rather less published attention than S Ant, although sharing similar A-class contact binary system properties. Cousins & Cox (Reference Cousins and Cox1950) observed its eclipsing binary nature and later produced a report (Cousins Reference Cousins1964). The LCs of Knipe (Reference Knipe1967) and Tapia (Reference Tapia1969) were modelled by Twigg (Reference Twigg1979) and Wilson & Raichur (Reference Wilson and Raichur2011), both finding an orbital inclination of
 $\sim$
73 degrees. These papers adopted Lucy (Reference Lucy1967)’s prescription for convective-model gravity darkening coefficients, playing down the
$\sim$
73 degrees. These papers adopted Lucy (Reference Lucy1967)’s prescription for convective-model gravity darkening coefficients, playing down the
 $\sim$
 $6\,500$
K surface temperature indications. Twigg (Reference Twigg1979) estimated the mass ratio as
$6\,500$
K surface temperature indications. Twigg (Reference Twigg1979) estimated the mass ratio as
 $0.114 \pm 0.003$
and Wilson & Raichur (Reference Wilson and Raichur2011) as
$0.114 \pm 0.003$
and Wilson & Raichur (Reference Wilson and Raichur2011) as
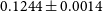 $0.1244 \pm 0.0014$
. Tapia & Whelan (Reference Tapia and Whelan1975) had earlier undertaken a radial velocity analysis on the basis of over 70 spectrograms obtained in good weather conditions at Cerro Tololo in 1972. Goecking & Duerbeck (Reference Goecking and Duerbeck1993) who gave an essentially similar mass ratio at
$0.1244 \pm 0.0014$
. Tapia & Whelan (Reference Tapia and Whelan1975) had earlier undertaken a radial velocity analysis on the basis of over 70 spectrograms obtained in good weather conditions at Cerro Tololo in 1972. Goecking & Duerbeck (Reference Goecking and Duerbeck1993) who gave an essentially similar mass ratio at
 $0.128 \pm 0.014$
, used 55 Coude spectrograms taken with the 1.5-m telescope at La Silla Observatory, Chile.
$0.128 \pm 0.014$
, used 55 Coude spectrograms taken with the 1.5-m telescope at La Silla Observatory, Chile.
Ruciński (2020) presented a detailed analysis of the system, in which he argued that the Stepien (Reference Stepien1995) model offers an improved explanation of the spectroscopic results. Rucinski’s high-quality data on
 $\varepsilon$
CrA were obtained using the CHIRON spectrograph on the CTIO/SMARTS 1.5-m telescope over 8 nights in July 2018, during somewhat variable weather conditions. Some 361 exposures were made with the high resolution of
$\varepsilon$
CrA were obtained using the CHIRON spectrograph on the CTIO/SMARTS 1.5-m telescope over 8 nights in July 2018, during somewhat variable weather conditions. Some 361 exposures were made with the high resolution of
 $\sim$
80 000. The spectral window was arranged to be from 506.05 to 529.20 nm, so centred on the Mg I b triplet. Rucinski commented on apparent discrepancies with conventional contact binary models, noting a rapid, non-synchronised rotation of the primary component, apparently unaffected by the secondary. That component appears surrounded by a complex gas flow that contravenes the equilibrium requirements of Roche surfaces.
$\sim$
80 000. The spectral window was arranged to be from 506.05 to 529.20 nm, so centred on the Mg I b triplet. Rucinski commented on apparent discrepancies with conventional contact binary models, noting a rapid, non-synchronised rotation of the primary component, apparently unaffected by the secondary. That component appears surrounded by a complex gas flow that contravenes the equilibrium requirements of Roche surfaces.
2 Spectroscopy
2.1 S Ant
Spectroscopic data on S Ant were gathered over 5 nights during the period January 21–26 2021 with the High Efficiency and Resolution Canterbury University Large Échelle Spectrograph (HERCULES) of the Department of Physics and Astronomy, University of Canterbury Hearnshaw et al. Reference Hearnshaw, Barnes, Kershaw, Frost, Graham, Ritchie and Nankivell2002). This was attached to the 1m McLellan telescope at the Mt John Observatory (UCMJO). Images were collected with a 4 k
 $\times$
4 k Spectral Instruments (SITe) camera (Skuljan Reference Skuljan, Kurtz and Pollard2004). The 100
$\times$
4 k Spectral Instruments (SITe) camera (Skuljan Reference Skuljan, Kurtz and Pollard2004). The 100
 $\mu$
m fibre, which is suited to typical seeing conditions at Mt John, enables a theoretical resolution of
$\mu$
m fibre, which is suited to typical seeing conditions at Mt John, enables a theoretical resolution of
 $\sim$
40 000. Exposure times were usually
$\sim$
40 000. Exposure times were usually
 $\sim$
900 s for this 6th mag star. Raw observations were reduced with the latest version of the software hrsp (Skuljan Reference Skuljan2021), that produces wavelength calibrated and normalised output conveniently in ‘FITS’Footnote c formatted files. Each recording covers the wavelength range 4 520–6 810 Å. The log of observations is given in Table B1 and a descriptive summary of the observed spectra, giving line identifications and suitability for measurement, is presented as Table B3 (which is placed into the appendix so as not to disrupt the paper flow). Many metallic absorption lines are present in these spectra, though they are considerably widened by rotational effects and often blended. While the primary star’s lines are readily located it is often difficult to identify clearly those of the secondary that have low signal-to-noise ratios and may be relatively more affected by material motions in the source medium (Ruciński 2020).
$\sim$
900 s for this 6th mag star. Raw observations were reduced with the latest version of the software hrsp (Skuljan Reference Skuljan2021), that produces wavelength calibrated and normalised output conveniently in ‘FITS’Footnote c formatted files. Each recording covers the wavelength range 4 520–6 810 Å. The log of observations is given in Table B1 and a descriptive summary of the observed spectra, giving line identifications and suitability for measurement, is presented as Table B3 (which is placed into the appendix so as not to disrupt the paper flow). Many metallic absorption lines are present in these spectra, though they are considerably widened by rotational effects and often blended. While the primary star’s lines are readily located it is often difficult to identify clearly those of the secondary that have low signal-to-noise ratios and may be relatively more affected by material motions in the source medium (Ruciński 2020).
We checked the spectral type designation using our measurements of the H
 $_{\beta}$
equivalent width. The value was 4.9 Å – which would place the spectral class a little cooler than F3V, according to Jaschek & Jaschek (Reference Jaschek and Jaschek1987), but within one type-unit. Measurement of the B–V colour (Section 3.1) agrees with this spectral type, after a small correction for interstellar reddening.
$_{\beta}$
equivalent width. The value was 4.9 Å – which would place the spectral class a little cooler than F3V, according to Jaschek & Jaschek (Reference Jaschek and Jaschek1987), but within one type-unit. Measurement of the B–V colour (Section 3.1) agrees with this spectral type, after a small correction for interstellar reddening.
For two of the observations close to orbital phase 0.5 (w9236044s, w9240025s, see Table B1), the secondary component was totally eclipsed, allowing us to treat those spectral images as the primary component only. They could thus be directly modelled with synthetic spectra calculated directly with appropriate model atmosphere parameters. Fixing the surface gravitational acceleration of the primary component at log
 $g=3.98$
(cgs), and using mass, radius, and composition estimates anticipated for the primary component, synthetic spectra from Kurucz model atmospheres could be constructed for a grid of effective temperature and projected rotation values to compare with the observations. Preliminary findings imply a temperature of the primary component of 7 100 K and its projected equatorial surface rotational velocity of 150 km/s. The temperature of the primary component is in good agreement with its B–V colour (Section 3.1) and its H
$g=3.98$
(cgs), and using mass, radius, and composition estimates anticipated for the primary component, synthetic spectra from Kurucz model atmospheres could be constructed for a grid of effective temperature and projected rotation values to compare with the observations. Preliminary findings imply a temperature of the primary component of 7 100 K and its projected equatorial surface rotational velocity of 150 km/s. The temperature of the primary component is in good agreement with its B–V colour (Section 3.1) and its H
 $_{\beta}$
equivalent width obtained above. The models are plotted on the observations in Fig. B1.
$_{\beta}$
equivalent width obtained above. The models are plotted on the observations in Fig. B1.
Sixteen spectra around the elongation phases of S Ant, from observations collected in clear weather, have been selected for RV analysis. The highly broadened lines did not completely separate, even at the greatest observed elongation.
As a check on procedure, the data of Duerbeck & Ruciński (2007) were analysed using the ELISa (Čokina, Fedurco, & Parimucha 2021) package for parametrisation, and a Markov Chain Monte Carlo (MCMC) technique for the curve-fitting process. ELISa includes both LC and RV analytical components. The ELISa search for an optimal parameter set depends on Markov Chain sampling of parameter hyperspace, while the probability estimation invokes an essentially random, ‘Monte Carlo’, distribution of observational errors.
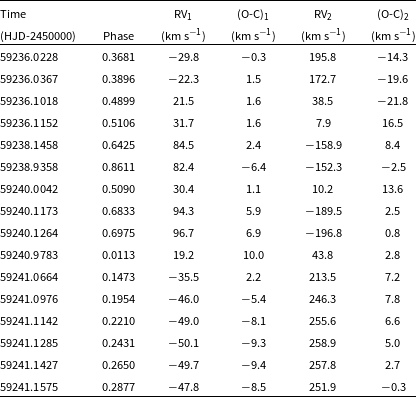
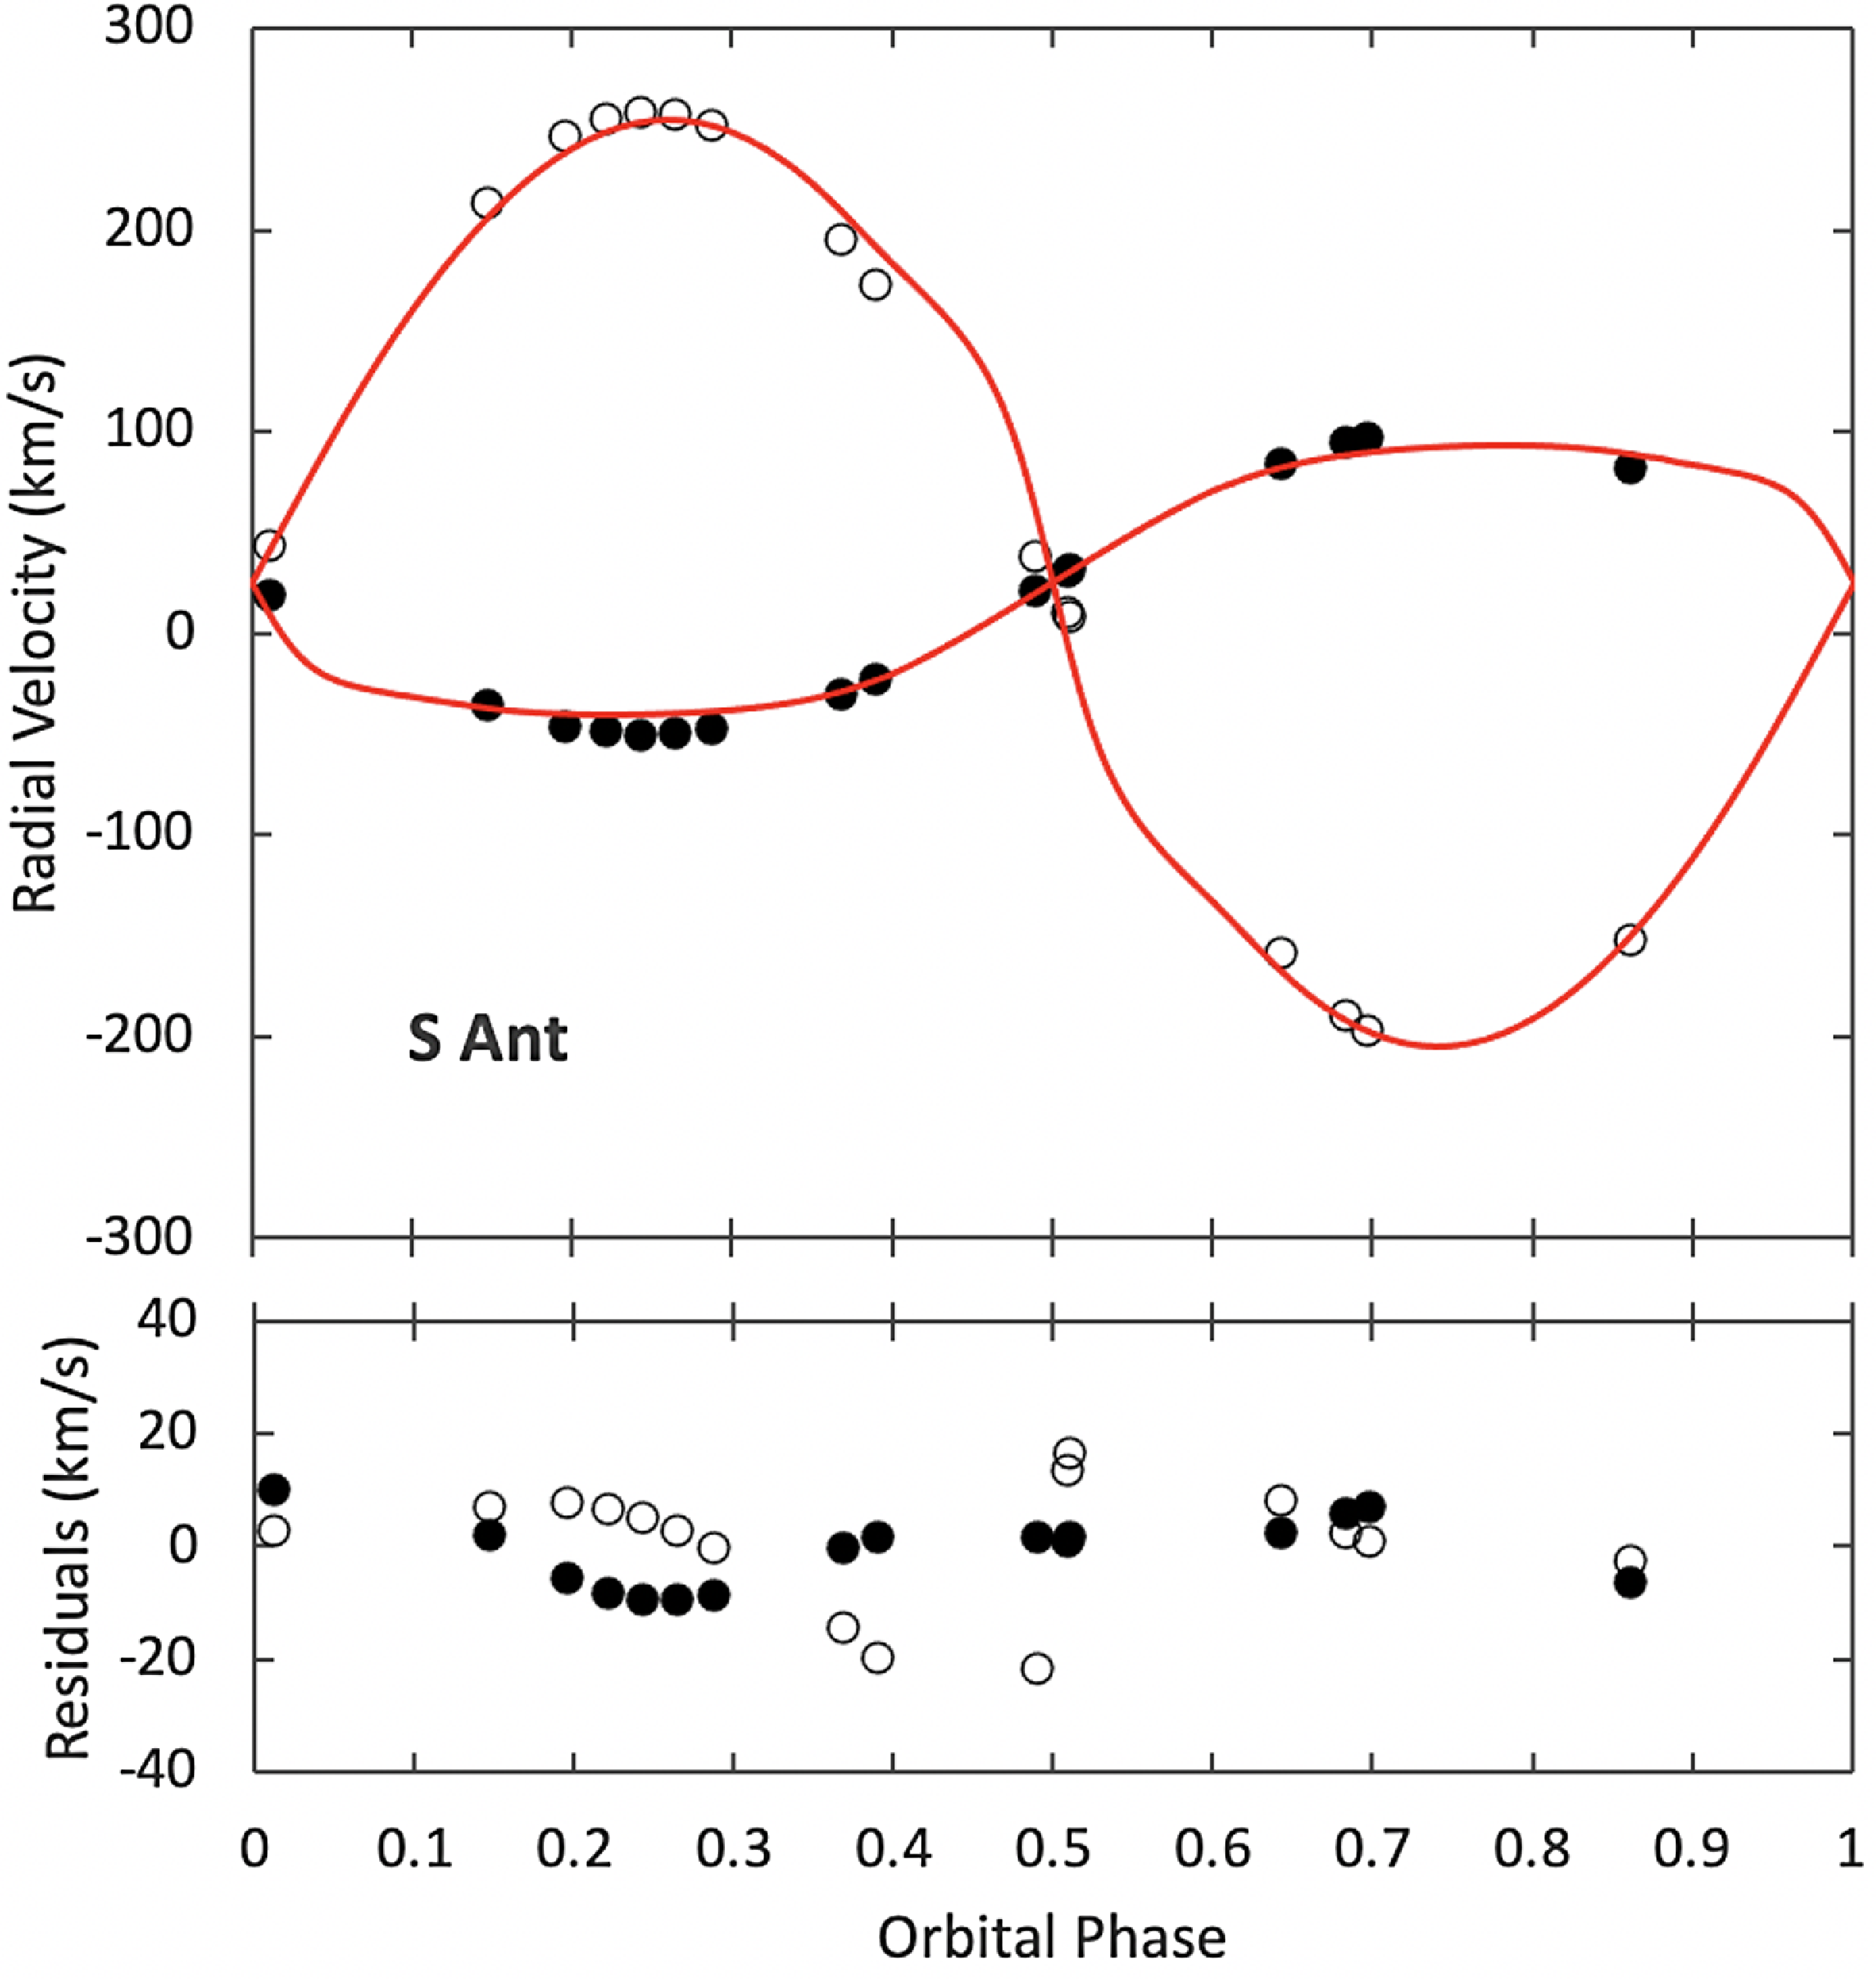
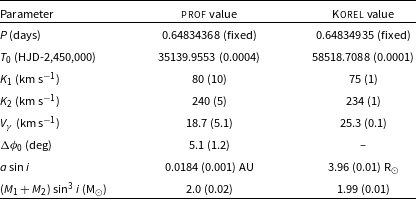
With preliminary orbital parameters obtained by ELISa, we applied the spectral disentangling technique korel (Hadrava Reference Hadrava1995) to the observed spectra of S Ant. Spectra during eclipses were excluded, except for one mid-eclipse spectrum, where the Rossiter-McLoughlin effect (Rossiter Reference Rossiter1924; McLaughlin Reference McLaughlin1924) vanishes. The mean relative light contributions of the components were taken from the results of our initial LC analysis (next Section). A total of 8 spectral orders (93, 97–103) were processed with korel. The derived RVs from each order have been averaged to produce the final set. The final RVs are presented in Table 1 and displayed in Fig. 2. In Table 2 we present orbital parameters from the spectral disentangling procedure, where symbols have their usual meanings. Uncertainty estimates are produced as part of the output of the fitting program.
Radial velocity measurements of the components of S Ant from Korel applied to UCMJO data. The values in the
 $O-C$
columns represent the deviations of the individual measurements from the fitted RV curves. Orbital phases were calculated using the quadratic ephemeris given in Table 8.
$O-C$
columns represent the deviations of the individual measurements from the fitted RV curves. Orbital phases were calculated using the quadratic ephemeris given in Table 8.
Radial velocity curves of S Ant from Korel applied to UCMJO data. Residuals to the RV model were plotted in the bottom figure. RVs of the primary and the secondary components are marked as filled and hollow symbols, respectively. Orbital phases were calculated using the quadratic ephemeris given in Table 8.
S Ant: Fitting parameters for RV data from UCMJO.
 $V_{\gamma}$
value of Korel solution has been adopted from individual RV measurements.
$V_{\gamma}$
value of Korel solution has been adopted from individual RV measurements.
In Fig. 3, we display reconstructed mean spectra of the strong, measurable features in the
 $\lambda$
552-559 nm region of the component stars of S Ant, together with residuals from the korel fits. It appears from the residual plots, that there is no significant additional component in these spectra. As well, profile fitting using the program prof (see, e.g. Oláh et al. Reference Oláh, Budding, Butler, Houdebine, Gimenez and Zeilik1992) enabled us to determine Doppler shifts of the relatively well-defined
$\lambda$
552-559 nm region of the component stars of S Ant, together with residuals from the korel fits. It appears from the residual plots, that there is no significant additional component in these spectra. As well, profile fitting using the program prof (see, e.g. Oláh et al. Reference Oláh, Budding, Butler, Houdebine, Gimenez and Zeilik1992) enabled us to determine Doppler shifts of the relatively well-defined
 $\lambda$
4824.13 Cr II line to be determined in a consistent way. In Table 2 we also present orbital parameters from the RV data obtained with the program prof.
$\lambda$
4824.13 Cr II line to be determined in a consistent way. In Table 2 we also present orbital parameters from the RV data obtained with the program prof.
. Disentangled spectra of the S Ant components (top), together with residuals (bottom). Numbers on the right side of the residual plot refer to the orbital phase.
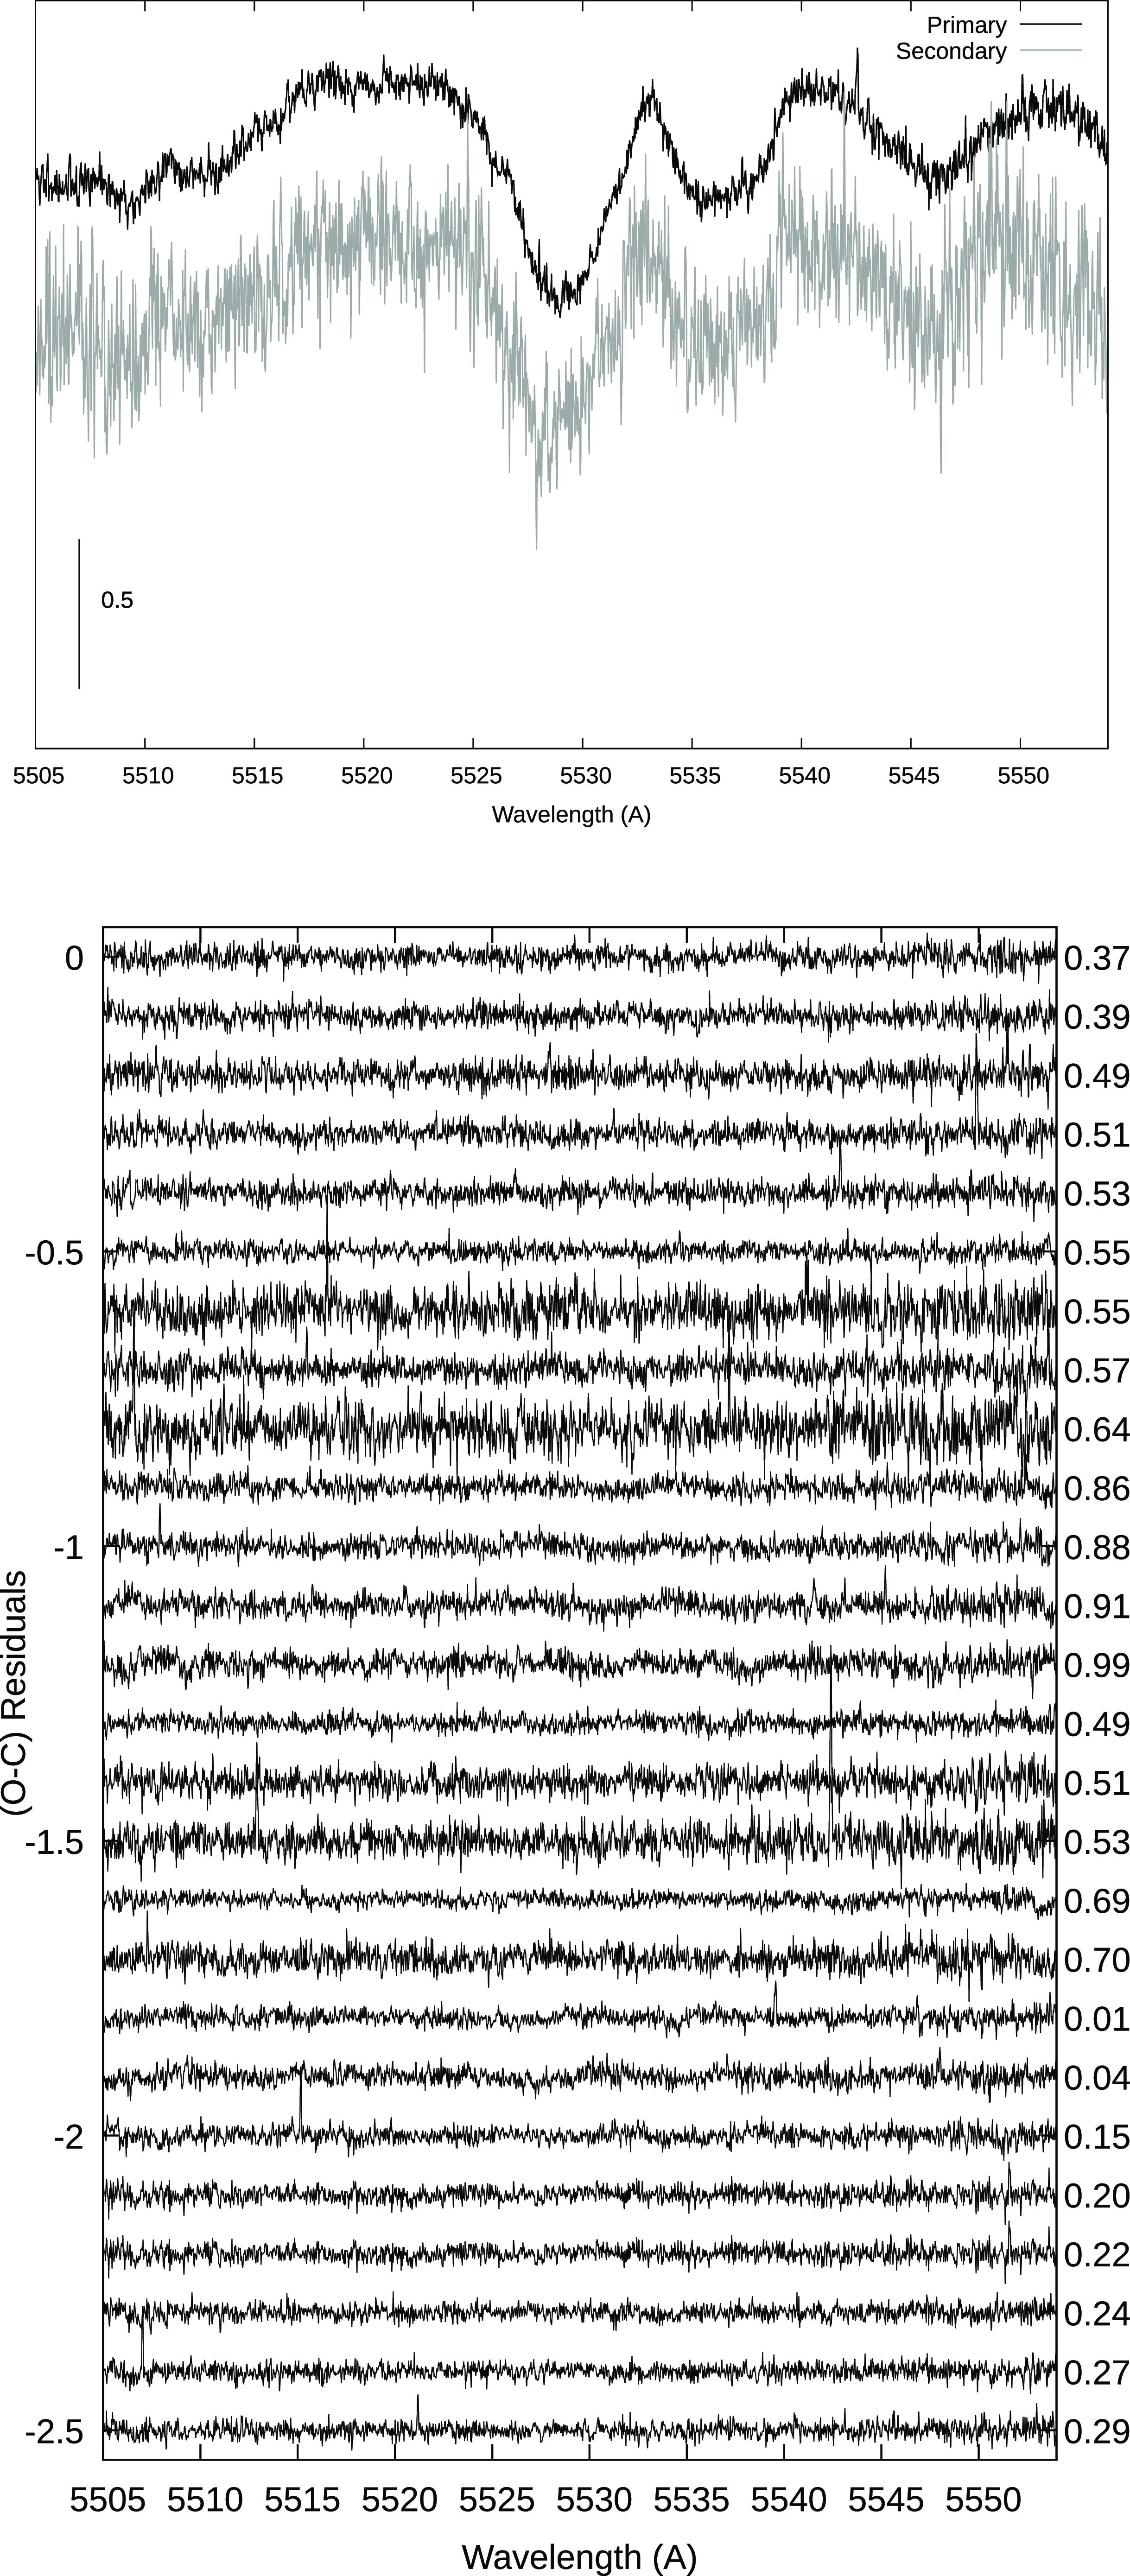
The parameters listed in Table 2, apart from
 $K_1$
that derives from direct measurements, depend on constraints imposed by the physical circumstances. Thus, the mass function f (neglecting the eccentricity term and with the constant
$K_1$
that derives from direct measurements, depend on constraints imposed by the physical circumstances. Thus, the mass function f (neglecting the eccentricity term and with the constant
 $C = 1.03615\times 10^{-7}$
) yields:
$C = 1.03615\times 10^{-7}$
) yields:
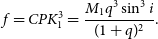 \begin{equation} f = CP K_1^3 = \frac{M_1 q^3 \sin^3 i}{(1+q)^2} .\end{equation}
This can be re-written as:
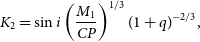 \begin{equation} K_2 = \sin i \left( \frac{M_1}{CP} \right)^{1/3} ( 1 + q)^{-2/3},\end{equation}
where the right side becomes slowly varying for low q, with
 $M_1$
constrained by the spectral type. The result is that
$M_1$
constrained by the spectral type. The result is that
 $K_2 \approx 235 \pm 5$
km s
$K_2 \approx 235 \pm 5$
km s
 $^{-1}$
, for plausible values of q in the range 0.25–0.35 and primary RV amplitudes in the range 65–85 km s
$^{-1}$
, for plausible values of q in the range 0.25–0.35 and primary RV amplitudes in the range 65–85 km s
 $^{-1}$
. Values of
$^{-1}$
. Values of
 $K_2$
inferred from direct measurements are compatible with this but have a much greater probability of error.
$K_2$
inferred from direct measurements are compatible with this but have a much greater probability of error.
2.2
$\varepsilon$
CrA

The spectrographic data for
 $\varepsilon$
CrA were obtained with essentially similar UCMJO arrangements as reported above for S Ant, except that the data for
$\varepsilon$
CrA were obtained with essentially similar UCMJO arrangements as reported above for S Ant, except that the data for
 $\varepsilon$
CrA were obtained in August 2006. The log of observations is given in Table B2. See Table B4 (in the appendix) for a discussion of key features in the spectra.
$\varepsilon$
CrA were obtained in August 2006. The log of observations is given in Table B2. See Table B4 (in the appendix) for a discussion of key features in the spectra.
We started the analysis by trial-fitting the radial velocities (RVs) of Ruciński (2020), adopting Ruciński’s period and applying again the ELISa program (Čokina, Fedurco, &Parimucha 2021). We found very similar results to those of Ruciński (2020), i.e. mass ratio
 $q = 0.128^{+0.005}_{-0.003}$
,
$q = 0.128^{+0.005}_{-0.003}$
,
 $a \sin{i} = 3.54 \pm 0.04$
R
$a \sin{i} = 3.54 \pm 0.04$
R
 $_{\odot}$
, and centre of mass velocity
$_{\odot}$
, and centre of mass velocity
 $V_{\gamma} = 61.88^{+0.48}_{-2.59}$
km s
$V_{\gamma} = 61.88^{+0.48}_{-2.59}$
km s
 $^{-1}$
, giving confidence to the parameterisation procedures. The high systemic velocity (Fuchs &Wielen, Reference Fuchs and Wielen1987) suggests a great age to the binary, in keeping with other ideas about low mass-ratio A-class contact binaries.
$^{-1}$
, giving confidence to the parameterisation procedures. The high systemic velocity (Fuchs &Wielen, Reference Fuchs and Wielen1987) suggests a great age to the binary, in keeping with other ideas about low mass-ratio A-class contact binaries.
As in the case of S Ant, the secondary component of
 $\varepsilon$
CrA was totally eclipsed at phase 0.5. For two of the observations close to orbital phase 0.5 (w3966049s, w3966050s, see Table B2), we modelled with the observed spectra with synthetic spectra calculated directly with appropriate model atmosphere parameters. This time the surface gravitational acceleration of the primary component was fixed at log g=4.05 (cgs), and using mass, radius and composition estimates anticipated for the primary component, synthetic spectra from Kurucz model atmospheres could be constructed for a grid of effective temperature and projected rotation values to compare with the observations. Preliminary findings are of rather low
$\varepsilon$
CrA was totally eclipsed at phase 0.5. For two of the observations close to orbital phase 0.5 (w3966049s, w3966050s, see Table B2), we modelled with the observed spectra with synthetic spectra calculated directly with appropriate model atmosphere parameters. This time the surface gravitational acceleration of the primary component was fixed at log g=4.05 (cgs), and using mass, radius and composition estimates anticipated for the primary component, synthetic spectra from Kurucz model atmospheres could be constructed for a grid of effective temperature and projected rotation values to compare with the observations. Preliminary findings are of rather low
 $T_\mathrm{eff}$
and high
$T_\mathrm{eff}$
and high
 $V_\mathrm{rot}$
sini values and we defer further discussion of this work in the present paper. Concerning high projected equatorial rotation velocities, however, this may align with the discussion of Ruciński (2020) on the complex velocity field in
$V_\mathrm{rot}$
sini values and we defer further discussion of this work in the present paper. Concerning high projected equatorial rotation velocities, however, this may align with the discussion of Ruciński (2020) on the complex velocity field in
 $\varepsilon$
CrA associated with the effects of mass transfer. The synthetic spectra plotted over the observed spectra are shown in Fig. B2.
$\varepsilon$
CrA associated with the effects of mass transfer. The synthetic spectra plotted over the observed spectra are shown in Fig. B2.
Preliminary mean relative light contributions of the components are essential for the proper decomposition of the component spectra from the composites in the source data (Hadrava Reference Hadrava1995, Reference Hadrava1997). The LC and RV analysis is thus, in principle, an iterative procedure, although this would seldom involve more than one parametrisation cycle.
The korel program, used in our study, applies Fourier transforms for spectral decomposition. Spectra obtained during eclipses (except the totalities) were not used for this, as complications, such as the Rossiter-McLaughlin effect (Rossiter Reference Rossiter1924; McLaughlin Reference McLaughlin1924), come into play. The korel code does not address such contingencies. Our RV measurements of the components of
 $\varepsilon$
CrA from Korel are presented in Table 3 and displayed in Fig. 4.
$\varepsilon$
CrA from Korel are presented in Table 3 and displayed in Fig. 4.
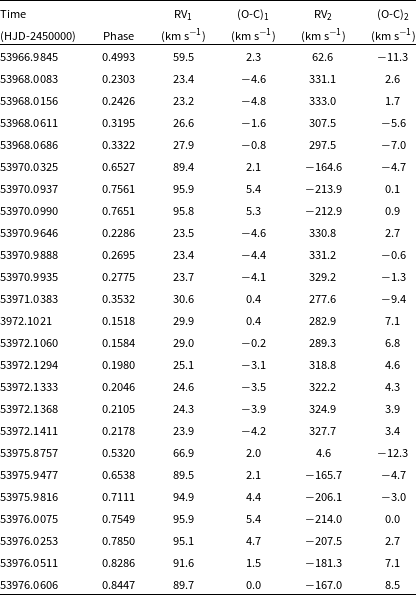
Radial velocity measurements of the components of
 $\varepsilon$
CrA from Korel applied to UCMJO data. The values in the
$\varepsilon$
CrA from Korel applied to UCMJO data. The values in the
 $O-C$
columns represent the deviations of the individual measurements from the fitted RV curves. Orbital phases were calculated using the linear ephemeris given in Table 3.
$O-C$
columns represent the deviations of the individual measurements from the fitted RV curves. Orbital phases were calculated using the linear ephemeris given in Table 3.
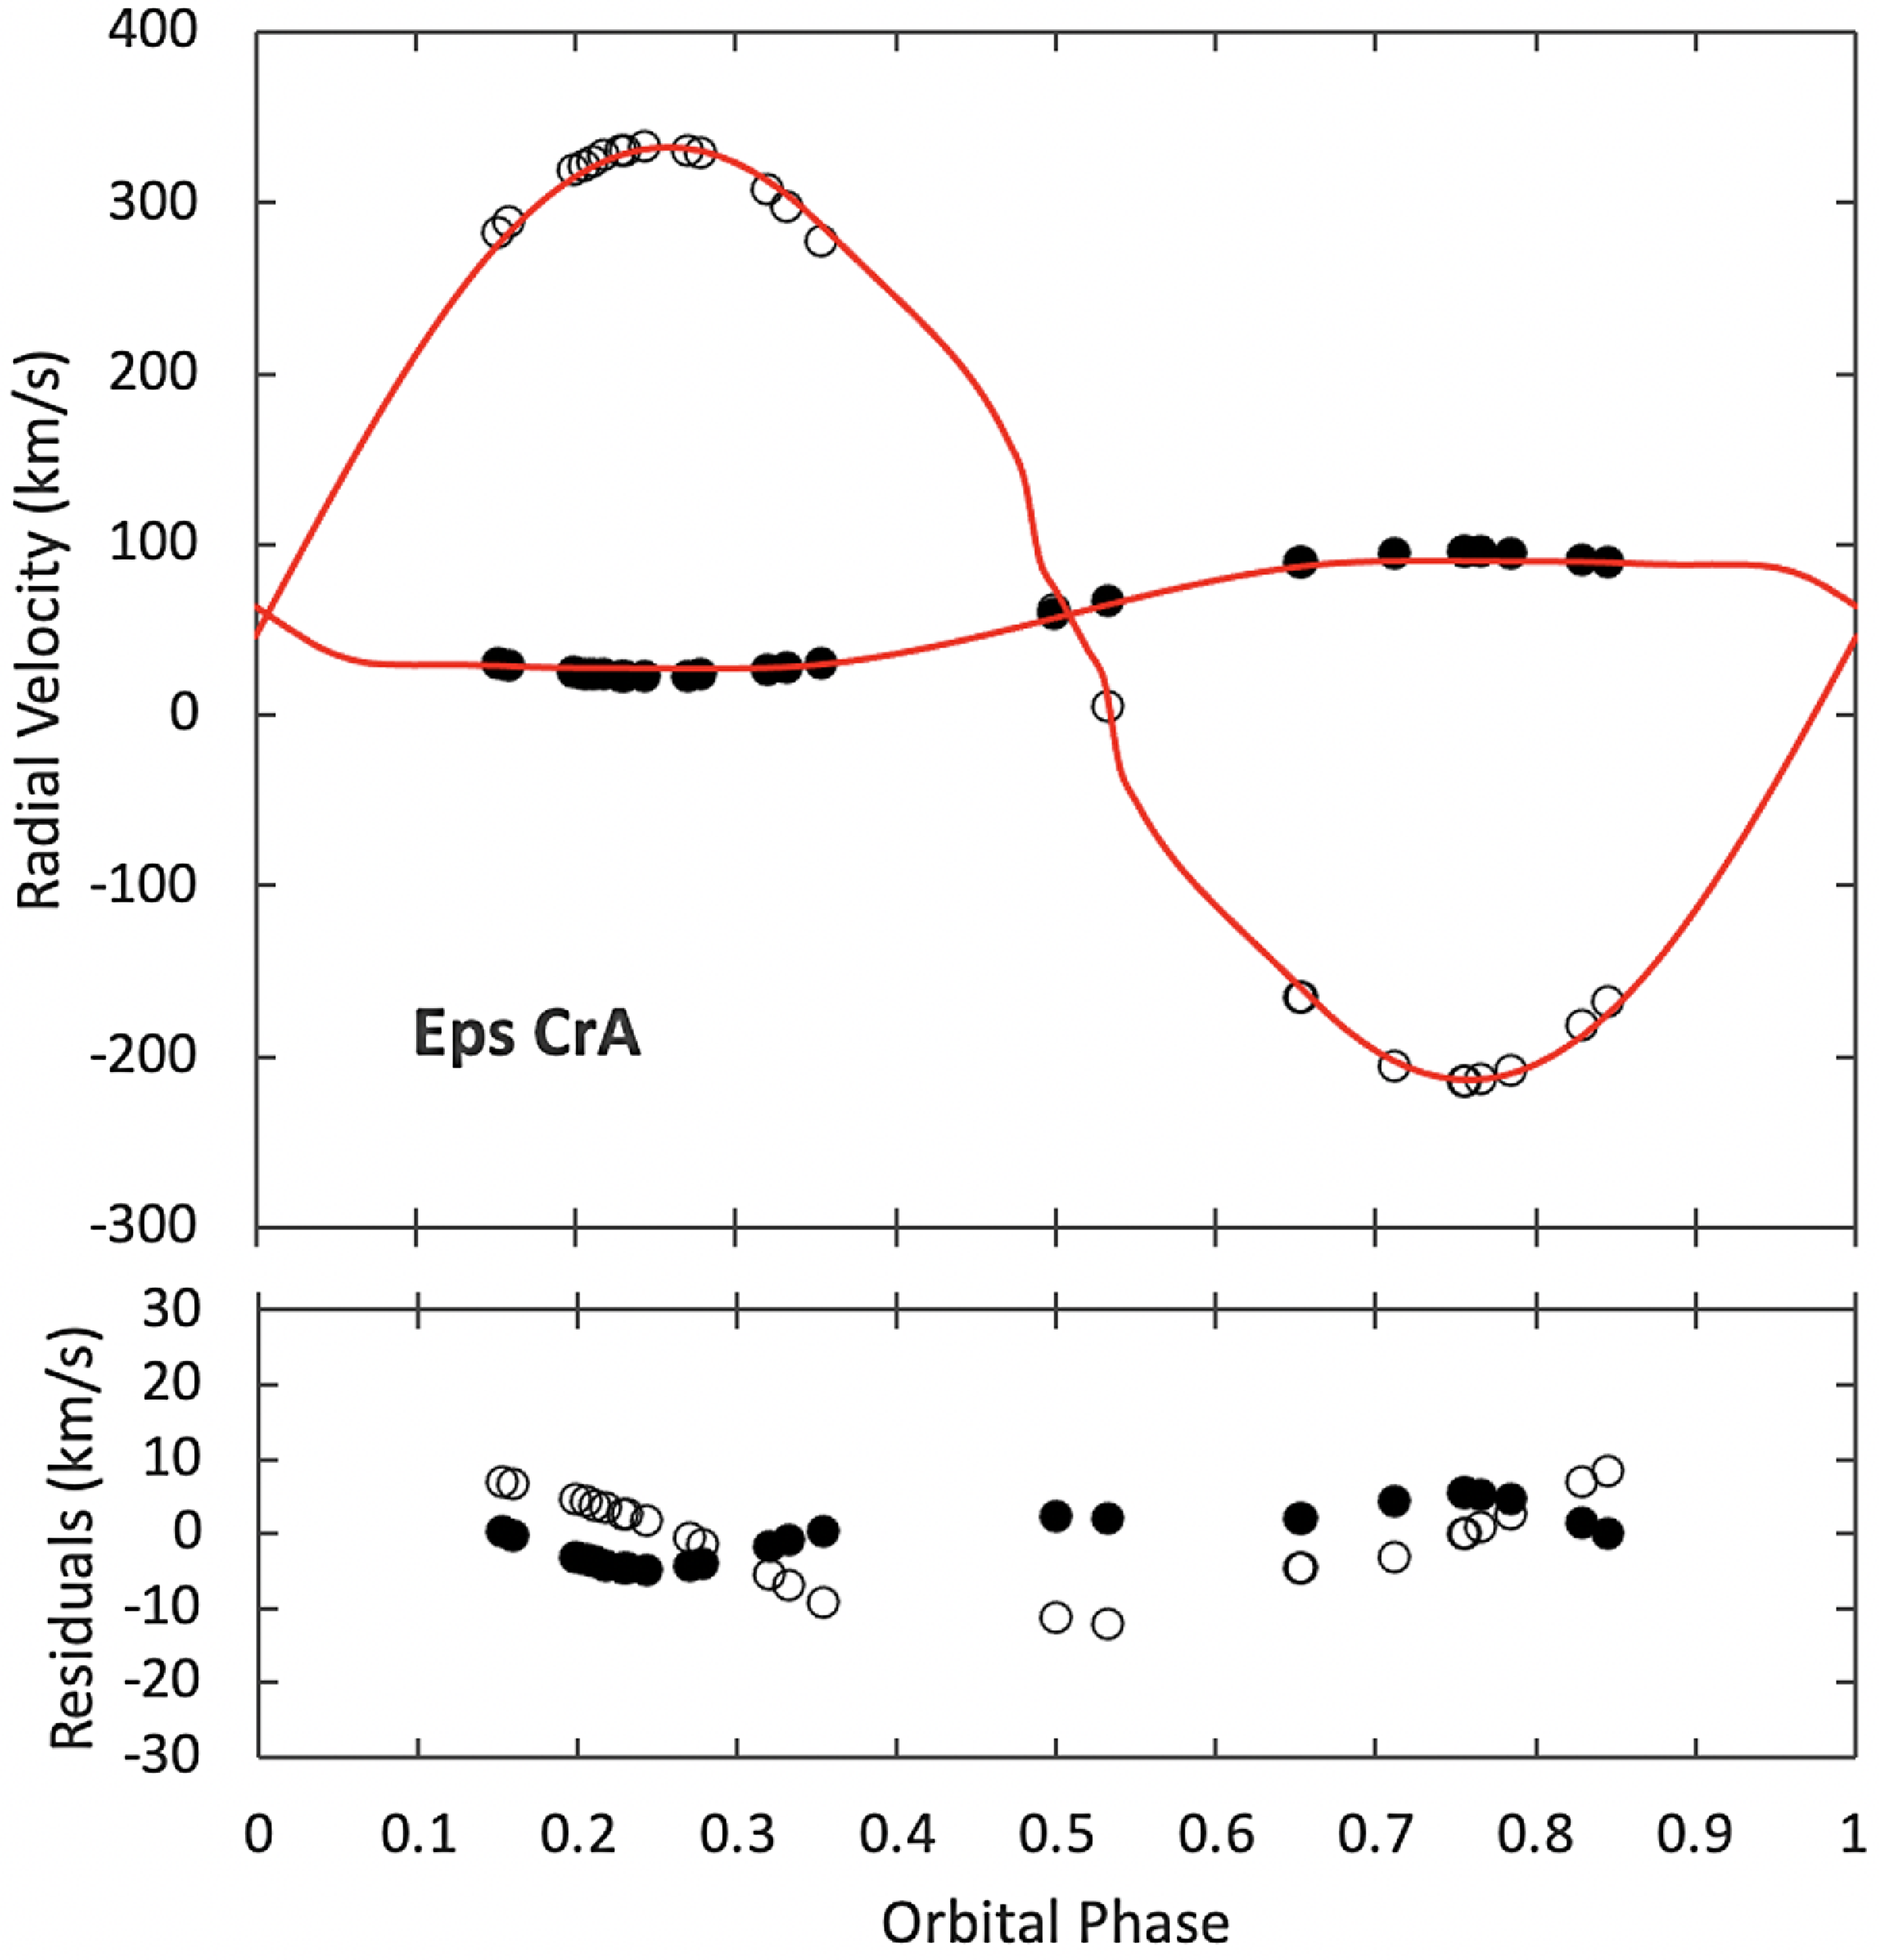
Radial velocity curves of
 $\varepsilon$
CrA from Korel applied to UCMJO data. Residuals to the RV model were plotted in the bottom figure. RVs of the primary and the secondary components are marked as filled and hollow symbols, respectively. Orbital phases were calculated using the linear ephemeris given in Table 4.
$\varepsilon$
CrA from Korel applied to UCMJO data. Residuals to the RV model were plotted in the bottom figure. RVs of the primary and the secondary components are marked as filled and hollow symbols, respectively. Orbital phases were calculated using the linear ephemeris given in Table 4.
Disentangled spectra of the
 $\varepsilon$
CrA components (top), together with residuals (bottom). Numbers on the right side of the O–C plot refer to the orbital phase.
$\varepsilon$
CrA components (top), together with residuals (bottom). Numbers on the right side of the O–C plot refer to the orbital phase.
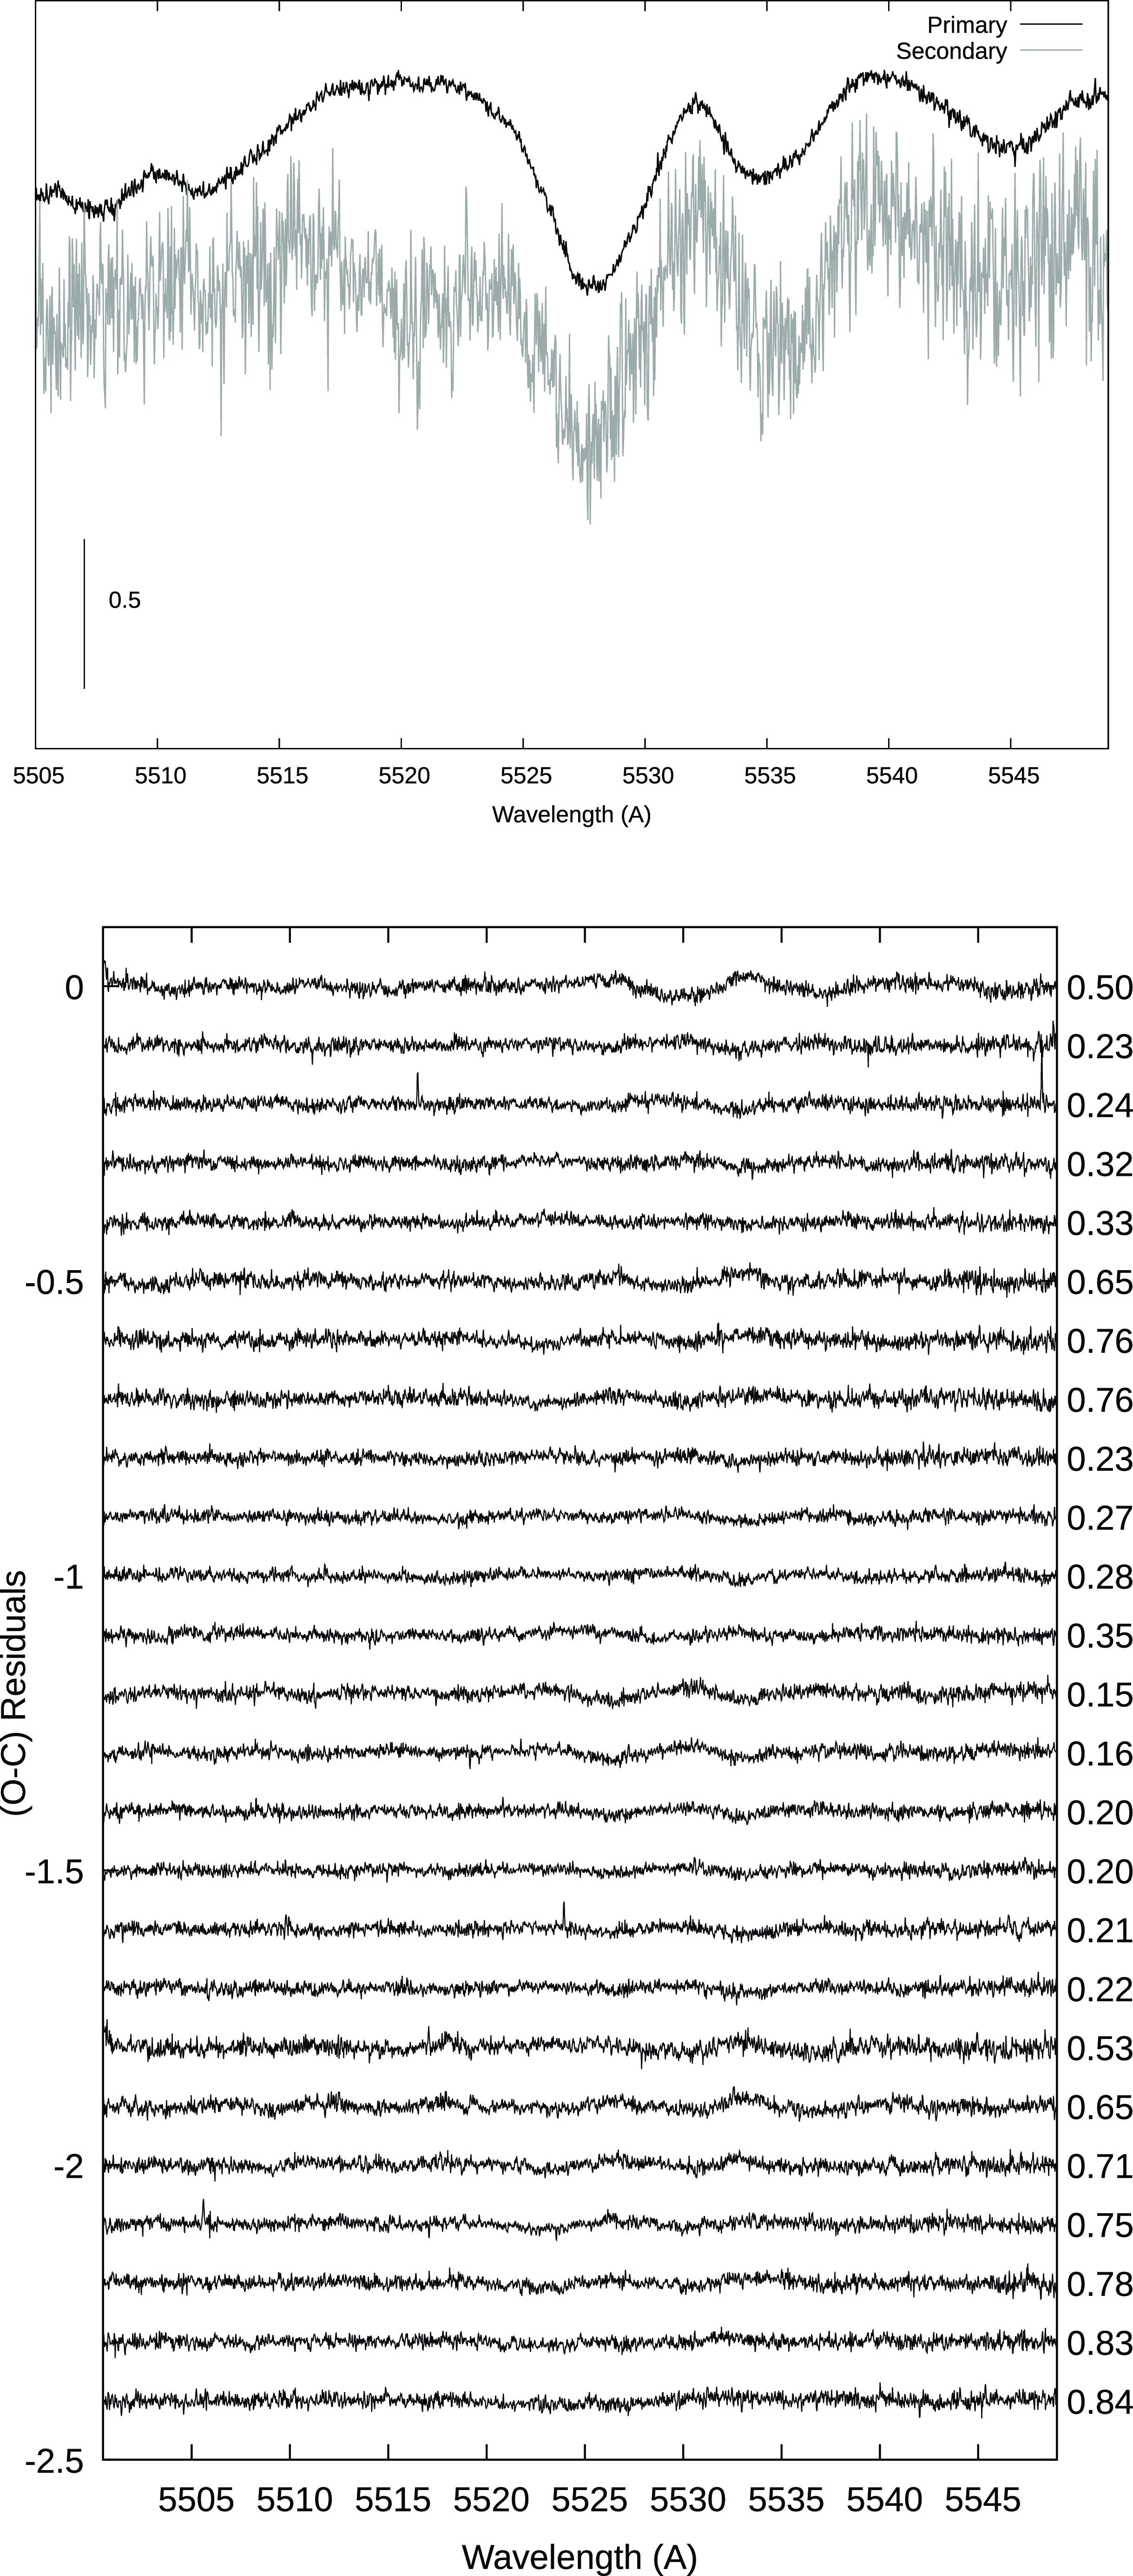
In this way, korel led to the spectroscopic orbital parameters given in Table 4, where symbols have their usual meanings and the uncertainties of parameters are calculated using a simplex procedure. Our velocity semi-amplitudes for the components turned out to be a few km/s higher than those listed in Ruciński (2020), the mass ratio retaining a similar value (
 $q = 0.133$
, see Table 4). Reconstructed primary and secondary spectra from order 103 (
$q = 0.133$
, see Table 4). Reconstructed primary and secondary spectra from order 103 (
 $\Delta\lambda\sim$
5 000–5 550 Å) are shown in the top panel of Fig. 5, where the lower panel shows the O–C residuals of the spectrum fittings. Order 103 shows relatively strong Th I and Fe I features at
$\Delta\lambda\sim$
5 000–5 550 Å) are shown in the top panel of Fig. 5, where the lower panel shows the O–C residuals of the spectrum fittings. Order 103 shows relatively strong Th I and Fe I features at
 $\lambda$
5528 and
$\lambda$
5528 and
 $\lambda$
5535, respectively.
$\lambda$
5535, respectively.
Comparison of korel orbital parameters with those of Ruciński (2020) for
 $\varepsilon$
CrA.
$\varepsilon$
CrA.

3. Photometry
3.1 S Ant photometry
BVI LCs of S Ant were collected by MB at the Congarinni Observatory (NSW 2447) using an 80 mm f6 refractor, stopped down to 50 mm to avoid saturation effects, and an Atik One 6.0 CCD camera equipped with Johnson-Cousins photometric filters. MaxIm DLTM software was used for image calibration and aperture photometry. An ensemble of 3 comparison stars was used (TYC 6613 678, TYC 6613 1556, and TYC 6613 130). The adopted values for the reference were V = 6.725, B–V = 0.200 and V–I = 0.139. From this, we determined for S Ant: V = 6.295, B–V = 0.326, V–I = 0.196; V = 6.304, B–V - 0.326, V–I = 0.197 at the first and second maxima respectively. At the secondary occultation minimum, we found: V = 6.746, B–V = 0.325, V–I = 0.198. These measures are in keeping with the literature values cited in Section 1.1, but the colours appear a little more blue than typical Main Sequence values of type F3 (Eker et al. Reference Eker2018).
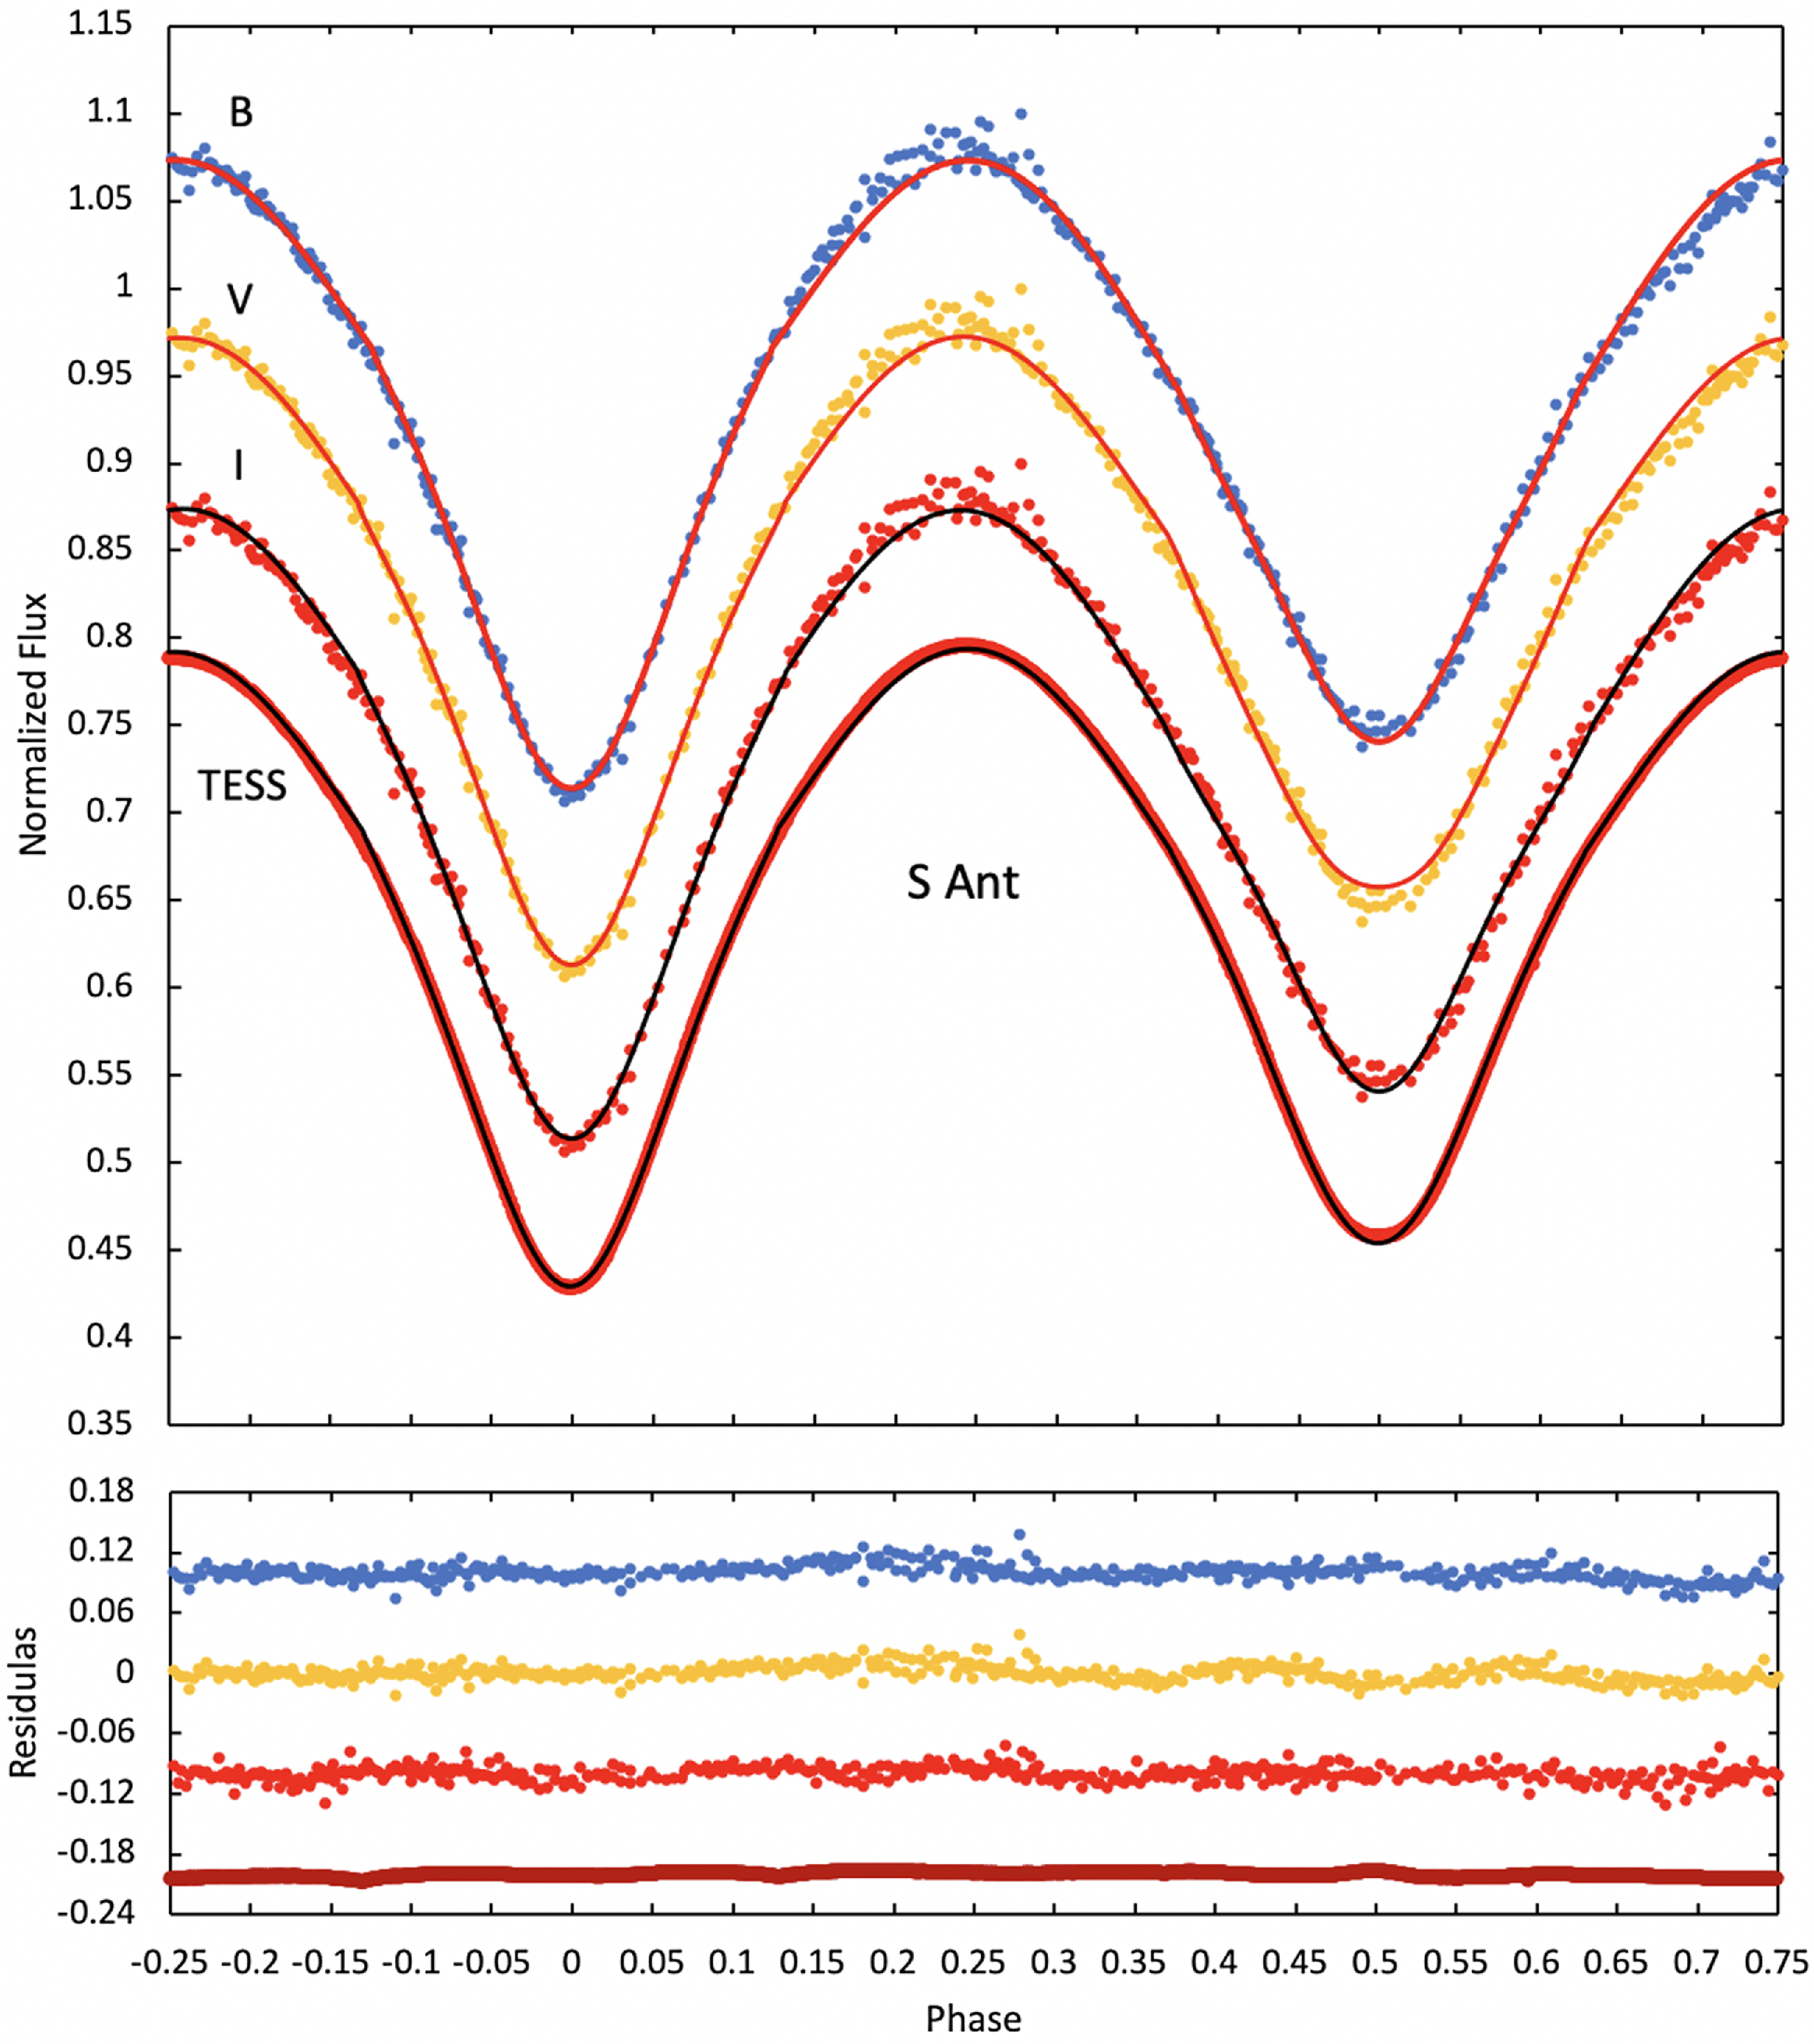
The LCs are presented in Fig. 6, together with the modelling results shown as smooth curves. We applied the optimal curve fitting program WinFitter (WF, Rhodes Reference Rhodes2023) for the LC modelling. The resulting parameter estimates are collected in Table 5.
Optimal parameters for the WinFitter photometric model fits to the ground-based BVI and TESS Sector 9 data for S Ant. The conservative uncertainty estimates reflect the spread of numerous curve-fitting results, rather than the formal errors of particular fits.
LC modelling for close binary stars often refers to the numerical integration procedure of Wilson & Devinney (Reference Wilson and Devinney1971) (hereafter referred to as WD), which represents the distorted component surfaces as equipotentials, according to the classical point-mass formulation attributed to Roche (Reference Roche1873) recalled in Ch. 3 of Kopal (Reference Kopal1959). Both the WD and WF methods converge to the same approximation for the surface perturbation when the internal structural constants
 $k_j$
are neglected, implying neglect also of the effects of tides on tides. The relevant formula, Eqn 1-11 in Ch.1, or 2-6 in Ch. 3 of Kopal (Reference Kopal1959), is:
$k_j$
are neglected, implying neglect also of the effects of tides on tides. The relevant formula, Eqn 1-11 in Ch.1, or 2-6 in Ch. 3 of Kopal (Reference Kopal1959), is:
 \begin{equation} \frac{ \Delta{\prime} r }{r_0} = q \sum^{4}_{j = 2} r_0^{j+1} (1 + 2k_j) P_j(\lambda) + n r_o^3(1 - \nu^2), \end{equation}
where r is the local stellar radius expressed as a fraction of the orbital separation of the components with mean value
 $r_0$
. The direction cosine of the angle between the radius vector
$r_0$
. The direction cosine of the angle between the radius vector
 $\hat{r}$
and the line of centres is here
$\hat{r}$
and the line of centres is here
 $\lambda$
, and
$\lambda$
, and
 $\nu$
is the direction cosine of the angle between
$\nu$
is the direction cosine of the angle between
 $\hat{r}$
and the rotation axis. The coefficients
$\hat{r}$
and the rotation axis. The coefficients
 $k_j$
(in WF) can be taken from suitable stellar models, e.g. Inlek, Budding, & Demircan (Reference Inlek, Budding and Demircan2017). They are set to zero in WD.
$k_j$
(in WF) can be taken from suitable stellar models, e.g. Inlek, Budding, & Demircan (Reference Inlek, Budding and Demircan2017). They are set to zero in WD.
The surface perturbations
 ${\Delta}{\prime} r$
are here serial harmonic functions, that start with terms of order
${\Delta}{\prime} r$
are here serial harmonic functions, that start with terms of order
 $r^3$
. The inclusion of terms of order
$r^3$
. The inclusion of terms of order
 $r^6$
and higher would imply the gravitational interaction of tides on tides being taken into account for self-consistency. Parallelism of WD and WF fitting functions, in which the mutual interactions of the perturbations are neglected, therefore continues through to terms of order
$r^6$
and higher would imply the gravitational interaction of tides on tides being taken into account for self-consistency. Parallelism of WD and WF fitting functions, in which the mutual interactions of the perturbations are neglected, therefore continues through to terms of order
 $r^5$
, implying three additive tidal terms. Rotation with constant, synchronised, angular velocity, as usually assumed, and required in the Roche approximation, calls for only one source term.
$r^5$
, implying three additive tidal terms. Rotation with constant, synchronised, angular velocity, as usually assumed, and required in the Roche approximation, calls for only one source term.
Ground-based BVI and TESS photometry of S Ant with the optimal model from WinFitter fitting. Residuals to the model are plotted in the lower figure.
We can see from Table 5, and the contact criterion
 $r_1 + r_2 \approx 0.75$
(Kopal Reference Kopal1959; Table 3.3), that the components of S Ant cannot be far from the idealised configuration of Roche lobes osculating at the L
$r_1 + r_2 \approx 0.75$
(Kopal Reference Kopal1959; Table 3.3), that the components of S Ant cannot be far from the idealised configuration of Roche lobes osculating at the L
 $_1$
point. The mean radii approximate to values corresponding to the mass ratio
$_1$
point. The mean radii approximate to values corresponding to the mass ratio
 $q \sim 0.3$
(see Table 3-1 of Kopal Reference Kopal1959). This prior value for q tallies with a consensus of previous literature estimates and our own spectroscopic RVs discussed in Section 2.1. The WF posteriors are thus consistent with a near-Roche configuration.
$q \sim 0.3$
(see Table 3-1 of Kopal Reference Kopal1959). This prior value for q tallies with a consensus of previous literature estimates and our own spectroscopic RVs discussed in Section 2.1. The WF posteriors are thus consistent with a near-Roche configuration.
We see directly from Fig. 6 and Table 5 that all four LCs show roughly the same ratio for the depths of the two minima (
 $\sim$
0.8). The lack of variation in relative depths with colour implies the two stars must have close photospheric temperatures. The LCs, by indicating a flatter central region of the secondary eclipse, point to S Ant being of the ‘A-type’ Binnendijk (Reference Binnendijk1970), where the larger, slightly brighter, star eclipses its companion at the secondary minimum. In keeping with this lack of colour variation, the ratio of
$\sim$
0.8). The lack of variation in relative depths with colour implies the two stars must have close photospheric temperatures. The LCs, by indicating a flatter central region of the secondary eclipse, point to S Ant being of the ‘A-type’ Binnendijk (Reference Binnendijk1970), where the larger, slightly brighter, star eclipses its companion at the secondary minimum. In keeping with this lack of colour variation, the ratio of
 $L_1/L_2$
is
$L_1/L_2$
is
 $\sim$
4 in the BVI wavebands. This result aligns with a coarse estimate for a ratio of radii
$\sim$
4 in the BVI wavebands. This result aligns with a coarse estimate for a ratio of radii
 $\sim$
0.6, in fair accord with the mass ratio, according to Kuiper (Reference Kuiper1941)’s approximation
$\sim$
0.6, in fair accord with the mass ratio, according to Kuiper (Reference Kuiper1941)’s approximation
 $r_2/r_1 \sim q^{0.46}$
. In turn, this points to similar effective surface temperatures.
$r_2/r_1 \sim q^{0.46}$
. In turn, this points to similar effective surface temperatures.
This preliminary assessment thus raises the classical question for contact binaries (Kuiper Reference Kuiper1941): why should two stars of such differing masses show closely similar surface temperatures? Note that this point applies to the EW systems as a whole, and it bespeaks some special conditions that apply to the group generally.
3.2 S Ant: O’Connell effect
The asymmetry in the LCs in Fig. 6 – in this case, the first maximum being higher than the second – is easily seen. The TESS LCs (Sector 9) confirm the ground-based data on this point. This is an example of the well-known O’Connell effect (Roberts Reference Roberts1906; O’Connell Reference O’Connell1951; Milone Reference Milone1968). In what follows, we interpret this in terms of a locally heated region on the primary photosphere. This idea can be reconciled with other evidence. Before following up on this, however, we should note that LC asymmetry is hardly present in classical photometric models. An initial LC fitting using a standard model can thus be expected to yield only approximate parameters. These may be improved in an iterative procedure if our interpretation of the spot’s effects is adequate.
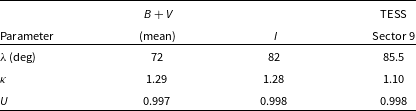
Fig. 7 shows the fitting of a ‘hot spot’ to the residuals from the standard model match, using the fitspot application of the WinFitter suite. fitspot requires the specification of a circular spot’s longitude
 $\lambda$
, latitude
$\lambda$
, latitude
 $\beta$
, angular size
$\beta$
, angular size
 $\gamma$
, inclination of the spin axis i, flux calibration unit U, the spot-bearing star’s luminosity as a fraction of that of the whole system
$\gamma$
, inclination of the spin axis i, flux calibration unit U, the spot-bearing star’s luminosity as a fraction of that of the whole system
 $L_1$
, spot central relative flux,
$L_1$
, spot central relative flux,
 $\kappa$
and the limb-darkening coefficient
$\kappa$
and the limb-darkening coefficient
 $u_1$
. The appearance of Fig. 7 – i.e. the data scatter and simple form of the fitting function – indicate the information content, or number of independently specifiable parameters, to be low. But we can reasonably adopt
$u_1$
. The appearance of Fig. 7 – i.e. the data scatter and simple form of the fitting function – indicate the information content, or number of independently specifiable parameters, to be low. But we can reasonably adopt
 $\beta = 0$
,
$\beta = 0$
,
 $\gamma = 0.175$
(
$\gamma = 0.175$
(
 $\sim$
10 deg),
$\sim$
10 deg),
 $i = 1.29$
(74 deg),
$i = 1.29$
(74 deg),
 $L_1 = 0.85$
,
$L_1 = 0.85$
,
 $u_1 = 0.5$
. The remaining 3 parameters (
$u_1 = 0.5$
. The remaining 3 parameters (
 $U, \lambda, \kappa $
) were adjusted so as to minimise
$U, \lambda, \kappa $
) were adjusted so as to minimise
 $\chi^2$
.
$\chi^2$
.
Hot spot model for O’Connell effect in S Ant LC.
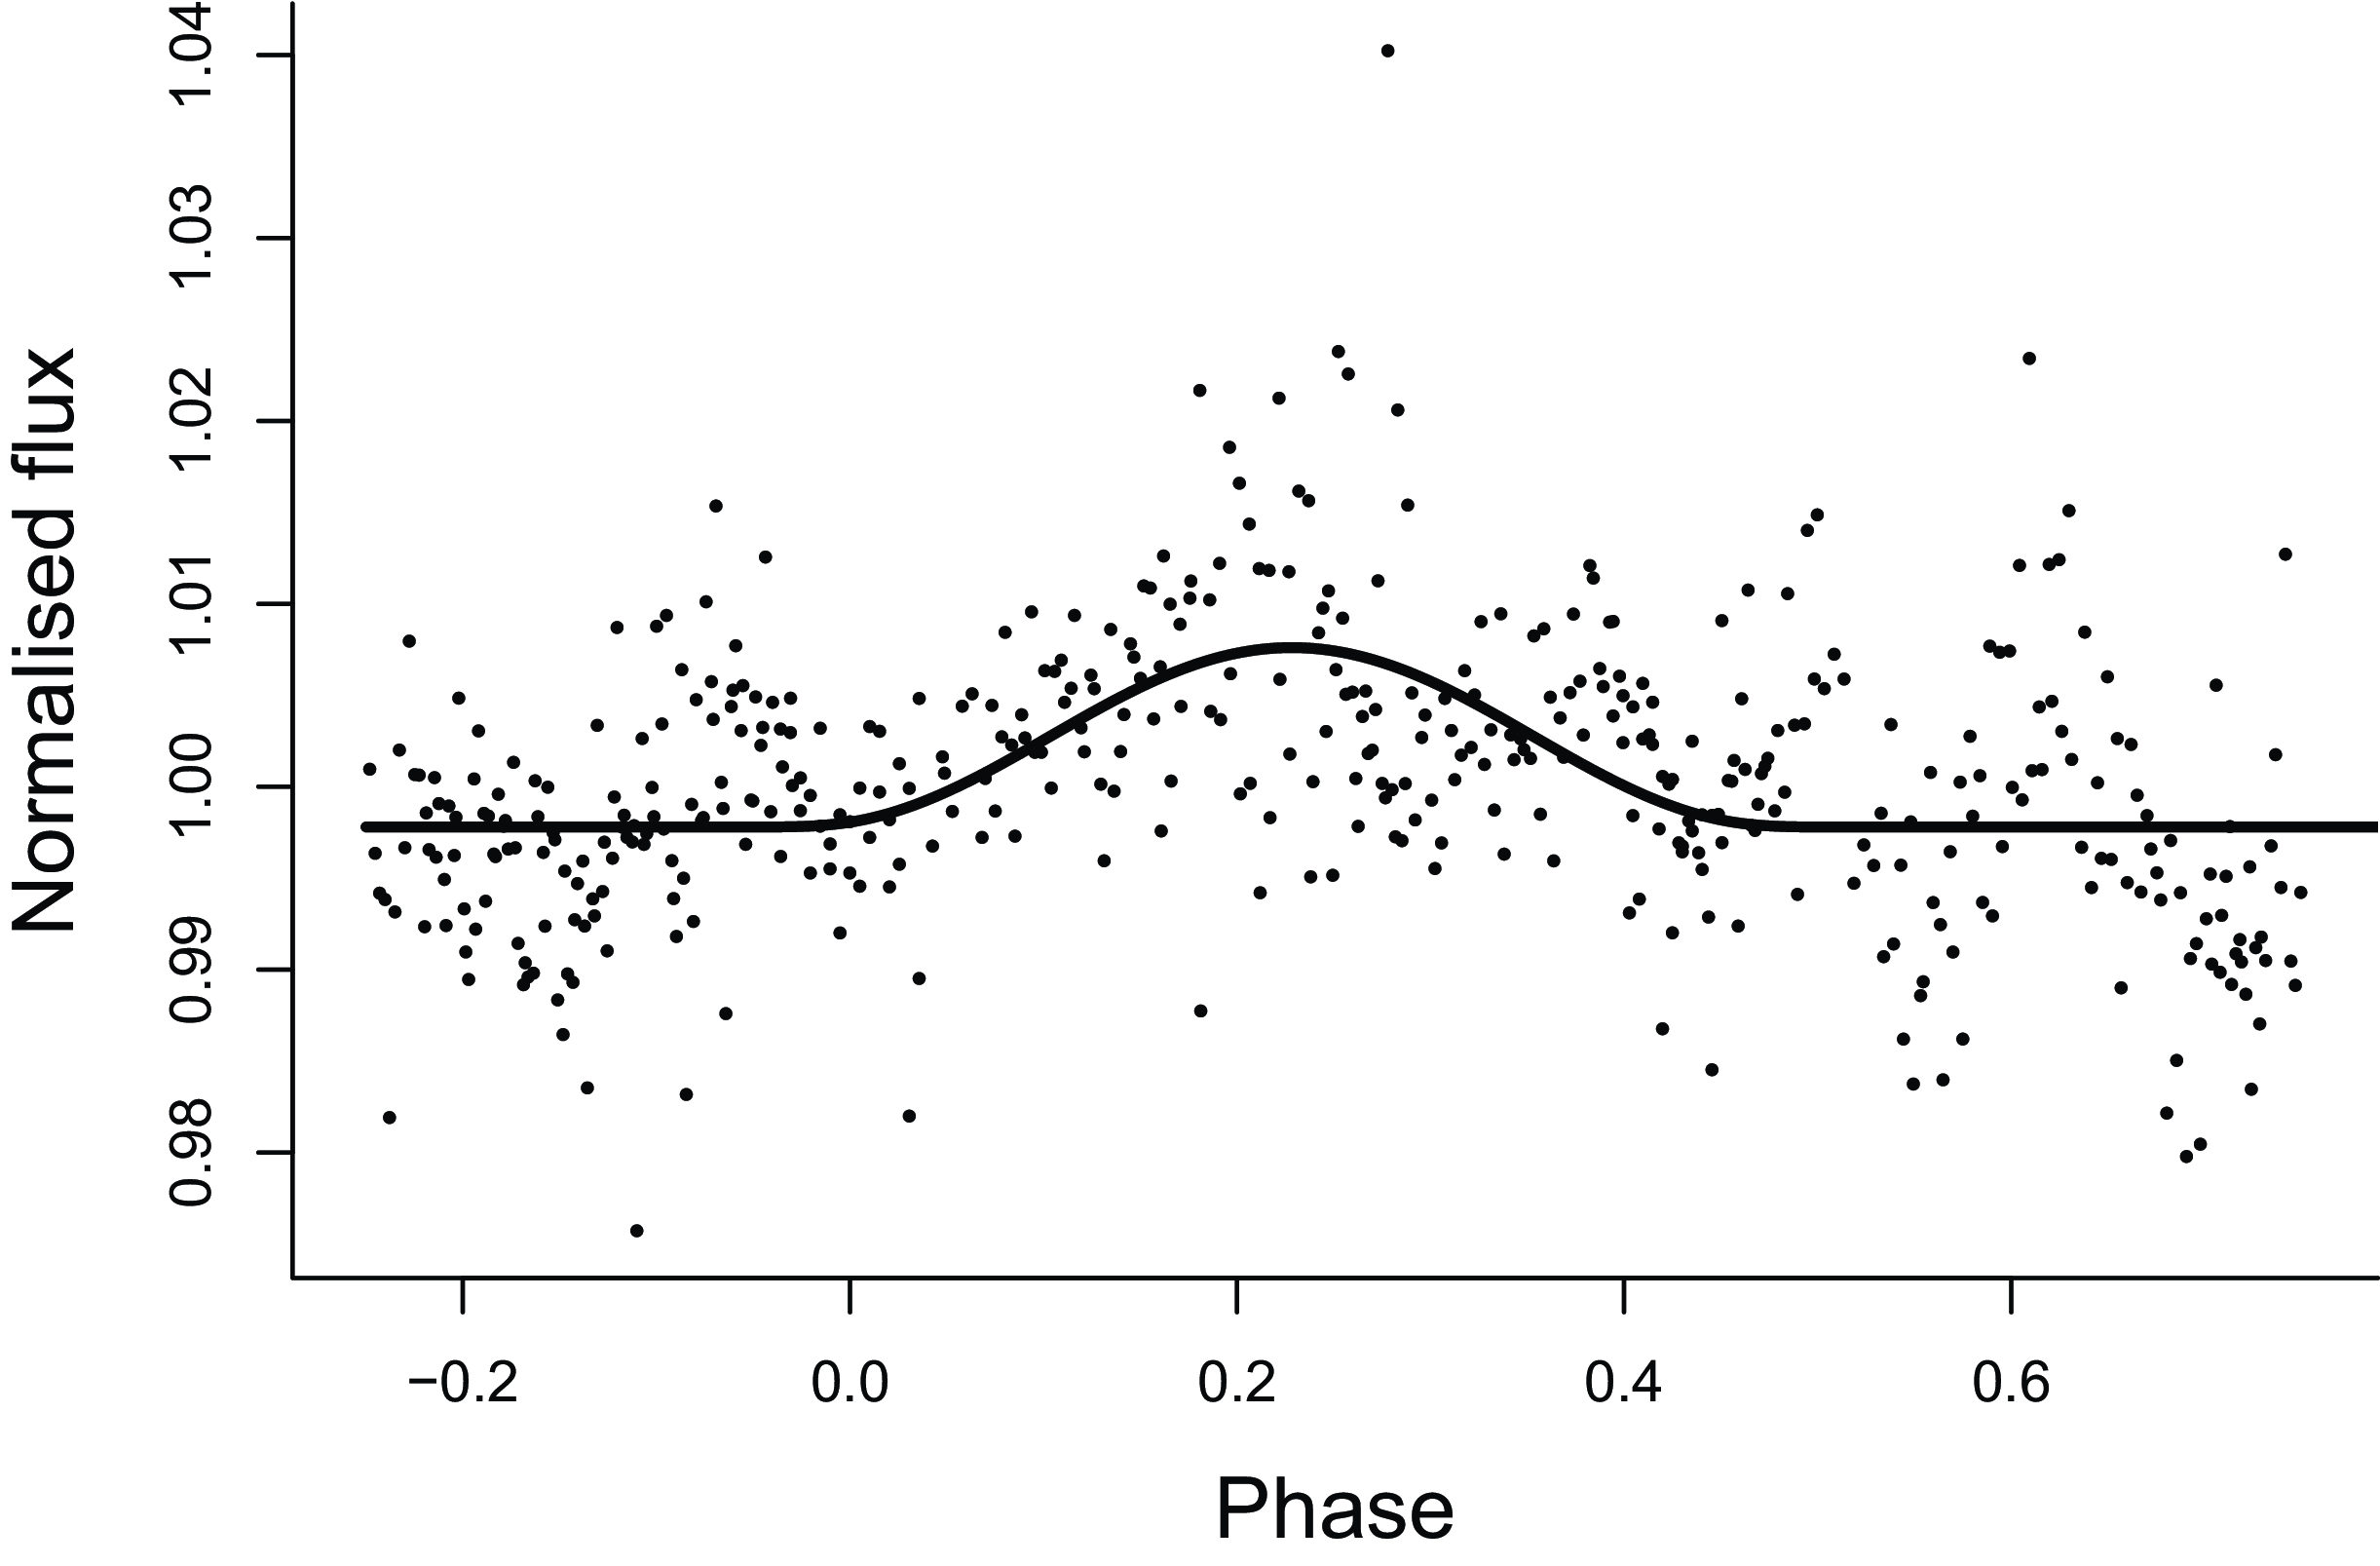
The flux excess of about 1.3 in the hot spot, in terms of the Planck function, corresponds to a temperature excess of about 500 K at 7 000 K. In the IR, at a wavelength of about 1 000 nm, this ratio drops to about 1.17. We may therefore accept, referring to Table 6, that the O’Connell effect in these LCs of S Ant can be accounted for by a region of about 1.5% of the primary’s photospheric area heated to a temperature excess over the surrounding photosphere of several hundred kelvins. The implied energy release is
 $\sim$
 $10^{32}$
erg s
$10^{32}$
erg s
 $^{-1}$
.
$^{-1}$
.
Optimal hot spot parameters for matching the O’Connell effect on S Ant.
This heating effect may be associated with the impact of a mass transferring stream, consistent with the general scenario of Roche Lobe overflow including the Coriolis deflection (Lubow & Shu Reference Lubow and Shu1975), its role in the semi-detached phase of the thermal relaxation oscillator (TRO) model (Lucy Reference Lucy1976), or the Algol-like version of this condition (Stepien Reference Stepien2009). In order to substantiate this picture, let us write the continuity of energy flow in the form
 \begin{equation} L_\mathrm{spot} \approx\frac{1}{2} \dot{M} v^2.\end{equation}
In the following section, we will derive a value for
 $\dot{M}$
for the mass-losing star of at least
$\dot{M}$
for the mass-losing star of at least
 $\sim$
10
$\sim$
10
 $^{18}$
gm s
$^{18}$
gm s
 $^{-1}$
. The impacting kinetic term
$^{-1}$
. The impacting kinetic term
 $v^2/2$
, per unit mass, in Equation (4) comes from the drop in potential energy in moving from the region of the inner Lagrangian point to the impact location. This can be written, approximately, as
$v^2/2$
, per unit mass, in Equation (4) comes from the drop in potential energy in moving from the region of the inner Lagrangian point to the impact location. This can be written, approximately, as
 $\sim \Delta \left( GM_1/r \right)$
, where
$\sim \Delta \left( GM_1/r \right)$
, where
 $M_1$
is the mass of the present primary, and r is the radial separation from the primary centre of mass, relating to the stream’s origin and impact positions. Equation (4) will balance the luminosity of the spot with the dissipation of the stream’s kinetic energy in the impact region with a value of the infall distance
$M_1$
is the mass of the present primary, and r is the radial separation from the primary centre of mass, relating to the stream’s origin and impact positions. Equation (4) will balance the luminosity of the spot with the dissipation of the stream’s kinetic energy in the impact region with a value of the infall distance
 $\Delta r$
of not more than
$\Delta r$
of not more than
 $\sim$
10 % of the primary mean radius. In this way, the O’Connell effect is explained consistently with the apparent secular change of period that will be discussed in section 4.1.
$\sim$
10 % of the primary mean radius. In this way, the O’Connell effect is explained consistently with the apparent secular change of period that will be discussed in section 4.1.
3.3
$\varepsilon$
CrA photometry

BVI photometry of
 $\varepsilon$
CrA was carried out at the Congarinni Observatory over 8 nights of reasonably stable weather in July and August 2021 using a 200 mm f2.8 Canon lens on an SBIG STT3200 CCD camera. The field of view was
$\varepsilon$
CrA was carried out at the Congarinni Observatory over 8 nights of reasonably stable weather in July and August 2021 using a 200 mm f2.8 Canon lens on an SBIG STT3200 CCD camera. The field of view was
 $4.38 \times 2.95$
deg, which enables the inclusion of a number of bright comparison stars. For data reduction, we used HIP 93825 (
$4.38 \times 2.95$
deg, which enables the inclusion of a number of bright comparison stars. For data reduction, we used HIP 93825 (
 $V=4.209$
,
$V=4.209$
,
 $B-V=0.522$
,
$B-V=0.522$
,
 $V-I=0.417$
) as the main comparison star. Thence we determined for
$V-I=0.417$
) as the main comparison star. Thence we determined for
 $\varepsilon$
CrA:
$\varepsilon$
CrA:
 $V = 4.766$
,
$V = 4.766$
,
 $B-V = 0.387$
,
$B-V = 0.387$
,
 $V-I = 0.260$
;
$V-I = 0.260$
;
 $V = 4.769$
,
$V = 4.769$
,
 $B-V - 0.376$
,
$B-V - 0.376$
,
 $V-I = 0.290$
; at the first and second maxima, respectively. At the occultation minimum, we found:
$V-I = 0.290$
; at the first and second maxima, respectively. At the occultation minimum, we found:
 $V = 4.966$
,
$V = 4.966$
,
 $B-V = 0.403$
,
$B-V = 0.403$
,
 $V-I = 0.247$
. These measures are not far from the literature values cited in Section 1.2, but the colours are a little more blue than the Main Sequence values of type F4 given by Eker et al. (Reference Eker2018).
$V-I = 0.247$
. These measures are not far from the literature values cited in Section 1.2, but the colours are a little more blue than the Main Sequence values of type F4 given by Eker et al. (Reference Eker2018).
Photometric data from the Transiting Exoplanet Survey Satellite (TESS) was also used. TESS collected data on
 $\varepsilon$
CrA with a 2-min cadence in Sector 13 (June 20 to July 17, 2019). These data are publicly accessible (Ricker et al. Reference Ricker2015). We downloaded and processed relevant information using the Lightkurve Python package (Lightkurve Collaboration et al. Reference Collaboration2018).
$\varepsilon$
CrA with a 2-min cadence in Sector 13 (June 20 to July 17, 2019). These data are publicly accessible (Ricker et al. Reference Ricker2015). We downloaded and processed relevant information using the Lightkurve Python package (Lightkurve Collaboration et al. Reference Collaboration2018).
Photometric analysis was pursued using the numerical integration code of Wilson & Devinney (Reference Wilson and Devinney1971) (WD), combined with a Monte Carlo (MC) optimisation procedure (see Zola et al. Reference Zola2004). This method models the LC of an eclipsing binary star, including proximity effects, adopting Roche equipotentials (Kopal Reference Kopal1959) for the component surfaces. The most important feature of the MC search procedure is its exploration of a grid of trial values for the input parameters (priors). The method thus finds the model that provides a best fit to the observed LC by conducting up to hundreds of thousands of iterations, depending on the number of free parameters, with priors distributed over the selected input ranges, determined from preliminary expectations of component values and their expected uncertainties.
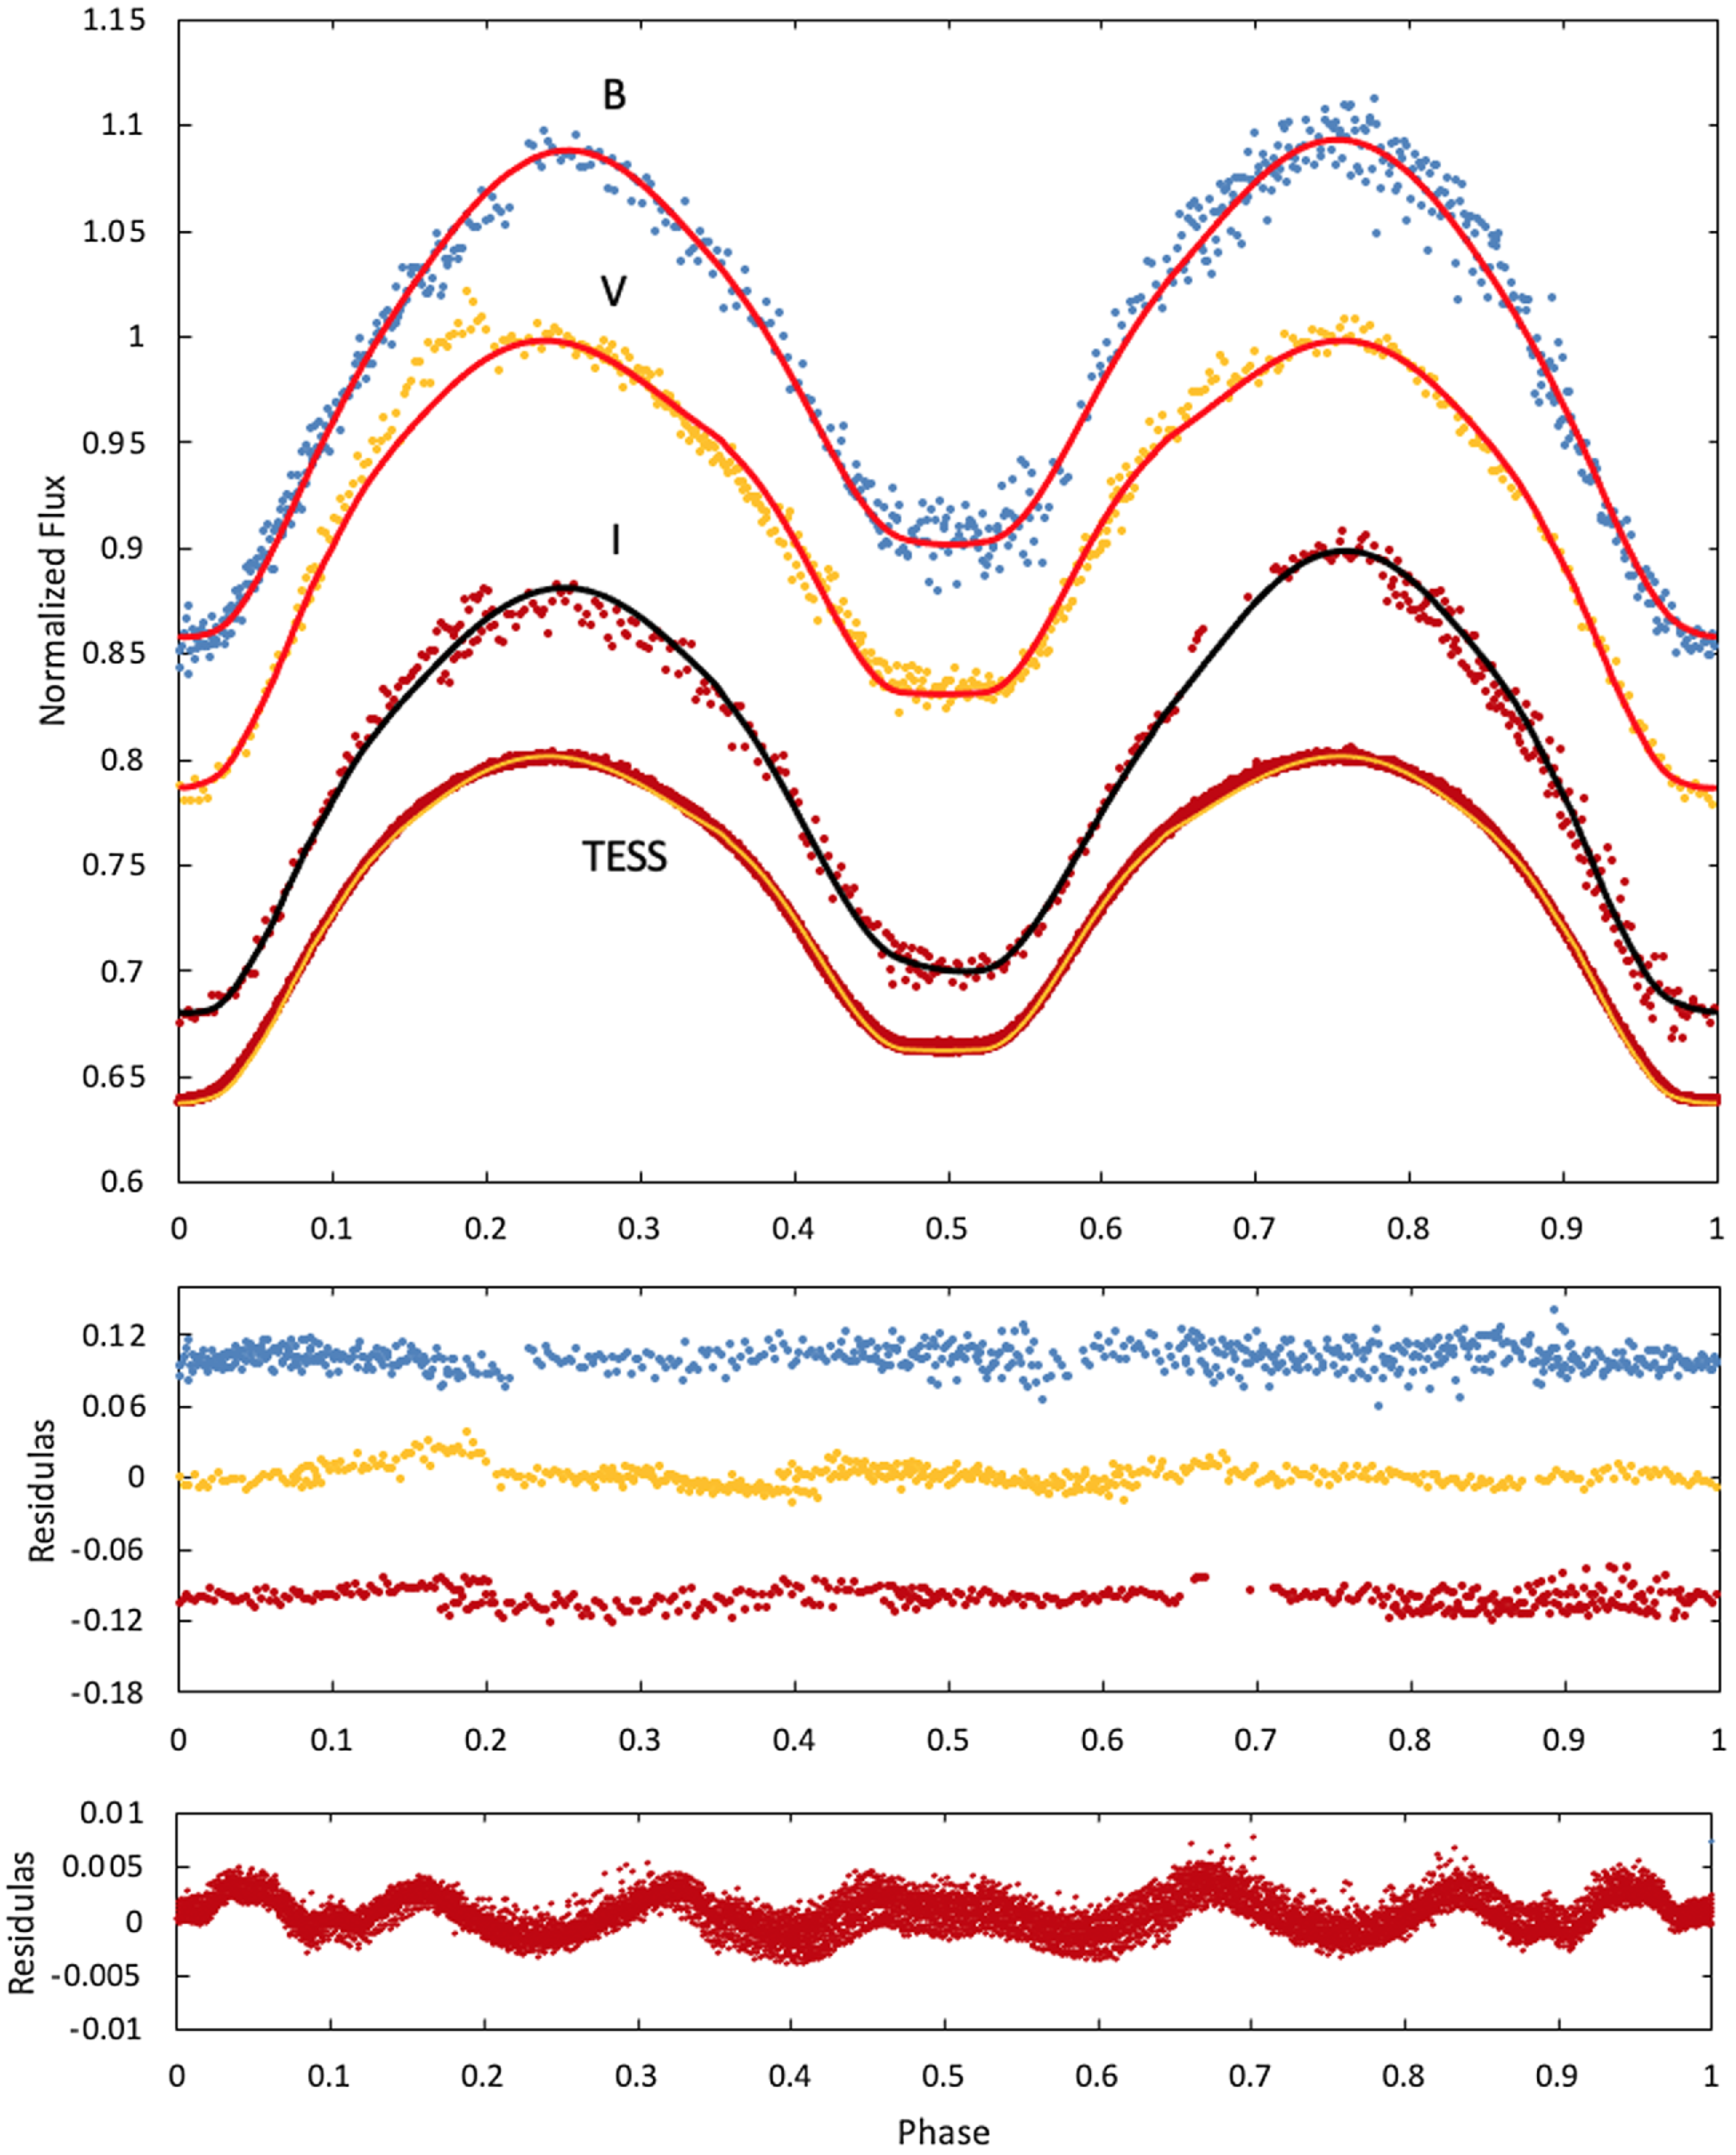
The BVI LCs of
 $\varepsilon$
CrA show a slight O’Connell effect in the B band, but the discontinuity in the residuals near the first maximum disturbs the V LC proportionately more than the B. The asymmetry is more apparent in the I data, but the discontinuities seen in the residuals (Fig. 8, lower panel) indicate that the asymmetries should be regarded cautiously. Note that there is very little asymmetry between the maxima in the TESS LCs.
$\varepsilon$
CrA show a slight O’Connell effect in the B band, but the discontinuity in the residuals near the first maximum disturbs the V LC proportionately more than the B. The asymmetry is more apparent in the I data, but the discontinuities seen in the residuals (Fig. 8, lower panel) indicate that the asymmetries should be regarded cautiously. Note that there is very little asymmetry between the maxima in the TESS LCs.
Ground-based BVI and TESS photometry of
 $\varepsilon$
CrA with the optimal model from WD+MC (Wilson-Devinney plus Monte Carlo) fitting. Residuals to the model are plotted in the lower figures.
$\varepsilon$
CrA with the optimal model from WD+MC (Wilson-Devinney plus Monte Carlo) fitting. Residuals to the model are plotted in the lower figures.
Based on the previously cited literature we adopted the spectral type of
 $\varepsilon$
CrA as F2V. Then, using the calibration data of both Pecaut & Mamajek (Reference Pecaut and Mamajek2013) and Eker et al. (Reference Eker2018), we adopted the primary temperature as 6 820
$\varepsilon$
CrA as F2V. Then, using the calibration data of both Pecaut & Mamajek (Reference Pecaut and Mamajek2013) and Eker et al. (Reference Eker2018), we adopted the primary temperature as 6 820
 $\pm200$
K. The temperature of the secondary (
$\pm200$
K. The temperature of the secondary (
 $T_2$
) was adjustable on the range 5 000–7 000 K. The input range of the orbital inclination was set to
$T_2$
) was adjustable on the range 5 000–7 000 K. The input range of the orbital inclination was set to
 $50^\circ \lt i \lt 90^\circ$
, The mass ratio (q) was fixed at the value of 0.13 obtained in the RV analysis in Section 2.2. The non-dimensional surface potentials were allowed to vary on the range 1.0–3.0.
$50^\circ \lt i \lt 90^\circ$
, The mass ratio (q) was fixed at the value of 0.13 obtained in the RV analysis in Section 2.2. The non-dimensional surface potentials were allowed to vary on the range 1.0–3.0.
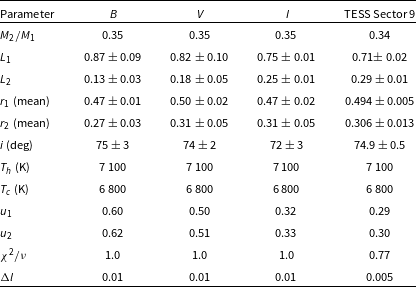
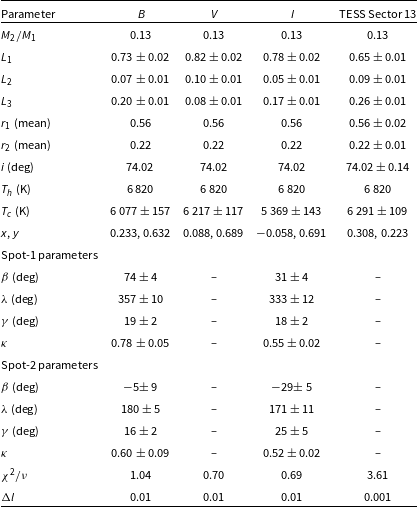
Optimal parameters for the WD+MC photometric model fits to the ground-based BVI and TESS Sector 13 data for
 $\varepsilon$
CrA. According to the WD procedure for overcontact binaries, such as W UMa stars, these constraints were applied: the surface potential (
$\varepsilon$
CrA. According to the WD procedure for overcontact binaries, such as W UMa stars, these constraints were applied: the surface potential (
 $\Omega$
), gravity brightening (g), bolometric albedo (A) and limb darkening parameters of components are the same. Here
$\Omega$
), gravity brightening (g), bolometric albedo (A) and limb darkening parameters of components are the same. Here
 $g_1=g_2=0.32$
and
$g_1=g_2=0.32$
and
 $A_1=A_2=0.5$
are adopted. A quadratic limb-darkening law was applied with limb-darkening coefficients (x, y) taken from Claret (2017).
$A_1=A_2=0.5$
are adopted. A quadratic limb-darkening law was applied with limb-darkening coefficients (x, y) taken from Claret (2017).
Parameters derived from O – C analysis of S Ant.
For the WD+MC program, the input range of
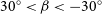 $30^\circ \lt \beta \lt -30^\circ$
was set for the spot latitude and
$30^\circ \lt \beta \lt -30^\circ$
was set for the spot latitude and
 $0^\circ \lt \lambda \lt 360^\circ$
for the longitude. The input range of
$0^\circ \lt \lambda \lt 360^\circ$
for the longitude. The input range of
 $10^\circ \lt \gamma \lt 50^\circ$
was set for the angular radius and
$10^\circ \lt \gamma \lt 50^\circ$
was set for the angular radius and
 $0.80 \lt \kappa \lt 1.3$
for the temperature factor. Two approaches were used in dealing with the asymmetric LCs. In the first approach, the separate bands and nights were treated on an individual basis, but this did not produce a uniform representation. A second approach adopted the TESS data as definitive, the asymmetry being very small. Two main spots were assumed to account for the B and I band asymmetries, while spots were not used in matching the almost symmetric V LC. In these fittings, the geometric parameters were kept constant at the values from the TESS data analysis, while other parameters were adjusted to optimise the fitting.
$0.80 \lt \kappa \lt 1.3$
for the temperature factor. Two approaches were used in dealing with the asymmetric LCs. In the first approach, the separate bands and nights were treated on an individual basis, but this did not produce a uniform representation. A second approach adopted the TESS data as definitive, the asymmetry being very small. Two main spots were assumed to account for the B and I band asymmetries, while spots were not used in matching the almost symmetric V LC. In these fittings, the geometric parameters were kept constant at the values from the TESS data analysis, while other parameters were adjusted to optimise the fitting.
Results are presented graphically in Fig. 8. A very small amplitude variation (
 $\sim$
0.003 in relative flux) remains in the TESS LC residuals. Such residual effects notwithstanding, it is the TESS LC fitting results that are adopted in the absolute parameter calculations in (Section 5). The uncertainties given in Table 7, that was subsequently used for calculating the formal error estimates of the absolute parameters in Table 10, were obtained from the WD+MC code set with a 90% confidence level.
$\sim$
0.003 in relative flux) remains in the TESS LC residuals. Such residual effects notwithstanding, it is the TESS LC fitting results that are adopted in the absolute parameter calculations in (Section 5). The uncertainties given in Table 7, that was subsequently used for calculating the formal error estimates of the absolute parameters in Table 10, were obtained from the WD+MC code set with a 90% confidence level.
Parameters derived from O – C analysis of
 $\varepsilon$
CrA.
$\varepsilon$
CrA.
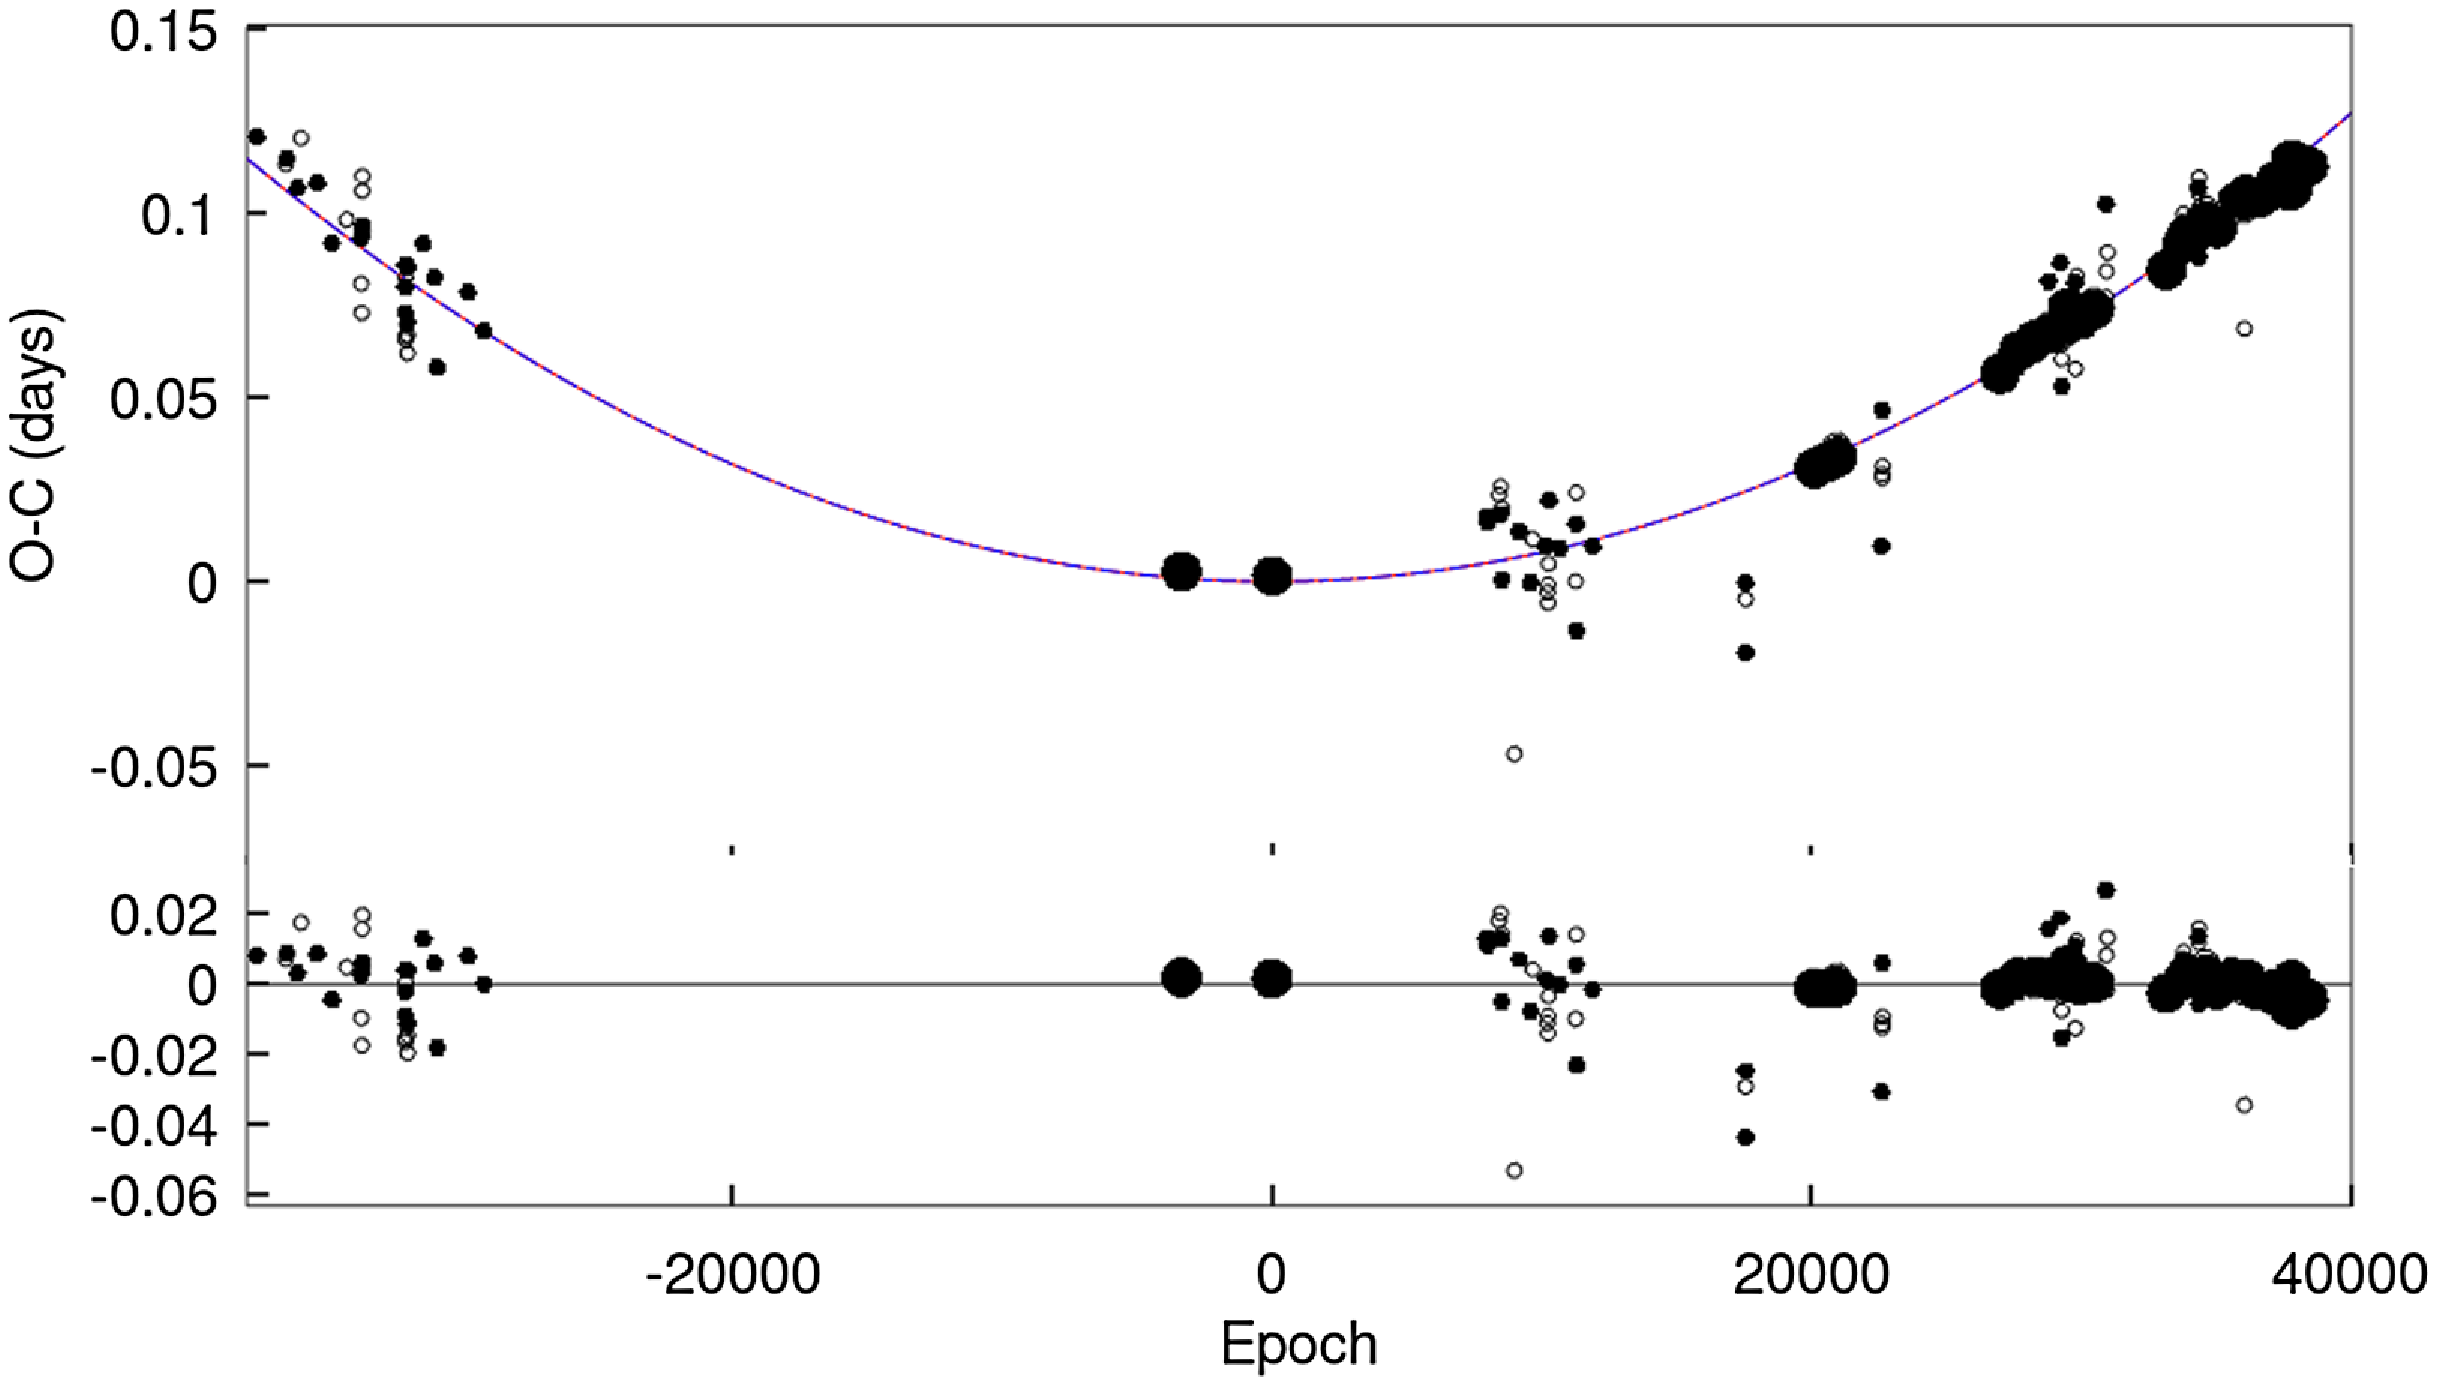
Absolute parameters of S Ant and
 $\varepsilon$
CrA.
$\varepsilon$
CrA.
Reasons for the asymmetry in the LCs include either hot spots that may relate to mass transfer or cool maculation. The latter option was pursued for
 $\varepsilon$
CrA on an empirical basis, and the results are presented in Table 7.
$\varepsilon$
CrA on an empirical basis, and the results are presented in Table 7.
4. Orbital period
4.1 S Ant
Times of minimum light (ToMs) have been compiled from various sources, especially the O – C Atlas data of Kreiner, Kim, & Nha (Reference Kreiner, Kim and Nha2001) and Kreiner (Reference Kreiner2004). Observed ToMs are compared with calculated ones on the basis of an adopted reference ephemeris that is linear in the ToM number or epoch E. The corresponding time differences T are used to form the familiar ‘O – C’ diagram (Fig. 9). For additional background see Ch. 8 of Budding & Demircan (Reference Budding and Demircan2022). The ToMs used in Fig. 8 are listed in Table A1 in the Appendix. O–C data are matched with a trial function in E to check for systematic departures from the adopted linear ephemeris. A parabola was fitted to the residuals for S Ant using Excel
 $^\mathrm{TM}$
. The results are given in Table 8, and displayed in Fig. 9.
$^\mathrm{TM}$
. The results are given in Table 8, and displayed in Fig. 9.
Observed minus calculated (O – C) times of minimum light (ToMs) for S Ant, and parabolic model fitting. Black points represent primary minima; blue open circles represent secondary minima. The sizes of the symbols are proportional to their weights. Residuals are shown in the lower panel.
It can be shown that a steady transfer of mass between the stars in a close binary system will produce such a parabolic trend i.e.
 \begin{equation} T(E) = A + BE + C E^2 .\end{equation}
The corresponding rate of mass transfer takes the form:
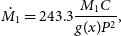 \begin{equation} \dot{M_1} = 243.3 \frac{M_1 C}{g(x) P^2} , \end{equation}
where
 $M_1$
is the mass of the donor star, P the orbital period. The function g relates to the system’s angular momentum and depends on the relative mass
$M_1$
is the mass of the donor star, P the orbital period. The function g relates to the system’s angular momentum and depends on the relative mass
 $ x = M_1/(M_1 + M_2)$
. If we conserve the orbital angular momentum and neglect the contribution of the relatively small rotational terms, the function
$ x = M_1/(M_1 + M_2)$
. If we conserve the orbital angular momentum and neglect the contribution of the relatively small rotational terms, the function
 $g(x) = (2x - 1)/(1-x)$
.
$g(x) = (2x - 1)/(1-x)$
.
The resulting value of
 $\dot{M_1}$
thus remains negative for an upturned parabola (
$\dot{M_1}$
thus remains negative for an upturned parabola (
 $C \gt 0$
) with
$C \gt 0$
) with
 $x \lt 1/2$
– see Fig. 9, upper panel. The residuals, after including the parabolic trend, are shown in the lower panel of Fig. 9, No further matching of residuals was attempted, and the parabola accounting for systematic effects to the available accuracy of the data. Following the foregoing prescription, our estimate for the rate of mass loss, in solar masses per year, is given in Table 8.
$x \lt 1/2$
– see Fig. 9, upper panel. The residuals, after including the parabolic trend, are shown in the lower panel of Fig. 9, No further matching of residuals was attempted, and the parabola accounting for systematic effects to the available accuracy of the data. Following the foregoing prescription, our estimate for the rate of mass loss, in solar masses per year, is given in Table 8.
4.2
$\varepsilon$
CrA

The orbital period of
 $\varepsilon$
CrA was examined along the same lines as S Ant. In this study, 4 primary and 4 secondary ToMs were obtained from the TESS data, while 3 primary and 3 secondary ToMs were obtained from the previously discussed BVI observations. These times of minima were combined with 23 primary and 8 secondary ToMs taken from Kreiner (Reference Kreiner2004). All ToMs used in our analysis are given in Table A2 in the Appendix.
$\varepsilon$
CrA was examined along the same lines as S Ant. In this study, 4 primary and 4 secondary ToMs were obtained from the TESS data, while 3 primary and 3 secondary ToMs were obtained from the previously discussed BVI observations. These times of minima were combined with 23 primary and 8 secondary ToMs taken from Kreiner (Reference Kreiner2004). All ToMs used in our analysis are given in Table A2 in the Appendix.
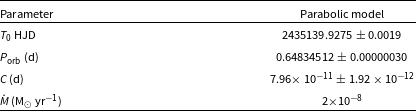
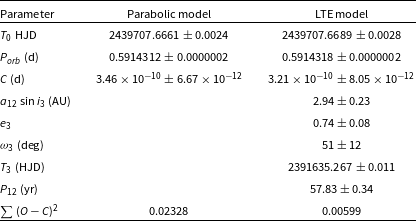
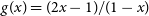
The O – C data using the linear ephemeris from Kreiner (Reference Kreiner2004) are shown in Fig. 10, which shows a relatively strong parabolic component. The corresponding form in Equation (5) was fitted to our data by the least squares method. Results are given in Table 9. The residuals from this fitting, shown in the lower panel, suggest a further, low-amplitude systematic effect.
LTE representation superimposed on parabolic form of O – C changes of
 $\varepsilon$
CrA (upper figure). Only LTE representation of O – C changes after subtraction from the fitted parabola’s residuals (lower figure).
$\varepsilon$
CrA (upper figure). Only LTE representation of O – C changes after subtraction from the fitted parabola’s residuals (lower figure).
This quasi-sinusoidal change in the O – C diagram is suggestive of a light-time effect (LTE) associated with a third body. In order to look into this, the first set of residuals was checked against the LTE formula given by Irwin (Reference Irwin1959):
 \begin{multline} T(E) = A + BE + C E^2 \\ + \frac{a_{12}\sin{i_3}}{c} \left( \frac{1-e_3^2}{1+e_3\cos{\nu_3}}\sin(\nu_{3} + \omega_{3}) + e_{3}\cos{\omega_3} \right),\end{multline}
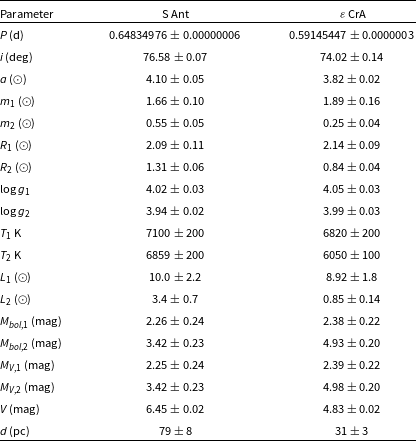
where c is the speed of light, and the other symbols have their usual meanings, as given by Irwin (Reference Irwin1959). A weighted least-squares solution for
 $T_0$
,
$T_0$
,
 $P_{orb}$
, Q,
$P_{orb}$
, Q,
 $a_{12}$
,
$a_{12}$
,
 $i_3$
,
$i_3$
,
 $e_3$
,
$e_3$
,
 $\omega_3$
,
$\omega_3$
,
 $T_3$
and
$T_3$
and
 $P_{12}$
is presented in Table 9. The observational points and theoretical best-fit curve, and also the residuals, are plotted against epoch number and observation years in the lower part of Fig. 10.
$P_{12}$
is presented in Table 9. The observational points and theoretical best-fit curve, and also the residuals, are plotted against epoch number and observation years in the lower part of Fig. 10.
The low value of the projected separation of the close binary from the centre of mass (
 $a_{12} \sin i $
) compared with the period and the known mass of the close binary stars indicate that the wide orbit axis is relatively close to the line of sight for third body masses comparable to that of the close pair. With a separation of order an arcsecond, such a companion star (that has to be more massive than
$a_{12} \sin i $
) compared with the period and the known mass of the close binary stars indicate that the wide orbit axis is relatively close to the line of sight for third body masses comparable to that of the close pair. With a separation of order an arcsecond, such a companion star (that has to be more massive than
 $\sim$
0.4 M
$\sim$
0.4 M
 $_{\odot}$
) should be detectable astrometrically.
$_{\odot}$
) should be detectable astrometrically.
Alternatively, vagaries from the parabolic trend in the upper part of Fig. 10 may be reflecting short-term changes in the O’Connell asymmetry, that may have physical implications on flow or accretion irregularities as well as discrepancies in the timings of light minima (see lower sub-diagram in Fig. 10). Disparities in implied mass transfer rates associated with contact binaries are not uncommon (Qian Reference Qian2001).
5. Absolute parameters
The classical ‘eclipse method’ of deriving stellar absolute parameters involves combining the results of photometric and spectroscopic analyses. The results are given in Table 10. In these calculations, the masses (m) of the components are derived from Kepler’s third law using the orbital period (P) and inclination (i) determined from photometry, and the projected orbital separation (
 $a \sin i$
) with the mass ratio (q) found from fitting the RV curves. The absolute radii (R) of the components then follow, since
$a \sin i$
) with the mass ratio (q) found from fitting the RV curves. The absolute radii (R) of the components then follow, since
 $R=r a$
, with the fractional radii (r) and inclination (i) obtained from the LC fittings. The surface gravities (g) were computed as
$R=r a$
, with the fractional radii (r) and inclination (i) obtained from the LC fittings. The surface gravities (g) were computed as
 $g=g_{\odot} m / R^2$
. The bolometric magnitudes (
$g=g_{\odot} m / R^2$
. The bolometric magnitudes (
 $M_{bol}$
) and luminosities (L) were calculated using the following two equations with the absolute radii and effective temperatures listed in Table 10:
$M_{bol}$
) and luminosities (L) were calculated using the following two equations with the absolute radii and effective temperatures listed in Table 10:
 \begin{equation}M_{bol}=M_{bol,\odot} - 10\log (T/T_{\odot}) - 5\log (R/R_{\odot}),\end{equation}
and
 \begin{equation} L/L_{\odot}=10^{0.4(M_{bol,\odot}-M_{bol})}. \end{equation}
The solar values, adopted by IAU 2015 Resolutions B2 and B3, were used here. Absolute visual magnitudes
 $M_V$
were derived from the bolometric corrections, BC =
$M_V$
were derived from the bolometric corrections, BC =
 $M_{bol}$
-
$M_{bol}$
-
 $M_{V}$
. BC values were taken from the online tabulation of Pecaut & Mamajek (Reference Pecaut and Mamajek2013) with the adopted effective temperatures.
$M_{V}$
. BC values were taken from the online tabulation of Pecaut & Mamajek (Reference Pecaut and Mamajek2013) with the adopted effective temperatures.
The distance to the system was calculated using the absolute magnitude formula:
 $M_{V}$
=
$M_{V}$
=
 $m_{V}$
–
$m_{V}$
–
 $A_{V}$
+ 5 – 5 log(d). The Gaia parallaxes for S Ant and
$A_{V}$
+ 5 – 5 log(d). The Gaia parallaxes for S Ant and
 $\varepsilon$
CrA point to interstellar absorption being of order 0.03 magnitudes and thus having a negligible effect on the photometric parallaxes.
$\varepsilon$
CrA point to interstellar absorption being of order 0.03 magnitudes and thus having a negligible effect on the photometric parallaxes.
The distance to S Ant and
 $\varepsilon$
CrA were derived as
$\varepsilon$
CrA were derived as
 $79 \pm$
8 and
$79 \pm$
8 and
 $31 \pm$
3 pc, which match the distance of
$31 \pm$
3 pc, which match the distance of
 $79 \pm$
1 and
$79 \pm$
1 and
 $31 \pm$
1 given by Gaia-DR3 (Gaia Collaboration et al. Reference Collaboration2023), respectively. Poro et al. (Reference Poro2024) recently found that the use of Gaia DR3 parallaxes for 48 contact binary stars was successful in confirming the absolute parameters required for the corresponding photometric parallaxes. The photometric parallax formulae (Popper Reference Popper1998; Budding & Demircan Reference Budding and Demircan2007) produces distances of 85
$31 \pm$
1 given by Gaia-DR3 (Gaia Collaboration et al. Reference Collaboration2023), respectively. Poro et al. (Reference Poro2024) recently found that the use of Gaia DR3 parallaxes for 48 contact binary stars was successful in confirming the absolute parameters required for the corresponding photometric parallaxes. The photometric parallax formulae (Popper Reference Popper1998; Budding & Demircan Reference Budding and Demircan2007) produces distances of 85
 $\pm10$
and 33
$\pm10$
and 33
 $\pm5$
pc for S Ant and
$\pm5$
pc for S Ant and
 $\varepsilon$
CrA, thus supporting the reliability of our absolute parameter results.
$\varepsilon$
CrA, thus supporting the reliability of our absolute parameter results.
A succession of (partial, showing the maxima) TESS light curves showing short-term variability of the O’Connell effect.
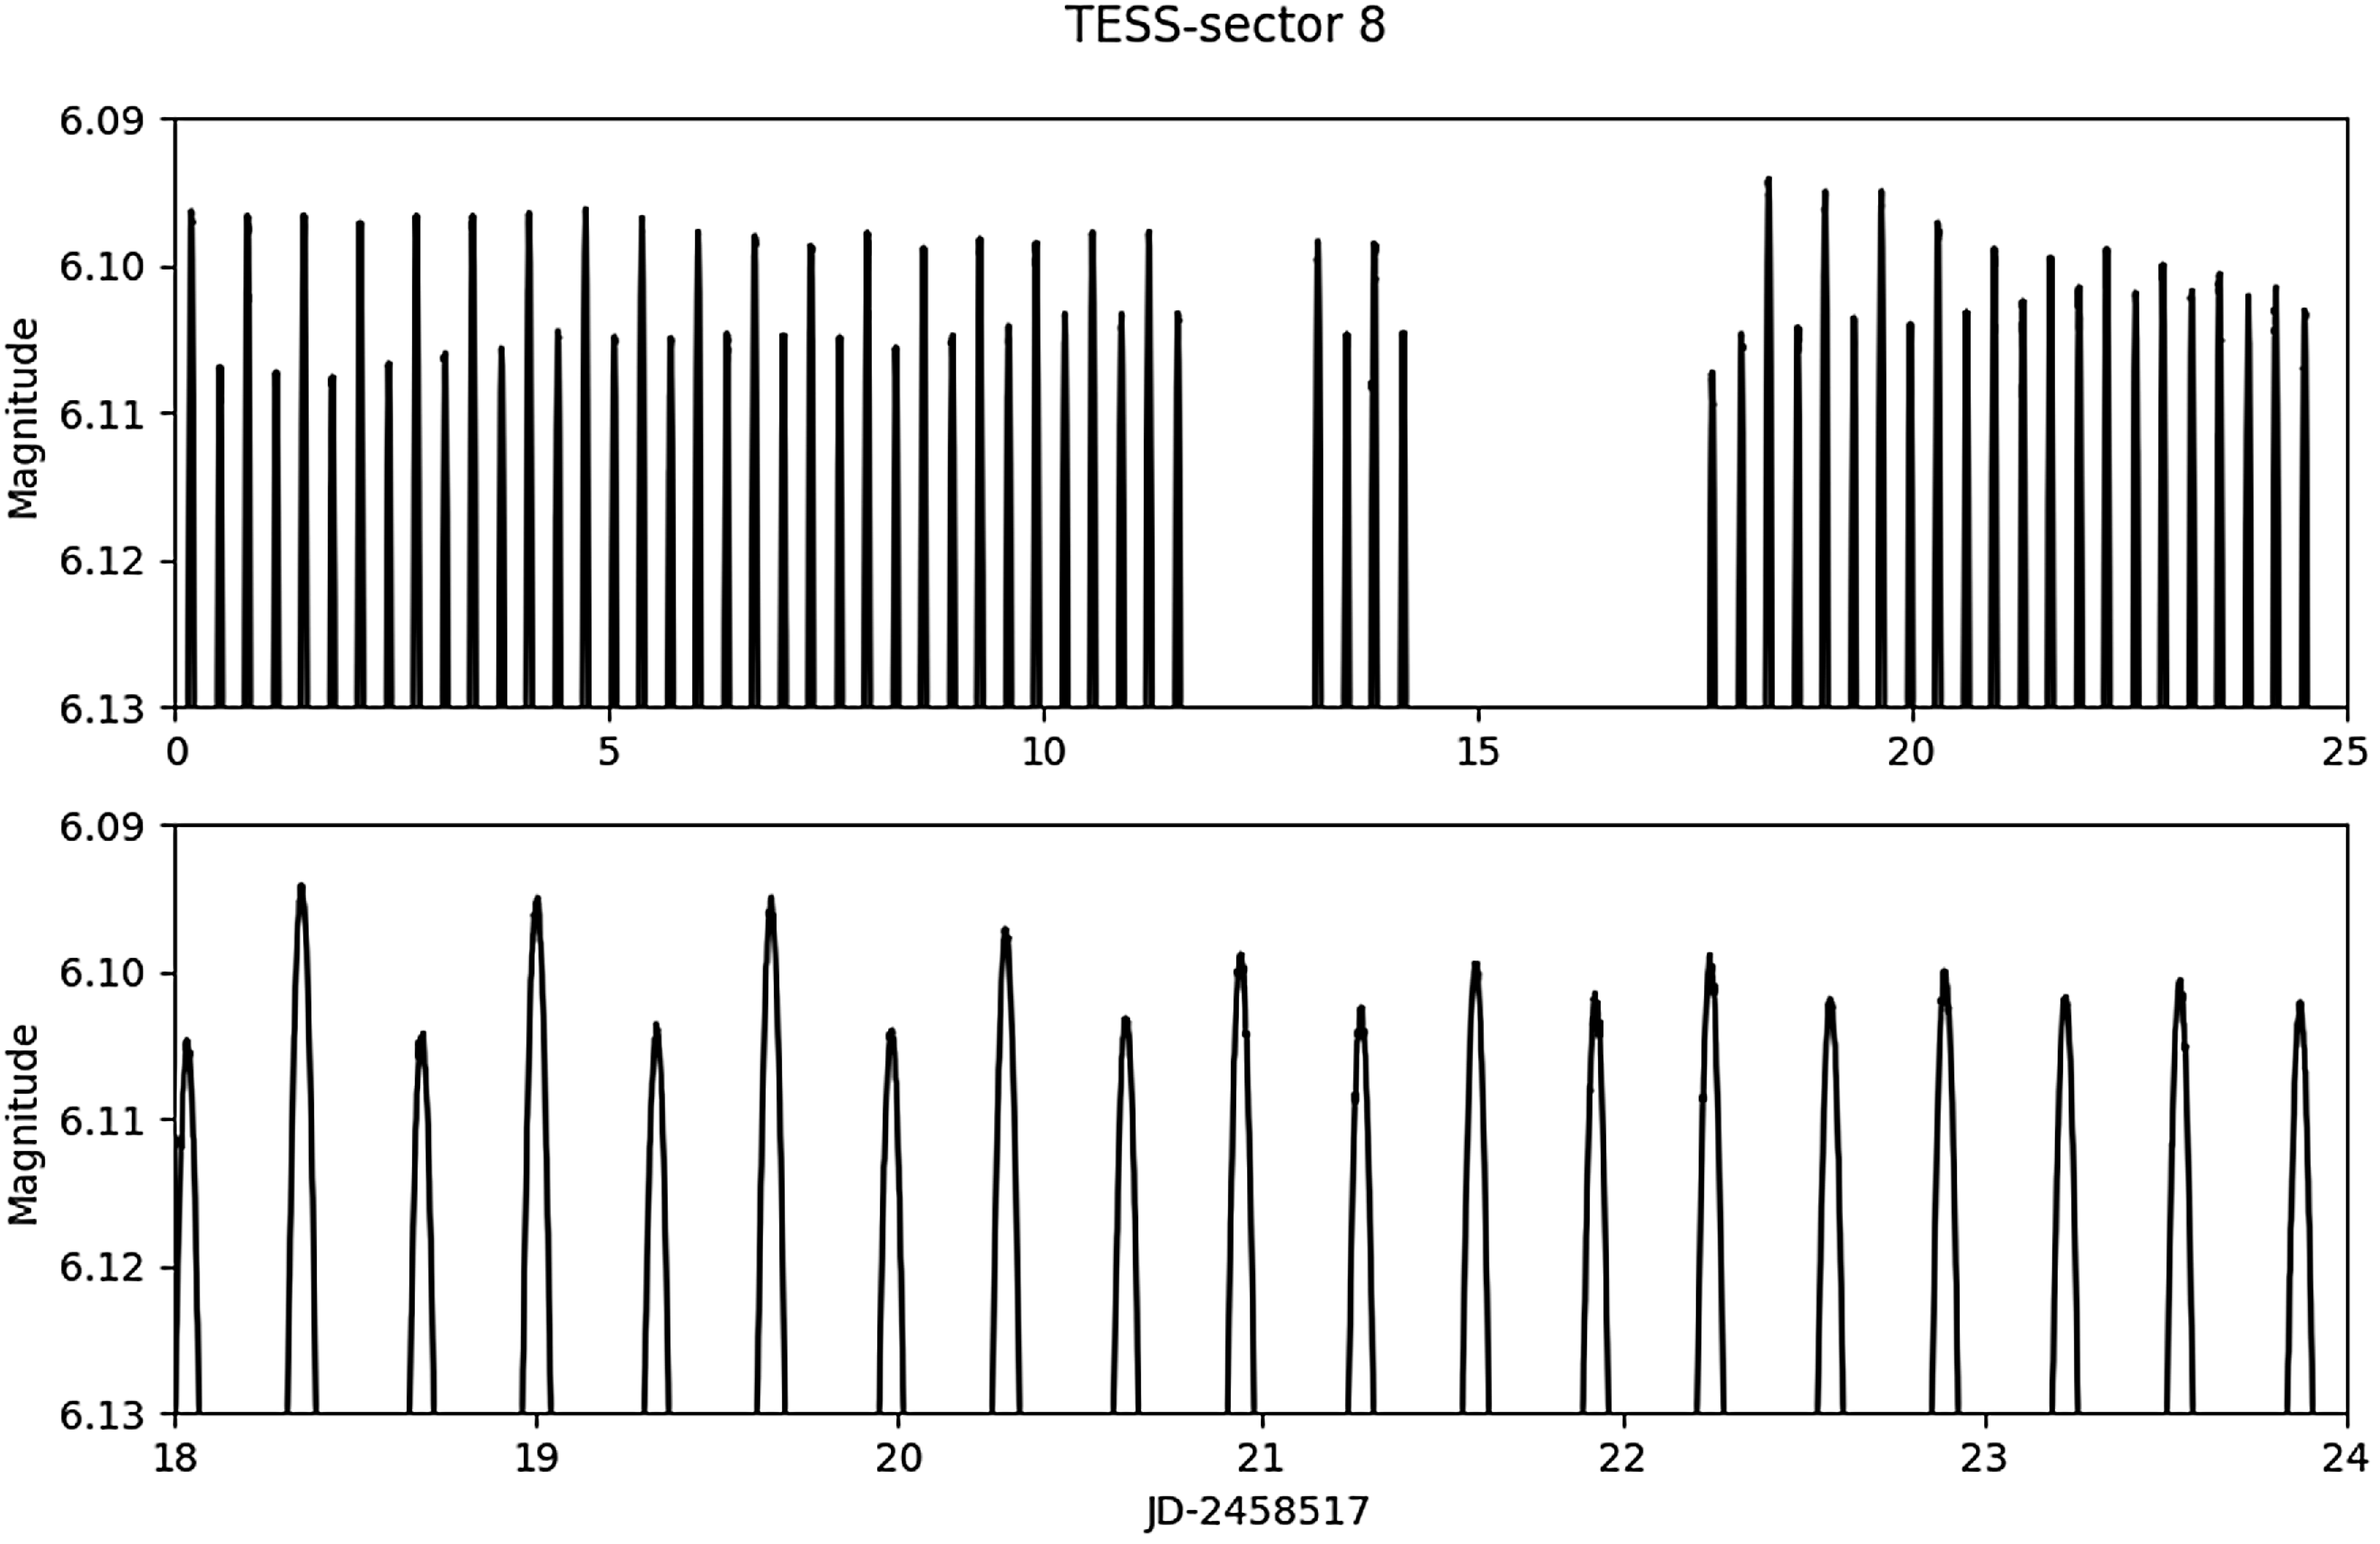
6. Discussion and conclusions
Ongoing discussion of the contact binary syndrome centres on the comparison of the various strands of observational evidence with theory – such as the TRO scenario. Relaxation oscillations are characterised by a repetitive switching between two unstable end states. The behaviour in between is associated with charging and discharging phases, over time intervals connected with the Kelvin time scales of the components.
In these terms, a young contact binary system might be observed in the discharging phase of the more massive primary, corresponding to a transfer of envelope material to the secondary. In the original TRO scenario (Lucy Reference Lucy1976), the secondary then undergoes an energizing compression from a normal Main Sequence-like condensation, in order to comply with the equipotential layered structure of near-contact configurations. Secondary mass ejection with primary charging follows later, during a period of semi-detached separation from the common convective envelope. In due course, the secondary discharge subsides and the primary resumes what is effectively an interrupted Case A evolution process. This account addressed primarily the incidence of the cooler Binnendijk-type W contact binaries, taken to fall within a certain limited domain of
 $(J, q, M_1)_\mathrm{init}$
hyperspace characterising the W UMa type stars. Insufficient data on the A types allowed Lucy and others to surmise that these had evolved into a quasi-static thermal equilibrium condition.
$(J, q, M_1)_\mathrm{init}$
hyperspace characterising the W UMa type stars. Insufficient data on the A types allowed Lucy and others to surmise that these had evolved into a quasi-static thermal equilibrium condition.
In fact, for the bright Binnendijk-class A binaries S Ant and
 $\varepsilon$
CrA, evidence supports a semi-detached state with matter being now transferred from secondary to primary. Such binaries have a structural resemblance to low mass, short-period Algols, with the proviso that the present primary is close to its own surrounding ‘Roche Lobe’. Statistical surveys, such as those of Hilditch, King, & McFarlane (Reference Hilditch, King and McFarlane1988), Maceroni & van ’t Veer (1996), Dryomova & Svechnikov (Reference Dryomova and Svechnikov1999), Eker et al. (Reference Eker, Bilir, Yaz, Demircan and Helvaci2009); have allowed the A systems to be seen as a continuation of the contact condition to higher masses and luminosities. At higher mass we can expect the primary to have a correspondingly higher surface temperature. During the semi-detached stage, the transferred matter may form an equatorial belt around the primary where frictional effects detract from the orbital angular momentum (Flannery Reference Flannery1976; Stepien Reference Stepien, Dupree and Benz2004, Reference Stepien2009).
$\varepsilon$
CrA, evidence supports a semi-detached state with matter being now transferred from secondary to primary. Such binaries have a structural resemblance to low mass, short-period Algols, with the proviso that the present primary is close to its own surrounding ‘Roche Lobe’. Statistical surveys, such as those of Hilditch, King, & McFarlane (Reference Hilditch, King and McFarlane1988), Maceroni & van ’t Veer (1996), Dryomova & Svechnikov (Reference Dryomova and Svechnikov1999), Eker et al. (Reference Eker, Bilir, Yaz, Demircan and Helvaci2009); have allowed the A systems to be seen as a continuation of the contact condition to higher masses and luminosities. At higher mass we can expect the primary to have a correspondingly higher surface temperature. During the semi-detached stage, the transferred matter may form an equatorial belt around the primary where frictional effects detract from the orbital angular momentum (Flannery Reference Flannery1976; Stepien Reference Stepien, Dupree and Benz2004, Reference Stepien2009).
The separation of the components depends on how the angular momentum is distributed, becoming sensitive to low values of the mass ratio. The separation should decrease during discharges of the more massive star, pulling in the secondary and, if there is angular momentum loss from the orbit, tending ultimately towards merger. But continued mass loss from the original primary now increases the separation. According to Henneco et al. (2024), faster, Case B, interaction can take place for mass ratios comparable to that of S Ant. This suggests that the R CMa group of low angular momentum Algols (Budding, 1985) may have passed through a stage of similarity to S Ant at the present time. The Algol-like, mass-transferring condition of S Ant is substantiated by its LC asymmetry together with its consistent rate of period variation. Fig. 11 shows that the O’Connell effect has appreciable changes over relatively short timescales. Such variations can be regarded as flow or accretion structure instabilities, consistent with mass transfer.
The evolutionary path appears less definite with the relatively low mass ratio and angular momentum system
 $\varepsilon$
CrA. While an Algol-like mass transfer process similar to that of S Ant could still be inferred, a future episode of primary discharge, with the erstwhile primary now close to the Darwin stability limit, could result in a merger before the R CMa-like stage is attained.
$\varepsilon$
CrA. While an Algol-like mass transfer process similar to that of S Ant could still be inferred, a future episode of primary discharge, with the erstwhile primary now close to the Darwin stability limit, could result in a merger before the R CMa-like stage is attained.
In summary, this paper presents a detailed analysis of new high-quality data to yield reliable physical parameters of the W UMa type binaries S Ant and
 $\varepsilon$
CrA. This will help in the understanding of these complex systems. Our results support the broadly Algol-like transfer of matter, consistent with the general framework of interactive binary evolution and concomitant effects. However, further questions are raised by this interpretation, which falls short of a full explanation of the contact binary syndrome, while still allowing alternative views. We offer this contribution as a pointer to further research on contact binary systems and related mass flow dynamics.
$\varepsilon$
CrA. This will help in the understanding of these complex systems. Our results support the broadly Algol-like transfer of matter, consistent with the general framework of interactive binary evolution and concomitant effects. However, further questions are raised by this interpretation, which falls short of a full explanation of the contact binary syndrome, while still allowing alternative views. We offer this contribution as a pointer to further research on contact binary systems and related mass flow dynamics.
Acknowledgements
Generous allocations of time on the 1m McLennan Telescope and hercules spectrograph at the Mt John University Observatory in support of the Southern Binaries Programme have been made available through its TAC and supported by its Director, Dr. K. Pollard and previous Director, Prof. J. B. Hearnshaw. Useful help at the telescope was provided by the MJUO management (N. Frost and previously A. Gilmore & P. Kilmartin). Considerable assistance with the use and development of the hrsp software was given by its author Dr. J. Skuljan, and very helpful work with initial data reduction was carried out by R. J. Butland. VB would like to thank TUBITAK for its support within the scope of the 2214 overseas PhD research project program in 2006. Observations of
 $\varepsilon$
CrA were made within the scope of this support. We thank the University of Queensland for the collaboration software. This paper includes data collected by the TESS mission and obtained from the MAST data archive at the Space Telescope Science Institute (STScI). STScI is operated by the Association of Universities for Research in Astronomy, Inc., under NASA contract NAS 5-26555. This research has made use of the SIMBAD database, operated at CDS, Strasbourg, France, and of NASA’s Astrophysics Data System Bibliographic Services. We thank the unnamed referee for informative and helpful comments. The final version of this paper has improved significantly as a result.
$\varepsilon$
CrA were made within the scope of this support. We thank the University of Queensland for the collaboration software. This paper includes data collected by the TESS mission and obtained from the MAST data archive at the Space Telescope Science Institute (STScI). STScI is operated by the Association of Universities for Research in Astronomy, Inc., under NASA contract NAS 5-26555. This research has made use of the SIMBAD database, operated at CDS, Strasbourg, France, and of NASA’s Astrophysics Data System Bibliographic Services. We thank the unnamed referee for informative and helpful comments. The final version of this paper has improved significantly as a result.
Appendix A. Times of Minima
Times of eclipses for S Ant. Column ‘type’ indicates if the timing is for the primary eclipse (‘pri’) or the secondary (‘sec’). Under ‘Filter/Source’ the code ‘pg’ refers to the timing being based on photographic data, ‘vis’ visual, ‘pe’ photo-electric, ‘BVI’ to BVI photometry, and ‘R’ to Johnson R photometry. ‘TESS’ refers to the TESS satellite observing since 2018 in a special filter (Ricker et al. Reference Ricker2015). ‘KWS’ is the Kamogata/Kiso/Kyoto wide-field survey, observing in BVIc filters (Maehara Reference Maehara2014). ‘OMC’ are based on five-cm cameras onboard the INTEGRAL satellite, observing in the V filter since 2002 (Mas-Hesse et al. Reference Mas-Hesse2003). ‘HIP’ refers to the HIPPARCOS satellite, observing in a special Hp filter, between 1989 and 1993 (Perryman et al. Reference Perryman1997). ‘ASAS’ is the All Sky Automated Survey, observing since 1997 in the V and I filters (Pojmanski Reference Pojmanski2002). ‘CCD’ is self-explanatory. The column ‘Reference’ otherwise indicates the source of the data.
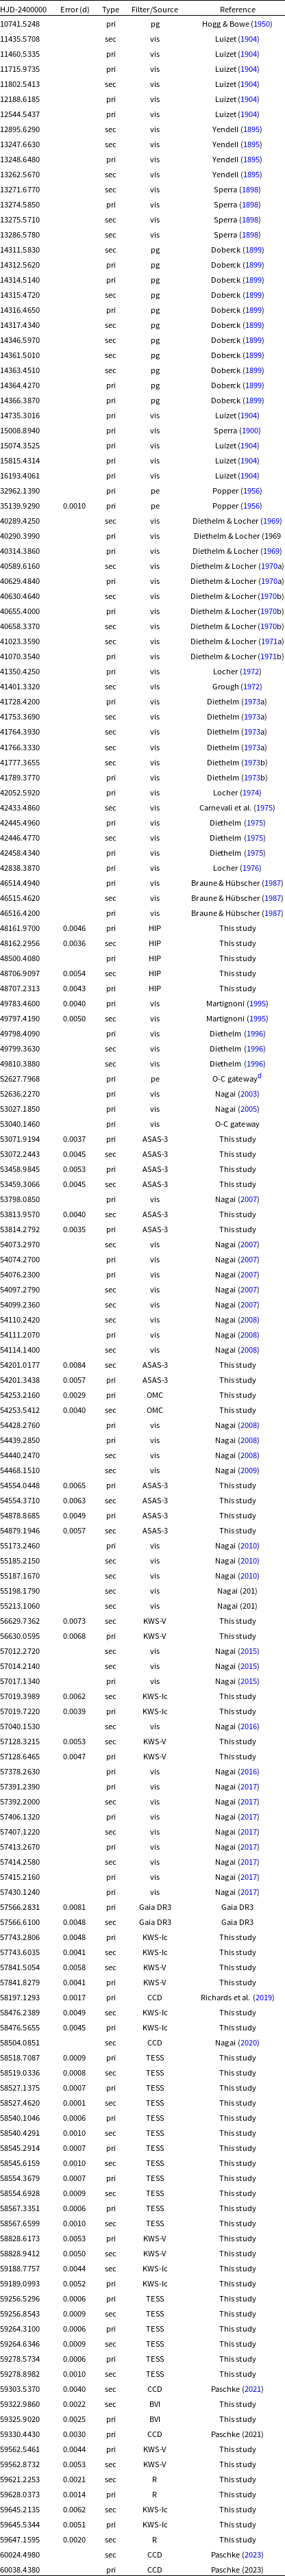
Times of eclipses for
 $\varepsilon$
CrA. Columns are as for Table A1.
$\varepsilon$
CrA. Columns are as for Table A1.
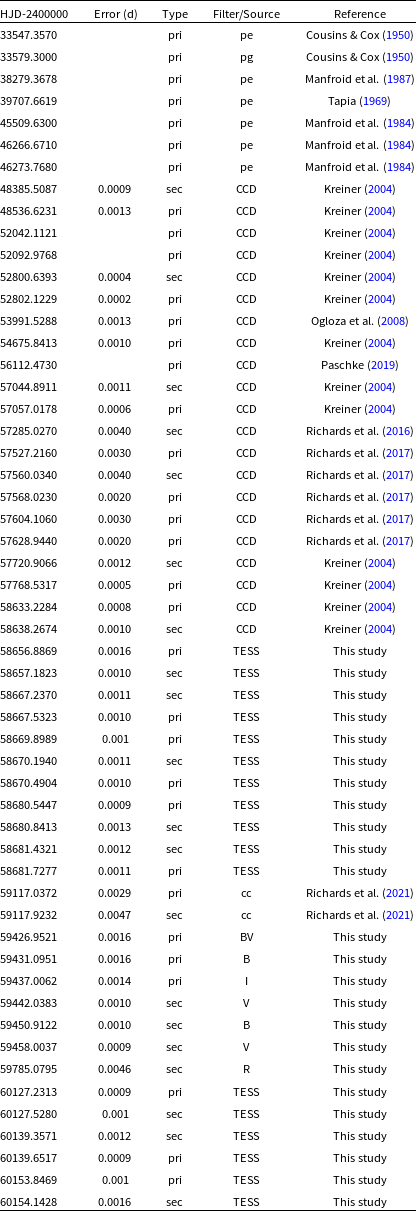
Appendix B. Spectroscopy
Log of spectroscopic observations for S Ant. S/N refers to 5 500 Å.
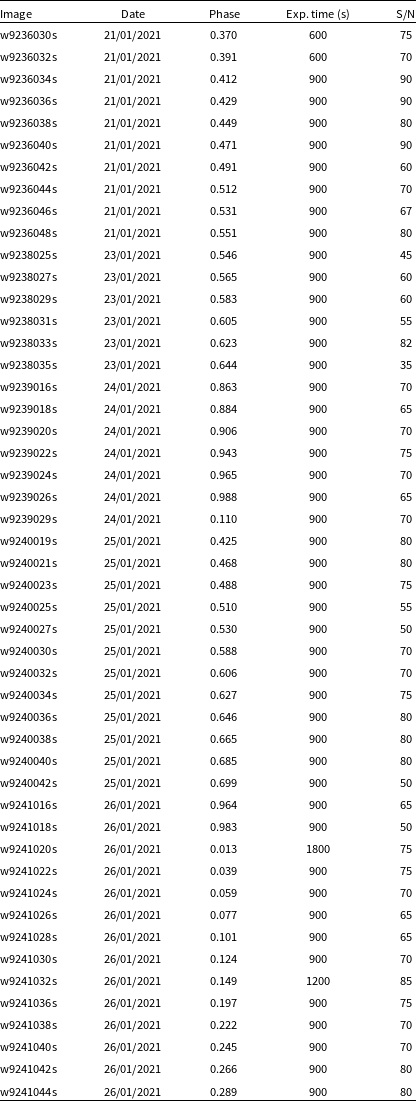
Log of spectroscopic observations for
 $\varepsilon$
CrA. S/N refers to 5 500 Å.
$\varepsilon$
CrA. S/N refers to 5 500 Å.
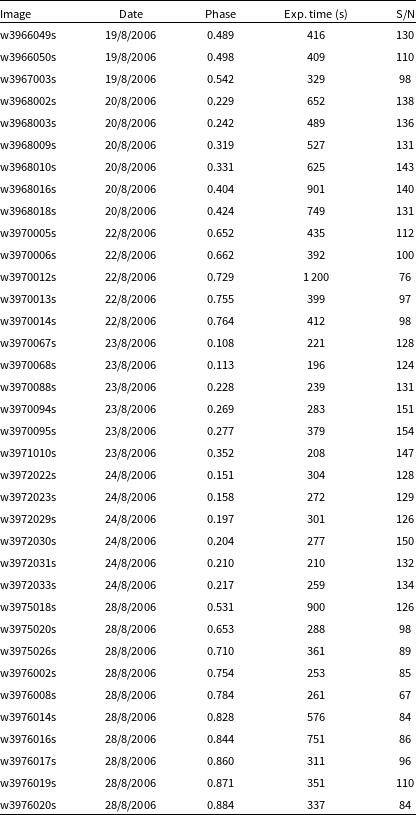
Line absorptions seen on the S Ant (UCMJO) spectra at elongation.
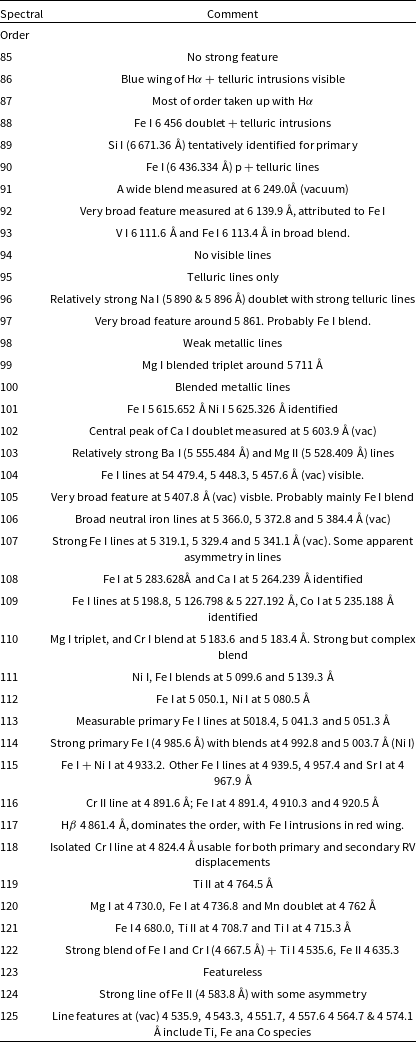
Some features seen on
 $\varepsilon$
CrA spectrum taken at UCMJO.
$\varepsilon$
CrA spectrum taken at UCMJO.
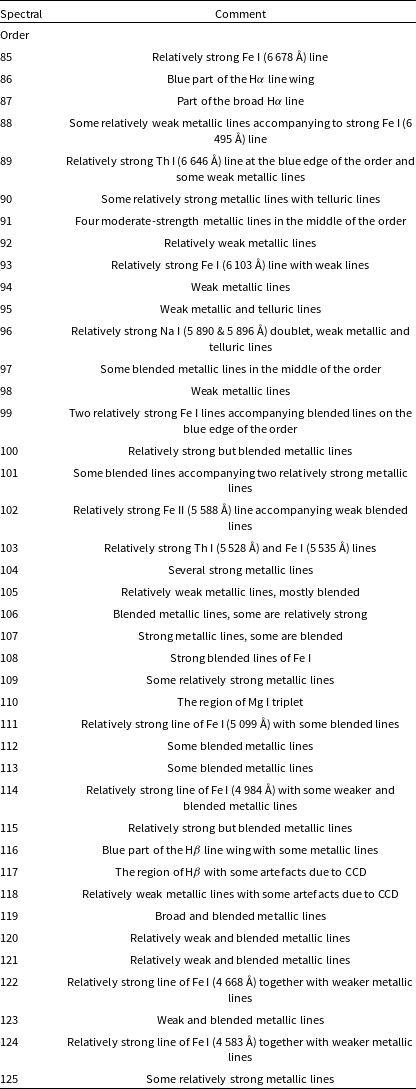
The observed spectrum (grey) of S Ant at the secondary (total) eclipse together with a Kurucz synthetic spectrum (red) calculated using solar abundances, with
 $T_\mathrm{eff}$
= 7 100 K, log g=3.98 cgs, and
$T_\mathrm{eff}$
= 7 100 K, log g=3.98 cgs, and
 $V_\mathrm{ rot}$
sini = 150 km/s. The spectral order number is indicated in the sub-figure captions.
$V_\mathrm{ rot}$
sini = 150 km/s. The spectral order number is indicated in the sub-figure captions.
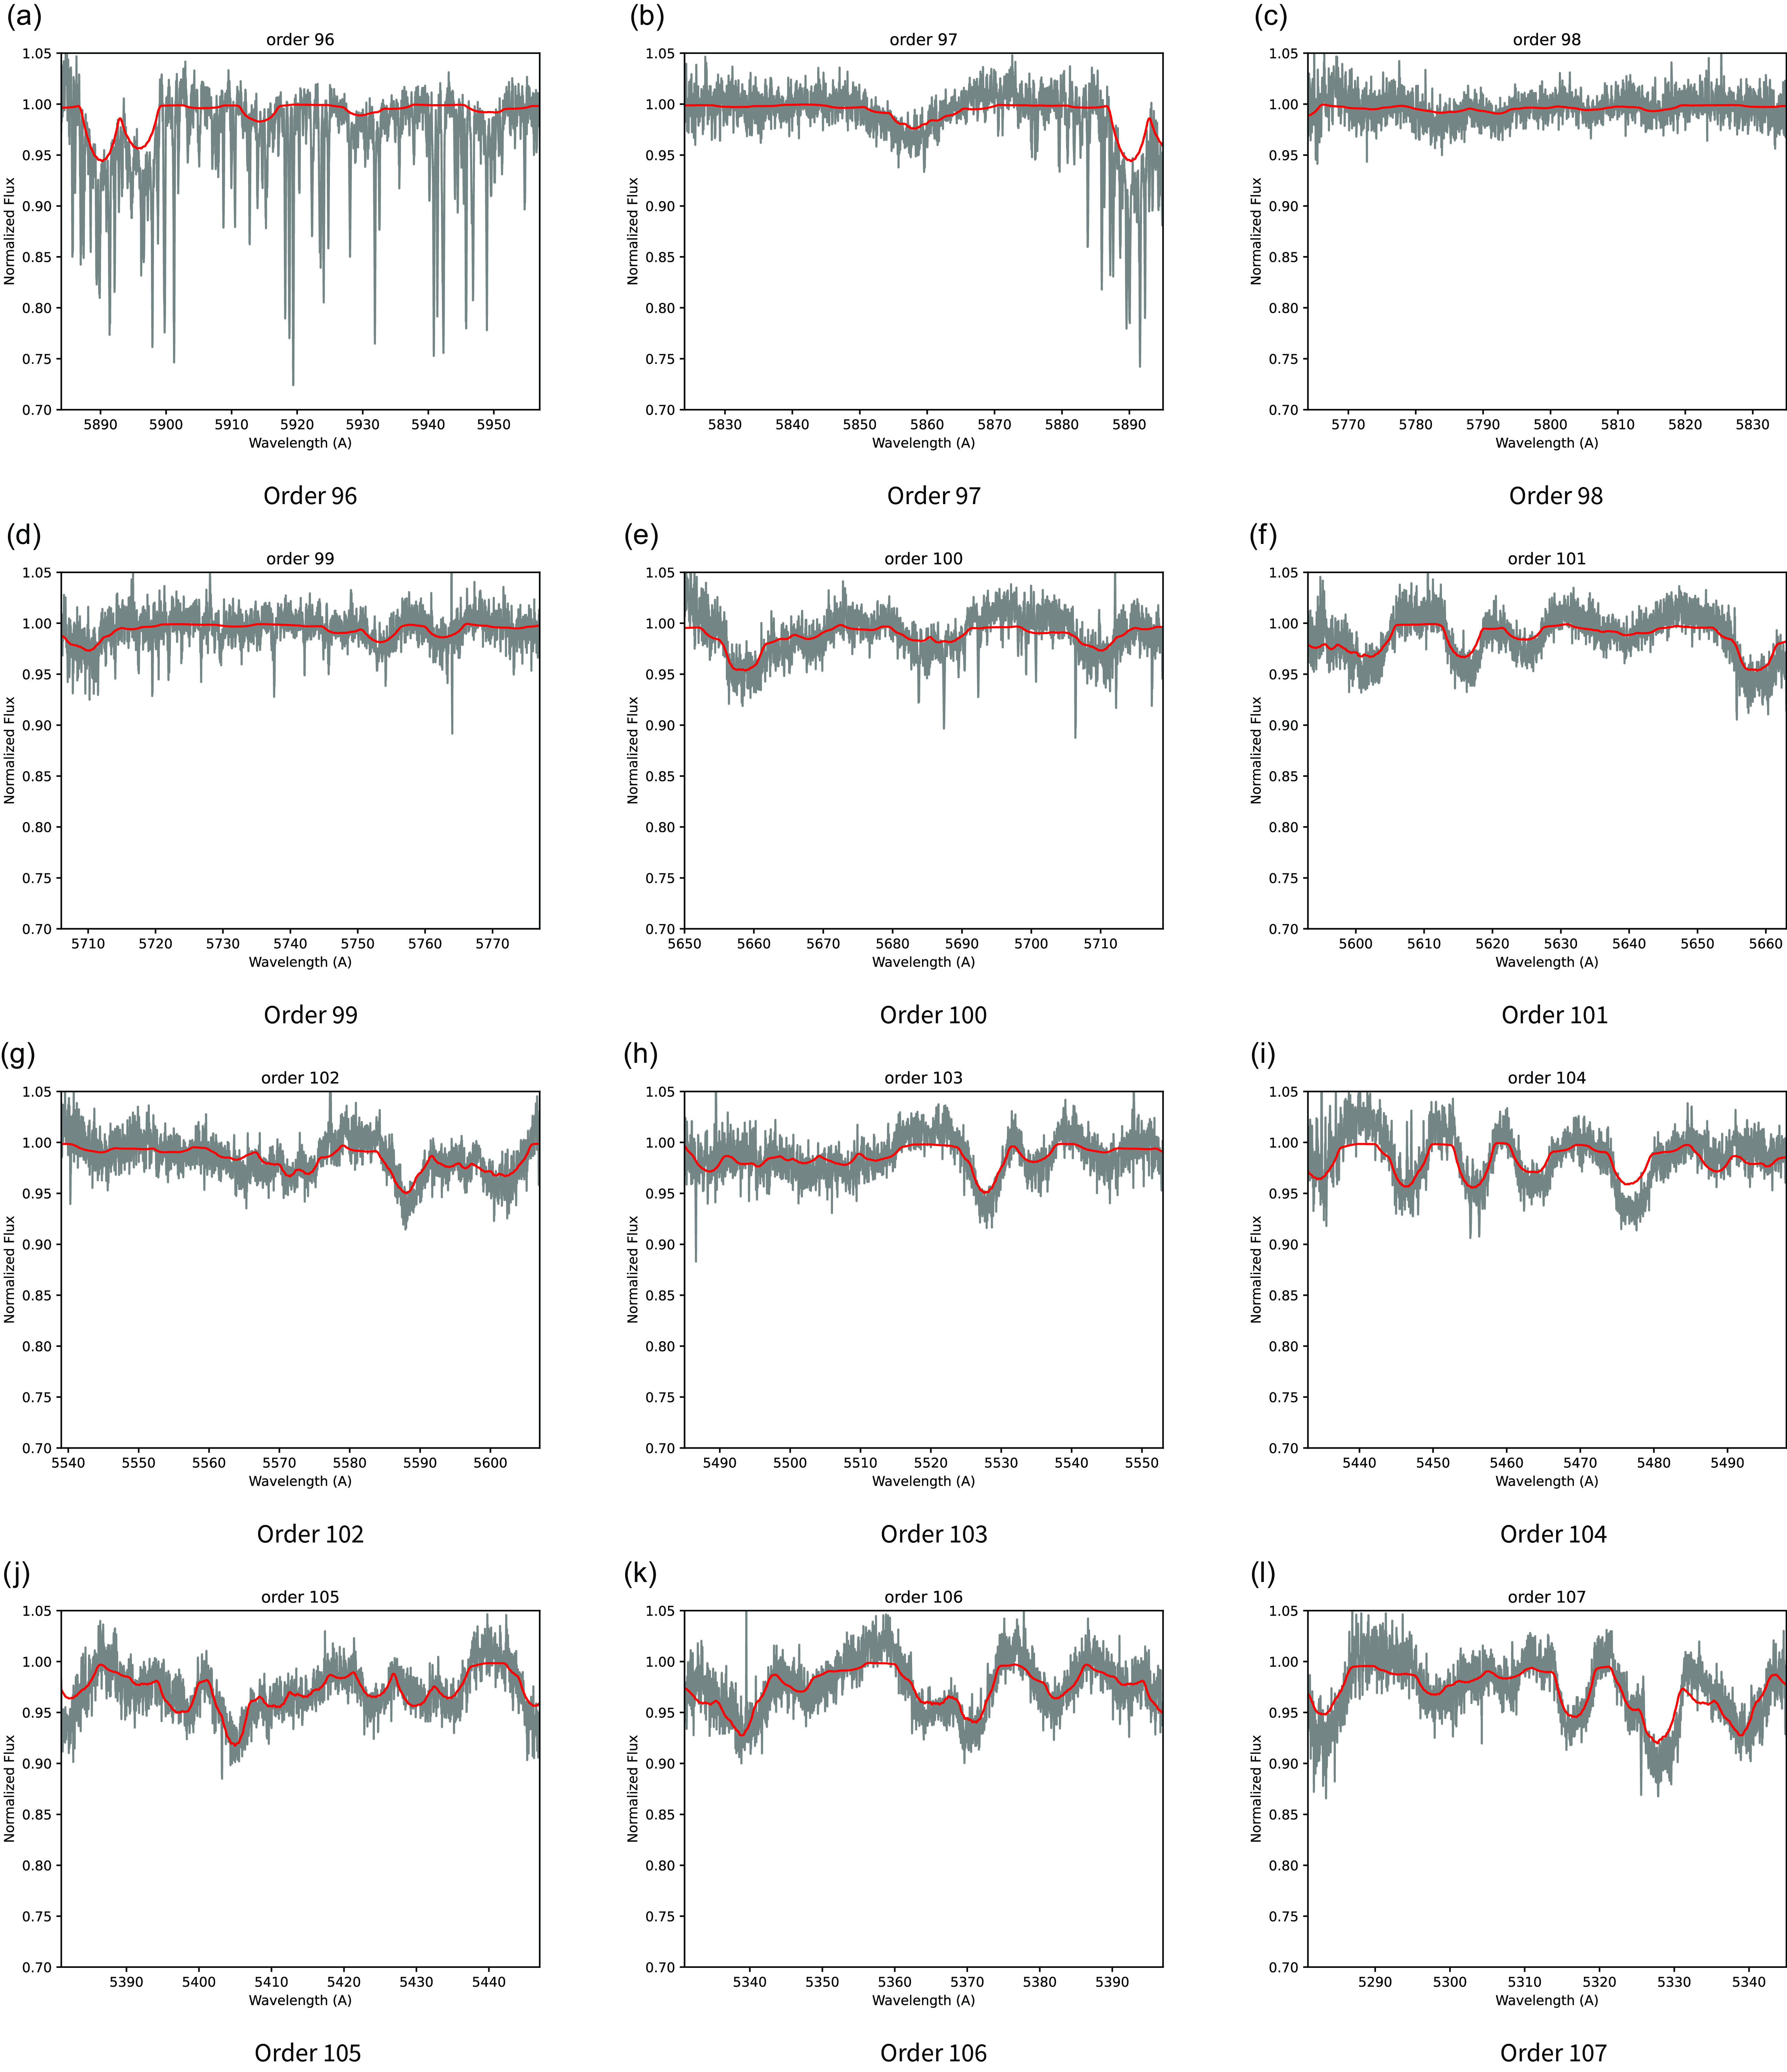
The observed spectrum (grey) of
 $\varepsilon$
CrA at the secondary (total) eclipse together with a Kurucz synthetic spectrum (red) calculated using solar abundances, with
$\varepsilon$
CrA at the secondary (total) eclipse together with a Kurucz synthetic spectrum (red) calculated using solar abundances, with
 $T_\mathrm{eff}$
= 6 000 K, log g=4.05 cgs, and
$T_\mathrm{eff}$
= 6 000 K, log g=4.05 cgs, and
 $V_\mathrm{rot}$
sini =170 km/s. The spectral order number is indicated at the top of each panel.
$V_\mathrm{rot}$
sini =170 km/s. The spectral order number is indicated at the top of each panel.
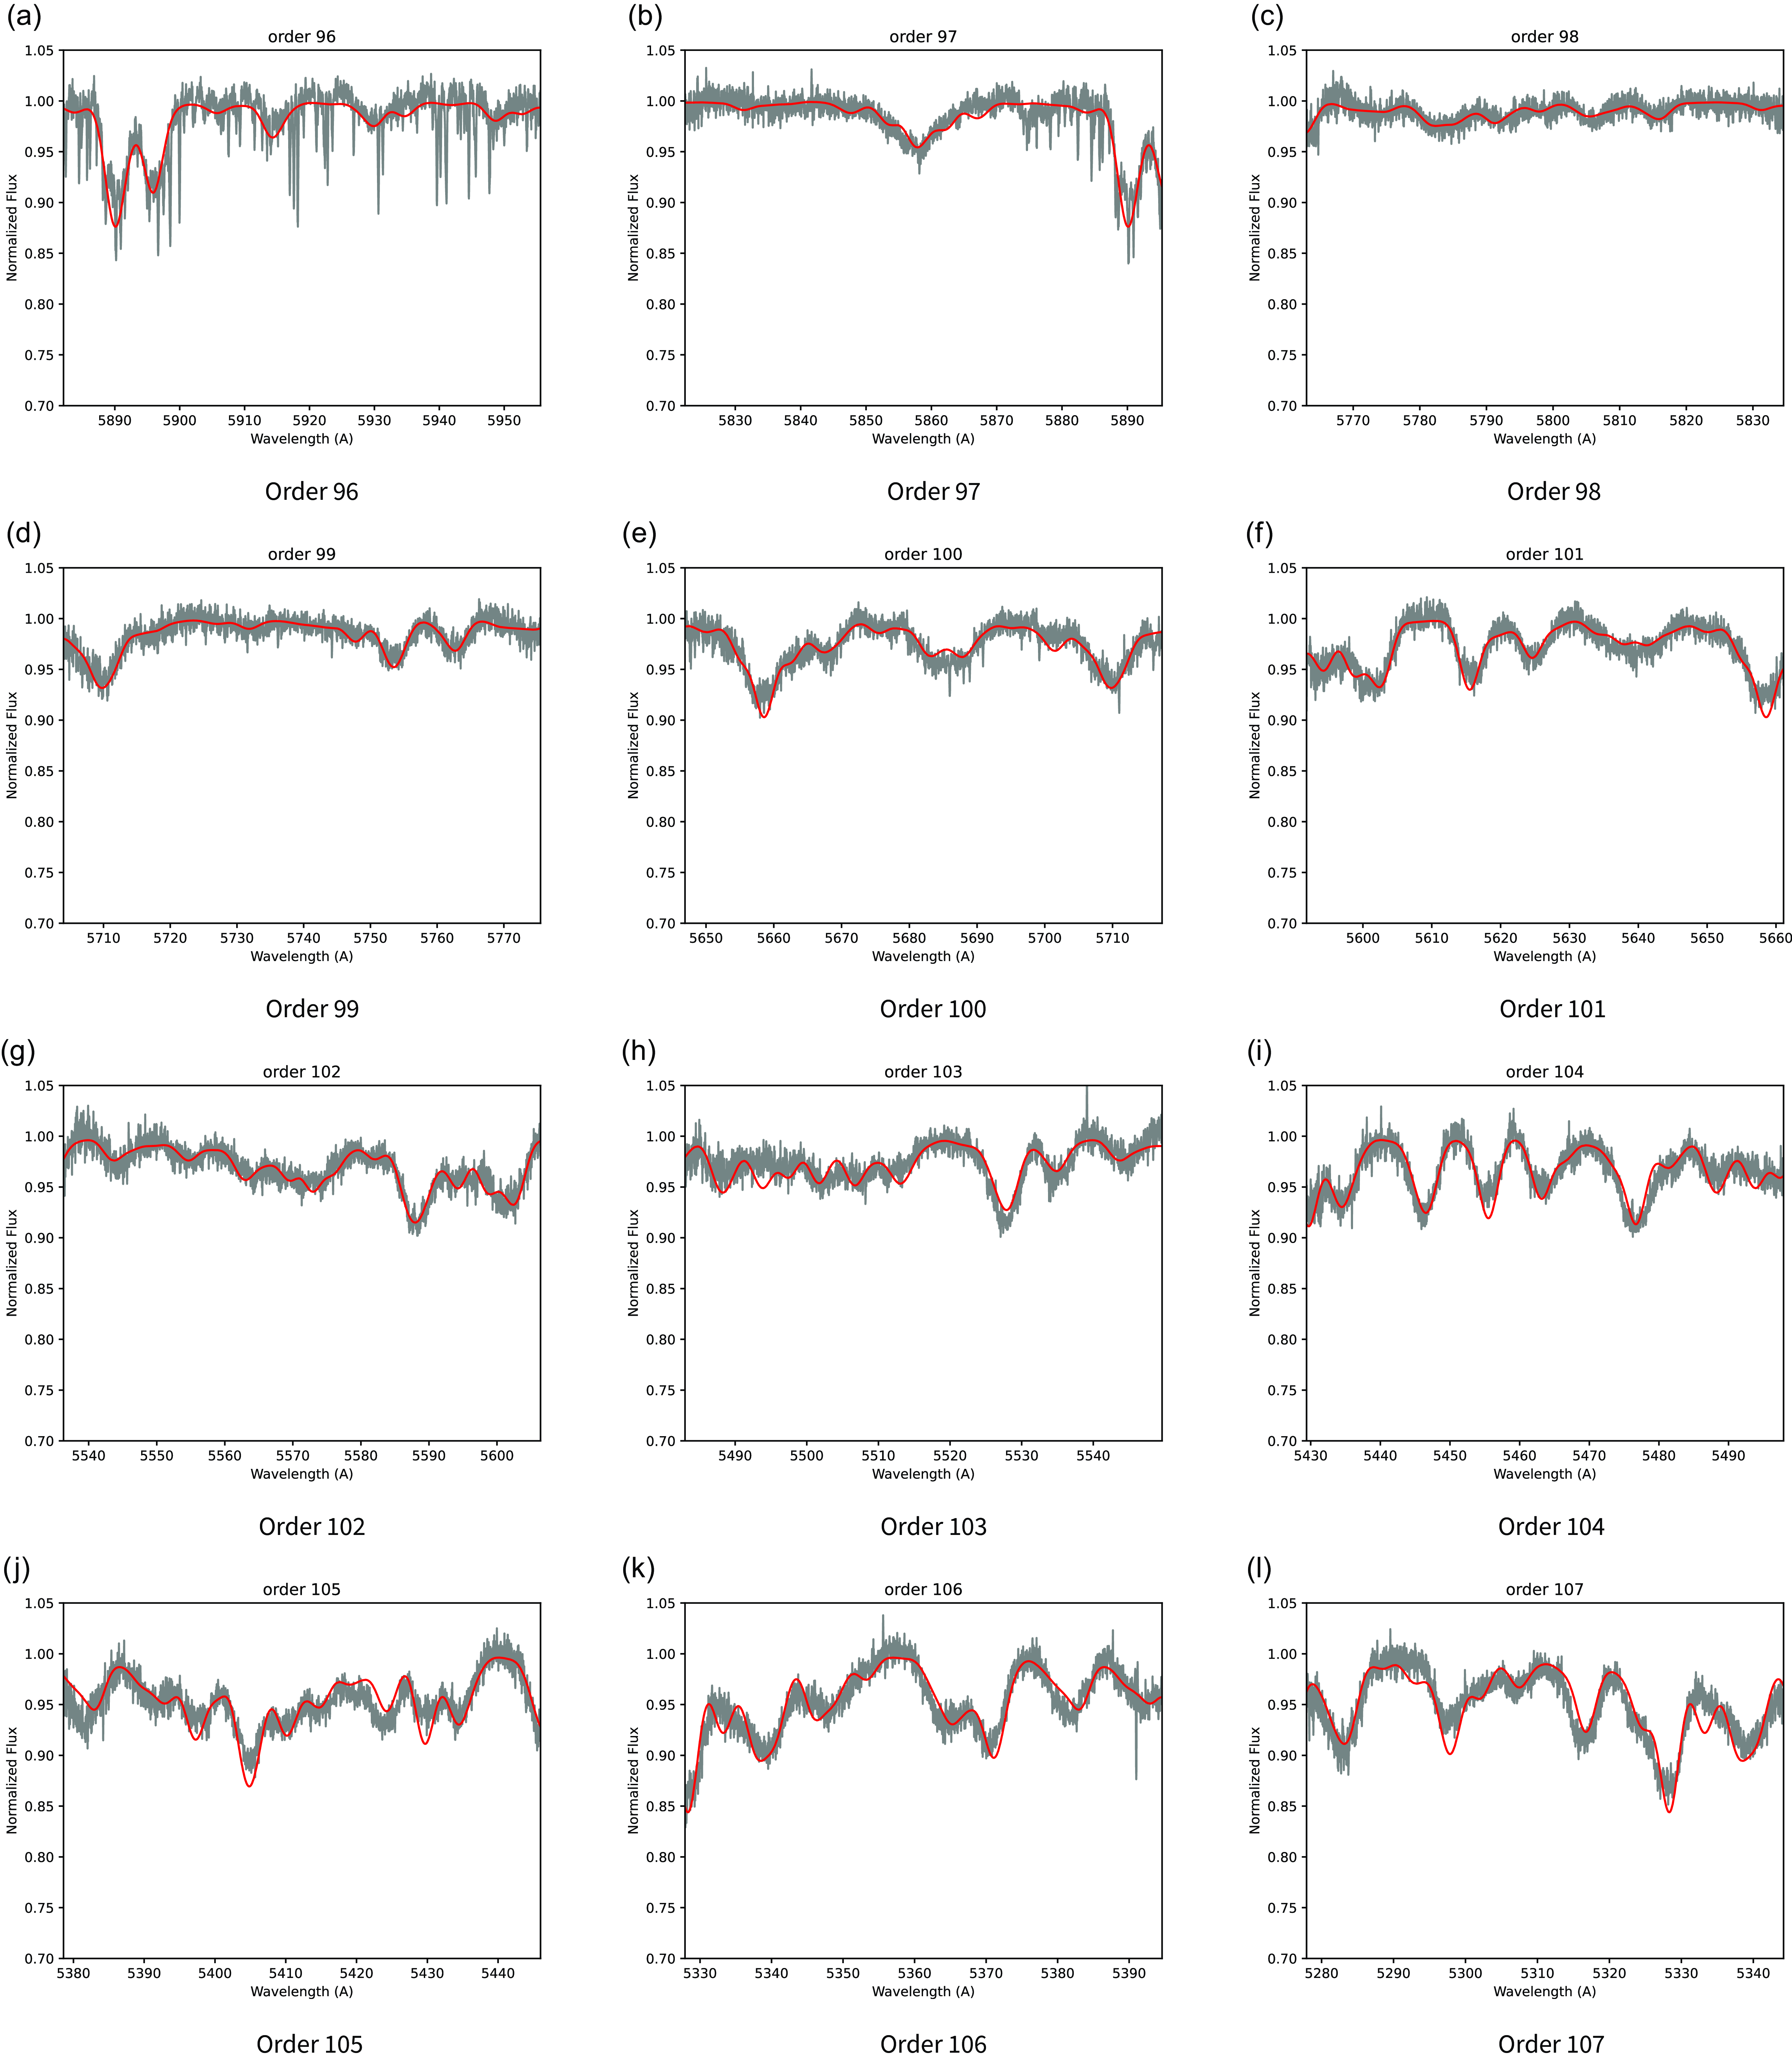


 Open access