


Introduction
Entering college marks the beginning of a new social experience, but students do not embark on this journey alone. Instead, they bring with them a set of attitudinal and behavioural predispositions shaped by a lifetime of socialization with parents, friends and the broader social forces they encountered during childhood. For many, college also serves as a stepping stone toward civic participation (Nie, Junn and Stehlik-Barry Reference Nie, Junn and Stehlik-Barry1996). The peers that students meet in college can serve as catalysts for this transition, shaping their engagement in civic life and potentially influencing their political inclinations.
Early studies of political participation emphasized the role of friends, family and social networks in shaping political behaviour (Berelson, Lazarsfeld and McPhee Reference Berelson, Lazarsfeld and McPhee1954; Lazarsfeld Reference Lazarsfeld1948). However, the extent to which these relationships drive political change remains uncertain, as most data struggle to disentangle social influence from selection effects (Bello and Rolfe Reference Bello and Rolfe2014; Shalizi and Thomas Reference Shalizi and Thomas2011).
Distinguishing social influence from selection remains a challenge, as both mechanisms can produce similar observable outcomes. If someone befriends a political activist and later joins a protest, is their participation driven by the new friendship or did their shared political interest lead to the friendship in the first place? Indeed, the inseparability of influence and selection parallels a longstanding debate over the effect of education on political participation. Although college students participate at higher rates than their peers who refrained from attending, scholars remain divided over the extent to which college students’ elevated political involvement is caused by the college experience itself or the preexisting factors that led them to pursue higher education (see Willeck and Mendelberg Reference Willeck and Mendelberg2022).
Of course, researchers can attempt to disentangle influence from selection by randomly assigning the factor of interest. But few subjects would agree to befriend a random stranger for the sake of science, nor would they leave their decision to attend college to chance. In this article, we leverage a rare case in which random assignment allows us to separate social selection from social influence and to examine the impact of college education on political participation. We analyze the influence of randomly assigned college roommates on voter participation in the 2016, 2018, and 2020 elections. By examining randomly assigned roommates, our design reduces the selection biases that often confound studies of social influence. And studying the effects of these roommates on participation provides causal leverage on theoretically powerful mechanisms by which college education might influence participation (Feldman and Newcomb Reference Feldman and Newcomb1969; Nie, Junn and Stehlik-Barry Reference Nie, Junn and Stehlik-Barry1996).
Studying social influence among college students allows us to examine a pivotal time in people’s lives. Most people maintain stable social networks for years on end (Cornwell et al. Reference Cornwell, Schumm, Laumann, Kim and Kim2014), and existing scholarship suggests that the social ties created during college can have a lasting influence on individuals’ political attitudes (Mendelberg, McCabe and Thal Reference Mendelberg, McCabe and Thal2017) and civic participation (Klofstad Reference Klofstad2010, Reference Klofstad2015). Although college students may be particularly susceptible to peer influence, such influence merits attention because of its lasting consequences.Footnote 1 Voting is habit-forming (for example, Coppock and Green Reference Coppock and Green2015; Gerber, Green and Shachar Reference Gerber, Green and Shachar2003), meaning early participation can shape engagement for years to come. Therefore, understanding what encourages or discourages new voters provides insight into the composition of the electorate more broadly.Footnote 2
New college students also provide a rare opportunity to study the confluence of longstanding and newly formed social connections. The college environment and new peer relationships may either reinforce or challenge behavioural patterns shaped by pre-college experiences. In this study, we use educational records and public voter data to assess students’ backgrounds and their families’ levels of political engagement prior to arriving on campus. Our design allows us to compare the influence of randomly assigned roommates on voting participation with the association between the students’ participation and that of their parents. Thus, we provide valuable insight – grounded in objective data – into whether early political socialization within the family remains influential on young adults even as they develop new peer-to-peer social ties.
Our results indicate that college students’ political participation is heavily influenced by their newly acquired (and randomly assigned) peers. On average, students and their roommates were roughly five percentage points more similar to each other in their behaviour – either voting together or abstaining together – than would be expected by chance. This relationship, established during the 2016 elections, persisted through the 2018 midterms. Moreover, the magnitude of this effect rivals the relationship between the turnout of students and their parents. This later relationship suggests that students’ early political socialization remains influential even as they develop new peer-to-peer social ties within the college setting, but the new relationships are clearly persuasive. Our findings, however, indicate these relationships may not be uniform; our evidence suggests peer-to-peer influence is strongest among women. Thus, our results build on recent work suggesting that women rely more heavily on political cues from their social networks while men are more resistant to social influence (Djupe, McClurg and Sokhey Reference Djupe, McClurg and Sokhey2018, Krupnikov et al. Reference Krupnikov, Milita, Ryan and Connors2020, but see Bergan et al. Reference Bergan, Carnahan, Lajevardi, Medeiros, Reckhow and Thorson2022).
Persistence and Change in Social Influence
Early theories argued that political predispositions were learned early in life – via pre-adult parental socialization – and persisted over the course of one’s lifetime (Easton and Dennis Reference Easton and Dennis1969; Hyman Reference Hyman1959; Renshon Reference Renshon1975). Evidence appeared to support this view.Footnote 3 In their classic study of persistence and change in political attitudes, Jennings and Niemi (Reference Jennings and Niemi1981) employed data from a two-wave panel study of parent-child pairs. In the first wave of the study (conducted in 1965), children were drawn from a nationally representative sample of high school seniors and interviewed about their political attitudes and activities; at least one parent was also interviewed. The parent-child pairs were then reinterviewed eight years later to assess the stability of their political orientations. Jennings and Niemi found a remarkably high degree of persistence in the political attitudes of the youth over the course of their early adult years, but these ‘new voters [entered] the electorate in a halting, uneven fashion’ (Reference Jennings and Niemi1981, 44). Political participation among young adults, the authors claimed, was largely a function of opportunity; the likelihood of participation increases as ‘the unfolding of the life cycle presents young adults with the opportunity for a form of participation that simply did not exist previously’ (Jennings and Niemi Reference Jennings and Niemi1981, 46).
Early work also focused on the interplay between college experiences and pre-college socialization. College can be transformative, particularly for those new college students who leave behind their parental homes and the local communities in which they were raised.Footnote 4 The opinions and values that parents impart to their children may not be shared and reaffirmed within a new college community. As old friendships are left behind, new friendships are constructed from within a new peer group that may differ markedly from those experienced during early childhood and adolescence. These new social relationships may expose students to new politically relevant information and resources, which can supplement the social resources the students already possess, and further lower the barriers to political participation (McClurg Reference McClurg2003; Campbell Reference Campbell2008). Moreover, new opportunities for political participation are likely to emerge. The transition to college corresponds with the attainment of voting age and the ability to vote, and college campuses also are rife with opportunities for collective action, ranging from petition signing to protest. If context and interpersonal influence help to shape political attitudes and behaviours (for example, Huckfeldt and Sprague Reference Huckfeldt and Sprague1987), then the political orientations of college students are likely to be highly malleable.
Scholars have noted the transformative nature of college. Theodore Newcomb’s (Reference Newcomb1943; Alwin, Cohen and Newcomb Reference Alwin, Cohen and Newcomb1991; Newcomb et al. Reference Newcomb, Koenig, Flacks and Warwick1967) famous Bennington College Study provided one of the first examinations of the effect of college on students’ social and political attitudes. Situated in rural Vermont, Bennington College, in 1935, was an all-women’s liberal arts college. By Newcomb’s estimation, most of the Bennington students came from affluent, politically conservative families; indeed, over two-thirds of the parents of Bennington students were self-identified Republicans. Yet, as the Bennington students progressed through their college years, they drifted from their parents’ political leanings. Newcomb (Reference Newcomb1943, 131–134) claimed that for most of the young women, their increased liberalism reflected a deliberate choice between the competing reference groups of family and school (faculty and peers). Importantly, the new political identities the Bennington women developed during their college years tended to last for their lifetime. Newcomb’s (Alwin, Cohen and Newcomb Reference Alwin, Cohen and Newcomb1991; Newcomb et al. Reference Newcomb, Koenig, Flacks and Warwick1967) follow-up studies of the Bennington students twenty-five and fifty years later found that most remained decidedly liberal in their political views, and roughly sixty per cent of the alumnae were politically active – mostly within the Democratic Party.
For all its merits, Newcomb’s Bennington College Study is not without its limitations. First, because of its focus on female college students, the Bennington Study may overstate the role of social influence on individuals’ attitudes and behaviours. Recent work suggests that women may be more reliant on the political cues they receive from within their similarly gendered social relations and that men may be more resistant to social influence (Djupe, McClurg and Sokhey Reference Djupe, McClurg and Sokhey2018; Djupe, Sokhey and Gilbert Reference Djupe, Sokhey and Gilbert2007; Krupnikov et al. Reference Krupnikov, Milita, Ryan and Connors2020). This evidence is consistent with extant work in social psychology suggesting that women typically are socialized to seek consensus (Eagly and Wood Reference Eagly, Wood, Van Lange, Kruglanski and Higgins2011; Koenig et al. Reference Koenig, Eagly, Mitchell and Ristikari2011) and are generally more persuadable than men. Guadagno and Cialdini (Reference Guadagno and Cialdini2002), for instance, report that women are much more persuaded by social messages, whereas men are likely to dismiss these messages and maintain their prior beliefs (see also Eagly and Wood Reference Eagly and Wendy2013). If these gender differences were at play in the Bennington Study, then its all-women sample likely exaggerates the extent to which new college students are persuaded by their new peer group.Footnote 5 Evidence from social network analysis also suggests that college-aged women may be more influenced by their peers. For instance, Igarashi, Takai and Yoshida (Reference Igarashi, Takai and Yoshida2005) study gender differences in the networks of first-year students in Japan. They find that, compared to men, women tend to have more stable social networks and perceive these peer relationships as more important. They also find that women tend to befriend more of their peers, which may reduce the influence of any single friend. However, a recent field experiment of mobilization messages on college students found no evidence that roommate spillover effects were stronger for women than for men (Bergan et al. Reference Bergan, Carnahan, Lajevardi, Medeiros, Reckhow and Thorson2022).
Perhaps the greatest limitation of the Bennington Study is that roommates are not randomly assigned. Thus, as with many studies of social influence, the evidence cannot distinguish between the changes in the students’ political attitudes arising from social influence from the deliberate selection of new discussion partners based on shared political views or interests. To overcome this limitation, several recent studies leverage the random assignment of college roommates as a natural experiment, thus circumventing many selection biases.
Among the few studies that have overcome the observational challenges posed by shared interests and contexts, most have found only limited social effects. Sacerdote (Reference Sacerdote2001) uses a roommate study like ours and finds that roommates influence students’ grade performance, but not their decisions about which fields to study. Likewise, Sinclair, McConnell and Green (Reference Sinclair, McConnell and Green2012), using a field experiment, find that people influence whether others living in their household vote but find no evidence that they influence their neighbours’ turnout. Many of the household effects they observe are likely to arise among family members.Footnote 6 More recently, Bergan et al. (Reference Bergan, Carnahan, Lajevardi, Medeiros, Reckhow and Thorson2022) examine college roommates who are not randomly assigned. They conclude that some mobilization messages spill over to college roommates while others do not. Their evidence for spillovers is limited to cases where roommates were already registered to vote. All told, the mixed results of existing studies, combined with the focus on established social ties, cast uncertainty over the effect of newly formed relationships. Whether peers affect one another’s political participation is an open question with important consequences. And evidence that peers do not affect one another, even among an age-group commonly assumed to be highly susceptible to social influence (Sears Reference Sears1986), calls into question the accuracy of deliberative democratic theories of everyday political discussion (see Neblo et al. Reference Neblo, Esterling, Kennedy, Lazer and Sokhey2010).
In a series of studies using data collected from first-year college students who lived in university housing at the University of Wisconsin, Madison, Casey Klofstad (Reference Klofstad2007, Reference Klofstad2009, Reference Klofstad2010, Reference Klofstad2015) examines the link between political discussion among roommates and civic participation, although notably he finds no correlation with voter turnout. Klofstad shows that roommates who report a greater frequency of political discussion also report higher levels of activity with voluntary civic organizations. Klofstad interviewed his subjects on four occasions – over a nine-year period – and found that ‘the initial bump in participation after exposure to political dialogue placed the discussant on a trajectory of higher rates of participation over time compared to those who were not exposed’ (Reference Klofstad2015, 304). The study is of great value, but, as Klofstad reminds us (Reference Klofstad2007, 103), its use of students’ self-reports of discussion and participation limits the study’s conclusiveness (see also Fraga and Holbein Reference Fraga and Holbein2020). If students feel pressure to present themselves as good citizens, they may over-report both discussion and participation, thereby inflating the appearance of social influence. More importantly, many of the roommates in his study were not randomly assigned, and thus the design remains susceptible to the selection problems that pervade most studies of social influence.
In his doctoral dissertation, ‘Measuring Interpersonal Influence’, David Nickerson (Reference Nickerson2005) reports the findings of a two-wave panel study of randomly assigned roommates at a private college. Nickerson finds muted evidence of peer-to-peer influence in his natural experiment. As he states (Nickerson Reference Nickerson2005, 106), ‘[t]he single best predictor of the opinions of a student at the end of the year is the student’s opinions at the beginning of the year’. Across a wide variety of questions, Nickerson found only two political questions on which the students’ opinions changed significantly because of their roommate pairing: students grew less favourable toward President George W. Bush and more favourable toward gay people. The magnitude of change in students’ attitudes on these two issues was comparable to that found in the change in students’ opinion regarding the lowering of the legal drinking age, about which, unsurprisingly, they became more supportive. Nickerson’s study did not examine students’ political participation.
A more recent panel study by Strother and colleagues (Reference Strother, Piston, Golberstein, Gollust and Eisenberg2021) examines first-year college roommates at two large universities – in this case, they were matched based on a set of preferential and behavioural variables drawn from university-administered questionnaires. The authors find little evidence that students overall become more liberal over time. Instead, their results show that the political preferences of students from both sides of the ideological spectrum tend to become more in line with their roommates over time, although the effect appears strongest among conservative students. Like Nickerson’s study, Strother and colleagues did not investigate students’ political participation.
Despite the somewhat mixed empirical record, there are strong theoretical reasons to believe that college roommates may influence one another. The economists David Marmaros and Bruce Sacerdote propose a model of how friendships form and develop:
Every potential social interaction has associated costs and benefits. The benefits are both a) a flow of information and ideas and b) the utility from sharing a common experience and conversation with another human being. The utility from the common experience component is assumed to increase with the number of previous social interactions that one has had with this specific person. The costs are the time it takes to have the face-to-face conversation, phone conversation, or email exchange. Perhaps the biggest time cost of all is finding out that the other person exists and might be a useful person with whom to speak (Marmaros and Sacerdote Reference Marmaros and Sacerdote2006, 83–84).
Being thrust into proximity, roommates may overcome the costs involved and enjoy the benefits of this relationship, although, obviously, ‘friendship’ is not guaranteed. Yet how these roommates might influence one another is a more difficult question (and one that cannot be answered here). As Betsy Sinclair (Reference Sinclair2012) notes, individuals may change their behaviour in response to the information communicated in a social tie, or they may conform to social pressure (for example, Gerber, Green and Larimer Reference Gerber, Green and Larimer2008) within the relationship.Footnote 7 In this context, both mechanisms are relevant. A student might join their roommate at the polls, reducing the initial information cost of voting (for discussions of this mechanism, see, for example, Bhatti, Fieldhouse and Hansen Reference Bhatti, Fieldhouse and Hansen2020; Fieldhouse and Cutts Reference Fieldhouse and Cutts2012). Likewise, a student might feel greater pressure to vote if they learn that their roommate voted.
Although identifying the mechanism is beyond the scope of this article, our design offers a rare opportunity to separate social influence from selection in a theoretically important social context. We do so by taking advantage of the natural experiment that arises when college students are randomly assigned as roommates. In addition to the benefits of random assignment of new relationships, we advance on existing work in two significant ways. First, we use public voting files to determine whether (voting-age) students vote, providing an objective measure of political participation. This feature avoids the potential for bias arising from self-reports, as discussed above. Second, we secured informed consent from students in our population to obtain information about their permanent households and university-held student information. The household information allows us to use public voting records to measure the voter participation rates of the students’ parents, thus offering a measure of early political socialization and an exogenous indicator of the students’ pre-college political proclivities. With these parental data, we can revisit the theme of early work described above, exploring the interplay of newly formed relationships and pre-college socialization.
Our Design
To overcome the observational challenges common to many studies of social influence in politics, we study first-year college students in 2016 who were randomly assigned a roommate in a campus residence hall. We examine the influence of these roommates on participation in the 2016, 2018, and 2020 US elections. Random assignment reduces confounds arising from shared interests or backgrounds. Imagine we observe two friends, Angela and Lisa, who both voted in 2016. Angela may have influenced Lisa’s decision to vote (or vice versa), but alternatively, they may have both voted because of a shared interest in politics. More generally, people often select into relationships based on shared background characteristics or interests. This tendency, known as homophily, is a chief confound in the study of social influence. Examining randomly assigned roommates alleviates this confound because one roommate’s baseline political interest is unassociated with their roommate’s baseline political interest. The same is true for other pre-existing factors that lead to voting, such as wealth. Although wealthier people are more likely to vote (Verba, Schlozman and Brady Reference Verba, Schlozman and Brady1995), relatively wealthy students are no more likely than relatively poor students to be assigned a roommate from a wealthy background. As a result, there is no expected relationship between wealth and roommate status in our data, despite a strong relationship between wealth and friendship in the broader population (see McPherson, Smith-Lovin and Cook Reference McPherson, Smith-Lovin and Cook2001). Therefore, neither wealth nor any other pre-existing factor is likely to confound our estimates of social influence. Of course, other confounds remain, and we have designed our study to address these. For instance, Angela and Lisa may have both voted because they were each targeted by the same mobilization campaign (for example, Bennion and Nickerson Reference Bennion and Nickerson2016). Failing to account for mobilization effects and other aspects of the students’ shared context that affect participation may mistakenly lead us to conclude that the students’ shared behaviours arose from social influence.
The Student Sample
Our data are drawn from the over 6,000 first-year undergraduate students who utilized campus housing at Florida State University beginning in either the Summer or Fall of 2016.Footnote 8 Overall, about 85 per cent of first-time college students at Florida State University live in the university’s residence halls.Footnote 9 Unlike prior studies of roommates, as described above, the students were not matched to roommates based on a survey or other background information other than gender and preferences for building and room type.
We describe the roommate pairing procedure in detail in Section A of the supporting information. In short, students were given priority in residence hall selection by random lottery; thus, space availability becomes constrained over time. When students choose their residence hall, they also choose the type of suite in which they wish to live. And in selecting their suite, they were assigned one or more roommates who made the same choice – with no additional knowledge available about who might live there. In the Statistical Inference section, below, we discuss how our design accounts for selection into building and room type.
In Section B of the supporting information, we describe in detail our recruitment and consent process, but an overview of the resulting sampling process is provided in Figure 1. In total, we collected consent from 2,287 students who were over 18 years old by Election Day, 2016. Of these students, 1,310 were randomly assigned, but only 423 shared a room with at least one other student who also provided consent. Most of these students (N = 396) lived with only a single roommate, while the remaining 27 students roomed with two other students. These individuals formed 225 undirected dyads – distinct pairs of consenting students.Footnote 10
A Workflow for Establishing Undirected Roommate Dyads.

Measuring parental participation
Students granted consent to obtain their current campus addresses and permanent mailing addresses, which typically identify their parents’ homes. Using this information, we obtained the public voting histories of students’ parents, stepparents, or guardians (‘parents’ for short). Parents’ participation histories provide one of the strongest predictors of their children’s participation as adults (Beck and Jennings Reference Beck and Jennings1982). Parental participation rates help us understand the extent to which students were politically socialized to participate before they arrived on campus.Footnote 11
Because domestic students in the entering class of 2016 at Florida State University came from forty-eight of the fifty states and the District of Columbia, we required voting data from across the country. Thus, we purchased access to the Dynamic National Database constructed by the vendor, Catalist. The Catalist data are updated regularly through the acquisition of state voter files, and the company uses Census and commercial data to match voters within the file over time and across space, when those voters change residences. Catalist data are used routinely in political science research (for example, Fraga Reference Fraga2018; Hersh Reference Hersh2015), and we used these data to measure student voting participation and parental voting participation history.
Our measure of parental participation required us to identify students’ parents in the voting record – see Appendix C for details on our matching process. For each parent we identified, we measure their participation as the percentage of midterm and presidential elections from 2008 to 2014 in which they were recorded as voters in the voter file. We begin with 2008 because it is the earliest year provided in the national voter file obtained from Catalist. In households where we found only one parent, we use that parent’s vote history. In households where we identified two parents, we take the average of both vote histories. In households where we found no parent, we assume that parents did not vote since the absence from the voter file typically indicates a non-voter.
Sample characteristics
To contextualize our data, we compare our focal sample to several relevant groups within the university and across the United States. Table 1 presents descriptive statistics for the N = 225 randomly assigned dyads alongside the N = 199 self-selected dyads – pairs of students who provided consent but are excluded from our primary analysis because they chose their own roommates. The table focuses on measures of within-dyad difference to examine whether randomly assigned dyads tend to be more different from one another than self-selected dyads. For example, the first row shows that only 2 per cent of randomly assigned dyads attended the same high school, compared to 32 per cent of self-selected dyads. Similarly, the fourth row shows greater within-dyad heterogeneity in terms of students’ parents’ political participation rates in the years 2008-2014. The final four rows incorporate zip code-level data to measure within-dyad differences in various features of students’ home mailing addresses, which serve as proxies for students’ pre-college environment. Under this assumption, the table suggests greater differences within randomly assigned dyads than self-selected dyads in terms of features such as the proportion of racial or ethnic minorities, education levels, and income.
Covariate Distributions for Randomly Assigned and Self-Selected Dyads

Note: Data for rows 1-3 come from university records. Data for parental turnout comes from Catalist, as described above. Zip code estimates of age and minority population come from the 2010 Census. Zip code estimates of education and income come from the 2012-2016 5-year American Community Survey. Zip code education is measured as the proportion of residents with a bachelor’s degree (or higher).
To assess how our selection criteria may have influenced the sample composition, we examine individual-level descriptive statistics in Table 2. This table reports statistics for our sample of randomly assigned roommates, the supplemental sample of self-selected roommates, and an additional group of students with randomly assigned roommates who are excluded from our primary analysis because their roommate did not provide consent. The data suggest that randomly assigned students voted at similar rates to the self-selected students. Moreover, the randomly assigned sample was more diverse in terms of gender, race and ethnicity. As a result, the randomly assigned students are more closely aligned with national demographic averages than their self-selected counterparts, as shown in Table 3.
A Comparison of Qualified Students in Sample by Room Selection Type

Note: The ‘Random, Complete’ columns display our principal sample: students who were randomly assigned housing and have at least one randomly assigned roommate who also consented. The ‘Self-Selected’ columns summarize students whose data indicate they chose their roommates (these students are not part of our principal sample). The ‘Random, Partial’ columns provide summary statistics for students whose data indicate that their roommates were randomly assigned, but they did not make it into our principal sample because their roommate did not consent (or their roommate’s data indicates they self-selected).
A Comparison of Florida State University Students and College Students Nationally (as Proportions)

Source: ‘National Study of Learning, Voting, and Engagement, Student Voting Rates, Florida State University, October 2021’. Tufts University.
In Table 3, we compare all Florida State University students – not just those in our sample – to college students nationally, drawing these data from Tufts’s National Study of Learning, Voting, and Engagement (Institute for Democracy & Higher Education 2021). As the table shows, the gender composition of the student body at Florida State University is similar to the national average, both roughly 56 per cent. The percentage of white students at Florida State University is also close to the national average of 61 per cent. The Florida State University student body has a smaller share of black students compared to the national average (9 per cent to 12 per cent), but a greater share of Hispanic students than average (21 per cent to 14 per cent).
Politically, the student body at Florida State University is significantly more participatory than the national average. In 2016, the turnout rate among Florida State University students was 63.5 per cent, roughly 15 percentage points higher than the national average (48.3 per cent). This higher turnout rate was sustained over the 2018 and 2020 election cycles. In 2018, 49.6 per cent of Florida State University students voted in the midterm election, compared to just 36.3 per cent nationally. And, in the 2020 elections, 76.7 per cent of Florida State University students voted, compared to 62 per cent of US college students.
Statistical inference
Our data do not lend themselves to regression modelling in which we regress one student’s turnout on the other’s turnout. In this framework, each dyad produces two observations, thus violating the independence assumption, which is also violated due to nesting within residence halls.Footnote 12 Although we could attempt to model the interdependence, we instead follow other recent work on social influence (Goel, Mason and Watts Reference Goel, Mason and Watts2010; Minozzi et al. Reference Minozzi, Song, Lazer, Neblo and Ognyanova2020) that relies on permutation tests. Permutation tests compare the observed dyadic similarity to a null distribution generated by randomly shuffling the dyads, providing a means to account for the complex error structures in dyadic data (Erikson, Pinto and Rader Reference Erikson, Pinto and Rader2017).
By way of a simple example, consider Figure 2A, which displays a hypothetical dataset with ten students assigned to five rooms. The first column, labelled ‘observed’, represents the actual students living in each room. The remaining five columns represent five permutations of these dyads. In each permutation, students are randomly paired together, breaking the expected similarity between roommates that is caused by social influence – since the permutations reflect a hypothetical roommate pairing rather than an actual roommate relationship, dyadic similarity cannot be due to within-room social influence. Yet the permutations retain any similarities that would arise by chance, given the distributions of student characteristics in the sample. For instance, if a get-out-the-vote drive increased turnout campuswide, this mobilization effort would also increase the chances that any two randomly chosen students both voted. This probability of co-voting will be reflected in the average similarity in the permuted columns and thus cannot account for differences between the observed data and permuted data. In practice, we generate 10,000 permutations and calculate p-values as the proportion of permutations where the dyadic similarity exceeds that of the observed data. These p-values test the sharp null hypothesis of no roommate influence for any students.
A Schematic Demonstration of the Permutation Tests.
Note: The plot shows ten students assigned to five rooms, as indicated by the first column, labelled Observed. Columns 2-6 represent five reassignments of these ten students to one of the five rooms. For the simple permutations (Panel A), the room assignments are entirely random. For the constrained permutations (Panel B), the room assignments keep the halls fixed and randomly reassign students to a room within their hall.

We also generate a second permutation distribution in which the permutations are constrained to account for the students’ gender, residence hall, and suite type. Figure 2B shows a simplified version of this approach in which the permutations are constrained within residence halls. This constrained permutation distribution reflects the true assignment procedure in the observed data since students are assigned to roommates of the same gender who also chose the same residence hall and suite type. Therefore, it accounts for any similarity between roommates induced by gender or selection into residence halls and suite types. Likewise, it accounts for the similarity induced by other environmental confounds such as the hall’s proximity to the campus polling location. Yet this distribution may provide an overly conservative test because forty-one students lack potential roommates in our sample with the same gender, residence hall, and suite type – other than their observed roommates (recall that students only enter our sample if they provide consent and their roommate was randomly assigned rather than self-selected). Thus, these dyads remain unchanged in all 10,000 constrained permutations, propagating any similarity caused by social influence in these observed dyads throughout the null distribution. See students 9 and 10 in Figure 2B for an illustrative example. We therefore report results from both the simple permutations and the constrained permutations.
We gain further analytical leverage by constraining the permutations to account for the choices that students make prior to roommate assignment. As explained in Section A of the supporting information, the students selected their residence halls and suite types, which varied in cost. They were then assigned a roommate who made the same selections. And thus, students who chose one hall or suite type may differ systematically from those who chose other suite types. In network terminology, this procedure accounts for baseline homophily (McPherson, Smith-Lovin and Cook Reference McPherson, Smith-Lovin and Cook2001), which reflects the dyadic similarity that would arise by chance due to the set of potential partners in the local environment. Therefore, these constrained permutations limit confounds driven by selection into a particular residence hall and the confounds associated with the contexts and experiences that students within a residence hall experience.
Results: Social Influence among Roommates
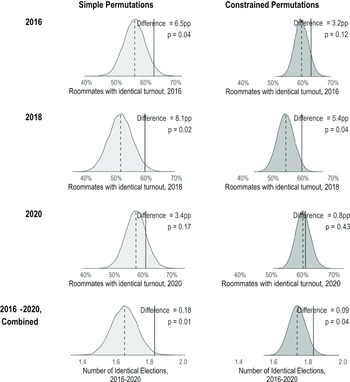
Figure 3 displays our results, depicting dyadic similarity for four outcomes. The three left panels show the average similarity of the 2016 roommates for participation in the 2016, 2018, and 2020 elections. In these panels, we measure similarity as the percentage of dyads with identical values of turnout, that is, both members of the dyad turned out to vote or neither member of the dyad turned out. The panel on the right provides a summary measure, showing the total number of elections in which the roommates exhibited identical turnout status.Footnote 13
Observed Turnout Similarity Between Roommates in the 2016 Presidential Election, 2018 Midterm Elections and 2020 Presidential Election.
Note: In each panel, the solid vertical line indicates the observed mean. The density plot and dashed vertical line reflect the distribution of this statistic and its mean value over 10,000 permutations. The left panels show the simple permutations, and the right panels show the constrained permutations. The first three rows show the percentage of dyads with identical turnout status (that is, both voted or neither voted) in a given year. The last row shows the total number of elections in which a dyad exhibited identical turnout status. In the upper right corner of each panel, the difference shows the observed value minus the permutation mean, and the p-value shows the proportion of permutations greater than or equal to the observed value.

The top-left panel in Figure 3 shows that 63 per cent of dyads exhibited identical values of turnout in 2016, exceeding the means of both null distributions. This value is seven percentage points greater than is expected by chance, as measured with the simple permutation mean (p = 0.04). This observed similarity is three percentage points greater than would be expected by chance, as measured with the constrained permutation mean (p = 0.12). Recall that the roommates knew each other for only a few months by the time of these elections. Perhaps more remarkable, this similarity persists two years later, as shown in the middle-left panel. In the 2018 midterm elections, 60 per cent of the dyads were identical, exceeding the null means of 51 per cent in the simple permutations (First difference = 8 percentage points; p = 0.02) and 54 per cent in the constrained permutations (First difference = 5 percentage points; p = 0.04).Footnote 14 In the 2020 election, the observed similarity of 61 per cent remained as strong as that observed in prior years, as shown in the third row of Figure 3. In 2020, however, turnout across the university was high – 77 per cent compared to 64 per cent and 50 per cent in 2016 and 2018.Footnote 15 This high participation rate also yields an elevated chance that we would detect similarity as strong as in our sample, even in the absence of social influence. Thus, the observed mean in 2020 does not differ significantly from the null distributions.
In total, over these three elections, the randomly assigned roommates were more similar than we would expect by chance, as shown in the bottom two panels of Figure 3. On average, their turnout decisions were identical in 1.83 elections. This similarity exceeded the 1.65 elections expected under the simple permutations (First difference = 0.18; p = 0.01) and the 1.74 expected under the constrained permutations (First difference = 0.09; p = 0.04).Footnote 16
Comparing Turnout Rates based on Parents’ and Peers’ Participation
To provide perspective on the magnitude of this apparent social influence, Figure 4 plots students’ turnout based on (a) their randomly assigned roommate’s turnout in 2016 and (b) their parents’ average turnout in 2008-2014. The figure shows the turnout rates for four comparison groups. The first and second groups are based on whether the focal student’s roommate(s) abstained or voted in 2016. The third and fourth groups are based on whether the focal student’s parents never voted or always voted during the 2008-2014 elections. The open circles show the turnout rate for students whose roommates did not vote in 2016, and the closed circles show the turnout rate for students whose roommates voted in 2016. The open triangles show the turnout rate for students whose parents did not vote in any of the 2008-2014 elections. The closed triangles show the turnout rate for students whose parents voted in all four elections.
Students’ Turnout Rate in 2016, 2018, and 2020 by Their Randomly Assigned Roommate’s Turnout in 2016 and Their Parents’ Turnout in Elections Held from 2008 to 2014.
Note: The open points show the percentage of students who voted if their roommate abstained in 2016 (open circles) or if their parents did not vote in the 2008-2014 elections (open triangles). The closed points show the percentage of students who voted if their roommate voted in 2016 (closed circles) or if their parents voted in every election from 2008 to 2014 (closed triangles). The horizontal lines around each point indicate heteroskedasticity-robust 95 per cent confidence intervals.

The differences in turnout based on roommate participation tend to be similar in magnitude to the differences based on parental participation. In 2016, 61 per cent of students turned out to vote if their roommate abstained, while 73 per cent turned out if their roommate voted. This 12-point gap associated with roommate participation is as large as the gap associated with parental participation. For students whose parents did not vote in the 2008-2014 elections, turnout in 2016 was 64 per cent. For students whose parents voted in all four of these elections, turnout in 2016 was 73 per cent. The relative size of these relationships is quite remarkable, given that first-year students in our sample met their roommates approximately three months before the election, compared to roughly eighteen years of living with their parents.
The evidence from 2016 suggests that new peer-to-peer relationships may have a substantial impact on college students’ decisions to vote, but is this influence short-lived? To answer this question, we examine the relationship between roommates’ 2016 voting behaviour and the focal students’ voter participation in subsequent elections, the 2018 congressional midterms and the 2020 presidential election. For students in the 2018 elections, students’ participation remained strongly associated with their 2016 roommate’s participation. Turnout in 2018 was 53 per cent among students whose roommates abstained in 2016 and 64 per cent among students whose roommates voted in 2016. Likewise, we can examine the relationship between parental turnout during the students’ time before college and students’ political behaviour. In 2018, turnout was 55 per cent among the students whose parents did not vote in any of the four elections and 65 per cent among students whose parents voted in all four elections. By 2020, the participation gap receded on both measures. Turnout was 68 per cent for students whose roommates abstained in 2016 and, coincidentally, also 68 per cent for students whose parents abstained in all four elections. And turnout was just over 70 per cent for students whose roommates voted in 2016 and those whose parents voted in all four elections.
Overall, these results suggest an important role for parental socialization, although we cannot be confident that this relationship is causal. This pattern is likely to reflect parental effects as well as students’ background demographics and the contexts in which they were raised. For instance, wealthy parents and their children may vote more frequently than poorer parents and their children due to differences in material resources rather than socialization. Nonetheless, this relationship provides a baseline by which we can compare the influence of roommates’ newly formed relationships. By this standard, the association in roommate turnout is as strong as the association between students’ turnout and the turnout of their parents. Given the short-lived nature of the roommate relationships versus the long period of pre-college socialization, we view the magnitude of the relationship between roommates on students’ voter participation to be notable. The evidence suggests that peer-to-peer influence, even when developed over a relatively short period, is a powerful influence on the vote decisions of young people.
Placebo Tests: No Correlation in Roommates’ Parents’ Participation in Prior Years
To identify social influence, we must assume that the random assignment of roommates eliminated potential confounds. This assumption would be violated if an association existed between students and their roommates’ baseline predisposition to vote. To evaluate the potential for this threat, Table 4 summarizes three placebo tests (for example, Eggers, Tuñon and Dafoe Reference Eggers, Tuñon and Dafoe2024). Each test replaces the dyadic similarity measures from Figure 3 with alternative measures of dyadic similarity for which social influence should be impossible because it occurred prior to students’ 2016 arrival on campus. We focus on parents’ turnout histories since parental participation is a strong predictor of their children’s political participation, as shown in past work (Beck and Jennings Reference Beck and Jennings1982; Bhatti and Hansen Reference Bhatti and Hansen2012; Oskarsson et al. Reference Oskarsson, Ahlskog, Dawes and Lindgren2022) and in Figure 4, above.
Placebo Tests Showing the Dyadic Similarity of Students’ Parents, Prior to the Students Arriving on Campus in 2016

Note: The Observed Estimate column indicates the dyadic similarity in our sample of randomly assigned roommates. The Permutation Mean columns indicate the expected values under the null distributions. The p-value columns indicate the proportion of permutations in which the permutation value (that is, the expected value under the null) exceeds the observed estimate.
The first placebo test measures dyadic similarity using the proportion of dyads whose parents exhibited identical turnout status in 2012. That is, the proportion of dyads in which Student A’s parents’ turnout matched Student B’s parents’ turnout. The second placebo repeats this measure using turnout in the 2014 midterm elections. The third placebo measures dyadic similarity as the Pearson correlation coefficient between the turnout rates of Student A’s parents and Student B’s parents. As above, parents’ turnout rates are based on all midterm and presidential elections from 2008 to 2014. Together, these variables allow us to evaluate covariate balance by measuring the extent to which the assignment of roommates is associated with pre-existing characteristics of the students in the sample.
We again use permutation tests to compare the observed values of these variables to expected values under the null distributions. In this case, however, we expect no difference between the observed means and their corresponding null distributions. Since the students were assigned at random, the students could not influence one another prior to rooming together, nor could one student’s parents influence the other student’s parents. Therefore, the parents of roommates in our data should be no more alike than would be expected by chance. By contrast, a low p-value would indicate that students whose parents tend to participate were disproportionately assigned roommates whose parents also tend to participate. If this were true, the apparent social influence we observe could instead be an artefact arising from parental participation (or other variables that are correlated with parental participation, such as wealth).
Table 4 demonstrates that the parents of each member of a dyad were no more similar to each other than would arise by chance. For instance, the observed correlation in parents’ turnout was 0.01 – almost exactly equal to the mean of 0.0 predicted under the simple permutation distribution (p = 0.45) and less than the 0.06 correlation predicted by the constrained permutations (p = 0.81). The similarity between the observed values and the permutations suggests that our results are not confounded by a baseline similarity in roommates’ predisposition toward voting.
Examining Heterogeneous Effects by Gender
As noted earlier, recent work suggests that women may be more susceptible than men to social influence. To examine this possibility, Table 5 reports results from permutation tests after separating students of each gender.Footnote 17 In all three years, the observed dyadic similarity was greater for women than for men. In 2016, Table 5A shows that women were eight percentage points more similar to their roommates than expected under the null derived from the constrained permutations (p = 0.01). By contrast, the 53 per cent similarity for men is lower than the mean of 56 per cent for men expected under the null in the constrained permutations (p = 0.86). The effect was significantly larger for women than for men, as shown in Table 5B (p = 0.01).
Comparing Women and Men in Turnout Similarity between Roommates in the 2016, 2018 and 2020 Elections

Note: Panel A shows turnout in each year by gender. The Observed Estimate column shows the observed similarity for each variable. The Permutation Mean columns show the expected values under the null, and the p-values indicate the proportion of permutations in which the expected value exceeded the observed value. Panel B shows the difference between the genders for each of these statistics. The Mean Difference columns indicate the difference between (A) how much the observed statistic in Panel A differed from its expected value among women and (B) how much the observed statistic in Panel A differed from its expected value among men. Positive values indicate the difference was larger for women than for men. The p-values indicate the proportion of permutations in which the expected value of this difference exceeded the observed value.
In subsequent years, the gender gap in social influence narrowed. Among women, 60 per cent of observed dyads exhibited identical turnout in 2018. Among men, 59 per cent did so. Both values were about five points greater than expected under the null, indicating a similar effect for both women and men. These estimates have greater uncertainty than those in Figure 2, in which the genders are pooled. In 2020, the effects were again larger for women than for men in the sample, but again, the difference in the magnitude of these effects is not statistically significant.
When the three elections are summed, women had identical values of turnout as their roommates, an average of 1.95 times. Men exhibited identical turnout values only 1.68 times on average. The constrained p-value of 0.06 indicates that a gender difference this large occurred by chance in only 6 per cent of the constrained permutations. In sum, the results present evidence of heterogeneity by gender in the short term, but not in the longer term. Note, however, that the null results do not indicate evidence of a negligible effect. In particular, our within-gender estimates for the 2020 election are too underpowered to offer firm conclusions.
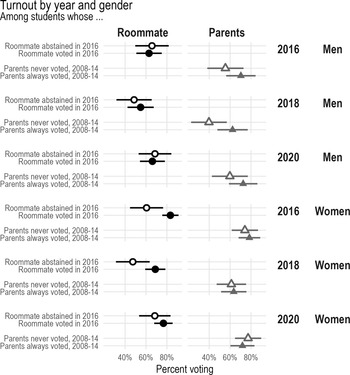
To put the magnitude of the gender gap in perspective, Figure 5 replicates the design of Figure 4, but separates the estimates for women and men. Recall that Figure 4 suggested that the effect of roommates was similar in magnitude to the difference in participation between students whose parents do not vote and students whose parents always vote. Figure 5 suggests that the similarity in these relationships arises from a gender asymmetry in which the gap based on roommates is larger for women than for men, while the gap based on parental turnout is larger for men than for women. The left column in Figure 5 shows the differences based on roommate participation. In this panel, the turnout gaps associated with the roommate’s participation tend to be larger for women than for men. As Table 5 above shows, this gender gap is statistically significant in 2016. The right column shows the estimates based on parental participation. In contrast to the left column, the turnout gaps associated with parental participation tend to be larger for men than for women. Together, these results suggest that men retain more of the socialization they received prior to arriving on campus, while women adapt to fit their new social environment. But this conclusion is only tentative because, unlike the roommate effects, the association between parents and children is not causally identified. Thus, future work must unpack the sources of the gender asymmetry that we observe.Footnote 18
Turnout Rates for Women and Men by Their Randomly Assigned Roommate’s Turnout in 2016 and Their Parents’ Turnout in Elections Held from 2008 to 2014.
Note: The open points show the percentage of students of a given gender who voted if their roommate abstained in 2016 (open circles) or if their parents did not vote in the 2008-2014 elections (open triangles). The closed points show the percentage of students who voted if their roommate voted in 2016 (closed circles) or if their parents voted in every election from 2008 to 2014 (closed triangles). The horizontal lines around each point indicate heteroskedasticity-robust 95 per cent confidence intervals.

Conclusion
In our study, we have shown evidence of social influence in the participation of randomly assigned college students. This evidence is most clear in 2016, the students’ first year on campus, and 2018, two years after the relationship began. We believe this study provides valuable contributions to the study of social influence generally and the study of education effects on political participation. The first contribution is methodological. By taking advantage of the natural experiment that occurs when colleges randomly assign students to be roommates, we reduce the selection bias that beset previous studies of interpersonal influence. Thus, the randomly assigned relationships we study are less susceptible to the confounds that arise when individuals choose with whom to have a relationship.
Second, our study shows that students’ decisions to participate in politics are affected by their roommates’ decisions to participate. This is especially notable because for most students in our sample, the 2016 election marked the first time they were eligible to vote. In their book, Making Young Voters, John B. Holbein and D. Sunshine Hillygus (Reference Holbein and Hillygus2020, 183) count the ability to manage interpersonal interactions among the noncognitive skills needed to ‘get young people started voting in the first place’. Our work further demonstrates that interpersonal interactions matter, but, admittedly, we still know very little about ‘who persuades whom’. For instance, our evidence also suggests that this interpersonal influence may be gender specific. In 2016, women were significantly influenced by their roommates’ decisions to vote, but men were not. In 2018, the effects were similar in size for both women and men. The specific mechanisms that underlie these gender differences are beyond the scope of this analysis, but they clearly warrant investigation. Future research is also required to understand the role that differences in economic and social status play in these relationships. It is plausible, for instance, that higher status individuals may signal the social desirability of voting to their lower status roommates. If this were to be the case, voting together may be less about persuasion than imitation.
Third, our evidence suggests that the effect of newly formed interpersonal relationships on political participation is far from fleeting. After roughly three months of knowing one another, randomly assigned roommates were significantly more likely to vote together than is expected by chance. Our evidence shows that the effect of this new peer relationship, established in the fall of 2016, persisted two years later, when the randomly assigned roommates continued to vote at roughly the same rate in the 2018 congressional midterms. Previous work suggests that voting may be habit forming (for example, Aldrich, Montgomery and Wood Reference Aldrich, Montgomery and Wood2011; Coppock and Green Reference Coppock and Green2015; Gerber, Green and Shachar Reference Gerber, Green and Shachar2003), whereby voting in one election strongly predicts voting in subsequent elections. Our evidence suggests some degree of persistence among the young voters in our study.Footnote 19 Indeed, the persistence of participation effects we find resembles that which Klofstad (Reference Klofstad2015) observed among college students in Wisconsin, bolstering his conclusions with both internal validity (by accounting for selection) and external validity (through a new sample in a different state and different elections). But it would be wrong to think ‘once a voter, always a voter’. Our evidence comports with that reported by Alexander Coppock and Donald P. Green (Reference Coppock and Green2015), who note that the degree of persistence in voting may vary by electoral context and the attributes of individual voters. In fact, Coppock and Green note that persistence in voting was strongest among those who are more residentially stable. Although we have no way to be sure, the residential instability of our students after their four years in college may play a role in breaking their newly formed habit of voting. Indeed, in one of the follow-ups to the Bennington College Study, Alwin, Cohen and Newcomb (Reference Alwin, Cohen and Newcomb1991, 65–66) note that one of the reasons that the liberal influence of college continued to be significant over the life course was that the many of the women in the study chose to live in more liberal communities post-graduation, whereas those who returned to their home communities were more likely to revert to their earlier political leanings.
A final contribution of our study is that, unlike previous roommate studies, our design allows us to examine the lasting influence of parents as their children enter a new social environment. For most new college students, the move to a college campus marks the first time they have left the parental home and the local communities in which they were raised, and the opinions and values that parents imparted on their children may not be shared and reaffirmed within a new college environment. Thus, for some, college presents a choice between the old mores of home and the new ways espoused by new friends. Our evidence indicates that students’ early political socialization within the family environment remains influential even as they develop new peer-to-peer social ties within the college setting, particularly among young men. First-year college students were significantly more likely to vote in the 2016 national elections if their parents were politically active in prior election years. Yet, remarkably, the magnitude of this family bond on students’ voting decisions does not outweigh the short-term influence of newly formed peer-to-peer relationships.
Supplementary material
The supplementary material for this article can be found at https://doi.org/10.1017/S0007123425100756.
Data availability statement
Replication data for this article can be found in Harvard Dataverse at: https://doi.org/10.7910/DVN/BBMZ1H.
Acknowledgements
We would like to thank Kelley Doll, Jeffrey Haines, Juan Irigoyen-Borunda, and David Macdonald of Florida State University for their research assistance and Sahar Abi-Hassan, Quintin Beazer, Bill Berry, Robert Bond, Bob Jackson, George Krause, Andrew Podob, Bang Quan Zheng and participants at FSU’s American Politics Workshop for comments on earlier drafts. We also thank Associate Vice Provost James Hunt and the staff of Florida State University’s Office of Institutional Research for their assistance in providing student data. All errors should be attributed to the authors alone.
Financial support
This research was supported by funding from the LeRoy Collins Institute at Florida State University, the Florida State University Department of Political Science and a Planning Grant from the Florida State University Council on Research and Creativity.
Competing interests
None.
Ethical standards
The research was conducted in accordance with the protocols approved by Florida State University’s Institutional Review Board on June 3, 2016 (HSC 2016.18277), April 17, 2018 (HSC 2018.23704) and September 22, 2019 (HSC 2019.27019)






 Open access

