


The global population is ageing rapidly. In this context, maintaining good mental and cognitive health in older age is a priority. Depressive and anxious disorders and dementia are among the most common causes of disability-adjusted life-years globally, according to the Global Burden of Disease Study 2021. Reference Ferrari, Santomauro, Aali, Abate, Abbafati and Abbastabar1 In Australia, anxiety disorders, depressive disorders and dementia are the third, fourth and fifth ranked causes of disability-adjusted life-years. 2 Social isolation and loneliness are known risk factors for depression, Reference Noguchi, Saito, Aida, Cable, Tsuji and Koyama3 anxiety, Reference Domenech-Abella, Mundo, Haro and Rubio-Valera4 cognitive decline and dementia, Reference Penninkilampi, Casey, Singh and Brodaty5 and are increasing globally, 6 as well as in Australia, for people aged 45–64. 2 Social engagement and social activities are associated with reduced risk of cognitive decline. Reference Samtani, Mahalingam, Lam, Lipnicki, Lima-Costa and Blay7,Reference Joshi, Hendrie, Jester, Dasarathy, Lavretsky and Ku8 It is hypothesised that social connections promote cognitive reserve via two pathways: bridging (social activities provide cognitive enrichment and promote neurogenesis) and bonding (social bonds reduce stress and help regulate neuroendocrine and Hypothalamic-Pituitary-Adrenal axis function). Reference Perry, McConnell, Coleman, Roth, Peng and Apostolova9 Thus, social connectedness and combating social isolation are strategies increasingly used to promote mental and cognitive health and maintain functional abilities. Reference Livingston, Huntley, Sommerlad, Ames, Ballard and Banerjee10 The extent to which social connections are genetically determined versus environmentally influenced, and therefore potentially amenable to intervention, remains unclear. Psychosocial, health and lifestyle factors influence healthy brain ageing and function differentially at different stages across the life course. Reference Fratiglioni, Marseglia and Dekhtyar11 Data from twin studies can be used to identify and differentiate the contribution of additive genetic effects and effects of both the common shared environment, mostly in early life and within the same family home and neighbourhood, and unique non-shared environment, experienced throughout life. Reference Sachdev, Lee, Wen, Ames, Batouli and Bowden12 Data from twin studies can also provide insight into the association between social connections factors and risk of depression, anxiety and dementia. Twin studies focused on different life stages report that aspects of social connections are heritable. Reference Fowler, Dawes and Christakis13,Reference Horwitz, Reynolds and Charles14 Active social connectedness, including visiting friends and attending parties, was found to be moderately heritable in adults 70 to 100 years of age and older but with little to no contribution from early shared environment and strong contributions from unique non-shared environments. Reference McGue and Christensen15 To our knowledge, no study has investigated the heritability of social connections factors in older age and their association with mental and cognitive healthy ageing.
Aims
We used data from the Older Australian Twins Study (OATS) to investigate whether people engaged in specific types of social connections in older age due in part to genetic factors, and whether engaging in specific types and combinations of social connection, or social connections factors, were associated with depression, anxiety and cognitive performance in older age. We hypothesised that social connections with friends and family outside of the home and with others in the community, would be heritable and associated with better mental and cognitive health, and that baseline social connections factors would be associated with change in mental and cognitive health over time.
Method
Study population
We analysed data from OATS. Reference Sachdev, Lee, Wen, Ames, Batouli and Bowden12,Reference Sachdev, Lammel, Trollor, Lee, Wright and Ames16 The study included people aged 65 and over who had the ability to consent, a consenting co-twin, the ability to complete neuropsychological assessments in English and had at least low average IQ. The sample consisted of 570 twins (161 monozygotic (MZ) and 124 dizygotic (DZ) pairs).
We analysed data from Wave 1/baseline (2006–2012; n = 570 twins, 56% MZ twins), Wave 2 (2009–2013; n = 449 twins, 57% MZ twins) and Wave 3 (2012–2016; n = 392 twins, 56% MZ twins).
Ethics approval
The authors assert that all procedures contributing to this work comply with the ethical standards of the relevant national and institutional committees on human experimentation and with the Helsinki Declaration of 1975, as revised in 2013. All procedures involving human subjects/patients were approved by the UNSW Sydney Human Research Ethics Committee (HC07001; HC12599; HC17414; HC220479). Written informed consent was obtained from all participants.
Social connections measures
The social connections items included in the OATS study are shown in Supplementary Table 2 available at https://doi.org/10.1192/bjp.2025.10505.
Mental health measures
Participants completed the Geriatric Depression Scale (GDS)-short version Reference Sheikh and Yesavage17 and the Goldberg Anxiety Scale (GAS). Reference Goldberg, Bridges, Duncan-Jones and Grayson18
Cognitive health measures
Participants completed neuropsychological subtests under the domains of attention (Att), memory (Mem), visuospatial function (Vispat), language (Lang) and executive function (Exec) at each assessment Reference Sachdev, Lammel, Trollor, Lee, Wright and Ames16 (Supplementary Table 3). Domain scores were formed from a composite comprising the average of the z-scores of the tests included in each domain, using the means and s.d. at Wave 1. These were then standardised by transforming to z-scores using the means and s.d. of the composites at baseline. Global cognition (Gcog) scores were obtained as the average of the domain scores and presented as z-scores using the means and s.d. of the averages at Wave 1. We examined the associations between social factors and specific domains of cognitive function in the current study.
Covariates
For models involving cognitive function, the relevant covariates were the APOE4 gene status, hearing loss, hypertension, diabetes, smoking, history of depression, body mass index (BMI), exercise and alcohol consumption. This accounted for 9 out of 12 modifiable risk factors for dementia as per the 2020 Dementia Lancet Commission, Reference Livingston, Huntley, Sommerlad, Ames, Ballard and Banerjee10 while data were not available for confirmed traumatic brain injury or air pollution. Untreated vision loss and high low-density lipoprotein (LDL) cholesterol, recently added in the 2024 update to the Lancet Commission, were not included in our analyses. Reference Livingston, Huntley, Liu, Costafreda, Selbæk and Alladi19
For depressive and anxiety symptoms, the relevant covariates were pain, hypertension, diabetes, smoking, history of depression, BMI, neuroticism, exercise and alcohol consumption. Mental health covariates were selected based on review evidence Reference Vink, Aartsen and Schoevers20,Reference Vyas and Okereke21 and data availability.
Statistical analyses
The social variables were dichotomised into binary variables because of low frequencies for some response categories (see Table 1). GDS and GAS scores were log-transformed to correct for skewness.
Sample descriptives for demographic variables and covariates

MZ, monozygotic; DZ, dizygotic; BMI, body mass index; FRNC, friend, neighbour and community interactions; FAMC, family interactions and childcare; RELG, religious groups and other caregiving; GDS, depressive symptoms measured using the Geriatric Depression Scale-short version; GAS, anxious symptoms measured using the Goldberg Anxiety Scale; Gcog, global cognition; Att, attention; Mem, memory; Lang, language; Vispat, visuospatial; Exec, executive function.
a. Highest response option (‘most of the time’) presented here. The p-values are for the tests of equality of parameters between MZ and DZ twins. Test of equality of proportions for binary variables, chi-square test of associations for multiple categorical variables and equality of means were done for continuous variables. All p-values obtained were based on 5000 permutations.
Bold values represent p < 0.05.
Exploratory Structural Equation Modelling (ESEM)
The ESEM method was conducted in Mplus (version 8.8 for Windows; Muthén & Muthén, Los Angeles, USA; www.statmodel.com) using weighted least squares mean and variance adjusted estimation and Geomin rotation with Theta parametrisation. Reference Asparouhov and Muthen22,Reference DiStefano and Morgan23 This method allows for the exploration of the number of underlying factors and permits items to load onto multiple factors. The factor scores were then saved for subsequent analyses.
Heritability and genetic correlations
The classical structural equation modelling (SEM) using twin data Reference Neale and Cardon24 was used to estimate heritability and genetic correlations. The heritability estimate for each of the variables was obtained using separate univariate SEM (see Supplementary Fig. 3). Two different multivariate models were fit to examine the relationship among the variables: (a) a model with six variables (the three factor scores: friends, neighbours and community (FRNC), family and childcare interactions (FAMC), religious groups and other caregiving (RELG) and Gcog, GDS and GAS); (b) a model with eleven variables (FRNC; FAMC; RELG; Att; Mem; Lang.; Vispat; Exec; Instrumental Activities of Daily Living; GDS and GAS). The first model allowed us to study the genetic overlap between social connections, global cognition and mental health symptoms. The latter model was identical, except that we investigated the genetic overlap between social connections, mental health and specific cognitive domains rather than global cognition.
For both univariate and multivariate analyses, the SEM with Cholesky decomposition of variance covariance matrix Reference Boker, Neale, Maes, Wilde, Spiegel and Brick25,Reference Neale, Hunter, Pritikin, Zahery, Brick and Kirkpatrick26 with three latent factors, additive genetic (A), common environmental (C) and unique environmental (E) components, known as the ACE model, was fit first, and compared with the restricted models with A and E components (AE), C and E components (CE) and with only the E component. Model parsimony was examined using the Akaike Information Criterion (AIC) and p values comparing the likelihoods between the models.
Apart from Cholesky decomposition, independent component (IND) and common pathway models (ComACE) Reference Rijsdijk and Sham27 were examined for the six variables SEM model. Model parsimony between Cholesky ACE and reduced models of IND and ComACE were also examined. The IND and ComACE models were not considered for the eleven variables model because these models were not better than the Cholesky ACE model for the analysis involving six variables and hence the genetic and environmental correlations among the eleven variables were obtained using the saturated Cholesky ACE model (Supplementary Figures 3–7).
Standardised residuals for the cognitive domains, depressive symptoms and anxiety symptoms adjusting for all the covariates (i.e. fully adjusted model) were used for the genetic analysis. We used R software (2024 for Windows; R Core Team, Austria, Vienna; https://cran.rstudio.com). All the twin genetic models were fit using the R statistical package OpenMx version 2.21.11. Reference Boker, Neale, Maes, Wilde, Spiegel and Brick25,Reference Neale, Hunter, Pritikin, Zahery, Brick and Kirkpatrick26 The s.e. and confidence intervals for the relevant parameters were obtained using 2000 bootstrap samples as implemented in OpenMx.
Cross-sectional and longitudinal analyses using linear mixed modelling (LMM)
Cross-sectional and longitudinal association of the three factor scores with cognitive domains, depressive symptoms and anxiety symptoms were assessed under LMM using the nlme R package. LMMs can account for missing data related to attrition. Random effects were used to account for the clustering of twin pairs. Partially and fully adjusted models with relevant covariates and the time-in-study as an additional covariate for longitudinal models were fit.
Examination of potential causal associations
Potential causal relationships between the factor scores and cognitive domains, depressive symptoms and anxiety symptoms were examined using the inference about causation from examination of familial confounding (ICE FALCON) models. This regression-based model accounts for the familial confounding using the co-twin data and enables us to infer potential causal association between a predictor and an outcome variable. Reference Li, Bui and Hopper28 It fits a series of three models to draw conclusion about causal association. Model 1 is the usual association model with the predictor and an outcome variable (within-person). Model 2 examines the relationship in cross-twin cross-trait, i.e. the outcome of an individual (within twin pairs) value is tested for its association with the predictor value of the co-twin. Significant association in this model can be inferred due to familial confounding factors. In Model 3, the reduction in the effect size (beta coefficient) of Model 2 is examined by conditioning on the within-person predictor. If the reduction of beta value in Model 3 is significant then potential causal association can be inferred. Reference Li, Bui and Hopper28 A detailed description and an illustration of ICE FALCON models is provided by López-Solà et al. Reference López-Solà, Fontenelle, Bui, Hopper, Pantelis and Yücel29
ICE FALCON can be implemented using the LME or generalised estimating equations (GEE). The test on the reduction of beta coefficient can be done using permutations. The geepack package in R was used to fit the ICE FALCON models using GEE with 1000 permutations to test the reduction in the familial confounding coefficient. As in genetic analysis, standardised residuals under a fully adjusted model were used for this analysis.
Results
Participant characteristics
The baseline sample of monozygotic (n = 320) and dizygotic twins (n = 250) (N = 570) had a mean age of 70.65 years (s.d. = 5.51), and mean education of 11.19 years (s.d. = 3.35 years) and included 374 females (65.6%), A STROBE checklist is provided (Supplementary Table 1). The descriptive statistics of demographic and covariate (Table 1) and social connections variables are shown (Supplementary Table 2). Participants were followed-up for an average of 6 years.
Factor structure of social connections
The ESEM method, integrating confirmatory and exploratory factor analysis, was used to determine the factor structure of the social connections’ indicators. The ESEM results (see Supplementary Table 3) indicated that there were three underlying dimensions of the social connections indicators: (a) interacting with friends, neighbours and community; (b) family interactions and childcare; and (c) involvement in religious groups and other caregiving (see Fig. 1 for factor loadings). The model fit was good: χ 2 = 31.428, d.f. = 18, p = 0.026, root mean square error of approximation 0.038 (95% CI: 0.013, 0.059), comparative fit index 0.972, Tucker-Lewis Index 0.931, standardised root mean squared residual 0.046.
Exploratory structural equation modelling of social connections indicators. Standardised factor loadings are presented.

Heritability and genetic correlations
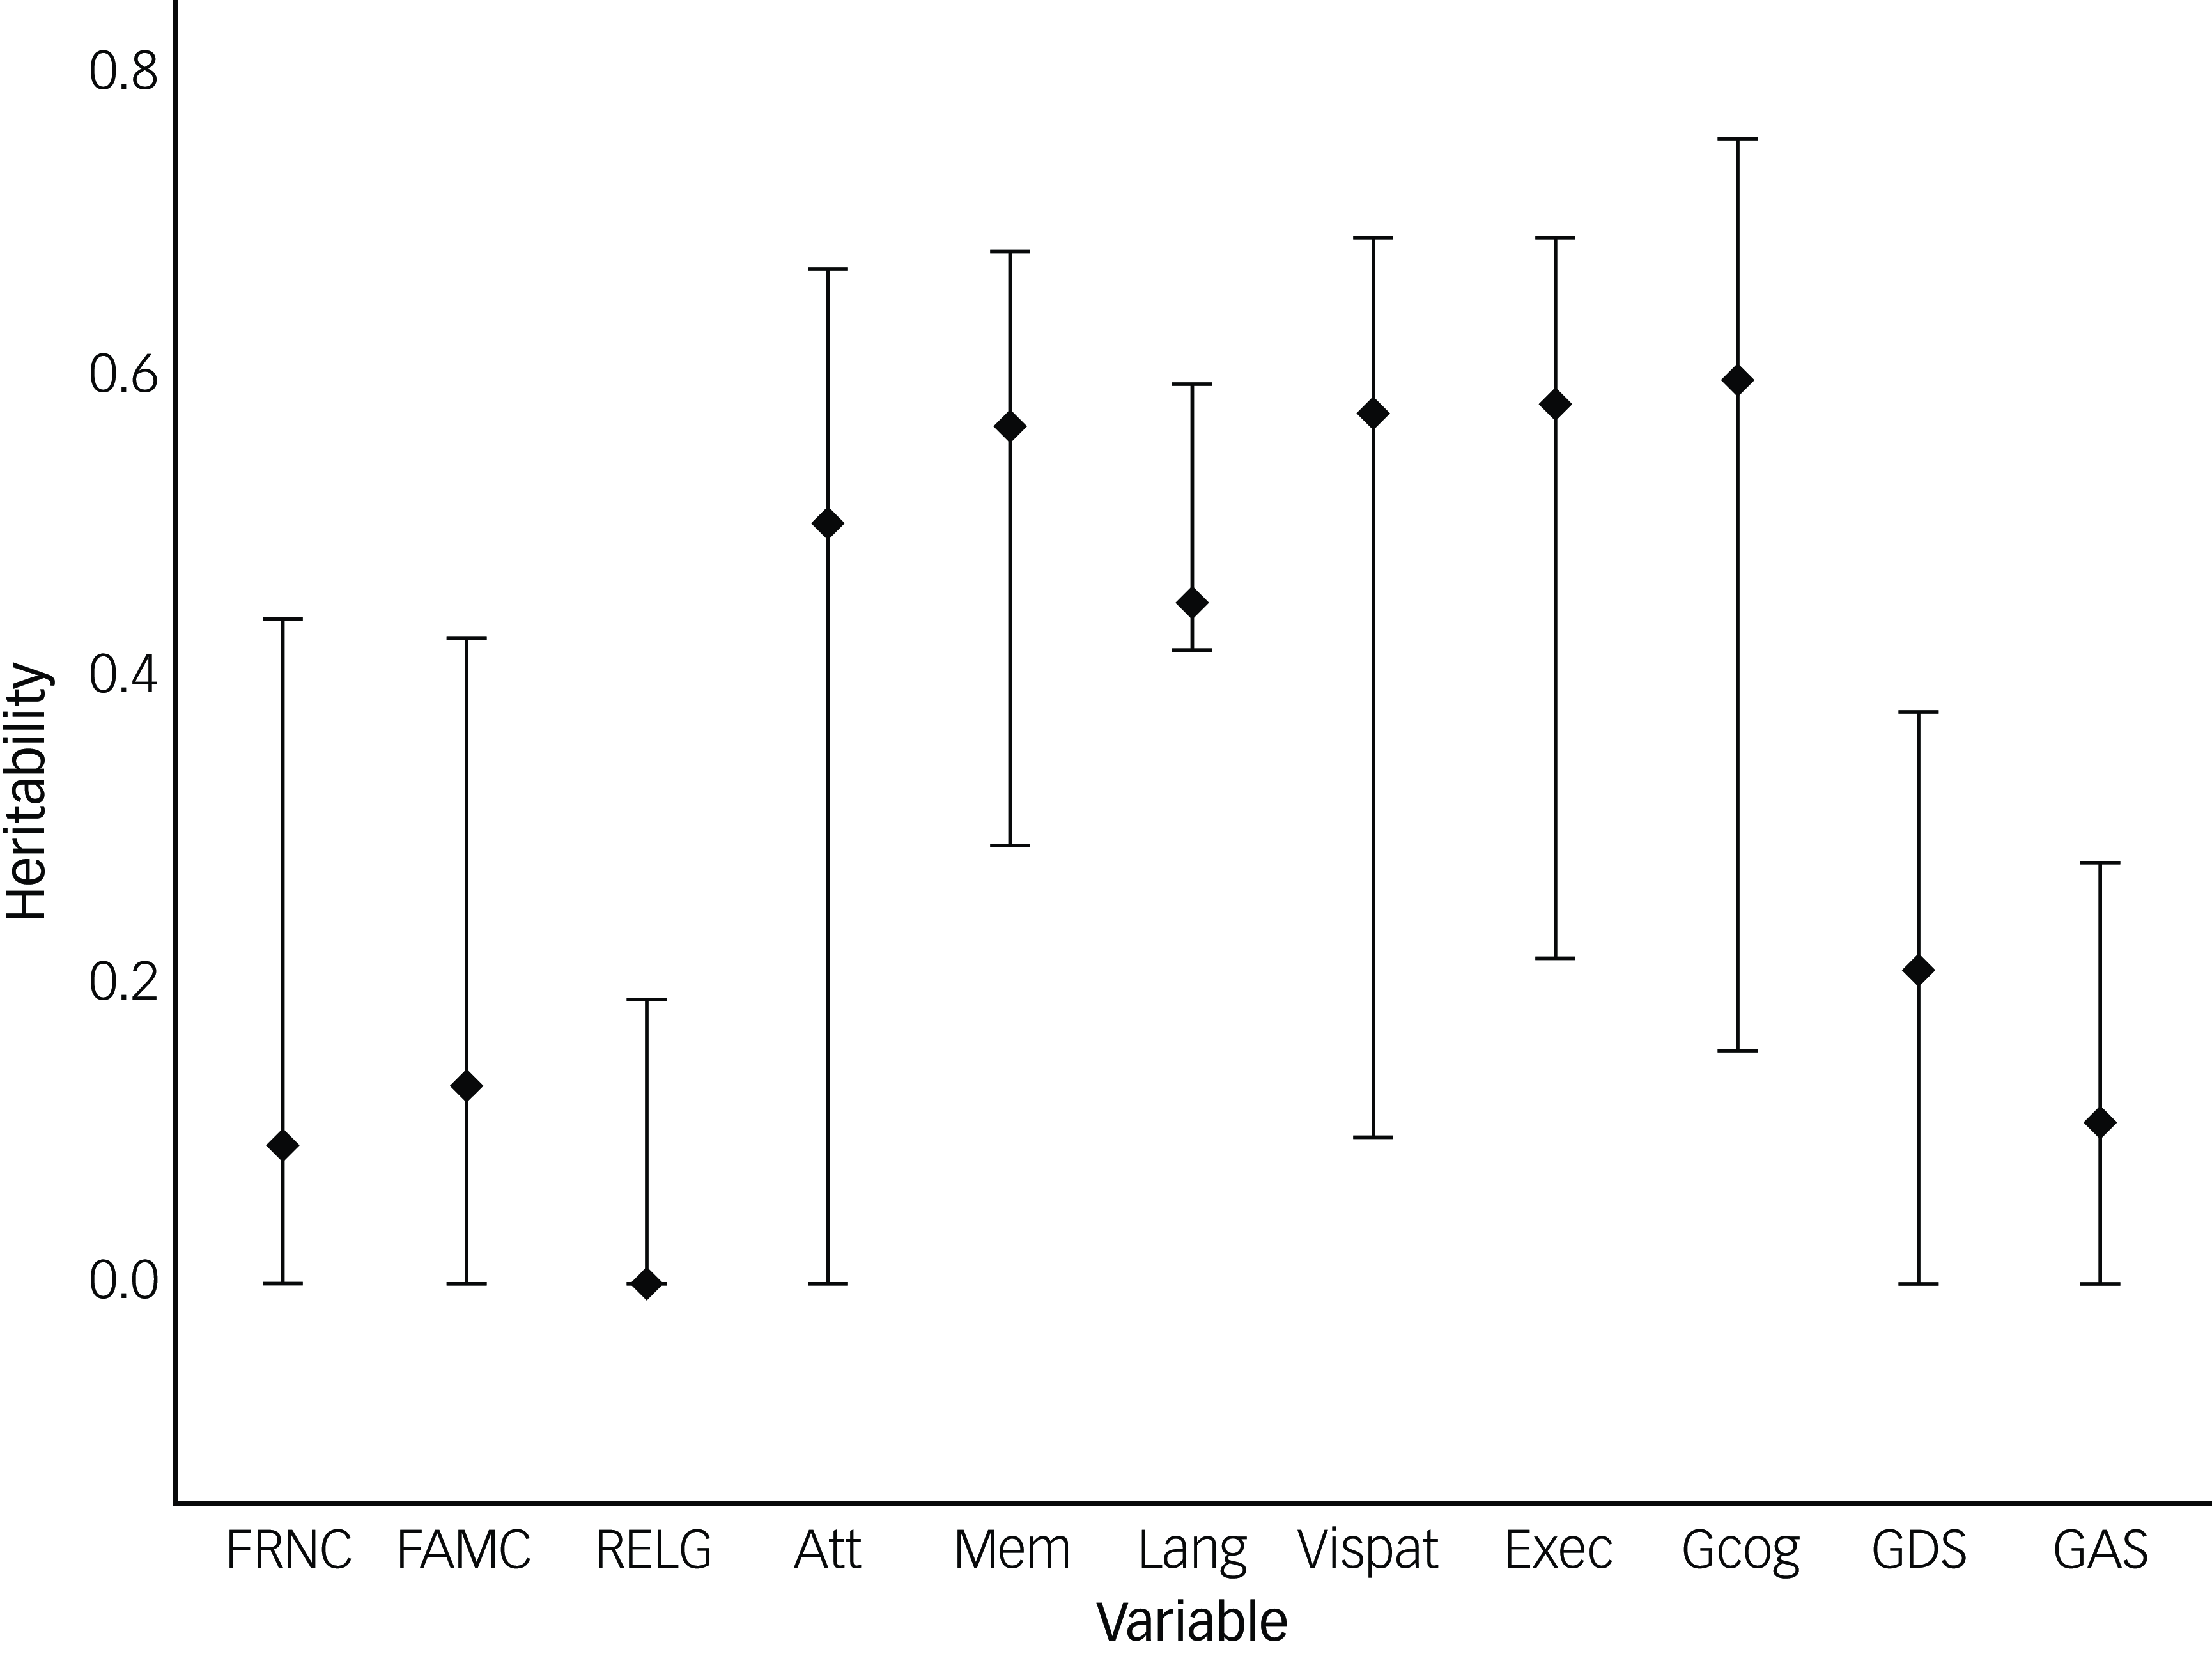
Heritability and genetic correlation estimates were obtained using univariate and multivariate ACE models (Method section ‘Heritability and genetic correlations’). The cognitive tests used to measure each cognitive domain and to derive Gcog scores are described in Supplementary Table 4. The univariate ACE model results, standardised path coefficients, correlation matrices and model fit summaries are presented in detail in Supplementary Tables 5−8 (including Gcog; ‘6 variables ACE model’; Supplementary Fig. 7) and Supplementary Tables 9–12 (including cognitive domains; ‘11 variables ACE model’). As shown in Fig, 2, weak heritability was found for each of the three social connections factors, while modest heritability was found for the mental health symptoms, and stronger heritability estimates were found for Gcog and cognitive domain scores.
Heritability of social connections factors, performance in cognitive domains and depressive and anxious symptoms. FRNC, friends, neighbours and community interactions; FAMC, family and childcare interactions; RELG, religious groups and other caregiving; Att, attention; Mem, memory; Lang, language; Vispat, visuospatial; Exec, executive function; Gcog, global cognition; GDS, depressive symptoms on the Geriatric Depression Scale-short version; GAS, anxious symptoms on the Goldberg Anxiety Scale. Extended vertical lines around heritability value (diamond) represents 95% confidence interval.

The standardised path coefficients based on the multivariate Cholesky ACE model with social connections factors, Gcog, depressive and anxious symptoms are presented in Supplementary Fig. 7.
As shown in Table 2 and in more detail in Supplementary Table 7, the genetic correlations between FRNC and FAMC (r = 0.74, 95% CI: −0.33, 0.97) were not statistically significant. Similarly, the genetic correlations between RELG and FAMC (r = 0.15, 95% CI: −0.99, 0.95) and FRNC (r = −0.16, 95% CI: −1.00, 0.68) were not statistically significant.
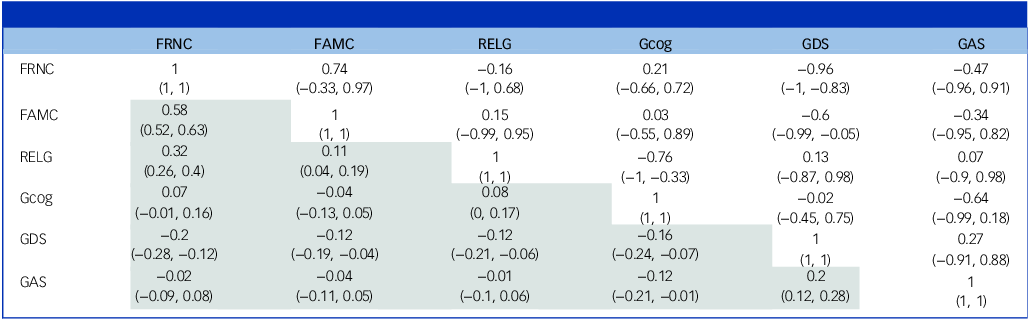
Genetic and phenotypic correlations between social connections, global cognition and depressive and anxious symptoms

FRNC, friend, neighbour and community interactions; FAMC, family interactions and childcare; RELG, religious groups and other caregiving; Gcog, global cognition; GDS, depressive symptoms measured using the Geriatric Depression Scale-short version; GAS, anxious symptoms measured using the Goldberg Anxiety Scale.
Values in brackets refer to confidence intervals. The upper right diagonal (not shaded) refers to genetic correlations, while the bottom left diagonal (shaded) refers to phenotypic correlations.
The genetic correlations for Gcog with FRNC (r = 0.21, 95% CI: −0.66, 0.72) and FAMC (r = 0.03, 95% CI: −0.55, 0.89) were not statistically significant. Interestingly, there was a strong negative genetic correlation between Gcog and RELG (r = −0.76, 95% CI: −1.00, −0.33).
The genetic correlations between depressive symptoms and FRNC (r = −0.96, 95% CI: −1.00, −0.83), and FAMC (r = −0.60, 95% CI: −0.99, −0.05) were strong and negative. The genetic correlation between depressive symptoms and RELG was not statistically significant. Similarly, the genetic correlations for anxious symptoms with all three social connections factors were not statistically significant.
The non-shared environment correlations between FRNC and FAMC (r = 0.5, 95% CI: 0.38, 0.57) were strong. There were strong positive shared environmental correlations for FRNC with FAMC (r = 0.84, 95% CI: 0.36, 1.00) and RELG (r = 0.71, 95% CI: 0.41, 1.00); and for FAMC with RELG (r = 0.69, 95% CI: 0.34, 1.00).
Model parsimony with IND and ComACE models were examined and best-fit was obtained for the Cholesky model (Supplementary Table 8). Supplementary Figures 3–6 show the Cholesky model, IND model and the ComACE model.
Cognitive domains model-genetic correlations
To examine the genetic correlations for each cognitive domain with social connections factors, we ran a separate model with each domain (see Supplementary Table 10). Confidence intervals were obtained using the bootstrap procedure (see Supplementary Text). Genetic correlations for cognitive domains with FRNC and also FAMC were not statistically significant. Interestingly, VISPAT function and RELG (r = −0.78, 95% CI: −0.99, −0.61) showed a negative genetic correlation.
The non-shared environment correlations for Exec with FRNC (r = −0.17, 95% CI: −0.27, −0.06) and with FAMC (r = −0.16, 95% CI: −0.29, −0.02) were negative. The non-shared environment correlation Exec with RELG (r = 0.13, 95% CI: 0.03, 0.28) was positive.
Cross-sectional associations of social connections factors with mental and cognitive health
Fully adjusted LMMs controlling for further risk factors of cognitive decline, including APOE4 gene status, hearing loss, hypertension, diabetes, smoking, history of depression, BMI, exercise and alcohol consumption were used to examine the associations of social connections with cognitive scores and depressive and anxious symptoms. Partially adjusted models controlling for age, sex and education were also examined (cross-sectional LMM results and fit indices are shown in Supplementary Table 12).
Having more interactions with friends, neighbours and community was associated with fewer depressive symptoms (B = −0.14, adjusted p = 0.004). Social connections factors were not associated with Gcog or cognitive domain scores.
Longitudinal associations of social connections with mental and cognitive health
Next, longitudinal LMMs were run (see Supplementary Table 13 for results and fit indices), which replicated the cross-sectional model results. In the fully adjusted models, having more interactions with friends, neighbours and community was associated with fewer depressive symptoms over time (B = −0.09, adjusted p = 0.006). Social connections factors were not associated with global cognition or cognitive domain scores.
ICE-FALCON
Longitudinal ICE FALCON analyses (Method section ‘Examination of potential causal associations’) were used to examine causality in the relationships between social connections, cognition, and depressive and anxious symptoms (see Supplementary Table 14).
Consistent with longitudinal analysis, the factor representing interactions with friends, neighbours and community was associated with depressive symptoms (p < 0.0018, accounting for 27 multiple tests) under Model 1 (association with within individuals) but this relationship is bidirectional. However, the cross-twin cross-trait correlations for these two factors were not significant, indicating weak familial factors (genetic and shared environmental factors). None of the other relationships examined under ICE FALCON models was found to be significant. Hence, ICE FALCON analysis did not provide any evidence for a causal association of the social connections factors with cognitive functioning and depressive and anxious symptoms.
Discussion
Main findings
Poor social connections are risk factors for depression and cognitive decline in older adults. We examined whether social connections factors were heritable and associated with cognitive performance and depressive and anxious symptoms over time.
The ESEM method revealed three types of social connections: interacting with friends, neighbours and community; family interactions and childcare; and involvement in religious groups and other caregiving unrelated to childcare. The weak heritability estimates for social connections factors from the current study align with previous findings that aspects of the structure and quality of social connections are partly heritable although others have reported somewhat stronger heritability. For example, findings from the ADD Health Study indicated that the specific social ability to attract more friends or the ability to introduce and bridge friendships to form more cohesive social networks were moderately heritable in adolescents. Reference Fowler, Dawes and Christakis13 In the Longitudinal Study of Aging Danish Twins (LSADT), social activity, including frequency of visits to friends, attending parties and engaging in hobbies, were moderately heritable (h 2 = 0.36), with little to no shared environmental effects (h 2 c = 0.00) and strong unique environmental effects (h 2 e = 0.64). Reference McGue and Christensen15
We also examined the heritability estimates for our outcome variables – depressive symptoms and anxious symptoms and cognitive scores. The heritability estimates for depressive and anxious symptoms here were lower than estimates reported previously. For instance, in the LSADT sample of adults aged 75+ at baseline, the heritability estimate for depressive symptoms was 50%. Reference McGue and Christensen15 The moderate heritability estimates for cognitive scores, however, aligned with previous research which found similar heritability estimates for cognitive domains in mid- and late life. Reference McGue and Christensen15
Genetic correlation analyses were used to determine whether the same genetic influences lead to better social, mental and cognitive health, or whether the overlaps are driven by genetic or environmental influences. These social connections factors did show an overlap in shared and unique environmental influences. The same genetic influences which were linked to more social connections were linked to fewer depressive symptoms. The strong negative genetic correlations of depressive symptoms with FRNC and with FAMC, indicated overlapping genetic influences. Our predictive models further revealed that baseline interactions with friends, neighbours and community were associated with fewer depressive symptoms cross-sectionally and longitudinally. We found that a 1 s.d. increase in FRNC were associated with a 0.14 and 0.09 decrease in depressive symptoms in the cross-sectional and longitudinal models, respectively. These changes in depressive symptoms are modest and may not be clinically significant. Our results echo the findings from the Midlife Development in the United States study in supporting the heritability of association between connections with friends and family and psychological distress, and that unique non-shared environmental factors influence this association. Reference Horwitz, Reynolds and Charles14 These outcomes align with the stress-buffering hypothesis, which suggests that social support reduces or mitigates the negative neuropsychological effects of stress. Reference Cohen and Wills30
The influence of genetic factors may also change over the lifespan due to genes turning on and off at different times in life. Reference Migliore and Coppedè31 For instance, the Netherlands Twin Register cohort results indicated that heritability for depressive and anxious symptoms was highest in childhood (50–70%) before dropping in adulthood (35–50%) and plateauing in later years. Reference Nivard, Dolan, Kendler, Kan, Willemsen and van Beijsterveldt32 A different pattern (lower influence in childhood and later adulthood, with a peak during adolescence and adulthood) was found for environmental influences. Reference Nivard, Dolan, Kendler, Kan, Willemsen and van Beijsterveldt32 This highlights the need to intervene during adolescence and adulthood, when environmental influences such as social isolation, school- and work-related stressors, bullying and unsupportive social relationships may have a larger effect on mental health. However, social relationships influence the link between stress and health in complicated, and at times counterintuitive, ways that transcend simple explanation based on positive and negative relationship factors. Reference Antonucci, Ajrouch and Birditt33
Not all environmental factors are modifiable. For instance, societal factors such as discrimination and lack of access to community spaces for activities may take a long time to change. These social determinants may need to be addressed at a cultural or population level rather than at the individual level. The contributions of economic status, healthcare availability, social cohesion and social support need to be considered. Reference Allen, Balfour, Bell and Marmot34
To understand the association between social connections and mental and cognitive health, we must also understand how social connections may develop and change over time. Social reserve, which refers to the availability of social ties that one can draw upon for activities, companionship or support, Reference Sachdev35 is a factor that determines one’s ability to socialise. Some social ties may be inherited, whereas other ties may be acquired over one’s lifetime including through schooling, work and engagement in other activities. Reference Sachdev35 Socio-emotional selectivity theory suggests that older adults, who may see their future as a limited resource, prioritise emotionally meaningful relationships and those that are integral to their own identity; whereas adolescents and young adults work to diversify and expand their social relationships in pursuit of knowledge and resources. Reference Carstensen, Isaacowitz and Charles36 The Convoy Model of ageing suggests that people accumulate social relationships that provide different levels of emotional closeness throughout their life. Reference Kahn, Antonucci, Baltes and Brim37 Meaningful relationships with family members and close friends feature reciprocity, shared history and experiences, and are typically more stable across the lifespan. Relationships with neighbours, co-workers and acquaintances in the community are typically less close, may lack reciprocity, are more vulnerable to situational factors, are changeable and thus these relationships decrease with age. Reference Antonucci, Ajrouch and Birditt33 The benefits of focusing on friendships and non-family relationships may depend in part on cultural factors, and prioritisation of these connections may be context-dependent. Reference Lu, Oh, Leahy and Chopik38
Partially and fully adjusted LMMs were used to investigate the link between social connections factors and cognitive function. In the fully adjusted models, social connections factors were not associated with change in cognitive function over time. These results align with findings in the LSDAT that social activity had no effect on change in cognitive measures, and only a modest effect on change in physical functioning, over the course of 10 years. Reference McGue and Christensen15 These results do, however, contrast with findings of meta-analyses which found that having good social connections reduced the risk of cognitive decline and dementia. Reference Penninkilampi, Casey, Singh and Brodaty5,Reference Samtani, Mahalingam, Lam, Lipnicki, Costa and Xiao39 This could be because the meta-analyses had greater power to detect the subtle slowing of the annual rate of cognitive decline than in the current study.
Strengths and limitations
The current study had several strengths. OATS data are longitudinal and include several hundred older adults. The availability of twin data allowed us to examine the heritability of social connections. Specifically, use of ICE FALCON causal inference models allowed us to disentangle the proportion of variance attributable to genetic versus non-genetic factors in the association between social connections and cognitive, functional and mental health outcomes. Reference Li, Bui and Hopper28 We controlled for several known modifiable risk factors for cognitive decline, functional impairment, and depression and anxiety.
The study had some limitations. Our sample only included older Australians, and the results may not generalise to other populations. We did not have data on social media use and the increased use of social media in recent years may also mean that older adults currently have more digital connections than when the study was conducted. The sample size was too limited to conduct genome-wide association studies. We did not control for some modifiable risk factors for dementia, such as traumatic brain injury, air pollution, untreated vision loss and high LDL cholesterol, Reference Livingston, Huntley, Liu, Costafreda, Selbæk and Alladi19 and the impact of these factors on outcomes in this study is unknown. It is important to note that different social connections might be relevant to prevent depressive and anxious disorders and cognitive decline in different world regions. Reference Samtani, Mahalingam, Lam, Lipnicki, Costa and Xiao39 We did not have data available on social connections functions (e.g. support) or quality (e.g. loneliness), thus restricting our analyses to social connections structure (interactions). Depression in later life may be influenced by multiple factors such as loneliness, life circumstances such as moving house or the death of close friends and family, physical and mental health and previous depressive episodes. While these factors were beyond the scope of the current study, future studies should explore additional variables in this complex association between depression and social connections. Future studies could also explore whether variables such as personality, learning experiences and family dynamics influence social connections among older adults, and in turn their mental and cognitive health. In light of social connections being weakly heritable, suggesting large environmental determinations, traits that are largely genetically determined may be less likely to be strong determinants of social connections. Personal relationships are complex and dynamic, and boundaries between friends, family and other relationship groups may be fluid. This level of relational detail is rarely captured in epidemiological data and is beyond the scope of this study.
Given that social connections are largely environmentally determined, they are potentially modifiable. The associations between interactions with FRNC and lower depressive symptoms, both cross-sectionally and longitudinally, in our study highlight the importance of promoting social interactions for older adults. It is important that clinicians ask about social connections to identify those at risk of social isolation. A person-centred and culturally-informed approach to the assessment may also include appropriately tailored questions about interactions with friends/family and community activities such as being involved in groups or volunteering. It can be helpful to provide information to patients/clients about the importance of social connections and the types of connections that promote healthy mental and cognitive ageing.
Implications
We found that social connections for older adults grouped into three domains: FRNC; FAMC; and RELG. The social connections showed weak heritability, implying that these are potentially modifiable. FRNC was associated with lower depressive symptoms cross-sectionally and longitudinally. Social connections did not predict anxious symptoms or cognitive decline in our sample. The results highlight the importance of identifying the genetic and environmental aspects of social relationships while promoting modifiability of social isolation and engagement as risk factors for depression among older adults.
Supplementary material
The supplementary material is available online at https://doi.org/10.1192/bjp.2025.10505
Data availability
Older Australian Twins Study (OATS) data is available for approved projects upon application to the Centre for Healthy Brain Ageing (CHeBA) Research Bank via email to CHeBAData@unsw.edu.au
Acknowledgements
We acknowledge the contribution of the OATS research team (https://www.unsw.edu.au/cheba/research-and-impact/research-projects/older-australian-twins-study-oats) to this study. We thank the participants for their time and generosity in contributing to this research.
Author contributions
S.S., B.C.P.L. and A.T. had full access to all the data in the study and take responsibility for the integrity of the data and the accuracy of the data analysis. S.S., A.-N.C. and H.B. designed the current study. P.S.S., H.B. and J.T. obtained funding for the cohort study from which we obtained data. S.S., A.T. and B.C.P.L. conducted the statistical analyses. S.S. and A.-N.C. performed the literature search and drafted the manuscript. P.S.S., H.B., V.S.C. and J.T. provided edits and feedback on the draft. All authors made a significant contribution to finalising the manuscript and approved the final version for publication.
Funding
This research was facilitated through access to Twins Research Australia, a national resource supported by a Centre of Research Excellence Grant (ID No. 1079102) from the National Health and Medical Research Council (NHMRC). The OATS study has been funded by an NHMRC and Australian Research Council Strategic Award Grant of the Ageing Well, Ageing Productively Program (ID No. 401162); NHMRC Project (seed) Grants (ID No. 1024224 and 1025243); NHMRC Project Grants (ID No. 1045325 and 1085606); and NHMRC Program Grants (ID No. 568969 and 1093083).
Declaration of interest
S.S. declares funding from the Dementia Australia Research Foundation, although not for the current manuscript. A.-N.C. reports no financial relationships with commercial interests. A.T. reports no financial relationships with commercial interests. B.C.P.L. reports no financial relationships with commercial interests. V.S.C. reports no financial relationships with commercial interests. J.T. reports no financial relationships with commercial interests. H.B. is or has been an advisory board member or consultant to Biogen, Eisai, Eli Lilly, Medicines Australia, Roche and Skin2Neuron. He is a Medical/Clinical Advisory Board member for Montefiore Homes and Cranbrook Care. P.S.S. has been on the Expert Advisory Panels for Biogen Australia and Roche Australia in 2021–22.
Transparency declaration
S.S. affirms that the manuscript is an honest, accurate and transparent account of the study being reported; that no important aspects of the study have been omitted; and that any discrepancies from the study as planned (and, if relevant, registered) have been explained.
Analytic code availability
The analytic code is available upon request from the corresponding author, S.S.
Research material availability
The materials supporting the findings are available upon request from the corresponding author, S.S.


 Open access
eLetters
No eLetters have been published for this article.