




Impact Statement
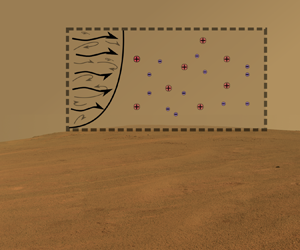
Martian dust storms share many qualitative similarities to terrestrial sandstorms. Electrically charged particles of different sizes are transported by turbulence, which results in charge separation and the generation of electric fields. Lightning is a common occurrence on Earth, yet has been shown to occur less frequently on Mars. The lower breakdown potential of the Martian atmosphere gives rise to a higher probability of discharge events without large-scale lightning. Using high-fidelity simulations of representative Martian and terrestrial planetary boundary layers, we show that the turbulent particle transport on Mars is impeded due to rarefied atmosphere. Mars shows a high occurrence of local dielectric breakdown but no large-scale lightning as observed on Earth.
1. Introduction
Storms and atmospheric winds are a common occurrence on any planetary body possessing an atmosphere. An elementary characteristic of such fluidic motion is the entrainment of surface particles, which collide at the mercy of boundary layer turbulence; this occurs on numerous planets, such as Mars, despite a much lower atmospheric pressure and density than on Earth (Reference Burr, Sutton, Emery, Nield, Kok, Smith and BridgesBurr et al., 2020). Although the physical mechanism driving the particle saltation is a subject of active research with many open questions (Reference Kok and RennoKok & Renno, 2006; Reference Kruss, Salzmann, Parteli, Jungmann, Teiser, Schönau and WurmKruss et al., 2021; Reference Pähtz, Clark, Valyrakis and DuránPähtz, Clark, Valyrakis, & Durán, 2020), the occurrence of dust clouds and storms on Mars is indubitable. On Mars, these dust storms represent thermodynamically important climatology events that modulate the circulation patterns through a substantial warming of the Martian atmosphere (Reference Bertrand, Wilson, Kahre, Urata and KlingBertrand, Wilson, Kahre, Urata, & Kling, 2020). The atmospheric dust particles also present a significant challenge to any space mission. For these reasons, Martian dust storms have and continue to receive much warranted scientific attention.
As these particles collide and interact close to the ground, triboelectric effects result in the particles becoming differentially charged (Reference Duff and LacksDuff & Lacks, 2008) – larger-sized particles become positively charged, while smaller-sized dust grains take on a negative charge. Reference Forward, Lacks and SankaranForward, Lacks, and Sankaran (2009) argue that as particles collide, the valence electrons of one particle move to a lower energy state on the second particle. Thus, in a collision, the larger particles lose electrons and become positively charged, whereas smaller particles acquire these electrons and become negatively charged. As these particles of different masses are differentially entrained by the atmospheric boundary layer turbulence, charge separation arises and results in the creation of large self-sustaining electric fields of over 100 kV m $^{-1}$ (Reference Kok and RennoKok & Renno, 2006). Locally, charge separation can also arise due to preferential clustering (Reference Di Renzo and UrzayDi Renzo & Urzay, 2018) – in both laboratory (Reference Cimarelli, Alatorre-Ibargüengoitia, Kueppers, Scheu and DingwellCimarelli, Alatorre-Ibargüengoitia, Kueppers, Scheu, & Dingwell, 2014) and field experiments (Reference Zhang and ZhouZhang & Zhou, 2020) – and orientation of non-spherical particles (Reference Lee, Waitukaitis, Miskin and JaegerLee, Waitukaitis, Miskin, & Jaeger, 2015; Reference Mallios, Daskalopoulou and AmiridisMallios, Daskalopoulou, & Amiridis, 2021; Reference Waitukaitis, Lee, Pierson, Forman and JaegerWaitukaitis, Lee, Pierson, Forman, & Jaeger, 2014).
The charge separation can be sufficiently strong to create dielectric breakdown events that can be observed as localised sparks or large-scale lightning. Lightning is a common occurrence on Earth in turbulent particle clouds resulting from volcanic eruptions or desert sandstorms (Reference Rahman, Cheng and SamtaneyRahman, Cheng, & Samtaney, 2021). Lightning has also been observed in Martian dust storms, although clear experimental evidence remains elusive (see Reference Izvekova, Popel and IzvekovIzvekova, Popel, and Izvekov (2022) and references therein). On Mars, the arid atmospheric conditions, the large-scale atmospheric winds, and the compositional (large iron oxide content (Reference Sobrado, Martín-Soler and Martín-GagoSobrado, Martín-Soler, & Martín-Gago, 2015)) make-up of these micrometre-sized particles are well suited to generate strong electric fields. The electric field and spark discharge events have been shown to alter the chemical composition of the Martian atmosphere (Reference Kok and RennoKok & Renno, 2009), while simultaneously hindering communication and damaging sensitive electronic equipment for spatial exploration missions (Reference Zhou, He and ZhengZhou, He, & Zheng, 2005). Spark discharge events arise when the charge separation reaches the ambient atmospheric breakdown potential (Reference Jackson and FarrellJackson & Farrell, 2006). The dielectric breakdown potential on Mars is around 20–25 kV m $^{-1}$, less than one per cent of Earth's breakdown potential (Reference Melnik and ParrotMelnik & Parrot, 1998; Reference Zhai, Cummer and FarrellZhai, Cummer, & Farrell, 2006). This suggests that electric discharge events may occur more readily on Mars, although some experimental work suggests that large-scale discharge events such as lightning may, in fact, be less frequent and not as strong as on Earth (Reference Wurm, Schmidt, Steinpilz, Boden and TeiserWurm, Schmidt, Steinpilz, Boden, & Teiser, 2019). In fact, Reference Anderson, Siemion, Barott, Bower, Delory, De Pater and WerthimerAnderson et al. (2011) reported no observable lightning events over a three-month observation window of Mars. This is despite the fact that triboelectrific spark discharges have been shown to readily occur using a dust simulant under representative Martian conditions (Reference Harper, Dufek and McDonaldHarper, Dufek, & McDonald, 2021).
Planetary boundary layer (PBL) turbulence, through the entrainment of the differentially charged particles, is the key to understanding the prevalence of large-scale lightning events in these particle-laden flows. Reference Rahman, Cheng and SamtaneyRahman et al. (2021) conducted large-eddy simulations (LES) of charged particle-laden turbulent layer of terrestrial sandstorms. They showed an overall drop in the electric field with elevation; findings that were supported by the results of Reference Zhang, Zheng and BoZhang, Zheng, and Bo (2014) and Reference Kok and RennoKok and Renno (2008). It should be noted that the altitude of a dust storm is primarily determined by the turbulent boundary layer, and thus represents a crucial parameter. Although the measured turbulence statistics and spectra of the PBL on Mars and Earth share many similarities (Reference Banfield, Spiga, Newman, Forget, Lemmon, Lorenz and BanerdtBanfield et al., 2020; Reference Chen, Lovejoy and MullerChen, Lovejoy, & Muller, 2016; Reference Temel, Senel, Spiga, Murdoch, Banfield and KaratekinTemel et al., 2022), the resulting Martian storms reach much higher altitudes than their terrestrial counterparts; these dust storms form cloud-like patterns similar to those on Earth (Reference Sánchez-Lavega, Erkoreka, Hernández-Bernal, del Río-Gaztelurrutia, García-Morales, Ordoñez-Etxeberría and MatzSánchez-Lavega et al., 2022). Also, the atmospheric turbulence responsible for the transport of dust particles is more heavily modulated by the stronger diurnal variations and radiative surface forcing on Mars; the transport of dust at very high altitudes is hypothesised to be governed by large-scale dust devils (Reference Izvekova and PopelIzvekova & Popel, 2017). It has even been suggested that dust particles can enhance the boundary layer turbulence on Mars due to convective effects (Reference SpigaSpiga, 2021; Reference Wu, Richardson, Zhang, Cui, Heavens, Lee and WitekWu et al., 2021). Therefore, the quantification of the breakdown events caused by terrestrial sandstorms cannot be directly extended to Martian storms – especially when considering the drastic differences in thermophysical properties and breakdown potential of both these atmospheres. Hence, even though the Martian atmosphere has been the subject of intensive research (Reference Harper, Dufek and McDonaldHarper et al., 2021; Reference Laurent, Tobias, Jens and GerhardLaurent, Tobias, Jens, & Gerhard, 2021; Reference Mallios, Daskalopoulou and AmiridisMallios et al., 2021; Reference WitzeWitze, 2021), there are some fundamental scientific questions that are still unanswered with respect to the role of turbulence on charge separation and discharge events.
On the basis of the above discussion, the objective of this work is to elucidate and quantify the role of turbulence on the large-scale electric field generation and discharge events in Martian dust storms in order to compare and contrast the findings from terrestrial sandstorms. Very few works have simulated representative Martian boundary layer flows (although we do note recent work by Reference Temel, Senel, Porchetta, Muñoz-Esparza, Mischna, Van Hoolst and KaratekinTemel et al. (2021) and Reference Wu, Richardson, Zhang, Cui, Heavens, Lee and WitekWu et al. (2021)) but, to the knowledge of the authors, no work has focused on the charged particle-laden PBL to understand the implications on charge separation. This work differs from Reference Di Renzo and UrzayDi Renzo and Urzay (2018), in that preferential concentration is not the dominant mechanism of charge separation, as was shown to be the case in forced isotropic turbulence. Here, the charge separation stems from the concentration differences in the wall normal direction, which can induce large-scale charge separation in PBL flows. Although the present canonical set-up avoids many of the specific challenges in the Martian PBL (radiative forcing, thermal stratification, particle transport due to dust devils, baroclinic vortices, etc.), it isolates the effects of turbulence on the transport of these charged particles at conditions that are relevant to Mars.
2. Methodology
We develop a mathematical model of electrified, particle-laden PBL to understand the role of turbulence in charge separation and, ultimately, dielectric breakdown at conditions that are relevant to the Martian atmosphere. Given the very large-scale separation in these PBL, wall-modelled large-eddy simulations (WMLES) of representative particle-laden turbulent atmospheric flow are conducted following the work of Reference Rahman, Cheng and SamtaneyRahman et al. (2021). The multiphase numerical framework is based on an Eulerian–Eulerian approach and solves the incompressible Navier–Stokes equations along with the conservation of equations for the charged particles.
Considering the present particle size (see table 1), the choice of an Eulerian approach for the dispersed phase might seem questionable (Reference Balachandar and EatonBalachandar & Eaton, 2010). Firstly, the employed WMLES coupled with a direct quadrature moment method (DQMOM) provides a robust framework for this analysis as the DQMOM method is known for handling particle-laden flows effectively. Secondly, figure 1 plots the representative time scales and length scales for varying mesh resolutions of our LES simulations. Due to the very large Reynolds number, it can be observed from the plot that most of the particles lie in the equilibrium–Eulerian range. Even though the equilibrium–Eulerian approach seems reasonable, the Eulerian approach is more conservative as it can take account of the electrostatic force. Guided from the plot and classifications of Reference Balachandar and EatonBalachandar and Eaton (2010) (provided in their figure 1), it is reasonable to adopt the Eulerian description of the approach for the particulate phase of the representative PBL. Hence, both carrier and dispersed phases are considered as a continuum occupying the same region in space.
Comparison of parameters for Martian and terrestrial environments. The references for each of our selected parameters are discussed in the text.

The plot comparing the typical simulation conditions of sandstorms for low Reynolds number ( $Re=10^8$) and high-resolution conditions ( $\xi /\eta = 10\,000$) with high Reynolds number ( $Re=2 \times 10^9$) and low resolution ( $\xi /\eta = 720\,000$) simulation parameters from Reference Balachandar and EatonBalachandar and Eaton (2010). Here $\xi$ is the smallest resolved scale.

The relative importance of the hydrodynamic forces in the particle-laden flows can be characterised by representative non-dimensional quantities. The most important is the Stokes number which relates the particle time scale ( $\tau _p={\rho _p d^2_p}/{18 \mu \rho _f}$) to the relevant turbulence time scale ( $\tau _f$) (Reference Crowe, Gore and TrouttCrowe, Gore, & Troutt, 1985):
 \begin{equation} St = \frac{\tau_p}{\tau_f}. \end{equation}
The fluid time scale,  $\tau _f$, is often taken as the local Kolmogorov time scale of the turbulence. In the above equation, subscripts $p$ and $f$ stand for particle and carrier fluid, respectively. While, $\rho$ and $\mu$ are the density and dynamic viscosity.
In this work, we utilise the physical characteristics of the terrestrial and Martian atmosphere and representative dust particles to develop phenomenological models to simulate dust storms in a PBL. The present particle model is predicated on the following assumptions: (a) collisions and triboelectric charging between particles occurs in a very thin layer close to the ground; (b) the small and large particles carry an opposite electric charge; and (c) these bidispersed, charged particles are entrained and preferentially distributed by the boundary layer turbulence. The turbulent transport of these particles results in a charge separation, and ultimately, dielectric breakdown events if the breakdown potential is reached. The particles are one-way coupled in momentum with the surrounding fluid (with particle mass loading ratio of less than 0.1 only the carrier fluid exerts a drag force on the particles), whereas the particles interact with each other via long-range Coulomb interactions. We note that other works also include short-range Coulomb interactions, which are not included herein (Reference Di Renzo and UrzayDi Renzo & Urzay, 2018; Reference Zhang, Cui and ZhengZhang, Cui, & Zheng, 2023).
The particle concentration is imposed as a Dirichlet boundary condition that is constant over time. The imposition of a constant Dirichlet boundary condition for the particle concentration serves as a practical approximation that simplifies the representation of real-world conditions. This approach is adopted due to practical constraints and the inherent characteristics of sand deposition processes. Firstly, in sandstorm simulations, the ground is typically considered a fixed and stationary surface that acts as a source or sink for sand particles. By imposing a constant particle concentration at the ground, the model assumes that the sediment source or sink remains relatively stable over time and does not vary significantly during the simulated period. This assumption is reasonable for sandstorm scenarios where the sediment source, such as a desert or a specific region, is not expected to undergo rapid and significant changes. By imposing a constant Dirichlet boundary condition for the particle concentration at the ground, the model assumes that the particle accumulation has reached a quasisteady state, where the concentration remains relatively constant over time. This assumption is reasonable because the deposition and resuspension processes in sandstorm flows occur over longer time scales compared with the temporal variations of the flow itself. Secondly, considering the practical limitations of data collection and measurements near the ground, it is often challenging to obtain accurate and continuous temporal profiles of particle concentration at the ground level in real-world sandstorm events. By imposing a constant Dirichlet boundary condition, the model provides a simplification that allows for a more tractable and computationally efficient representation of the sandstorm flow. This simplification reduces the complexity of the model and enables more practical and feasible simulations. Thirdly, the constant Dirichlet boundary condition simplifies the computational implementation and numerical stability of the sandstorm model. In numerical simulations, it is often beneficial to prescribe a fixed boundary condition that does not vary with time to ensure a well-posed problem and facilitate accurate and efficient calculations. It is worth noting that the constant Dirichlet boundary condition for the particle concentration at the ground is a simplifying assumption, and in reality, the concentration may exhibit spatial and temporal variations near the surface due to factors such as wind gusts, local topography and particle resuspension events. However, for the purpose of capturing the overall behaviour and essential characteristics of multiphase sandstorm flows, the constant boundary condition serves as a reasonable approximation. In summary, the imposition of a constant Dirichlet boundary condition for the particle concentration at the ground in the modelling of multiphase sandstorm flows is justified by the quasisteady state assumption of particle accumulation near the surface and the practical limitations of data collection. Although it simplifies the representation of the flow, it provides a reasonable approximation for capturing the essential features of sand deposition processes in sandstorm simulations.
2.1 Characteristics of terrestrial and Martian PBL
Before presenting the modelling aspects, it is important to understand the characteristics of PBL on both planets, which are discussed below.
2.1.1 Terrestrial PBL
During dust storms on Earth, the PBLs can exhibit a wide range of scales depending on various factors such as the intensity of the dust storm, the local atmospheric conditions and the topography of the region. However, it is possible to provide a typical range for streamwise velocity and turbulence intensity based on International Standard Atmosphere (ISA) conditions (with standard temperature as  $15\,^{\circ }$C, standard pressure is 1 atm, and without humidity) having dynamic viscosity ( $\mu$) of $1.88 \times 10^{-5}$ Pa s, the kinematic viscosity of air ( $\nu$) of $1.5 \times 10^{-5}$ m $^2$ s $^{-1}$ and density of air as 1.25 kg m $^{-3}$.
In the PBL during dust storms on Earth, the streamwise velocity can vary significantly depending on the local conditions. However, based on measurements and simulations, typical values of streamwise velocity in neutrally stable terrestrial PBL during a dust storm can range from a few to tens of metres per second. We have considered wind speeds of 15 m s $^{-1}$ and the turbulent boundary layer of 1 km, as in the works of Reference Calaf, Meneveau and MeyersCalaf, Meneveau, and Meyers (2010).
Turbulence intensity refers to the fluctuation of wind velocity in the PBL. During dust storms, the turbulence intensity can increase due to the presence of strong winds and turbulent mixing. While turbulence intensity can vary depending on the specific conditions, studies have reported turbulence intensities ranging roughly from 10 % to 40 % during dust storms close to the Earth's surface (Reference Kaimal and FinniganKaimal & Finnigan, 1994).
2.1.2 Martian PBL
On Mars, dust storms can have a significant impact on the Martian PBL, which behaves differently from Earth's PBL due to the differences in atmospheric conditions and terrain. Mars has a much thinner atmosphere compared with Earth, with a density ( $\rho _f$) of $1.6 \times 10^{-2}$ kg m $^{-3}$, resulting in lower wind speeds. However, during dust storms on Mars, the streamwise velocity can increase significantly. Typical streamwise velocities during Martian dust storms can range from a few metres per second to approximately 20 m s $^{-1}$; we opted to use 13.5 m s $^{-1}$ as the free stream velocity. We have considered an atmospheric boundary layer height of 6 km, as in Reference Haberle, Clancy, Forget, Smith and ZurekHaberle, Clancy, Forget, Smith, and Zurek (2017).
Due to the lower density on Mars, turbulence intensity is generally lower compared with Earth because of the lower Reynolds number. However, during dust storms, turbulence intensity can still increase due to turbulent mixing and the interaction of the dust particles with the atmosphere. Turbulence kinetic energy in the Martian PBL can take a wide range of values (Reference Wu, Richardson, Zhang, Cui, Heavens, Lee and WitekWu et al., 2021).
2.2 Modelling dust storms
Considering the discussion above, neutrally stable simulations are run at representative conditions of the Martian and terrestrial PBL based on the characteristics found in the literature, as discussed here and summarised in table 1. For all the simulation cases reported here, we fix the free stream velocity on Mars (Earth) to  $U_{\infty }=13.5$ m s $^{-1}$ ( $15$ m s $^{-1}$) and a boundary layer height of $\delta =6000$ m (1000 m) (Reference Calaf, Meneveau and MeyersCalaf et al., 2010). The kinematic viscosity of atmospheric gas is selected as $8.1 \times 10^{-4}$ m $^{2}$ s $^{-1}$ ( $1.5\times 10^{-5}$ m $^{2}$ s $^{-1}$) (Reference Haberle, Clancy, Forget, Smith and ZurekHaberle et al., 2017). The atmospheric pressure on Mars is set to 6.9 mbar which is close to the measured atmospheric pressure in a number of studies (Reference Haberle, Clancy, Forget, Smith and ZurekHaberle et al., 2017). The corresponding Reynolds number based on the boundary layer thickness is $Re_{\delta }=10^{8}$ ( ${=}10^{9}$). Given the incompressible nature of the simulations, the primary difference between the terrestrial and Martian PBLs herein lies in the inner wall and outer wall scaling relations and Reynolds number, as well as the drag force on the particle (due to the lower viscosity and density). We sample the distribution of the particle number density function at two points ( $\mathcal {S}=2$), in other words, two different particle sizes are considered: $d_1=200\,\mathrm {\mu }$m ( $d_1=200\,\mathrm {\mu }$m) with negative charge and $d_2 = 600\,\mathrm {\mu }$m ( $d_2 = 500\,\mathrm {\mu }$m) with positive charge. Although fine dust represents a significant portion of the solid phase transport in these particle-laden PBLs, the larger-sized particles contribute more readily to the charge separation and thus are considered here. The selected particles represent a reasonable choice given the wide particle size distribution found on both planets. The particles have a density of $3200$ kg m $^{-3}$ ( $2650$ kg m $^{-3}$). The representative (ideal) electric charge of the species of each size is $Q_1\equiv (q_{1},q_{2})=(-4\times 10^{-15}\,\mathrm {C}, 2.24\times 10^{-15}\,\mathrm {C})$; the same electric charge is used in both PBL and the values are identical to the work of Reference Rahman, Cheng and SamtaneyRahman et al. (2021). A typical concentration (Reference Liu and DongLiu & Dong, 2004) at the bottom of the suspension (top of saltation, $O$(1 m)) is defined by the baseline concentration of $\mathcal {N}_{{baseline}}=({n}_{b1},{n}_{b2}) = (2 \times 10^{7}\,{\rm m}^{-3}, 3.4\times 10^{6}\,{\rm m}^{-3})$. Four cases are considered in which the virtual wall boundary condition, $\mathcal {N}_w$, is varied from $\mathcal {N}_1=\mathcal {N}_{{baseline}}$ (corresponding to a weak storm, and the baseline case) to $40 \mathcal {N}_1$ (corresponding to a very strong storm). The term, $\mathcal {N}_w$, represents the concentration of particles at the bottom of the simulation domain (suspension). The cases are labelled as Case I ( $\mathcal {N}_w=\mathcal {N}_1=\mathcal {N}_{{baseline}}$, ‘weak’); Case II ( $\mathcal {N}_w=4\mathcal {N}_1$, ‘moderate’); Case III ( $\mathcal {N}_w=10\mathcal {N}_1$, ‘strong’); Case IV ( $\mathcal {N}_w=40\mathcal {N}_1$, ‘very strong’). The number density is chosen to be non-dimensionalised based on its boundary condition ( $n_{ws}$). Thus, the dimensional number density at any location is given as $\tilde {n}_s n_{ws}$, where $s=1$ or $s=2$ in our cases with $\mathcal {N}_w$ as $\mathcal {N}_w=(n_{w1},n_{w2})$. It is important to note that we characterise the relative storm intensity by uniquely modifying the particle loading and not the characteristics of the PBL flow, as such we maintain the same turbulence intensity, free stream velocity and Reynolds number for all cases on Earth and Mars. The rational is to conduct a more meaningful comparison, while acknowledging that the primary difference among the storms of various strengths lies in the particle-loading and not in the hydrodynamic aspect of the PBL.
Considering the particle of sizes  $d_1=0.2$ and $d_2 = 0.6$ mm (0.2, 0.5 mm), the density of particles as $\rho _s=3200$ kg m $^{-3}$ (2650 kg m $^{-3}$) and viscosity of atmosphere as $\nu = 8.1 \times 10^{-4}$ m $^2$ s $^{-1}$ ( $1.48\times 10^{-5}$ m $^2$ s $^{-1}$). The corresponding particle response time is $\tau _{p1}=0.55$ and $\tau _{p2} =4.94$ s (0.32, 2 s). The Stokes number (Reference CroweCrowe, 2005; Reference LothLoth, 2010) of the particles in such flow is $St_1= 0.0012$ and $St_2= 0.01$ ( $0.005, 0.03$) considering (2.1). The corresponding subgrid-scale (SGS) Stokes number (Reference Park, Bassenne, Urzay and MoinPark, Bassenne, Urzay, & Moin, 2017) of the particles in the LES grid of smallest resolved scale of $\xi /\eta =1.04\times 10^4$ ( $5.86\times 10^4$) is $St_{\xi 1}= 2.6\times 10^{-6}$ and $St_{\xi 2}= 2.32\times 10^{-5}$ ( $3.2\times 10^{-6}, 2 \times 10^{-5}$). It is worth noting that Stokes number only accounts for drag effects and does not consider the characteristic electrostatic time scale. However, this modelling approach remains suitable for our selection of the large, bidispersed particles used in the present study because of low Stokes numbers. We selected particles that are sufficiently large to sustain an electric charge and that can be transported via boundary layer turbulence. Although there is a sensitivity to the selection of the particle size, we do not believe that the results would be significantly altered with a different pair of bidispersed particle sizes.
2.3 Physical set-up
To isolate the role of turbulence in charge separation, a canonical turbulent open channel flow is considered to be representative of a PBL. To understand the role of large-scale turbulent motion on the charge separation, LES are run until they reach a statistically steady state. The computational domain is depicted schematically in figure 2. The characteristic dimension of the simulation is taken as the height of the boundary layer,  $\delta$. The simulation domain for Mars (Earth) is $x=32\delta$, $y=8\delta$ and $z=\delta$, with $640$ ( $768$), $192$ ( $192$) and $96$ ( $96$) grid points in the $x$,
$x$,  $y$ and $z$ directions, respectively. The simulation domain in the wall-normal direction was truncated and replaced by a virtual wall within the log-layer, in order to model the near-ground particle dynamics. This drastically reduces the computational cost and enables the consideration of the relevant Reynolds number effects. A friction velocity estimate at 0.31 m s $^{-1}$ (0.3 m s $^{-1}$) gives a friction velocity Reynolds number of $Re_\tau =2\times 10^6$ ( $Re_\tau =2\times 10^7$), table 2. Our choice of a friction velocity ( ${u}_{\tau } \approx 0.3$ m s $^{-1}$) in our simulations, while lower than the threshold value (1.5 m s $^{-1}$) reported by Reference Kok, Parteli, Michaels and KaramKok, Parteli, Michaels, and Karam (2012), is motivated by several factors. These factors include the saltation layer not being included in the scope of our study, as well as certain limitations and simplifications inherent to our virtual-wall modelling approach. Furthermore, this friction velocity allowed us to compare a diverse set of solid boundary conditions for Mars and Earth within our framework. The characteristic grid spacing, in viscous wall units, are $\Delta x^{+}= 38.4\times 10^4$ ( $16\times 10^5$), $\Delta y^{+}=32\times 10^4$ ( $16\times 10^5$) and $\Delta z^{+}=\xi ^+={7.7}\times 10^4$ ( $4\times 10^5$). The virtual wall height $\epsilon$ is at $z_{\epsilon } = 11.25$ m (1.872 m) and in terms of viscous wall units is $z^+_{\epsilon }=1.39\times 10^4$ ( $1.5\times 10^4$).
Schematic of the simulation domain. The virtual wall provides the boundary flux of charged sand particles into the turbulent flow. The atmospheric flow is simulated as an open-channel flow with the lower boundary of the simulation domain being a virtual wall and the domain is doubly periodic.

Summary of the simulation parameters for charged particle LES of a Martian dust storm.

2.4 Governing equations
This work uses the same LES framework described in Reference Rahman, Cheng and SamtaneyRahman et al. (2021), which solves the filtered incompressible Navier–Stokes equations in the continuum phase along with an Eulerian particle transport equation with DQMOM. The equations are non-dimensionalised by the free stream velocity ( $U_f= {U}_{\infty }$) and the boundary layer thickness ( $L_f= \delta$). The generic equations for the fluid motion are
 $$\begin{gather} \frac{\partial \tilde{u}_i }{{\partial x_i}} = 0, \end{gather}$$
 $$\begin{gather}\frac{\partial \tilde{u}_i}{\partial t} + \frac{\partial \tilde{u}_i \tilde{u}_j}{\partial x_j} = \frac{1}{ Re} \frac{\partial^2 \tilde{u}_i }{{\partial x_j^2}} - \frac{\partial \tilde{p} }{{\partial x_i}}- \frac{\partial T_{ij} }{{\partial x_j}} + f(t) \delta_{i1}, \end{gather}$$
where  $\tilde {u}_i$ is the filtered non-dimensional fluid velocity, $\tilde {{p}}$ is the non-dimensional pressure and ${ T}_{ij} = \widetilde {{ u} { u}} - \tilde { u}\tilde { u}$ is the subgrid stress tensor. The LES employs stretched spiral vortex SGS model and a virtual wall model similar to the previous work by Reference Rahman and SamtaneyRahman and Samtaney (2017). A source term, $f(t)$, corresponds to a time-varying body force throughout the domain which maintains a constant mass flow in streamwise direction.
Note that we neglected the gravitational acceleration in this study despite the large particle size. Although this deliberate choice could affect the final distribution of the particles, we opted to make this assumption to focus uniquely on the turbulence-driven nature of the charge separation in the PBLs. In order to assess the relative importance of the gravitational force, we can define the magnitude of the Kolmogorov acceleration as  $a_k=\epsilon ^{2/3}/ \eta ^{1/3}$, where the dissipation rate is tied to $\epsilon \approx U^3/L$ and the Kolmogorov length scale is approximately: $\eta \approx L/Re^{3/4}$. If we consider the free stream velocity and boundary layer height as the characteristic velocity and length scale, we can estimate the Kolmogorov acceleration. Generally it is accepted that if the Kolmogorov acceleration is large relative to the gravitational acceleration, the flow is turbulence dominated and gravitational effects can be neglected. On Earth, gravity can reasonably be neglected ( $a_k=40.3$ m s $^{-2}$, $g=9.81$ m s $^{-2}$) as done in Reference Rahman, Cheng and SamtaneyRahman et al. (2021); on Mars, this assumption breaks down ( $a_k=3.04$ m s $^{-2}$, $g=3.72$ m s $^{-2}$) and gravitational settling should not, in a representative case, be neglected. To maintain our focus on turbulence-driven charge separation in the boundary layer, we opted to neglect the gravitational contribution in both the terrestrial and Martian PBLs. This assumption is further justified by the fact that in a realistic Martian PBL, gravitational settling would be counterbalanced by other forces such as buoyant thermal convection in the atmosphere (Reference SpigaSpiga, 2021; Reference Wu, Richardson, Zhang, Cui, Heavens, Lee and WitekWu et al., 2021), which we have not modelled to maintain a reasonable comparison of both PBLs.
The Eulerian form of the particle phase conservation equations, shown in (2.4) and (2.7), are similarly non-dimensionalised. We assume that all particle collisions and resulting triboelectric charging, occurs near the wall, hence these effects are modelled as part of the virtual wall. Outside the virtual wall, in other words, inside our computational domain, we consider the particles to be collisionless. The particle transport equation includes the electrostatic Poisson equation in addition to the one-way momentum exchange. The equation set for the particle transport in an Eulerian framework is
 $$\begin{gather} \frac{\partial \tilde{v}_{Si}}{\partial t} + \tilde{v}_{Sj} \frac{\partial \tilde{v}_{Si} }{\partial x_j} = \tilde{\mathcal{D}}_{{S}i} + \in_{Si}, \end{gather}$$
 $$\begin{gather}\tilde{\mathcal{D} }_{{S}i} = \frac{ \rho_f}{\rho_s} \frac{18\nu L_f}{d_s^2 U_f} \left( 1 + 0.15Re_{S}^{0.687} \right)(\tilde{u}_i-\tilde{v}_{Si}), \end{gather}$$
 $$\begin{gather}\in_{S i} \,= \frac{\partial \varPhi_{{S}} }{\partial x_i},\quad \frac{\partial^2 \varPhi_{S}}{\partial x_i^2 } = {-} \frac{L_f^2}{U^2_{f}} \frac{\sigma_s}{\rho_s} \frac{\varSigma}{\varepsilon},\quad \varSigma = \sum_{s = 1}^{s = s_n} {{n}}_{{{ws}}} {\tilde{n}_{S}} {q}_{{s}}, \end{gather}$$
 $$\begin{gather}\frac{{\partial {\tilde{n}_{S}}}}{{\partial t}} + \frac{ \partial ({ \tilde{n}_{S}} \tilde{v}_{Si})}{ {{\partial x_i}}} = 0. \end{gather}$$
Here,  $\tilde {v}_{Si}$ corresponds to the average particle velocity of species $s$. Also, ${\sigma_{s}}$ is the dimensional charge density ( ${\sigma_{s}}= q_s/(\pi d_s^3/6)=q_s \rho_s/m_s$) of the particles species s. Here, $\tilde {\mathcal {D} }_{{S}}$, ${\in }_{{S}}$ and $\varPhi _{{S}}$ represent the drag force term (Stokes drag), the electrostatic force term and the electric potential of particles, respectively. The drag force is a momentum exchange term in the particle equation that accounts for the one-way coupling from the atmospheric flow. The Reynolds number of the particle is defined as $Re_{S}=| {\tilde {u}}-{\tilde {v}_{S}}|{U}_{f} d_{s}/\nu$. The dimensional electric field at any location is given as
 \begin{equation} {E}_i = {-} {\rho_s {{U}_{f}^2}} \in_{S i} / {({{{\sigma}_{{s}}} {L_f}})}. \end{equation}
The dimensionless electric potential is defined from its non-dimensional parameter as
 \begin{equation} \phi = {{U}_{f}^2} \varPhi_{{S}} \rho_s /\sigma_s. \end{equation}
The above governing equations are implemented in the solver and computed throughout the computational domain.
2.5 Numerical methods
We adopt the numerical algorithms based on a staggered grid with the pressure and number density of the particles located at the cell centre. The velocity components ( $\tilde {u}_i$ and $\tilde {v}_{Si}$) are defined at the face centres of the mesh in the usual manner. For the particle phase, the DQMOM is chosen in which the weights and abscissas of the quadrature approximation are tracked directly rather than the moments themselves. The numerical method in this framework is based on a fractional-step algorithm with an energy-conservative, fourth-order finite-difference scheme on a staggered mesh; the skew-symmetric form of spatial discretisation is used to minimise the aliasing errors. We adopt the third-order Runge–Kutta time integration to advance the governing equations. We can classify the fluid equations into linear and nonlinear operators, as done in Reference Spalart, Moser and RogersSpalart, Moser, and Rogers (1991). Further, following the LU decomposition notation of Reference PerotPerot (1993), we arrive at the intermediate velocity Helmholtz equation, pressure Poisson equation and velocity correction equation. Similarly, for the particle phase, third-order accuracy can be achieved by using three substeps in the time advancement.
3. Results
3.1 Characteristics of the turbulent flow
Prior to simulating flows with the charged, particle-laden motion, we first evaluate the SGS model in a WMLES context. We recall that we model the atmospheric boundary layer as an open channel flow at very high-Reynolds number. Both the SGS and the WMLES contribute to enabling a representative PBL at these large Reynolds number. The use of open-channel flows as a representative PBL either as a direct numerical simulation (DNS) (e.g. Reference Atoufi, Scott and WaiteAtoufi, Scott, & Waite, 2019) or as very large-eddy simulations (Reference Aliabadi, Veriotes and PedroAliabadi, Veriotes, & Pedro, 2018) have been reported in the literature. Here, we verify the use of the stretched vortex SGS model and the associated wall-model (see Reference Chung and PullinChung & Pullin, 2009) for high Reynolds number turbulent channel flow in our simulation framework. The single-phase channel flow is run at a Reynolds number of  $Re = 10^9$ with a friction Reynolds number of $Re_{\tau } = 20 \times 10^6$, as shown in figure 3. The extensive log-region is compared with the analytical law-of-the-wall and DNS data of Reference Hoyas and JiménezHoyas and Jiménez (2006), noting that we are comparing an open channel flow with a turbulent channel flow. The departure from the log-law, and especially the inward arc of the profile, is attributable to the Neumann boundary condition used at the top boundary; similar velocity profiles are seen in other open-channel flow simulations (Reference Aliabadi, Veriotes and PedroAliabadi et al., 2018; Reference Atoufi, Scott and WaiteAtoufi et al., 2019). The validation of turbulence distribution for the simulations are in figure 3(b). Additional validation of the solver can be found in Reference RahmanRahman (2020) and the validation with experimental observation of the electric field in terrestrial sandstorms was undertaken by Reference Rahman, Cheng and SamtaneyRahman et al. (2021).
3.2 Particle concentration distribution
The comparative analysis of the Martian and terrestrial results is first undertaken for Case III, which corresponds to a strong storm condition. Later, in § 3.4, the results of all cases are aggregated and compared.
Simulated LES channel cases of (a) normalised streamwise velocity ( $\bar {u}_x^+$) with normalised height ( $z^+$) and their comparison with analytical model and data of Reference Chung and PullinChung and Pullin (2009) (Ref. 1), Reference Fernholz and FinleytFernholz and Finleyt (1996) (Ref. 2), Reference Krogstad and EfrosKrogstad and Efros (2012) (Ref. 3), and (b) variation of normalised streamwise wall-normal fluctuations with normalised height. The normalised wall-normal fluctuations are reproduced from the DNSs of Reference Hoyas and JiménezHoyas and Jiménez (2006) (Ref. 4) where $Re_{\tau }=2\times 10^3$.

There is a significant difference in the distribution of the mean particle number density between the Martian and terrestrial PBL, despite the identical particle concentration imposed near the wall. In figure 4(a,b), we plot the wall-normal variation ( $z/\delta$) of the mean normalised particle number density for both the small ( $\overline {\tilde {n}_1}$) and large particles ( $\overline {\tilde {n}_2}$). These quantities are averaged along the streamwise and spanwise directions as well as over time during the statistically quasisteady-state regime. We note that the mean concentration profile for the number density is significantly lower on Mars than on Earth, especially approaching the virtual wall. The difference is primarily attributable to the rarefied Martian atmosphere, and more specifically to the much lower density, which leads to a lower particle drag force, and therefore impedes the momentum transfer from the fluid to the particles necessary for their transport. We observe that the mean concentration of both the small (negatively charged) and large (positively charged) particles on Mars, slightly increases with distance from the virtual wall. This contrasts with the behaviour on Earth for which we get a monotonic decrease of particle density as we move away from the wall. The density is approximately two orders of magnitude smaller on Mars, concomitantly, the drag force on the particles is reduced by a similar magnitude, hence the electrostatic force (which is maximum at the virtual wall) plays a relatively larger role on Mars compared with Earth.
Normalised charged particle concentration (a,b) and r.m.s. concentration (c,d) in the wall-normal direction for Case III  $(n_{w1},n_{w2})=10(n_{b1},n_{b2}) = (2\times 10^8,\ 3.4\times 10^7\,{\rm m}^{-3})$. The left-hand column corresponds to the small size particles ( $s=1$) and right-hand column the large size particles ( $s=2$).

Similarly, in figure 4(c,d), we observe that the root mean square (r.m.s.) of the smaller-sized particle concentration is an order of magnitude lower than those of the larger particles, which is similar on both planets. This is tied to the difference in the aerodynamic Stokes number of the small and large particles, which is defined as the ratio of the time scale of the particles and the flow; similar to the observation in Reference Di Renzo and UrzayDi Renzo and Urzay (2018). The greater relative importance of the electrostatic force is driving the greater particle density variability in the outer parts of the boundary layer, whereas on Earth, these are primarily driven by the hydrodynamic effects. It is worth noting that the r.m.s. fluctuations of the number density in figure 4(c,d) tend towards zero with a similar slope at the outer part of the boundary layer. The electrostatic forces are minimal but the hydrodynamic drag remain non-negligible in the outer parts of the log-layer.
3.3 Charge density and electric fields
The mean charge density shown in figure 5(a) is related to the differentially charged particle distribution discussed in the previous subsection (recall figure 4) and is defined as  $\overline {\varSigma } = {{n}}_{{{w1}}} \overline {\tilde {n}_{{1}}} {q}_{{1}} +{{n}}_{{{w2}}} \overline {\tilde {n}_{{2}}} {q}_{{2}}$. When we dimensionalise the particle number density near the virtual wall in figure 4(a,b), we observed roughly the same particle number densities for both the small and large particles on Mars. As the smaller particles carry a greater (in magnitude) negative charge compared with the positive charge of the larger particles, we have negative mean charge density just above the virtual wall. Overall, this is the result of the turbulent transport of different sized particles and large-scale charge separation at different altitudes. On Earth, the mean charge density remains positive through the boundary and is maximum near the virtual wall due to the greater number density of larger particles. We remind the reader that neither gravitational settling nor buoyant updrafts are considered in the present simulation to focus primarily on the turbulent-transport aspect of the charge separation.
Mean altitude variation of (a) charge density,  $\bar {\varSigma }$ (C m $^{-3}$), (b) electrostatic potential, $\bar {\phi }$ (V), (c) wall-normal electric field, $\bar {E}_z$ (V m $^{-1}$) and (d) net electric field, $|\bar {E}|$ (V m $^{-1}$) for Case III.

Despite the differences in the mean charge density, the mean electric potential consistently increases with altitude on Earth and Mars, as shown in figure 5(b). The mean electric potential remains positive with altitude because of the corresponding domain charge density variation. The rate of increase of electric potential in the vertical direction represents the strength of the wall-normal electric field. The mean electric field due to the turbulence-induced charge separation is depicted in figure 5(c). The wall-normal component of the electric field remains negative throughout the boundary layer, with the terrestrial electric field being over an order of magnitude stronger than on Mars, for the same near-wall particle concentration. This means that the direction of the wall-normal electric field is vertically downward based on the negative gradient of the electric potential. The mean total electric field (i.e. the magnitude of the electric field vector), shown in figure 5(d), decreases with height, as expected. The qualitative similarities with figure 5(c) implies that the mean electric fields in the horizontal (streamwise/spanwise) directions are negligible in comparison with the mean wall-normal electric field. Indeed, the mean spanwise electric field magnitude is of the order of machine precision, while the mean streamwise electric field magnitude is slightly higher than the machine precision (but still negligible in comparison with the mean wall-normal electric field). This slightly higher magnitude in the streamwise direction is mainly due to the quasiparallel flow assumption, which is necessary for the streamwise periodicity of the open channel simulations.
The order-of-magnitude lower electric field on Mars compared with Earth aligns with the findings of Reference Melnik and ParrotMelnik and Parrot (1998) who found a slightly higher maximum electric field (1–2 kV m $^{-1}$). Other works, such as Reference Farrell, Delory, Cummer and MarshallFarrell, Delory, Cummer, and Marshall (2003), found that Martian dust devils could develop charge separations of up to 20 kV m $^{-1}$.
The r.m.s. of the charge density, shown in figure 6(a), increases rapidly on both Earth and Mars as we approach the ground (below  $z/\delta < 0.1$). This can be attributed to the high turbulence intensity near the wall, as stated earlier. Figure 6(b) shows very different behaviour of electric potential r.m.s. in the two PBLs. On Mars, $\phi ^{\prime }$ does not show much dependence on altitude with a small peak r.m.s. at around $z/\delta =0.15$, while it rises steeply on Earth with the peak fluctuations arising much farther away from the wall. Figure 6(c) depicts the fluctuation characteristics of the wall-normal electric field ( ${E_z}^{\prime }$) and figure 6(d) shows the r.m.s. of electric field magnitude.
Altitude based variation in the fluctuations of (a) charge density,  $\varSigma ^{\prime }$ (C m $^{-3}$), (b) electric potential, $\phi ^{\prime }$ (V), (c) wall-normal electric field ${E_z}^{\prime }$ (V m $^{-1}$) and (d) net electric field ${|E|}^{\prime }$ (V m $^{-1}$).

Wall-normal height variation of the vertical electric field (a) average (spanwise/streamwise and time mean) of  $\bar {E}_z$, (b) the r.m.s. fluctuations of ${E}_z^\prime$ and (c) average charge density, where $\mathcal {E} ={\delta \varXi {/\varepsilon }}$ and $\varXi = {{s_n}}{{\boldsymbol {M}}(n_{{b1}}|q_{{1}}|,n_{{b2}}|q_{{2}}|)}$ are, respectively, the reference electric field and charge density values corresponding to Case I ( $M(a,b)=$ average of $a$ and $b$). The symbols are mean and r.m.s. values synthesised from various terrestrial sandstorm measurements by Reference Zhang, Wang, Qu and YanZhang, Wang, Qu, and Yan (2004) (circles, Observ. 1) and Reference Zhang, Li and BoZhang, Li, and Bo (2018) (stars, Observ. 2).

Wall-normal height-based variation in the (a) charge density fluctuations, (b) normalised r.m.s. concentration of the charged small and (c) large particles.

3.4 Effect of storm strength on electric field
The aggregated results for all storm conditions, on both Earth and Mars, are summarised in figures 7 and 8. For the terrestrial sandstorm, the results are compared with field measurements (denoted by the symbols near the ground). In figure 7, the marks are average and r.m.s. magnitudes measured from different terrestrial sandstorm data of Reference Zhang, Wang, Qu and YanZhang et al. (2004) (circles) and Reference Zhang, Li and BoZhang et al. (2018) (stars). On Mars, the mean electric field and its fluctuations never reach the strength of a sandstorm on Earth; even for the most severe Martian storms. This lower strength of the Martian electric field is because of its smaller magnitude of Martian atmospheric Reynolds number, the corresponding lower level of turbulence, and lower density and viscosity. Further, Mars has a much lower threshold electric field of 25 kV m $^{-1}$, which will cause localised electrical discharges before it can reach higher electric field magnitudes, and lightning, as observed on Earth. One key observation is the strong self-similarity in the electric field profiles for lower storm intensities on both Earth and Mars. This implies that we can expect mostly monotonic behaviour with the lower storm strength, assuming the ratio of small-to-large particles remains unchanged at different storm conditions. We do note that the electric field on Mars (figure 8a) seems to reach a self-regulating state in which the electric field does not increase with storm strength. We note that Cases II, III and IV display similar electric field profiles. This self-regulating state appears to be reached on Earth at higher storm intensity with higher electric field intensity. It is hypothesised that this self-regulation arises due to the greater relative importance of the electric potential in transporting particles on Mars, compared with the viscous drag force. A somewhat analogous self-regulating behaviour was noted in Reference Di Renzo and UrzayDi Renzo and Urzay (2018) for differentially charged particles in isotropic turbulence. The charge separation is driven by viscous transport via the difference in aerodynamic Stokes number of the small and large particles. On Mars, the electrostatic force component is relatively more important than on Earth. This is due to the lower drag on Mars than on Earth, from (2.5), assuming the occurrence of the same charge distribution. The electrostatic force acts to reduce the electric field magnitude, but the dominating drag force on Martian particles reduces this electrostatic drive causing higher electric fields. As the electric field gets stronger, so does the impact of the electric field on the particle transport, further impeding the charge separation caused by viscous drag effects resulting in a self-limiting behaviour of the electric field.
Time variation of the (a) wall normal electric field of  $\mathcal {N}=10$ (Case III) and (b) absolute electric field of $\mathcal {N}=40$ (Case IV).

The probability density distribution for (a)  $\mathcal {N}=10$ of wall-normal electric field ( $E_z$) and for (b) $\mathcal {N}=40$ of absolute electric field ( $|E|$) along with the corresponding power spectrum of (c) $\mathcal {N}=10$ and (d) $\mathcal {N}=40$. These power spectrum plots of electric fields are compared with the $-5/3$ power law, $f^{-5/3}\sim F^{-5/3}$, within intermediate scales. p.d.f., probability density function.

Altitude variation of probability function crossing the threshold electric field.

3.5 Temporal variation in electric field
Although, time-averaged statistical data provides information on the turbulence-driven charge separation, the temporal variation of the electric field is necessary to understand the probability of a local electric discharge event, which occurs in the form of sparks or lightning. We note that our simulations do not explicitly model the discharge events, nor do we modify the particle charges after such an event. Nonetheless, we define the threshold value, based on the literature, from which we would expect a discharge event to occur. The comparative temporal variation of the electric field for the terrestrial simulations has been reported in Reference Rahman, Cheng and SamtaneyRahman et al. (2021).
We plot the time variation of  ${E}_z$ at various wall-normal locations in figure 9(a) for the strong (Case III) and figure 9(b) very strong (Case IV) Martian dust storms. As the turbulent flow field is statistically steady, the selection of time, $t=0$, is therefore somewhat arbitrary once the initial transient of the simulation is complete. In both the weak and strong dust storms, we note distinctive and very compact peaks in the electric field that occur primarily near the wall. Unsurprisingly, the magnitudes of the peaks are much larger for the strong storms and roughly scale with the increased near-wall particle concentration. The probability density distribution and power spectrum of the electric field, in figure 10, show a similar and broad distribution of these electric peaks, which highlights the stochastic nature that is modulated by the turbulent flow field. Upon meticulous examination of our data, we observe that our electrohydrodynamic power spectrum exhibits a scaling behaviour consistent with the Kolmogorov $-5/3$ power law within the intermediate scales of frequency. This observation is consistent with the recent field measurements of dust storms on Earth as cited in Reference Zhang and ZhouZhang and Zhou (2023), and it underscores the relevance and significance of our findings. This similarity between the electric field dynamics in our dust storms and other studied systems underscores the potential universality of this scaling behaviour. These peaks in the electric field may overcome the breakdown voltage of the Martian atmosphere, which results in discharge events. To quantify the probability of electrical discharge events at various wall-normal locations, we define the probability, integrated in both time and space, as
 \begin{equation} p(z) = \frac{1}{T}\frac{1}{L_x}\frac{1}{L_y}\int_{t = 0}^{T} \int _{0}^{L_y}\int _{0}^{L_x} P(x,y,z,t)\,{{\rm d}x}\,{{\rm d}y}\,{\rm d} t , \end{equation}
where
 \begin{equation} {P(x,y,z,t)} = \begin{cases} 1 & \text{if}\ |E|\ge E_{T} , \\ 0 & \text{if}\ |E| < E_{T}. \end{cases} \end{equation}
Here  $E_{T}$ is the breakdown voltage on Mars defined in table 1. Therefore, $p(z)$ provides a statistical measure of the likelihood of occurrence at a given altitude $z$. Figure 11 shows the probability of a breakdown event. As observed in the time evolution plot, the highest probability occurs near the wall and we observe that the significant probability of discharge events occurs in the strongest Martian storm (Case IV). The maximum probability is as high as 6 %, thus discharge events remain significantly more frequent than on Earth. For Case III, the probability is as high as 1 %. There is still a probability of discharge event for the other weaker cases.
4. Conclusions
This work uses wall-modelled LES to explore the differences in the turbulence-induced charge separation in particle-laden planetary boundary layer flows on Earth and Mars. In particular, we seek to understand the physical reasons that could explain the infrequent lightning observations on Mars, despite the much lower electric breakdown potential of its atmosphere. To this end, high Reynolds number, open channel flows, selected as a representative planetary boundary layers are simulated under Martian and terrestrial conditions. There are two main reasons to explain the less frequent occurrence of lightning on Mars. Firstly, the rarefied atmosphere impedes the particle transport, resulting in a much weaker electric field generations. Secondly, we note discharge events occur very close to the ground and are very significant in the most severe dust storms (Cases III and IV). The equivalent terrestrial sandstorm has much higher breakdown potential, greater by approximately two orders of magnitude. In a ‘moderate’ dust storm on Mars, we do not expect to observe any significant large-scale lightning, which help elucidate previous experimental observations but we may still observe localised electric discharge events. We note a self-limiting state in the charge separation on Mars which is attributable to the weaker importance of the viscous particle transport.
Supplementary material
Raw data are available from the corresponding author.
Acknowledgements
The conceptual ideas for this work stemmed from discussions with G. Dietrich and H. Oqab.
Funding statement
Partial funding for this work was provided by the NSERC CRD program with the support from Columbiad Launch Services. A.S. was supported by the Vanier Canada Graduate Scholarship. Computations were performed on the Niagara supercomputer through an RAC allocation at the SciNet HPC Consortium as part of Digital Research Alliance of Canada.
Declaration of interests
The authors report no conflict of interest.
Author contributions
Conceptualisation, M.M.R., A.S. and J.-P.H.; methodology, M.M.R. and J.-P.H.; software, M.M.R.; validation, M.M.R.; formal analysis, M.M.R. and J.-P.H.; investigation, M.M.R., A.S. and J.-P.H.; data curation, M.M.R.; writing (original draft), M.M.R., A.S. and J.-P.H.; writing (review and editing draft), M.M.R., A.S. and J.-P.H.; visualisation, M.M.R.; supervision, J.-P.H.; project administration, J.-P.H.; funding acquisition, J.-P.H. All authors approved the final submitted draft.


 Open access

