


Highlights
What is already know
Random effects model is a popular tool for handling heterogeneity between studies in meta-analysis. However, the standard model is based on the Gaussian assumption and thus is susceptible to outlying studies.
What is new
A novel robust meta-analysis model using student’s t distribution called tMeta is proposed, which is capable of simultaneously accommodating and detecting outlying studies in a simple and adaptive manner. Empirical results show that tMeta is compared favorably with related competitors.
Potential impact for Research Synthesis Methods readers
Compared with related competitors, tMeta frees from numerical integration and allows for efficient optimization, which, to our knowledge, offers the first neat solution to robust meta-analysis modeling using the t distribution. Importantly, tMeta provides a simple but powerful robust meta-analysis tool that can accommodate and detect both mild and gross outliers simultaneously.
1 Introduction
In meta-analyses, the collected studies often exhibit heterogeneity, characterized by greater variation among studies than can be explained by the variation within each study,Reference Beath1 which could result in misleading conclusions about the overall treatment effect.Reference Lin, Chu and Hodges2, Reference Noma, Nagashima, Kato, Teramukai and Furukawa3 The random effects model is a popular tool for handling heterogeneity.Reference Hardy and Thompson4, Reference Wang, Lin, Thompson and Chu5 However, the standard model assumes normal distributions for both random effects and within-study errors (nMeta), making it susceptible to outlying studies.
Outlier detection is a central research area in meta-analysis. Many methods have been developed. For example, a likelihood ratio test was constructed to identify outliers by detecting inflated varianceReference Gumedze and Jackson6; a forward search algorithm was developed specifically for this purposeReference Mavridis, Moustaki, Wall and Salanti7; several outlier and influence diagnostic procedures in meta-regression models were presented.Reference Viechtbauer and Cheung8 Subsequently, case deletion diagnostics and local influence analysis using multiple perturbation schemes, were investigated.Reference Shi, Zuo, Yu and Zhou9 Several Bayesian outlier detection measures were also introduced for handling outlying studies in network meta-analysis.Reference Zhang, Fu and Carlin10 Another important methodology for dealing with outliers is outlier accommodation or robust estimation, which can down-weight the influence of outliers. For instance, robust functions like Huber’s rho and Tukey’s biweight functions were employed to replace the original non-robust objective function, resulting in robust estimates.Reference Yu, Ding, He, Wang, Zhou and Shi11
This article focuses on outlier accommodation and detection simultaneously. Several efforts have been made toward this objective. Non-normal alternatives to normal random effects were investigated, and it was found that the t distribution performs the best (tRE-Meta).Reference Baker and Jackson12 The shortcoming is that the marginal distribution of $y_i$
in tRE-Meta is mathematically intractable. Consequently, numerical integration is required to evaluate the log-likelihood and numerical optimization methods have to be employed for maximum likelihood (ML) estimation. Subsequently, new models where
$y_i$
in tRE-Meta is mathematically intractable. Consequently, numerical integration is required to evaluate the log-likelihood and numerical optimization methods have to be employed for maximum likelihood (ML) estimation. Subsequently, new models where $y_i$
has a tractable marginal distribution were presented, including the three parameter symmetric marginal model (SYM-Meta) and the four parameter skew marginal model (SKM-Meta).Reference Baker and Jackson13 Nevertheless, numerical optimization has still to be employed to obtain ML estimates. As a tractable model, a variant of a two-component mixture model (MIX-Meta) was proposed, with one component modeling standard studies and the other addressing outlying studies.Reference Beath1 In MIX-Meta, the marginal distribution of the observed effect
$y_i$
has a tractable marginal distribution were presented, including the three parameter symmetric marginal model (SYM-Meta) and the four parameter skew marginal model (SKM-Meta).Reference Baker and Jackson13 Nevertheless, numerical optimization has still to be employed to obtain ML estimates. As a tractable model, a variant of a two-component mixture model (MIX-Meta) was proposed, with one component modeling standard studies and the other addressing outlying studies.Reference Beath1 In MIX-Meta, the marginal distribution of the observed effect $y_i$
is a mixture of two normal distributions. However, MIX-Meta suffers from initialization issues, necessitating multiple runs of the fitting algorithm with different starting values.
$y_i$
is a mixture of two normal distributions. However, MIX-Meta suffers from initialization issues, necessitating multiple runs of the fitting algorithm with different starting values.
The common feature of these methods is that the error terms are assumed to follow the normal distribution. In this article, we break this limitation as the marginal distribution of error term in our proposed model follows the t distribution. It is known that the t distribution includes the normal distribution as a special case when the degrees of freedom $\nu $
goes to infinity. This means that tMeta offers greater flexibility and applicability than the conventional normal assumption. The main contributions of this article are as follows.
$\nu $
goes to infinity. This means that tMeta offers greater flexibility and applicability than the conventional normal assumption. The main contributions of this article are as follows.
-
(i) The marginal distribution of the effect size $y_i$
in tMeta follows the t distribution, enabling it to simultaneously accommodate and detect outliers in a simple and adaptive manner. 1) The t distribution offers an additional robustness tuning parameter which can adaptively down-weight outlying studies. 2) The expected weights follow in proportion to a Beta distribution, providing a useful critical value for outlier detection.
$y_i$
in tMeta follows the t distribution, enabling it to simultaneously accommodate and detect outliers in a simple and adaptive manner. 1) The t distribution offers an additional robustness tuning parameter which can adaptively down-weight outlying studies. 2) The expected weights follow in proportion to a Beta distribution, providing a useful critical value for outlier detection. -
(ii) tMeta provides a simple but powerful robust meta-analysis tool that can accommodate and detect both mild and gross outliers simultaneously. As can be seen from Section 4, 1) tMeta versus SYM-Meta and SKM-Meta. Both the three-parameter SYM-Meta and four-parameter SKM-Meta fail in most of the outlier detection tasks, though they have good performance in outlier accommodation. 2) tMeta versus tRE-Meta and MIX-Meta. While all the three methods can be used to detect mild outliers, tMeta performs the best in outlier accommodation. More importantly, in the presence of gross outliers, both tRE-Meta and MIX-Meta could fail while tMeta still performs satisfactorily.
-
(iii) Due to its mathematical tractability, tMeta frees from numerical integration and allows for efficient optimization. In contrast, tRE-Meta requires both complicated numerical integration and numerical optimization; SYM-Meta and SKM-Meta involve complex numerical optimizationReference Baker and Jackson13; MIX-Meta requires multiple runs of the fitting algorithm due to the sensitivity issue of mixture models to initialization.Reference Beath1 To our knowledge, tMeta offers the first neat solution to robust meta-analysis modeling using the t distribution.

The rest of this article is organized as follows. Section 2 reviews some related works. Section 3 proposes our new model tMeta. Section 4 conducts case studies to compare tMeta with several closely related competitors. Section 5 offers a summary of the entire article.
2 Background
In this section, we briefly review some fundamental results concerning the standard model nMeta and Student’s t distribution.
2.1 Normal meta-analysis model (nMeta)
In nMeta, the effect size $y_i$
for the i-th study is defined as follows
$y_i$
for the i-th study is defined as follows
 $$ \begin{align} y_i=\mu+b_i+e_i,\;i=1,\ldots,N, \end{align} $$
where the random effects $b_i$
captures heterogeneity across studies and follows
$b_i$
captures heterogeneity across studies and follows $\mathcal {N}(0,\sigma ^2)$
, the within-study error
$\mathcal {N}(0,\sigma ^2)$
, the within-study error $e_i$
follows
$e_i$
follows $\mathcal {N}(0, s_i^2)$
and they are independent of each other. Here,
$\mathcal {N}(0, s_i^2)$
and they are independent of each other. Here, $\mu $
is the overall effect size,
$\mu $
is the overall effect size, $\sigma ^2$
is the unknown between-study variance and
$\sigma ^2$
is the unknown between-study variance and $s_i^2$
is the known within-study variance.
$s_i^2$
is the known within-study variance.
From (1), we have $y_i\sim \mathcal {N}(\mu ,\sigma ^2+s^2_i)$
. Estimates for the parameters
$y_i\sim \mathcal {N}(\mu ,\sigma ^2+s^2_i)$
. Estimates for the parameters $\mu $
and
$\mu $
and $\sigma ^2$
can be obtained through maximum likelihood methods.Reference Hardy and Thompson14
$\sigma ^2$
can be obtained through maximum likelihood methods.Reference Hardy and Thompson14
2.2 Student’s t distribution
Suppose that a random variable y follows the univariate t distribution $\mathit {t} (\mu ,\sigma ^2,\nu )$
, with center
$\mathit {t} (\mu ,\sigma ^2,\nu )$
, with center $\mu \in \mathbb {R}$
, scale parameter
$\mu \in \mathbb {R}$
, scale parameter $\sigma ^2\in\mathbb {R}^{+}$
, and degrees of freedom
$\sigma ^2\in\mathbb {R}^{+}$
, and degrees of freedom $\nu>0$
, then the probability density function (p.d.f.) of y is given by
$\nu>0$
, then the probability density function (p.d.f.) of y is given by
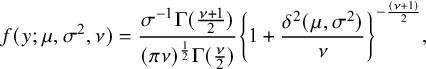 $$ \begin{align*} f(y;\mu,\sigma^2,\nu)=\frac{{\sigma^{-1}\Gamma(\frac{\nu+1}2)}}{{(\pi\nu)^{\frac12}}{\Gamma(\frac\nu2)}}{\left\lbrace 1+\frac{\delta^2(\mu,\sigma^2)}{\nu}\right\rbrace^{-\frac{(\nu+1)}2}}, \end{align*} $$
where $\Gamma (\cdot )$
is the gamma function and
$\Gamma (\cdot )$
is the gamma function and $\delta ^2(\mu ,\sigma ^2)=(y-\mu )^2/\sigma ^2$
is the squared Mahalanobis distance of y from the center
$\delta ^2(\mu ,\sigma ^2)=(y-\mu )^2/\sigma ^2$
is the squared Mahalanobis distance of y from the center $\mu $
with respect to
$\mu $
with respect to $\sigma ^2$
. If
$\sigma ^2$
. If $\nu>1$
,
$\nu>1$
, $\mathbb {E}[y]=\mu $
; if
$\mathbb {E}[y]=\mu $
; if $\nu>2$
, Var
$\nu>2$
, Var $(y)=\nu \sigma ^2/(\nu -2)$
; and if
$(y)=\nu \sigma ^2/(\nu -2)$
; and if $\nu \to \infty $
,
$\nu \to \infty $
, $t(\mu ,\sigma ^2,\nu )\to \mathcal {N}(\mu ,\sigma ^2)$
.Reference Liu and Rubin15
$t(\mu ,\sigma ^2,\nu )\to \mathcal {N}(\mu ,\sigma ^2)$
.Reference Liu and Rubin15
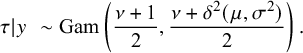
Given a latent weight variable $\tau $
distributed as the Gamma distribution
$\tau $
distributed as the Gamma distribution $\mathrm {Gam}(\nu /2,\nu /2)$
, y can also be represented hierarchically as a latent variable model as followsReference Liu and Rubin15:
$\mathrm {Gam}(\nu /2,\nu /2)$
, y can also be represented hierarchically as a latent variable model as followsReference Liu and Rubin15:
 $$ \begin{align} {y}|\tau\sim\mathcal{N}\left(\mu,\frac{\sigma^2}{\tau}\right),\,\,\tau\sim\mathrm{Gam}\left(\frac{\nu}{2},\frac{\nu}{2}\right). \end{align} $$
Under model (2), it is easy to obtain the marginal distribution $y\sim \mathit {t} (\mu ,\sigma ^2,\nu )$
by
$y\sim \mathit {t} (\mu ,\sigma ^2,\nu )$
by $f(y;\mu ,\sigma ^2,\nu )=\int _{0}^{\infty }f(y|\tau )f(\tau )d\tau$
Reference Zhao and Jiang16 and the posterior distribution of
$f(y;\mu ,\sigma ^2,\nu )=\int _{0}^{\infty }f(y|\tau )f(\tau )d\tau$
Reference Zhao and Jiang16 and the posterior distribution of $\tau $
given y
$\tau $
given y
 $$ \begin{align*} \tau|y\,\,\sim \mathrm{Gam}\left(\frac{\nu+1}{2},\frac{\nu+\delta^2(\mu,\sigma^2)}{2}\right). \end{align*} $$
3 Novel robust meta-analysis model
In this section, we propose a novel robust meta-analysis model called tMeta. In Section 3.1, we present the model. In Section 3.2, we develop an algorithm for parameter estimation. In Section 3.3 and Section 3.4, we give the details for outlier accommodation and detection in tMeta.
3.1 The proposed tMeta model
Based on the hierarchical representation of the t distribution in Section 2.2, we propose a novel robust random effects meta-analysis model, denoted by tMeta. Its latent variable model can be expressed by
 $$ \begin{align} \begin{cases} y_i=\mu+b_i+e_i,& i=1,\ldots,N,\\ b_i|\tau_i\sim\mathcal{N}(0,\sigma^2/\tau_i), & e_i|\tau_i\sim\mathcal{N}(0,s^2_i/\tau_i)\\ \tau_i\sim \mathrm{Gam}\left(\nu/2,\nu/2\right),& \end{cases} \end{align} $$
where, unlike nMeta, the random effects $b_i$
and the within-study error
$b_i$
and the within-study error $e_i$
under tMeta are only conditionally independent; that is,
$e_i$
under tMeta are only conditionally independent; that is, $b_i$
and
$b_i$
and $e_i$
are mutually independent given the latent weight
$e_i$
are mutually independent given the latent weight $\tau _i$
;
$\tau _i$
; $\mu $
is the overall effect size,
$\mu $
is the overall effect size, $\sigma ^2$
is the unknown between-study variance,
$\sigma ^2$
is the unknown between-study variance, $s_i^2$
is the known within-study variance, and the degrees of freedom
$s_i^2$
is the known within-study variance, and the degrees of freedom $\nu>0$
.
$\nu>0$
.
According to (3), integrating out the latent weight $\tau _i$
yields the marginal distributions
$\tau _i$
yields the marginal distributions $b_i\sim t(0,\sigma ^2,\nu )$
and
$b_i\sim t(0,\sigma ^2,\nu )$
and $e_i\sim t(0,s^2_i,\nu )$
. Furthermore, using the property of the normal distribution, it is easy to obtain the conditional distribution of
$e_i\sim t(0,s^2_i,\nu )$
. Furthermore, using the property of the normal distribution, it is easy to obtain the conditional distribution of $y_i$
given
$y_i$
given $\tau _i$
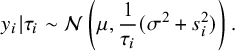 $$ \begin{align} y_i|\tau_i\sim\mathcal{N}\left(\mu,\frac1{\tau_i}(\sigma^2+s^2_i)\right). \end{align} $$
Integrating out the latent weight $\tau _i$
, we obtain an important result that the marginal distribution
$\tau _i$
, we obtain an important result that the marginal distribution $y_i$
follows a t distribution, that is,
$y_i$
follows a t distribution, that is,
 $$ \begin{align} y_i\sim t(\mu,\sigma^2+s^2_i,\nu). \end{align} $$
Note that this result is not available under tRE-Meta model, where the marginal distribution of $y_i$
is mathematically intractable. This difference arises because tMeta and tRE-Meta model outliers in distinct ways. In tRE-Meta, outliers are assumed to result solely from extreme variation within studies. By contrast, as shown in (4), tMeta models the importance of a study i at the
$y_i$
is mathematically intractable. This difference arises because tMeta and tRE-Meta model outliers in distinct ways. In tRE-Meta, outliers are assumed to result solely from extreme variation within studies. By contrast, as shown in (4), tMeta models the importance of a study i at the $y_i$
-level by incorporating a latent weight
$y_i$
-level by incorporating a latent weight $\tau _i$
associated with
$\tau _i$
associated with $y_i$
to reflect the study’s significance. The same
$y_i$
to reflect the study’s significance. The same $\tau _i$
is then naturally applied to both the between-study effect
$\tau _i$
is then naturally applied to both the between-study effect $b_i$
and the within-study error
$b_i$
and the within-study error $e_i$
, as shown in (3). In other words, outliers in tMeta are assumed to result from extreme variation across both the within-study and between-study levels. This hierarchical modeling framework enables a tractable marginal model for the effect
$e_i$
, as shown in (3). In other words, outliers in tMeta are assumed to result from extreme variation across both the within-study and between-study levels. This hierarchical modeling framework enables a tractable marginal model for the effect $y_i$
.
$y_i$
.
As a result, the degrees of freedom $\nu $
in tMeta can be interpreted as an overall measure of deviation from the nMeta model across both within-study and between-study levels. The two models differ significantly when
$\nu $
in tMeta can be interpreted as an overall measure of deviation from the nMeta model across both within-study and between-study levels. The two models differ significantly when $\nu $
is small but become similar as
$\nu $
is small but become similar as $\nu $
becomes large. Similar overall measures have appeared in the literature; for example, a total correlation parameter has been used to capture overall correlation across both levels in the normal random-effects model.Reference Riley, Thompson and Abrams17 Notably, nMeta emerges as a special case of tMeta in the limit, as the t distribution
$\nu $
becomes large. Similar overall measures have appeared in the literature; for example, a total correlation parameter has been used to capture overall correlation across both levels in the normal random-effects model.Reference Riley, Thompson and Abrams17 Notably, nMeta emerges as a special case of tMeta in the limit, as the t distribution $t(\mu ,\sigma ^2+s^2_i,\nu )$
approaches the normal distribution
$t(\mu ,\sigma ^2+s^2_i,\nu )$
approaches the normal distribution $\mathcal {N}(\mu ,\sigma ^2+s^2_i)$
as
$\mathcal {N}(\mu ,\sigma ^2+s^2_i)$
as $\nu \to \infty $
.
$\nu \to \infty $
.
3.1.1 Probability distributions
From tMeta model (3), it is easy to obtain the following probability distributions
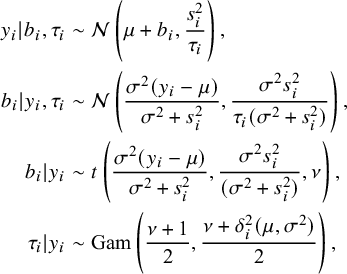 $$ \begin{align} y_i|b_i,\tau_i&\sim\mathcal{N}\left(\mu+b_i,\frac{s^2_i}{\tau_i}\right),\nonumber \\ b_i|y_i,\tau_i&\sim\mathcal{N}\left(\frac{\sigma^2(y_i-\mu)}{\sigma^2+s^2_i}, \frac{\sigma^2s^2_i}{\tau_i(\sigma^2+s^2_i)}\right),\nonumber\\ b_i|y_i&\sim t\left(\frac{\sigma^2(y_i-\mu)}{\sigma^2+s^2_i}, \frac{\sigma^2s^2_i}{(\sigma^2+s^2_i)},\nu\right),\nonumber\\ \tau_i|y_i&\sim\mathrm{Gam}\left(\frac{\nu+1}2,\frac{\nu+\delta^{2}_i(\mu,\sigma^{2})}2\right), \end{align} $$
where
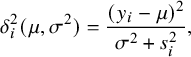 $$ \begin{align} \delta_i^2(\mu,\sigma^2)=\frac{(y_i-\mu)^2}{\sigma^2+s^2_i}, \end{align} $$
is the squared Mahalanobis distance of $y_i$
from the overall effect size
$y_i$
from the overall effect size $\mu $
. It is clear that all the probability distributions under tMeta, including the marginal distributions of
$\mu $
. It is clear that all the probability distributions under tMeta, including the marginal distributions of $b_i$
,
$b_i$
, $e_i$
and
$e_i$
and $y_i$
given in Section 3.1, are well-known and tractable.
$y_i$
given in Section 3.1, are well-known and tractable.
3.1.2 Robust meta-regression with covariates
When several covariates are involved, the model (3) can be extended to a more general model,
 $$ \begin{align*} y_i=\mathbf{x}_i'{\boldsymbol{\beta}}+b_i+e_i,\quad i=1,\ldots,N, \end{align*} $$
where $\mathbf {x}_i$
represents p-dimensional vector of covariates,
$\mathbf {x}_i$
represents p-dimensional vector of covariates, $\boldsymbol {\beta }=(\beta _1,\beta _2,\ldots ,\beta _p)'$
is the p-dimensional regression coefficients; the random variables
$\boldsymbol {\beta }=(\beta _1,\beta _2,\ldots ,\beta _p)'$
is the p-dimensional regression coefficients; the random variables $b_i$
and
$b_i$
and $e_i$
and the other parameters
$e_i$
and the other parameters $\mu , \sigma ^2$
and
$\mu , \sigma ^2$
and $\nu $
are similar as those in tMeta (3). Under this model, we have
$\nu $
are similar as those in tMeta (3). Under this model, we have ${y_i}\sim t(\mathbf {x}_i'{\boldsymbol {\beta }},\sigma ^{2}+s^{2}_i,\nu )$
.
${y_i}\sim t(\mathbf {x}_i'{\boldsymbol {\beta }},\sigma ^{2}+s^{2}_i,\nu )$
.
3.2 Maximum likelihood estimation
In this section, we develop estimation algorithms for obtaining the ML estimates of the parameters $\boldsymbol {\theta }=(\mu ,\sigma ^2,\nu )$
in the tMeta model. Given the effect size vector
$\boldsymbol {\theta }=(\mu ,\sigma ^2,\nu )$
in the tMeta model. Given the effect size vector $\mathbf {y}=(y_1,\ldots ,y_N)$
, from (3) the observed data log-likelihood function
$\mathbf {y}=(y_1,\ldots ,y_N)$
, from (3) the observed data log-likelihood function $\mathcal {L}$
is (up to a constant),
$\mathcal {L}$
is (up to a constant),
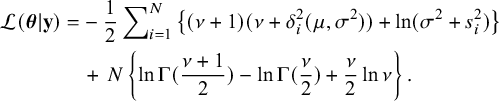 $$ \begin{align} \mathcal{L}(\boldsymbol{\theta}|\mathbf{y})&= -\>\frac12\sum\nolimits_{i=1}^N \left\lbrace(\nu+1)(\nu+\delta^2_i(\mu,\sigma^2))+\ln(\sigma^2+s^2_i)\right\rbrace \nonumber\\ &\quad +\>N\left\lbrace\ln\Gamma(\frac{\nu+1}{2})-\ln\Gamma(\frac\nu2)+\frac{\nu}2\ln{\nu}\right\rbrace. \end{align} $$
The maximization of $\mathcal {L}$
in (8) can be obtained by standard numerical optimizers. However, we shall propose an EM-type algorithm to obtain the ML estimate
$\mathcal {L}$
in (8) can be obtained by standard numerical optimizers. However, we shall propose an EM-type algorithm to obtain the ML estimate $\hat {\boldsymbol {\theta }}$
because of its simplicity and stability.Reference Liu and Rubin15 From (6), the required conditional expectation in the E-step can be obtained as
$\hat {\boldsymbol {\theta }}$
because of its simplicity and stability.Reference Liu and Rubin15 From (6), the required conditional expectation in the E-step can be obtained as
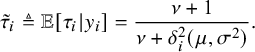 $$ \begin{align} \tilde{\tau}_i\triangleq\mathbb{E}[\tau_i|y_i]=\frac{\nu+1}{\nu+{\delta_i^{2}}(\mu,\sigma^{2})}. \end{align} $$
The details about the development of this algorithm can be found in Section A.1 of the Appendix.
3.3 Outlier accommodation
3.3.1 Adaptive outlier accommodation
Looking at (9), (A.2), and (A.3), the following can be observed.
-
(i) When the data contain no outliers and the
$y_i$
’s come from nMeta,
$\nu $
is expected to take on large values. This causes all the weights
$\tilde {\tau }_i$
in (9) to be close to 1. Consequently, (A.2) and (A.3) would degenerate to those of nMeta, and hence tMeta adaptively degenerates to nMeta in this case. -
(ii) In the presence of outliers,
$\nu $
is expected to take on small values, and the outlying study
$y_i$
would have a much greater squared Mahalanobis distance
$\delta ^{2}_i(\mu ,\sigma ^2)$
compared with non-outliers, causing the outlier’s
$\tilde {\tau }_i$
in (9) to be much smaller than those of non-outliers. Consequently, the impact of outliers on the estimators in (A.2) and (A.3) is substantially reduced, allowing tMeta to yield robust estimates.


In summary, the degrees of freedom $\nu $
is a robustness tuning parameter that adapts according to the presence of outliers in the data.
$\nu $
is a robustness tuning parameter that adapts according to the presence of outliers in the data.
3.3.2 Breakdown point
In statistics, the robustness of estimators is assessed by breakdown points, which are the proportion of arbitrarily large outlying observations an estimator can tolerate before giving an incorrect result. The following Proposition 1 gives the breakdown point of tMeta.
Proposition 1. The upper bound of the breakdown point of tMeta is $1/(\nu +1)$
.
$1/(\nu +1)$
.
Proof. As proved by Dümbgen and Tyler,Reference Dümbgen and Tyler18 the upper bound of the breakdown point of the d-dimensional multivariate t distribution is $1/(\nu +d)$
. For tMeta, the dimension of t-distributed
$1/(\nu +d)$
. For tMeta, the dimension of t-distributed $y_i$
is
$y_i$
is $d=1$
and hence the upper bound of tMeta is given by
$d=1$
and hence the upper bound of tMeta is given by $1/(\nu +1)$
. This completes the proof.
$1/(\nu +1)$
. This completes the proof.
In our implementation, we restrict $\nu \geq 1$
. Proposition 1 shows that tMeta is a highly robust method as its breakdown point could be close to 50% under this restriction.
$\nu \geq 1$
. Proposition 1 shows that tMeta is a highly robust method as its breakdown point could be close to 50% under this restriction.
3.4 Outlier detection
Similar to that in multivariate t and matrix-variate t distributions,Reference Wang and Fan19–
Reference Zhao, Ma, Shi and Wang21 the expected weight $\tilde {\tau }_i$
in tMeta given by (9) can be used as outlier indicator. Let
$\tilde {\tau }_i$
in tMeta given by (9) can be used as outlier indicator. Let
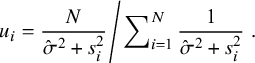 $$ \begin{align} \left. u_i=\frac{N}{\hat{\sigma}^2+s^2_i}\middle/\sum\nolimits_{i=1}^N\frac1{\hat{\sigma}^2+s^2_i}\right.. \end{align} $$
The following Proposition 2 gives the details.
Proposition 2. Assume that the study $\{y_i\}_{i=1}^N$
follow tMeta model (3). Given the ML estimate
$\{y_i\}_{i=1}^N$
follow tMeta model (3). Given the ML estimate $\hat {\boldsymbol {\theta }}$
, we have, when the estimate
$\hat {\boldsymbol {\theta }}$
, we have, when the estimate $\hat {\sigma }^2>0$
,
$\hat {\sigma }^2>0$
,
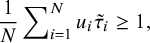
 $$ \begin{align*} \frac1N\sum\nolimits_{i=1}^Nu_i\tilde{\tau}_i=1, \end{align*} $$
and when $\hat {\sigma }^2=0$
,
$\hat {\sigma }^2=0$
,
 $$ \begin{align*} \frac1N\sum\nolimits_{i=1}^Nu_i\tilde{\tau}_i\geq1,\end{align*} $$
Proof. The proof can be found in Section A.2 of the Appendix.
Proposition 2 shows that when the estimate $\hat {\sigma }^2>0$
, the average of all
$\hat {\sigma }^2>0$
, the average of all $u_i\tilde {\tau }_i$
’s equals to 1. In other words, the study with
$u_i\tilde {\tau }_i$
’s equals to 1. In other words, the study with $u_i\tilde {\tau }_i$
much smaller than 1 (i.e.,
$u_i\tilde {\tau }_i$
much smaller than 1 (i.e., $\tilde {\tau }_i$
much smaller than
$\tilde {\tau }_i$
much smaller than $1/u_i$
) or close to 0 can be considered as an outlier. When
$1/u_i$
) or close to 0 can be considered as an outlier. When $\hat {\sigma }^2=0$
, our experience reveals that
$\hat {\sigma }^2=0$
, our experience reveals that $\sum \nolimits _{i=1}^Nu_i\tilde {\tau }_i/N$
may be slightly greater than
$\sum \nolimits _{i=1}^Nu_i\tilde {\tau }_i/N$
may be slightly greater than $1$
.
$1$
.
In practice, a critical value is needed to judge whether a study is an outlier or not. The following Proposition 3 does this task. Let $F(a,b)$
and
$F(a,b)$
and $\mbox {Beta}(a,b)$
stand for the F distribution and Beta distribution with parameters a and b, respectively. The
$\mbox {Beta}(a,b)$
stand for the F distribution and Beta distribution with parameters a and b, respectively. The $\alpha $
quantile of
$\alpha $
quantile of $\mbox {Beta}(a,b)$
is denoted by
$\mbox {Beta}(a,b)$
is denoted by $\mbox{Beta}_\alpha(a,b) $
.
$\mbox{Beta}_\alpha(a,b) $
.
Proposition 3. Suppose that the study set $\{y_i\}_{i=1}^N$
follow tMeta model (3). Then we have that the Mahalanobis distance
$\{y_i\}_{i=1}^N$
follow tMeta model (3). Then we have that the Mahalanobis distance $\delta ^2_i(\mu ,\sigma ^2)\sim F(1,\nu )$
. Given the ML estimate
$\delta ^2_i(\mu ,\sigma ^2)\sim F(1,\nu )$
. Given the ML estimate $\hat {\boldsymbol {\theta }}$
, the weights
$\hat {\boldsymbol {\theta }}$
, the weights $\tilde {\tau }_i,\,i=1,\ldots ,N$
converge in distribution to
$\tilde {\tau }_i,\,i=1,\ldots ,N$
converge in distribution to $(1+1/\nu )Beta(\nu /2,1/2)$
as the study sample size N approaches infinity. Therefore, at a significance level of
$(1+1/\nu )Beta(\nu /2,1/2)$
as the study sample size N approaches infinity. Therefore, at a significance level of $\alpha $
, the i-th study with
$\alpha $
, the i-th study with $\tilde {\tau }_i<(1+1/\nu )Beta_{\alpha }(\nu /2,1/2)$
could be identified as an outlier.
$\tilde {\tau }_i<(1+1/\nu )Beta_{\alpha }(\nu /2,1/2)$
could be identified as an outlier.
Proof. This is a special case with dimension $d=1$
of the result on the d-dimensional multivariate t distribution proved by Wang and Fun.Reference Wang and Fan19 This completes the proof.
$d=1$
of the result on the d-dimensional multivariate t distribution proved by Wang and Fun.Reference Wang and Fan19 This completes the proof.
4 Results
In this section, we compare the performance of our proposed tMeta with five closely related methods: nMeta, tRE-Meta, MIX-Meta, SYM-Meta and SKM-Meta using four benchmark real-world datasets. For tMeta, the iteration stops when the relative change in the objective function $\mathcal {L}$
(|1-
$\mathcal {L}$
(|1- $\mathcal {L}^{(t)}/\mathcal {L}^{(t+1)}|$
) is smaller than the given threshold
$\mathcal {L}^{(t)}/\mathcal {L}^{(t+1)}|$
) is smaller than the given threshold $tol=10^{-8}$
or the number of iterations exceeds
$tol=10^{-8}$
or the number of iterations exceeds $t_{max}=100$
. For nMeta, tRE-Meta, and MIX-Meta, we use the R codes available from https://cran.r-project.org/web/packages/metaplus/. In addition, we use the default setting for MIX-Meta, i.e., 20 initializations. The code for SYM-Meta and SKM-Meta can be found from the supplementary materials by Baker and Jackson.Reference Baker and Jackson13
$t_{max}=100$
. For nMeta, tRE-Meta, and MIX-Meta, we use the R codes available from https://cran.r-project.org/web/packages/metaplus/. In addition, we use the default setting for MIX-Meta, i.e., 20 initializations. The code for SYM-Meta and SKM-Meta can be found from the supplementary materials by Baker and Jackson.Reference Baker and Jackson13
To perform outlier detection for tMeta, we utilize the critical value provided in Proposition 3 and set the significance level $\alpha =0.05$
. For better visualization, we equivalently plot the inverse of
$\alpha =0.05$
. For better visualization, we equivalently plot the inverse of $\tilde {\tau }_i$
. That is, the study with
$\tilde {\tau }_i$
. That is, the study with $1/\tilde {\tau }_i>1/((1+1/\nu )\mbox{Beta}_{\alpha }(\nu /2,1/2))$
is identified as an outlier for tMeta. For MIX-Meta, we use the empirical threshold 0.9 as suggested by Beath,Reference Beath1 which represents the posterior probability that a study belongs to the outlying component. For SYM-Meta and SKM-Meta, we adopt the p-value method specially developed for both models by Baker and Jackson.Reference Baker and Jackson13 Since tRE-Meta lacks guidelines for setting the threshold, we follow the empirical approach by Baker and Jackson,Reference Baker and Jackson12 treating studies with very small values of the relative weight
$1/\tilde {\tau }_i>1/((1+1/\nu )\mbox{Beta}_{\alpha }(\nu /2,1/2))$
is identified as an outlier for tMeta. For MIX-Meta, we use the empirical threshold 0.9 as suggested by Beath,Reference Beath1 which represents the posterior probability that a study belongs to the outlying component. For SYM-Meta and SKM-Meta, we adopt the p-value method specially developed for both models by Baker and Jackson.Reference Baker and Jackson13 Since tRE-Meta lacks guidelines for setting the threshold, we follow the empirical approach by Baker and Jackson,Reference Baker and Jackson12 treating studies with very small values of the relative weight $\omega _i/\omega _i^0$
, or equivalently, very large values of
$\omega _i/\omega _i^0$
, or equivalently, very large values of $\omega _i^0/\omega _i$
as outliers, where
$\omega _i^0/\omega _i$
as outliers, where $\omega _i$
and
$\omega _i$
and $\omega _i^0$
are the weights under tRE-Meta and nMeta, respectively.
$\omega _i^0$
are the weights under tRE-Meta and nMeta, respectively.
To compare the computational efficiency, we will report their total CPU time consumed by various methods, which is sum of the time used for training model and that for detecting outliers. For tMeta and MIX-Meta, outlier detection is a byproduct of the model training and incurs no additional time cost. However, tRE-Meta, SYM-Meta and SKM-Meta require additional time cost for outlier detection. To be specific, tRE-Meta requires numerical methods to compute $\omega _i^0/\omega _i$
while SYM-Meta and SKM-Meta necessitate additional efforts to implement the p-value method.
$\omega _i^0/\omega _i$
while SYM-Meta and SKM-Meta necessitate additional efforts to implement the p-value method.
4.1 Intravenous magnesium
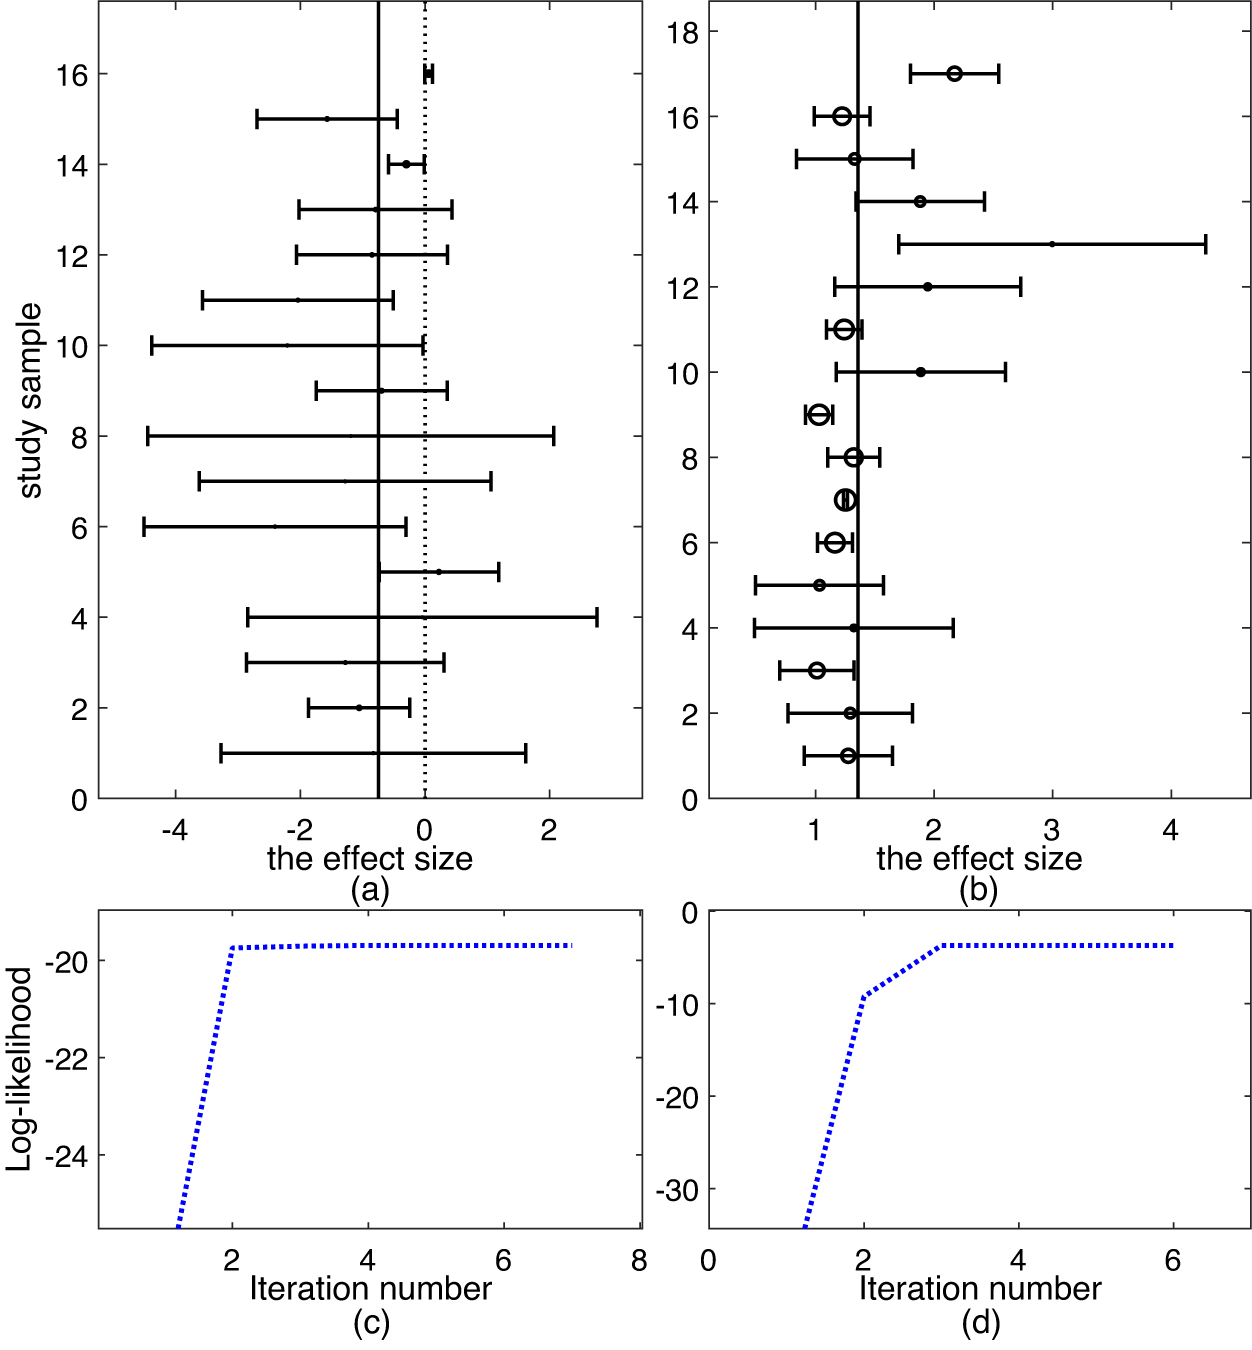
The Mag datasetReference Sterne, Bradburn, Egger, Egger, Smith and Altman22 comprises 16 studies. As can be seen from the forest plot shown in Figure 1(a), it looks difficult to visually identify which study is an outlier except that study 16 seems different from others due to its relatively large $y_i$
value and low
$y_i$
value and low $s_i^2$
. Previous researchesReference Beath1,
Reference Gumedze and Jackson6 have analyzed this dataset and found no outliers. Below we perform outlier detection with various methods.
$s_i^2$
. Previous researchesReference Beath1,
Reference Gumedze and Jackson6 have analyzed this dataset and found no outliers. Below we perform outlier detection with various methods.
Top row: forest plots on two datasets: (a) Mag and (b) Hipfrac, where each effect size $y_i$
and 95% confidence interval are shown as circle and solid line, respectively. Bottom row: evolement of log-likelihood of
$y_i$
and 95% confidence interval are shown as circle and solid line, respectively. Bottom row: evolement of log-likelihood of $\mathcal {L}$
versus number of iterations: (c) Mag and (d) Hipfrac.
$\mathcal {L}$
versus number of iterations: (c) Mag and (d) Hipfrac.
We fit all the six methods on the Mag dataset. Table 1 collects the results. The results in Table 1 show all the six methods yield similar performance. This means that all the five methods tRE-Meta, MIX-Meta, SYM-Meta, SKM-Meta and tMeta could degrade to nMeta. Nevertheless, among the five robust methods, tMeta is computationally the most efficient while tRE-Meta and MIX-Meta require much more time. Figure 1(c) shows the evolvement of log-likelihood $\mathcal {L}$
versus number of iterations when fitting tMeta. It can be seen from Figure 1(c) that tMeta converges within 7 iterations on this dataset.
$\mathcal {L}$
versus number of iterations when fitting tMeta. It can be seen from Figure 1(c) that tMeta converges within 7 iterations on this dataset.
Results of parameter estimates, negative log-likelihood, and CPU time (in seconds) by various methods on Mag dataset
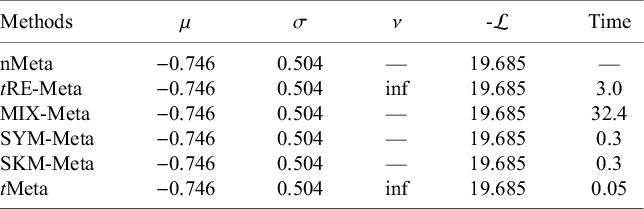
Note: ‘—’ indicates that a method does not have corresponding results.
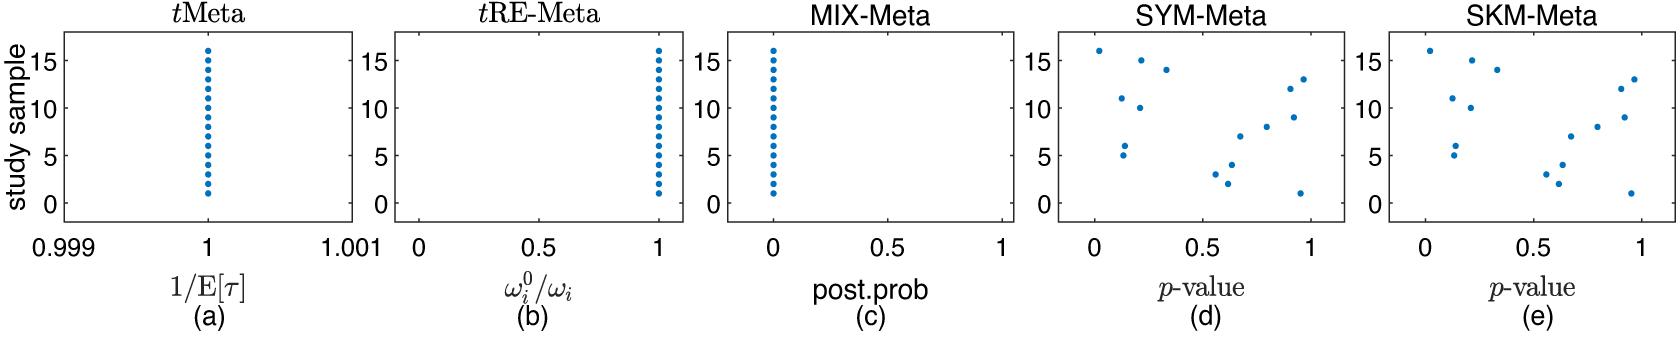
Figure 2 shows the results of detecting outliers by the five methods. It can be seen from Figure 2 that all the five methods suggest no outliers for Mag dataset. This finding is consistent with that by Beath.Reference Beath1
Results on outlier detection by various methods on Mag dataset: (a) tMeta; (b) tRE-Meta; (c) MIX-Meta; (d) SYM-Meta; (e) SKM-Meta. The marker solid point $\bullet $
in blue represents normal studies judged by a method.
$\bullet $
in blue represents normal studies judged by a method.
4.2 Hipfrac dataset
The Hipfrac datasetReference Haentjens, Magaziner and Colón-Emeric23 contains 17 studies, collected from an investigation on the magnitude and duration of excess mortality after hip fracture among older men. Figure 1(b) shows the forest plot, from which it seems hard to identify which study is an outlier. Below we perform outlier analysis with various methods.
We fit all the six methods on the Hipfrac dataset. Table 2 summarizes the results. The results in Table 2 show that tMeta and SKM-Meta obtain significantly better BIC than the other methods and SKM-Meta wins by a narrow margin. In terms of computational efficiency among the five robust methods, tMeta is the fastest while tRE-Meta and MIX-Meta are the slowest runners. Figure 1(d) shows the evolution of log-likelihood $\mathcal {L}$
versus number of iterations when fitting tMeta. It can be seen from Figure 1(d) that tMeta converges within 6 iterations on this dataset.
$\mathcal {L}$
versus number of iterations when fitting tMeta. It can be seen from Figure 1(d) that tMeta converges within 6 iterations on this dataset.
Results of parameter estimates, negative log-likelihood, BIC, and CPU time (in seconds) by various methods on Hipfrac dataset
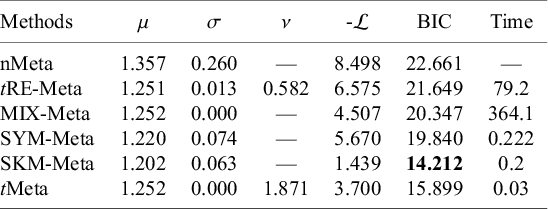
Note: The best method is shown in boldface. ‘—’ indicates that a method does not have corresponding results.
Figure 3 shows the results of detecting outliers by the five methods. It can be seen from Figure 3 that both tMeta and tRE-Meta identify study 17 as an outlier. This result is consistent with that obtained by Lin et al.Reference Lin, Chu and Hodges2 In contrast, MIX-Meta identifies one more outlier: study 9, while SYM-Meta and SKM-Meta fail completely.
Results on outlier detection by various methods on Hipfrac dataset: (a) tMeta; (b) tRE-Meta; (c) MIX-Meta; (d) SYM-Meta; (e) SKM-Meta. The vertical line indicates the critical value for tMeta (red) and the threshold 0.9 (magenta) for MIX-Meta. The vertical line indicates the critical value for tMeta and the threshold 0.9 for MIX-Meta. The marker solid point $\bullet $
in blue represents normal studies judged by a method. Star ‘*’ signals outlying studies, with red for tMeta and magenta for the other methods.
$\bullet $
in blue represents normal studies judged by a method. Star ‘*’ signals outlying studies, with red for tMeta and magenta for the other methods.
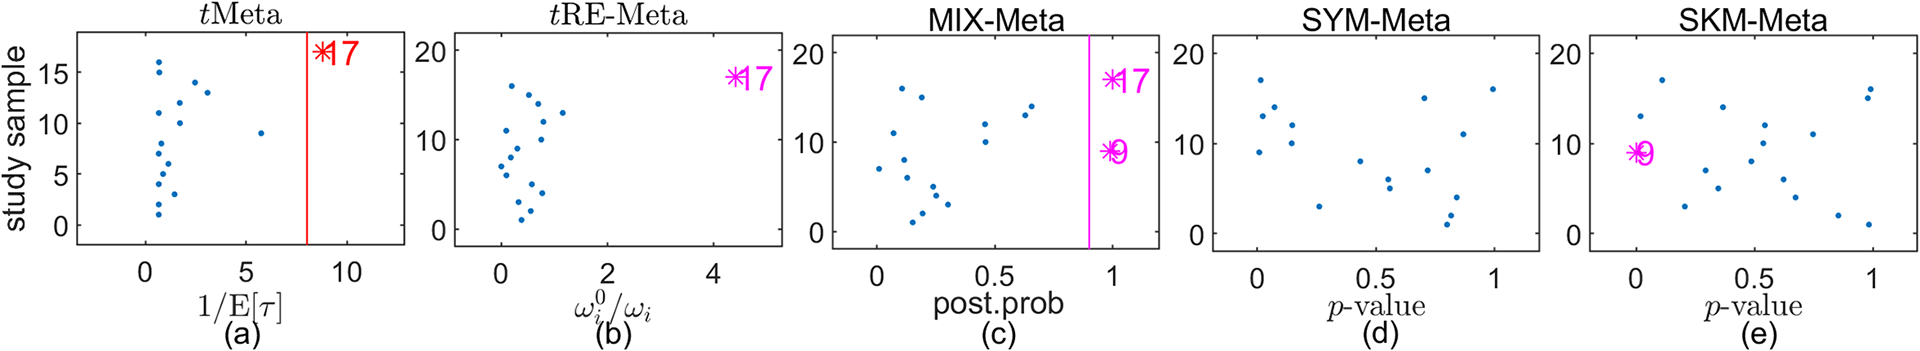
It is interesting to make a further comparison between tMeta and tRE-Meta. From Figure 3(a), it can be seen that tMeta detects that study 9 as being close to an outlier, while it is not the case by tRE-Meta from Figure 3(b). In fact, Lin et al.Reference Lin, Chu and Hodges2 have considered study 9 as a potential outlier and perform a sensitivity analysis by removing this study. As a result, they found that study 9 is not influential. Therefore, the result by tMeta is well match that obtained by Lin et al.Reference Lin, Chu and Hodges2
4.3 Fluoride toothpaste
This dataset contains 70 studies, obtained from an evaluation of fluoride’s efficacy in preventing childhood dental caries.Reference Marinho, Higgins, Logan and Sheiham24 The effect size $y_i$
denotes the difference between control and treatment groups, with negative values signifying significant therapeutic effects.
$y_i$
denotes the difference between control and treatment groups, with negative values signifying significant therapeutic effects.
Previous worksReference Beath1, Reference Gumedze and Jackson6, Reference Baker and Jackson12 have concluded that there exist three outliers in this dataset: study 63, study 50 and study 38. Contrarily, the analysis with SKM-Meta suggests no outliers in the dataset.Reference Baker and Jackson13 To better examine the outlier detection performance by various methods, we shall perform two experiments in this section. In the first experiment of Section 4.3, we use the original dataset (Flu). In the second experiment of Section 4.3, we add the original dataset with one more artificial outlier. The resulting dataset is called modified Flu for clarity.
4.3.1 Original Flu
Figure 4(a) shows the forest plot of the original dataset Flu. It can be observed from Figure 4(a) that studies 38, 50, and 63 look like abnormal. We then perform further analysis to identify outliers.
Top row: forest plots on the fluoride toothpaste dataset: (a) Flu and (b) modified Flu, where each effect size $y_i$
and 95% confidence interval are shown as circle and solid line, respectively. Bottom row: evolement of log-likelihood of
$y_i$
and 95% confidence interval are shown as circle and solid line, respectively. Bottom row: evolement of log-likelihood of $\mathcal {L}$
versus number of iterations: (c) Flu and (d) modified Flu.
$\mathcal {L}$
versus number of iterations: (c) Flu and (d) modified Flu.
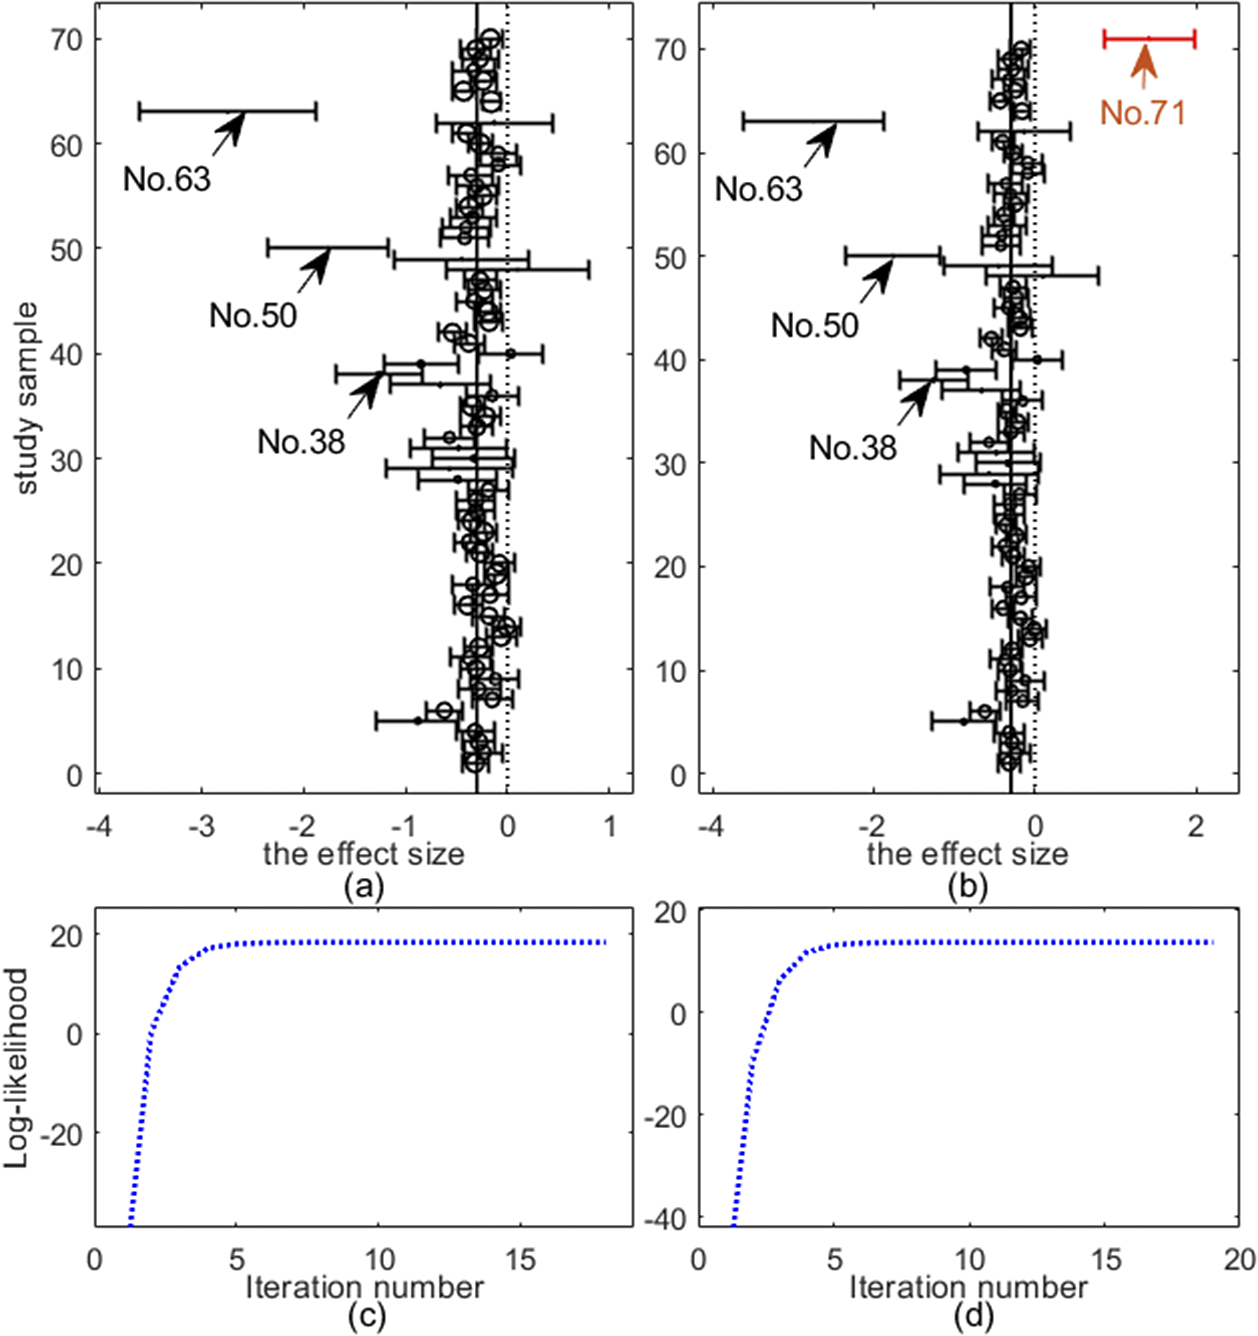
We fit all the six methods on Flu. Table 3 summarizes the results. The results in Table 3 show that tMeta, SYM-Meta and SKM-Meta obtain substantially better BIC than the other methods and SKM-Meta is again the best. Among the five robust methods, tMeta is the most computationally efficient while tRE-Meta and MIX-Meta are the most inefficient. Figure 4(c) shows the evolution of log-likelihood $\mathcal {L}$
versus number of iterations when fitting tMeta. It can be seen from Figure 4(c) that tMeta converges within 18 iterations on this dataset.
$\mathcal {L}$
versus number of iterations when fitting tMeta. It can be seen from Figure 4(c) that tMeta converges within 18 iterations on this dataset.
Results by various methods on the original and modified fluoride toothpaste dataset, including parameter estimates, negative log-likelihood, BIC, and CPU time (in seconds)

Note: The best method is shown in boldface. ‘—’ indicates that a method does not have corresponding results.
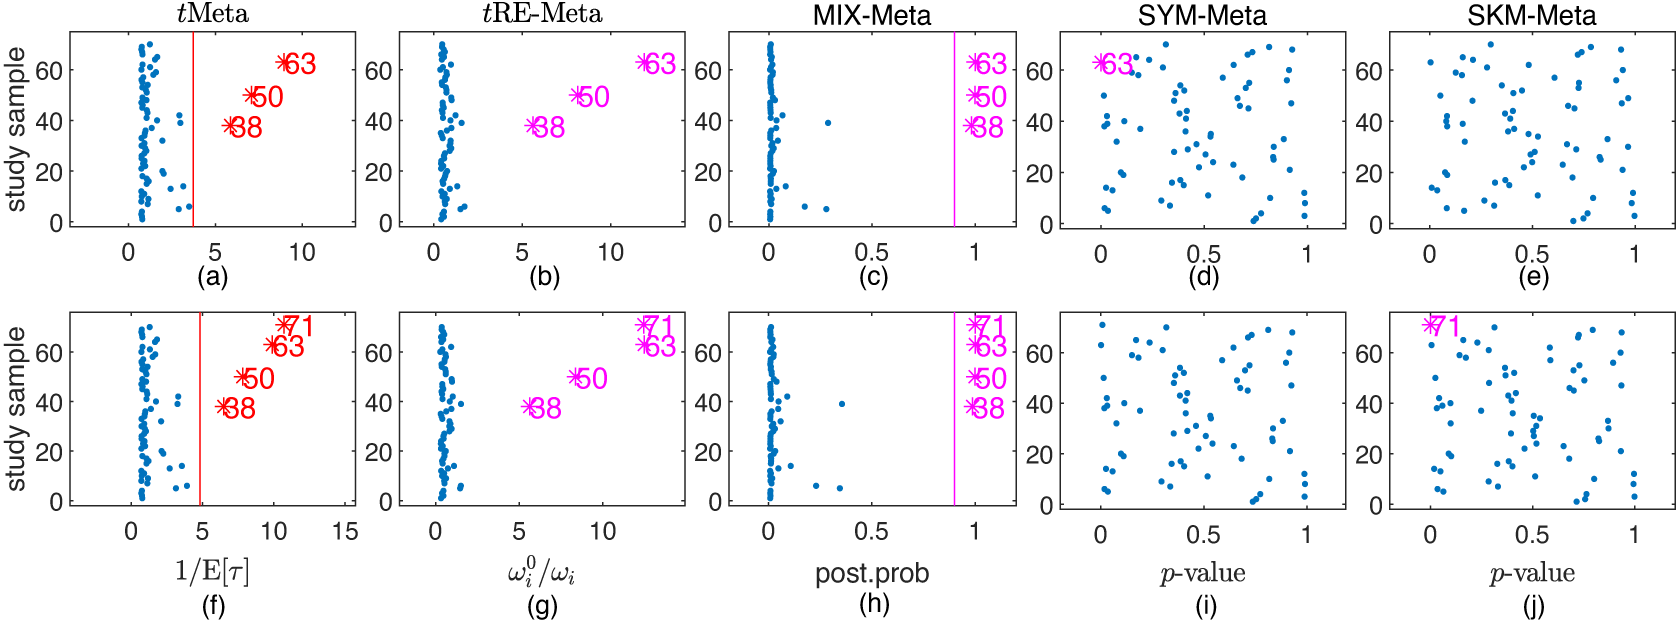
The top row in Figure 5 shows the results of detecting outliers by the five methods. It can be seen from Figure 5 that tMeta, tRE-Meta and MIX-Meta all identify three studies: 63, 50, 38. This means that the result by tMeta is consistent with those in previous works.Reference Beath1, Reference Gumedze and Jackson6, Reference Baker and Jackson12 In contrast, SYM-Meta only detects the most abnormal study 63 as one outlier while SYM-Meta identify no outlier.
4.3.2 Modified Flu
In the modified Flu, the outlier (study 71) is introduced as follows. The effect size $y_{71}$
is generated from the uniform distribution U on the interval
$y_{71}$
is generated from the uniform distribution U on the interval $[1, 2]$
, i.e.,
$[1, 2]$
, i.e., $y_{71}\sim U(1,2)$
. We set its within-study variance
$y_{71}\sim U(1,2)$
. We set its within-study variance $s^2_{71}=1/12$
. Figure 4(b) shows the forest plot of modified Flu, from which it can be seen that the newly added study 71 looks like a mild outlier as it is very different from all the other studies.
$s^2_{71}=1/12$
. Figure 4(b) shows the forest plot of modified Flu, from which it can be seen that the newly added study 71 looks like a mild outlier as it is very different from all the other studies.
Table 3 summarizes the results by six methods. The results in Table 3 show that tMeta yields the best BIC on this dataset, which is then followed by SYM-Meta, and SKM-Meta is the third best. Among the five robust methods, tMeta is again the best performer in computational efficiency while tRE-Meta and MIX-Meta are still the most inefficient. Figure 4(d) shows the evolution of log-likelihood $\mathcal {L}$
versus number of iterations when fitting tMeta. It can be seen from Figure 4(d) that tMeta converges within 19 iterations on this dataset.
$\mathcal {L}$
versus number of iterations when fitting tMeta. It can be seen from Figure 4(d) that tMeta converges within 19 iterations on this dataset.
The bottom row in Figure 5 shows the results of detecting outliers by the five methods. It can be seen from the bottom row of Figure 5 that tMeta, tRE-Meta and MIX-Meta successfully identify four outliers: 71, 63, 50, 38. In contrast, SYM-Meta fails to detect any outlier, while SKM-Meta can detect the newly added study 71.
Results on outlier detection by various methods on fluoride toothpaste dataset. Top row: the original dataset; Bottom row: the modified dataset. (a), (f) tMeta; (b), (g) tRE-Meta; (c), (h) MIX-Meta; (d), (i) SYM-Meta; (e), (j) SKM-Meta. The vertical line indicates the critical value for tMeta and the threshold 0.9 for MIX-Meta. The marker solid point $\bullet $
in blue represents normal studies judged by a method. Star ‘*’ signals outlying studies, with red for tMeta and magenta for the other methods.
$\bullet $
in blue represents normal studies judged by a method. Star ‘*’ signals outlying studies, with red for tMeta and magenta for the other methods.
4.4 CDP-choline
The CDP-choline datasetReference Fioravanti and Yanagi25 is obtained by exploring the cytidinediphosphocholine analysis in cognitive and behavioural disorders associated with chronic brain diseases in the elderly. The sample size is $N=10$
.
$N=10$
.
Previous analysesReference Beath1, Reference Gumedze and Jackson6, Reference Baker and Jackson12 have concluded that there is one outlier in this dataset: study 8. Like Section 4.3, we perform two experiments. In the first experiment of Section 4.4, we use the original dataset (CDP). In the second experiment of Section 4.4, we modify CDP so that it contains more outliers, which is denoted by modified CDP for clarity.
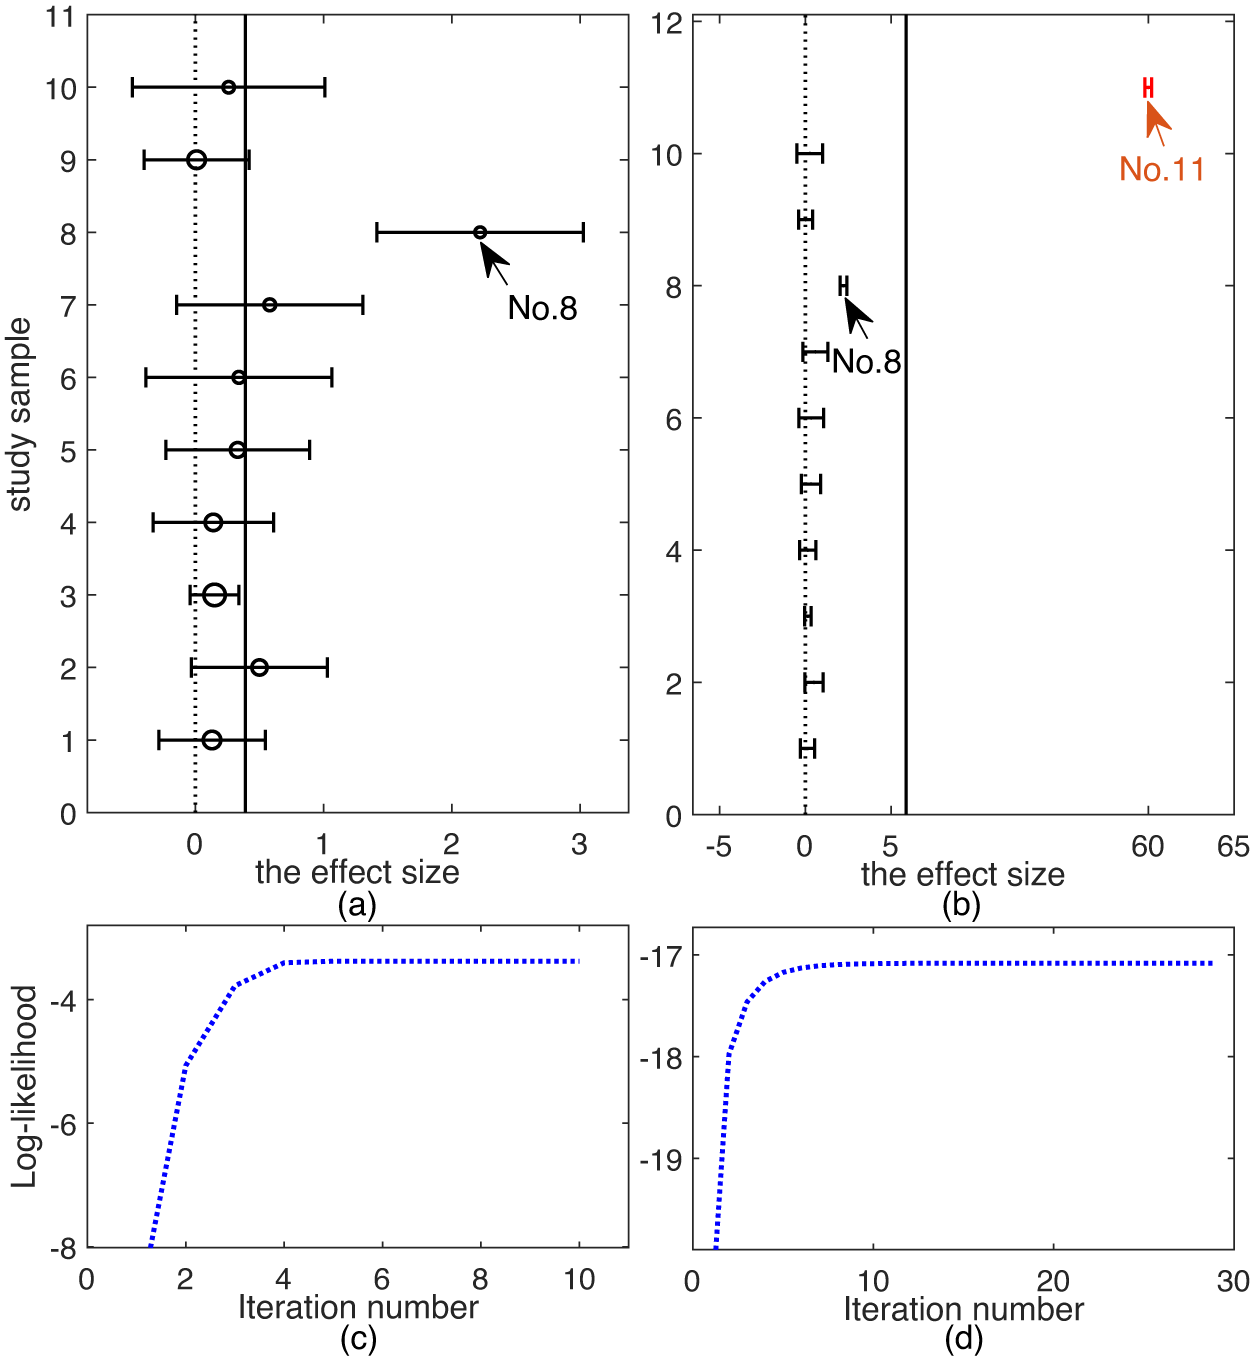
4.4.1 Original CDP
Figure 6(a) shows the forest plot of the original CDP. It can be observed from Figure 6(a) that study 8 looks like abnormal. We then perform further analysis to identify outliers.
Top row: forest plots on CDP-choline dataset: (a) original dataset; (b) modified dataset. Bottom row: evolement of log-likelihood of $\mathcal {L}$
versus number of iterations: (c) original dataset and (d) modified dataset.
$\mathcal {L}$
versus number of iterations: (c) original dataset and (d) modified dataset.
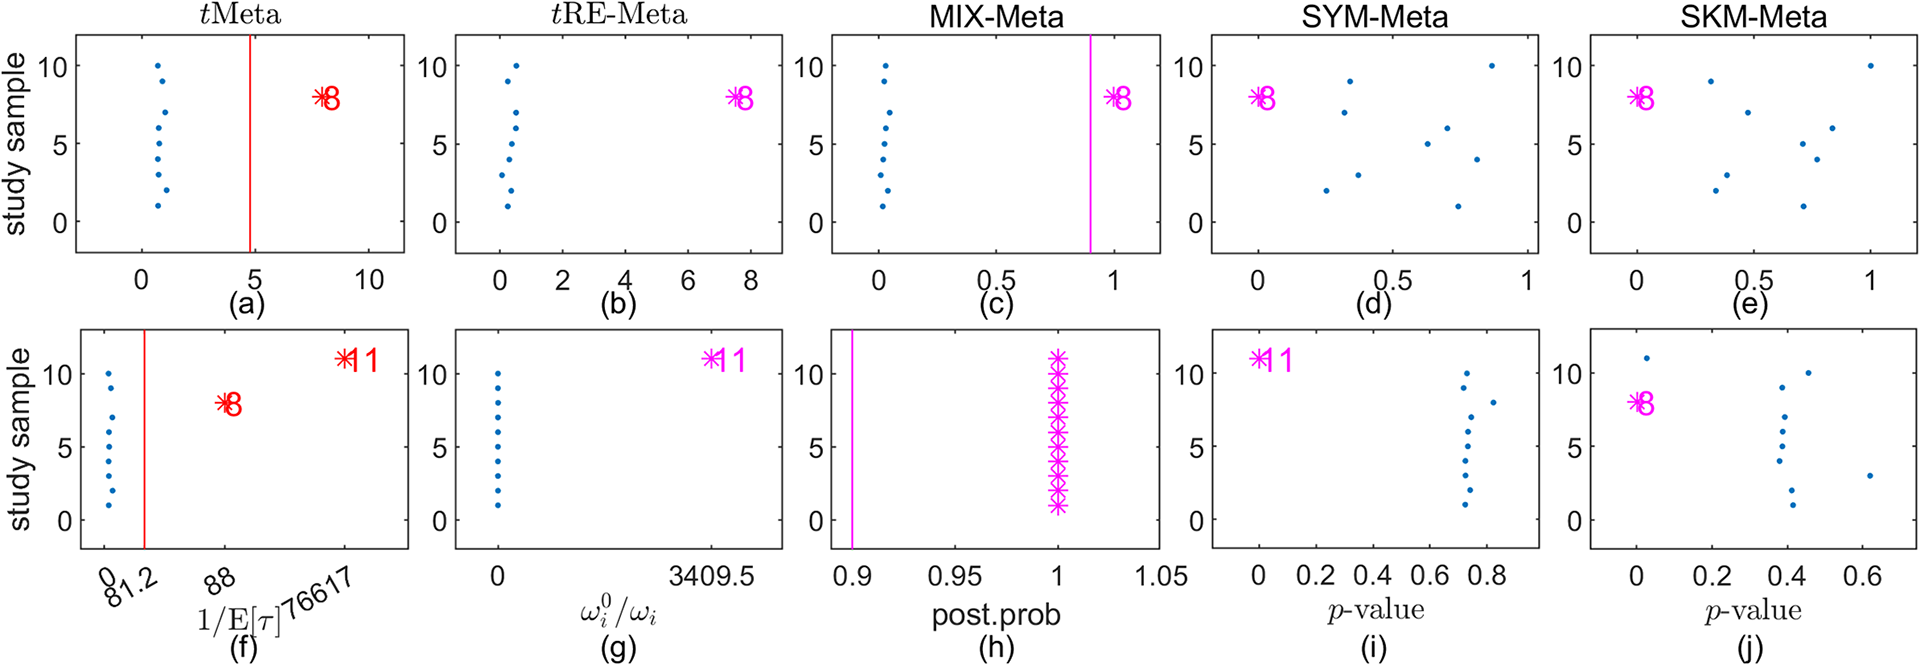
Results on outlier detection by various methods on CDP-choline dataset. Top row: the original dataset; Bottom row: the modified dataset. (a), (f) tMeta; (b), (g) tRE-Meta; (c), (h) MIX-Meta; (d), (i) SYM-Meta; (e), (j) SKM-Meta. The vertical line indicates the critical value for tMeta and the threshold 0.9 for MIX-Meta. The marker solid point $\bullet $
in blue represents normal studies judged by a method. Star ‘*’ signals outlying studies, with red for tMeta and magenta for the other methods.
$\bullet $
in blue represents normal studies judged by a method. Star ‘*’ signals outlying studies, with red for tMeta and magenta for the other methods.
We fit all the six methods on CDP. Table 4 summarizes the results. The results in Table 4 show that tMeta, SYM-Meta and SKM-Meta obtain significantly better BIC than the other methods and SKM-Meta is again the best. In terms of computational efficiency among the five robust methods, tMeta is the most efficient while tRE-Meta and MIX-Meta are the slowest runners. Figure 6(c) shows the evolution of log-likelihood $\mathcal {L}$
versus number of iterations when fitting tMeta. It can be seen from Figure 6(c) that tMeta converges within 10 iterations on this dataset.
$\mathcal {L}$
versus number of iterations when fitting tMeta. It can be seen from Figure 6(c) that tMeta converges within 10 iterations on this dataset.
Results by various methods on the CDP-choline dataset, including parameter estimates, negative log-likelihood, BIC, and CPU time (in seconds)
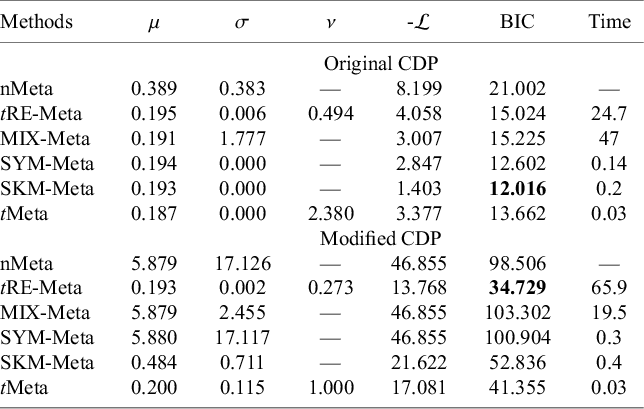
Note: The best method is shown in boldface. ‘—’ indicates that a method does not have corresponding results.
The top row in Figure 7 shows the results of detecting outliers by the five methods. It can be seen from Figure 5 that all the five methods successfully identify study 8 as an outlier. This means that the results by tMeta, SYM-Meta and SKM-Meta are consistent with those in previous works.Reference Beath1, Reference Gumedze and Jackson6, Reference Baker and Jackson12
4.4.2 Modified CDP
In the modified CDP, we make two modifications: (i) add one outlier, namely study 11, which is set as $y_{11}=60, s_{11}^2=0.01$
; (ii) set
$y_{11}=60, s_{11}^2=0.01$
; (ii) set $s_8^2=0.01$
. Figure 6(b) shows the forest plot of modified CDP, from which it can be seen that the newly added study 11 is a gross outlier as it is extremely different from all the other studies and study 8 is a mild outlier but now it has a smaller within-study variance than that in the original CDP.
$s_8^2=0.01$
. Figure 6(b) shows the forest plot of modified CDP, from which it can be seen that the newly added study 11 is a gross outlier as it is extremely different from all the other studies and study 8 is a mild outlier but now it has a smaller within-study variance than that in the original CDP.
Table 4 summarizes the results by six methods. The results in Table 4 show that tRE-Meta and tMeta have better BIC than the other methods on this dataset and tRE-Meta is the best. In terms of computational efficiency among the five robust methods, tMeta is still the most efficient while tRE-Meta and MIX-Meta demand the most time. Figure 6(d) shows the evolution of log-likelihood $\mathcal {L}$
versus number of iterations when fitting tMeta. It can be seen from Figure 6(d) that tMeta requires 29 iterations to converge on this dataset.
$\mathcal {L}$
versus number of iterations when fitting tMeta. It can be seen from Figure 6(d) that tMeta requires 29 iterations to converge on this dataset.
The bottom row in Figure 7 shows the results of detecting outliers by the five methods. It can be seen that tMeta performs reliably as it successfully detects the two outliers: study 11, 8. In contrast, MIX-Meta and SKM-Meta fail to detect the most extreme study 11. tRE-Meta and SYM-Meta can identify study 11 but they fail to detect study 8.
5 Conclusion
For outlier accommodation and detection simultaneously, in this article we propose a novel robust meta-analysis model using student’s t distribution, namely tMeta. tMeta can be expressed as a hierarchical latent variable model while the marginal distribution of the effect size $y_i$
follows a tractable t distribution. To obtain the ML estimates of the parameters, we develop an ECME algorithm, which is computationally much more efficient than related methods as shown in our experiments. Empirical results on real datasets show that tMeta not only improves the robustness of nMeta as expected but also is compared favorably with closely related competitors in that it can provide the best performance for outlier accommodation and detection simultaneously, for both mild and gross outliers.
$y_i$
follows a tractable t distribution. To obtain the ML estimates of the parameters, we develop an ECME algorithm, which is computationally much more efficient than related methods as shown in our experiments. Empirical results on real datasets show that tMeta not only improves the robustness of nMeta as expected but also is compared favorably with closely related competitors in that it can provide the best performance for outlier accommodation and detection simultaneously, for both mild and gross outliers.
The experiment results show that SKM-Meta on some datasets yields better performance in outlier accommodation. For future work it would be interesting to extend tMeta using the skew-t distribution for further accommodating skewed data.
Acknowledgements
The authors thank the Associate Editor and the anonymous reviewers for their insightful comments, which have contributed to an improved version of the manuscript.
Author contributions
Y.W.: Methodology; data curation; formal analysis; investigation; validation; writing—original draft. J.Z.: Conceptualization; methodology; supervision; funding acquisition; writing—review and editing. F.J.: Methodology, investigation, validation, writing—original draft. L.S.: Methodology; funding acquisition; writing—review and editing. J.P.: Resources; funding acquisition; writing – review and editing.
Competing interest statement
The authors declare that no competing interests exist.
Data availability statement
The code to reproduce the results in our experiments is provided in the online supplementary materials and is also available on GitHub: the R code is available at https://github.com/wangyue4127/tmeta-R-code.git, and the MATLAB code can be found at https://github.com/wangyue4127/tmeta.git.
Funding statement
This work was supported partly by the National Natural Science Foundation of China under Grant 12161089, Grant 11931015, Grant 12271471 and Grant 12271047; partly by Yunnan Province ‘Xingdian Talent Support Program’ under Grant of J.H. Zhao and Grant of L. Shi; partly by Yunnan Fundamental Research Projects under Grant 202201AU070105; partly by the Science Foundation of Yunnan University of Finance and Economics under Grant 2021D10 and Grant 2024YUFEYC085; partly by the Science Foundation of Yunnan Educational Department under Grant 2025Y0755 and Grant 2025Y0802; partly by the National Philosophy and Social Science Fund under Grant 22&ZD158 and Grant 22VRCO49; partly by the Guangdong Provincial Key Laboratory of Interdisciplinary Research and Application for Data Science, BNU-HKBU United International College under Grant 2022B1212010006.
Supplementary material
The supplementary material for this article can be found at https://doi.org/10.1017/rsm.2025.8.
A Appendix
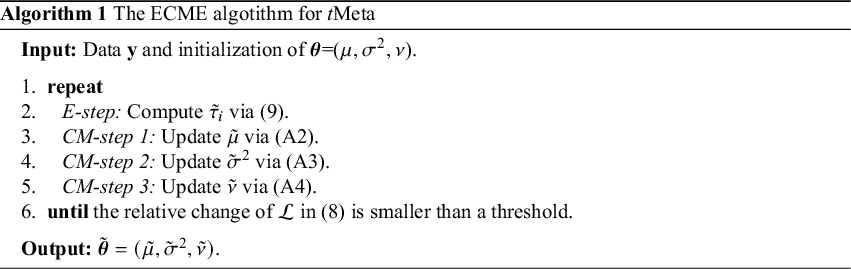
A.1 The proposed ECME algorithm for tMeta
In this subsection, we develop an Expectation Conditional Maximization of Either (ECME) algorithm, a variant of the EM algorithm with faster monotone convergence. [Reference Liu and Rubin15] Our ECME consists of an E-step followed by three conditional maximization (CM)-steps. In each CM step, a parameter in $\boldsymbol {\theta }=(\mu ,\sigma ^2,\nu )$
is maximized while keeping the others fixed.
$\boldsymbol {\theta }=(\mu ,\sigma ^2,\nu )$
is maximized while keeping the others fixed.
Let $\boldsymbol {\tau }=(\tau _1,\ldots ,\tau _N)$
be the missing data. From (3), the log-likelihood function of complete data
$\boldsymbol {\tau }=(\tau _1,\ldots ,\tau _N)$
be the missing data. From (3), the log-likelihood function of complete data $(\mathbf {y},\boldsymbol {\tau })$
is given by
$(\mathbf {y},\boldsymbol {\tau })$
is given by
 $$\begin{align*}\mathcal{L}_c(\boldsymbol{\theta}|\mathbf{y},\boldsymbol{\tau})=\sum\nolimits_{i=1}^N\ln\{p(y_i|\tau_i)p(\tau_i)\}.\end{align*}$$
E-step: Compute the expected complete data log-likelihood function $\mathcal {L}_c$
with respect to the conditional distribution
$\mathcal {L}_c$
with respect to the conditional distribution $p(\boldsymbol {\tau }|\mathbf {y},\boldsymbol {\theta })$
,
$p(\boldsymbol {\tau }|\mathbf {y},\boldsymbol {\theta })$
,
 $$ \begin{align*} \mathcal{Q}(\boldsymbol{\theta})=\mathbb{E}[\mathcal{L}_{c}(\boldsymbol{\theta}|\mathbf{y}, \boldsymbol{\tau})|\mathbf{y}]=\mathcal{Q}_1(\mu,\sigma^2)+\mathcal{Q}_2(\nu), \end{align*} $$
where, up to a constant
 $$ \begin{align} \hskip-1.5em \mathcal{Q}_1(\mu,\sigma^2) = -\frac12\sum\nolimits_{i=1}^N\left\{\ln(\sigma^2+s^{2}_i)+ \mathbb{E}[\tau_i|y_i]{\delta^{2}_i(\mu,\sigma^{2})}\right\}. \end{align} $$
Here, $\delta ^{2}_i(\mu ,\sigma ^{2})$
is given by (7). The required conditional expectation can be obtained by (9).
$\delta ^{2}_i(\mu ,\sigma ^{2})$
is given by (7). The required conditional expectation can be obtained by (9).
In our ECME, the first two CM-steps maximize $\mathcal {Q}$
while the third CM-step maximize
$\mathcal {Q}$
while the third CM-step maximize $\mathcal {L}$
. In detail,
$\mathcal {L}$
. In detail,
CM-step 1: Given $(\sigma ^2, \nu )$
, maximize
$(\sigma ^2, \nu )$
, maximize $\mathcal {Q}_1$
in (A.1) with respect to
$\mathcal {Q}_1$
in (A.1) with respect to $\mu $
yielding
$\mu $
yielding
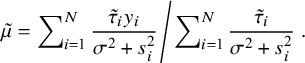 $$ \begin{align} \left.\tilde{\mu}=\sum\nolimits_{i=1}^N\frac{\tilde{\tau}_i y_i}{\sigma^2+s^2_i}\middle/\sum\nolimits_{i=1}^N\frac{\tilde{\tau}_i}{\sigma^2+s^2_i}\right.. \end{align} $$
CM-step 2: Given $(\tilde {\mu }, \nu )$
, maximize
$(\tilde {\mu }, \nu )$
, maximize $\mathcal {Q}_1$
in (A.1) with respect to
$\mathcal {Q}_1$
in (A.1) with respect to $\sigma ^2$
under the same restriction
$\sigma ^2$
under the same restriction $\tilde {\sigma }^2\geq 0$
as in nMeta, [Reference Shi, Zuo, Yu and Zhou9] yielding
$\tilde {\sigma }^2\geq 0$
as in nMeta, [Reference Shi, Zuo, Yu and Zhou9] yielding
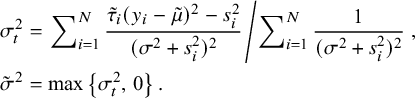 $$ \begin{align} \sigma^2_t&=\left.\sum\nolimits_{i=1}^N\frac{\tilde{\tau}_i (y_i-\tilde{\mu})^2-s^2_i}{(\sigma^2+s^2_i)^2}\middle/\sum\nolimits_{i=1}^N\frac{1}{(\sigma^2+s^2_i)^2}\right.,\nonumber\\ \tilde{\sigma}^2&=\max\left\{\sigma^2_t,\,0 \right\}. \end{align} $$
CM-step 3: Given $(\tilde {\mu }, \tilde {\sigma }^2)$
, maximize the observed data log-likelihood function
$(\tilde {\mu }, \tilde {\sigma }^2)$
, maximize the observed data log-likelihood function $\mathcal {L}$
in (8) w.r.t.
$\mathcal {L}$
in (8) w.r.t. $\nu $
. This is equivalent to finding the root of the following equation
$\nu $
. This is equivalent to finding the root of the following equation
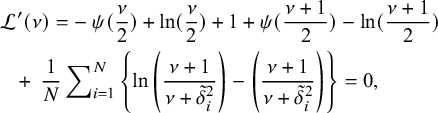 $$ \begin{align} \mathcal{L}'(\nu)&= -\>\psi(\frac{\nu}2)+\ln(\frac{\nu}2)+1+\psi(\frac{\nu+1}{2})-\ln(\frac{\nu+1}{2})\nonumber\\ &\hskip-1.7em +\>\frac{1}{N}\sum\nolimits_{i=1}^N\left\lbrace\ln\left( \frac{\nu+1}{\nu+{\tilde{\delta}^2_i}}\right)-\left(\frac{\nu+1}{\nu+{\tilde{\delta}^2_i}}\right) \right\rbrace=0, \end{align} $$
where $\tilde {\delta }^{2}_i=\delta _i^2(\tilde {\mu },\tilde {\sigma }^2)$
, and
$\tilde {\delta }^{2}_i=\delta _i^2(\tilde {\mu },\tilde {\sigma }^2)$
, and $\psi (x)={d\ln (\Gamma (x))}/{dx}$
is the digamma function. Solving (A.4) only requires one-dimensional search, which can be performed, e.g., by the bisection method. [Reference Liu and Rubin15]
$\psi (x)={d\ln (\Gamma (x))}/{dx}$
is the digamma function. Solving (A.4) only requires one-dimensional search, which can be performed, e.g., by the bisection method. [Reference Liu and Rubin15]
For clarity, the complete ECME algorithm is summarized in Algorithm 1.
A.2 Proof for Proposition 2
Proof. For ML estimate $\hat {\boldsymbol {\theta }}$
, multiplying (9) by
$\hat {\boldsymbol {\theta }}$
, multiplying (9) by $\hat {\nu }+\delta ^2_i(\hat {\mu },\sigma ^2)$
, we obtain
$\hat {\nu }+\delta ^2_i(\hat {\mu },\sigma ^2)$
, we obtain
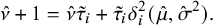 $$ \begin{align} \hat{\nu}+1=\hat{\nu}\tilde{\tau}_i+\tilde{\tau}_i{\delta_i^{2}}(\hat{\mu},\hat{\sigma}^2). \end{align} $$
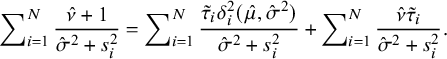
On both sides of (A.3), multiply by $\sum \nolimits ^N_{i=1}1/(\hat {\sigma }^2+s^2_i)^2$
and then add
$\sum \nolimits ^N_{i=1}1/(\hat {\sigma }^2+s^2_i)^2$
and then add $\sum \nolimits ^N_{i=1}s^2_i/(\hat {\sigma }^2+s^2_i)^2$
. On noting (7), when
$\sum \nolimits ^N_{i=1}s^2_i/(\hat {\sigma }^2+s^2_i)^2$
. On noting (7), when $\hat {\sigma }^2>0$
, we have
$\hat {\sigma }^2>0$
, we have
 $$ \begin{align} \sum\nolimits_{i=1}^N\frac{\tilde{\tau}_i\delta^2_i(\hat{\mu},\hat{\sigma}^2)}{\hat{\sigma}^2+s^2_i}=\sum\nolimits_{i=1}^N\frac1{\hat{\sigma}^2+s^2_i}, \end{align} $$
and when $\hat {\sigma }^2=0$
, we have
$\hat {\sigma }^2=0$
, we have
 $$ \begin{align} \sum\nolimits_{i=1}^N\frac{\tilde{\tau}_i\delta^2_i(\hat{\mu},\hat{\sigma}^2)}{\hat{\sigma}^2+s^2_i} \leq\sum\nolimits_{i=1}^N\frac1{\hat{\sigma}^2+s^2_i}. \end{align} $$
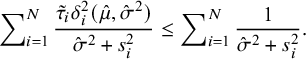
On both sides of (A.5), divide by $\hat {\sigma }^2+s^2_i$
and take the sum over i from 1 to N, yielding
$\hat {\sigma }^2+s^2_i$
and take the sum over i from 1 to N, yielding
 $$ \begin{align} \hskip-1.5em\sum\nolimits_{i=1}^N\frac{\hat{\nu}+1}{\hat{\sigma}^2+s^2_i}=\sum\nolimits_{i=1}^N \frac{\tilde{\tau}_i{\delta_i^{2}}(\hat{\mu},\hat{\sigma}^2)}{\hat{\sigma}^2+s^2_i}+ \sum\nolimits_{i=1}^N\frac{\hat{\nu}\tilde{\tau}_i}{\hat{\sigma}^2+s^2_i}. \end{align} $$
Substituting (A.6) and (A.7) into (A.8), respectively, we obtain, when $\hat {\sigma }^2>0$
,
$\hat {\sigma }^2>0$
,
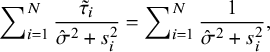 $$ \begin{align} \sum\nolimits_{i=1}^N\frac{\tilde{\tau}_i}{\hat{\sigma}^2+s^2_i}=\sum\nolimits_{i=1}^N\frac{1}{\hat{\sigma}^2+s^2_i}, \end{align} $$
and when $\hat {\sigma }^2=0$
,
$\hat {\sigma }^2=0$
,
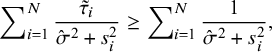 $$ \begin{align} \sum\nolimits_{i=1}^N\frac{\tilde{\tau}_i}{\hat{\sigma}^2+s^2_i}\geq\sum\nolimits_{i=1}^N\frac{1}{\hat{\sigma}^2+s^2_i}, \end{align} $$
When $\hat {\sigma }^2>0$
, from (A.9) we have
$\hat {\sigma }^2>0$
, from (A.9) we have
 $$\begin{align*} \frac1N\sum\nolimits_{i=1}^Nu_i\tilde{\tau}_i=1, \end{align*}$$
and when $\hat {\sigma }^2=0$
, from (A.10) we have
$\hat {\sigma }^2=0$
, from (A.10) we have
 $$ \begin{align*} \frac1N\sum\nolimits_{i=1}^Nu_i\tilde{\tau}_i\geq1. \end{align*} $$
where $u_i$
is given by (10). This completes the proof.
$u_i$
is given by (10). This completes the proof.


 Open access