


Introduction
Political equality among all citizens is one of the primary tenets of democratic theory. Democracy rests on the notion that all citizens ‘must be counted as equal in weight’ (Dahl, Reference Dahl1989) and must be able to ‘exercise equal influence’ over collective decisions (Przeworski, Reference Przeworski2010). From this principle follows the notion that legislators should be equally responsive to the preferences of all citizens, regardless of their class, race, education and place of origin. However, despite this normative ideal, empirical evidence consistently reveals disparities in how legislators respond to the preferences of different groups, highlighting the gaps between democratic theory and the reality of political representation (Gallego, Reference Gallego2015; Carnes, Reference Carnes2013; Broockman, Reference Broockman2014; Wolkenstein & Wratil, Reference Wolkenstein and Wratil2021).
Legislators navigate competing demands in their approach to representation. Beyond the constraints imposed by party‐level institutions and the demands of party leaders (Carey, Reference Carey2007), representatives have three focal points: territoriality‐defined interests, functional or group‐based interests and the individual interests of their voters (Eulau & Karps, Reference Eulau and Karps1977). In this paper, we focus on the representation of territorial‐defined interests. More specifically, we aim to understand the rationale behind legislators' decisions regarding which specific areas within their electoral districts they choose to represent and how these choices contribute to place‐based representation inequalities. While representation inequalities extend beyond geography, this paper focuses specifically on the geographic dimension, as it plays a crucial role in shaping the distribution of resources and political influence.
Studies on the interplay of geography and representation have focused primarily on majoritarian systems. Scholars show that single‐member districts create a territorial bias in representation (Rodden, Reference Rodden2010; Calvo & Rodden, Reference Calvo and Rodden2015; Rogers, Reference Rogers2016), which leads to the amplification of the voices from rural communities at the expense of urban areas (Ahmed, Reference Ahmed2013; Rodden, Reference Rodden2019). However, districted proportional representation (PR) systems make up 70 per cent of electoral systems worldwide (Bormann & Golder, Reference Bormann and Golder2022). Crucially, our knowledge of the influence of geography on representation in these systems remains much less developed. Existing work has focused mainly the impact of representatives' hometowns (Fiva et al., Reference Fiva, Halse and Smith2021; Carella & Eggers, Reference Carella and Eggers2024) and the impact of district magnitude on different outcomes (Shugart et al., Reference Shugart, Valdini and Suominen2005; Crisp & Silva, Reference Crisp and Silva2023). Two notable exceptions are the forays of Monroe and Rose (Reference Monroe and Rose2002) and Kedar et al. (Reference Kedar, Harsgor and Sheinerman2016) into the matter. Both studies highlight the impact of the coexistence of high and low magnitude within the same system on representation. Their findings show that political parties forgo urban interests in favour of rural ones because the latter offers more vote and office benefits. However, both papers only examine inequalities between electoral districts, treating every place inside those districts equally.
There are two conceptual and empirical problems in this body of work, which we address in this paper as part of our contribution. First, scholars use electoral districts' ‘average resident’ or ‘the median voter’ to model representation dynamics, which has ramifications and potential bias for empirical results (Nemerever & Rogers, Reference Nemerever and Rogers2021; Lee & Rogers, Reference Lee and Rogers2019). Put simply, the aggregation scale has implications for results. If we change the scale of aggregation, we change the observed patterns of representation and, in turn, the conclusions about inequalities. Second, and crucially for this paper, existing work overlooks within‐district heterogeneity, that is, the coexistence of highly different municipalities inside the same electoral district. If geography were irrelevant for representation, in any given district, voters who share a similar set of representatives would receive similar representation benefits based on a set of features – party preference, education, income and the biases of representatives – regardless of where they live.
There is a strong argument for looking inside electoral districts in districted PR systems and using municipalities as the unit of analysis. In proportional systems, districts are typically more populous than their majoritarian counterparts, primarily because they encompass larger areas. This increased size heightens the potential for competing demands, meaning a greater likelihood that social groups with opposing preferences coexist within the same district (Fenno, Reference Fenno1977; Bishin, Reference Bishin2009). In many districted PR systems, electoral districts contain simultaneously large cities and small villages, suburban and rural areas, regions with high industrial activity and agricultural regions. Consider the following example. The Spanish electoral district of Valencia is made up of 266 municipalities, including the capital and largest city, Valencia (over 700,000 residents), as well as small towns and villages, such as Carricola with only 100 inhabitants. Although living in the same electoral districts and sharing the same set of representatives, voters are likely to have different preferences based on the social and economic context in which they live (Maxwell, Reference Maxwell2019; Cantoni & Pons, Reference Cantoni and Pons2022).
We contribute to the literature on representation, electoral systems, elite behaviour and political inequalities. Our goal is to understand representatives' choices against the backdrop of heterogeneous electoral districts in districted PR systems. We use legislative debates over 20 years to answer the following research question: Do representatives provide fair and PR to each municipality in their district, or, instead, do they favour some places, creating winners and losers of representation? We argue that representatives deviate from proportionality in their place‐based representation because electoral incentives motivate them to favour some places within their district, inevitably making other places the losers of representation. Further, we expect that affluent municipalities with higher levels of income and education will receive more attention. These inequalities emerge because representatives calculate the costs against the benefits of dedicating time and effort to mobilize and persuade voters across different district areas (Cox, Reference Cox1999; Fiva et al., Reference Fiva, Halse and Smith2021).
We use a new empirical method for identifying place‐based representation in political speech, which can also be applied to other countries and allows for both geographical depth and breadth. Combining a Named Entity Recognition (NER) tool with Google Places data allows us to identify explicit geographical markers in text and non‐explicit references to organizations, places and entities that can be pinned down to a particular municipality. In other words, we go much further than simply counting place names and also include all references in political speeches to schools, universities, companies, infrastructures, hospitals and factories (and many other entities), which can be marked as located in a specific place through Google Places. This innovative method can be applied to both majoritarian and proportional systems and lays the groundwork for future research on geographic political inequalities from a comparative perspective.
Empirically, we select Portugal as a case study, which offers an appropriate institutional context for our analytical purposes with a combination of closed‐list districted PR and relatively low levels of malapportionment, all of which should make geographic representation less likely than in majority systems. At the same time, Portugal offers an unusually high variance in district magnitude, thus featuring groups of low‐, medium‐ and high‐magnitude districts, which lends itself to observing place‐based representation at different levels of magnitude and in different types of districts.
Our findings show that representatives deviate significantly from the normative idea that all citizens should receive equal representation. First, contrary to received wisdom (Rodden, Reference Rodden2019; Kedar et al., Reference Kedar, Harsgor and Sheinerman2016), we show that both urban and rural interests receive a fair representation, at least when we focus on legislative debates and parliamentary representation. Results demonstrate that these areas are often overrepresented. Looking inside electoral districts, we show that medium‐sized cities, including suburban peripheries of major metropolitan areas, are the losers of representation. Representing large places in proportion to their size carries high costs in terms of time and effort, but the potential electoral benefits for representatives are also very high. Large municipalities encompass substantial segments of potential voters and constitute a significant portion of the district's total electorate. In contrast, although small places do not account for many votes, their residents often possess stronger place‐based identities, which facilitates mobilization and persuasion through place‐based representation (Latner & McGann, Reference Latner and McGann2005; Munis, Reference Munis2022). Consequently, representing small places yields a higher electoral return on effort compared to medium‐sized towns.
Second, the results indicate that areas with higher proportions of university degree holders are systematically overrepresented in the national parliament. Our within‐district analysis suggests that education plays a more significant role than income in shaping place‐based inequalities in political representation. Specifically, legislators disproportionately cater to more educated areas, a trend consistent with recent research on educational inequalities in advanced democracies (Bosancianu, Reference Bosancianu2017; Gethin et al., Reference Gethin, Martínez‐Toledano and Piketty2022). This finding is normatively significant as it enhances our understanding of political inequalities by revealing which citizens and areas are systematically neglected within districts.
As place‐based identities and representation gain increasing political salience, this evidence becomes crucial for formulating claims or developing theories about geographical inequalities in politics and their potential role in fuelling populism and discontent. Such claims are frequently advanced by both academics and political actors. However, our findings diverge significantly from established notions about which places are considered ‘losers’ and ‘winners’ in the current political landscape. This discrepancy calls for caution and a more nuanced perspective on political dynamics.
Geography, institutions and representation
Representation is multi‐dimensional and complex. Legislators have competing demands to cater to political parties and territorial, group based and individual interests (Eulau & Karps, Reference Eulau and Karps1977; Carey, Reference Carey2007). Territorial representation happens primarily in electoral districts (Rehfeld, Reference Rehfeld2005). Where citizens live matters. Studies on government spending, subsidies and pork barrel illustrate the interaction behind political institutions and geographical concentration of population and interests (Rickard, Reference Rickard2018; Jurado & Leon, Reference Jurado and Leon2019; Tromborg & Schwindt‐Bayer, Reference Tromborg and Schwindt‐Bayer2022). While in majoritarian systems, geographically concentrated interests receive larger shares of government spending, in PR systems, geographically diffuse and narrow interests might be the relative winners in relation to concentrated ones. Nonetheless, recent work suggests that locally targeted spending also happens in PR as a mechanism for parties and legislators to cultivate vote‐seeking activities (Tavits, Reference Tavits2009; Fiva & Halse, Reference Fiva and Halse2016; Rickard, Reference Rickard2018; Catalinac & Motolinia, Reference Catalinac and Motolinia2021). Furthermore, in a majoritarian system, received wisdom shows that rural and conservative interests benefit from having fewer wasted votes thanks to the geographical clustering of voters and interests across electoral districts (Calvo, Reference Calvo2009; Chen & Rodden, Reference Chen and Rodden2013; Calvo & Rodden, Reference Calvo and Rodden2015; Rodden, Reference Rodden2019).
In their seminal works, Monroe and Rose (Reference Monroe and Rose2002) and Kedar et al. (Reference Kedar, Harsgor and Sheinerman2016) made important contributions to our understanding of the complexities of the interplay between geography and representation in proportional systems. The authors show that within the same system different representation dynamics co‐exist. In the same country, small‐magnitude districts have a quasi‐majoritarian type of electoral competition. In contrast, large‐magnitude districts have a strong proportional competition dynamic. Therefore, like in majoritarian systems, urban interests tend to be disadvantaged relative to rural districts in converting votes into seats because the latter usually have lower magnitudes. Furthermore, partisan support distributions might correlate with a country's urban–rural divisions, favouring rightist parties whose support is typically more substantial in rural areas and smaller districts. For all their importance, these studies overlook the socio‐economic and political heterogeneity within electoral districts, treating them as black boxes, as if the median voter at the district level were representative of the plethora of preferences and interests inside it.
The importance of geography and place‐based motivations has looming implications for voters' attitudes and behaviour, which creates incentives for political elites to adapt their behavioural strategies against the rules of the game. Consequently, in their legislative activities, representatives will most likely, strategically or intrinsically, incorporate a place‐based component in their representation efforts. Studies looking at individual‐level determinants of the importance of geography for representation suggest that voters use their place‐based identities in their voting decisions and forge representation relationships (Schulte‐Cloos & Bauer, Reference Schulte‐Cloos and Bauer2023; Fitzgerald, Reference Fitzgerald2018; Jacobs & Munis, Reference Jacobs and Munis2019). Experimental work shows that sharing a place‐based identity with a candidate outweighs voters' comparative evaluations of candidates, even more so than sex, age, religion or education (Campbell & Cowley, Reference Campbell and Cowley2014). Furthermore, most voters have a communal conception of representation, in which they consider their interests and those of their entire local community (Costa et al., Reference Costa, Johnson and Schaffner2018; Campbell et al., Reference Campbell, Cowley, Vivyan and Wagner2019). Importantly, territorial inequalities in economic opportunities, public services, and residential mobility (Cramer, Reference Cramer2016; Colantone & Stanig, Reference Colantone and Stanig2018b; Patana, Reference Patana2022) generate resentment from the ‘places that do not matter’ against the perceived pro‐urban status quo (Rodríguez‐Pose, Reference Rodríguez‐Pose2018; Munis, Reference Munis2022).
Why we need to look inside electoral districts
Most literature analysing biases in representation, in both majoritarian and proportional systems, uses the district's ‘average resident’ or ‘the median voter’ to model representation dynamics (Nemerever & Rogers, Reference Nemerever and Rogers2021). Even studies on within‐country variation in district magnitude often overlook intra‐district dynamics. In so doing, these studies run into the Modifiable Area Unit Problem (MAUP), that is, a bias in results based on the level of analysis (Gehlke & Biehl, Reference Gehlke and Biehl1934; Lee & Rogers, Reference Lee and Rogers2019). While within‐district representation inequalities are present in both majoritarian and proportional systems, the latter warrants more attention due to its relative neglect in the literature and the more complex, competing demands faced by legislators (André & Depauw, Reference André and Depauw2018; Carozzi & Repetto, Reference Carozzi and Repetto2016; Gimpel et al., Reference Gimpel, Lee and Thorpe2011; Fiva et al., Reference Fiva, Halse and Smith2021).
First, the average number of constituents per electoral district tends to be much higher in proportional systems than in majoritarian systems. For example, the average electoral district in the United Kingdom and France, both majoritarian systems, has approximately 84,000 and 73,000 constituents, respectively. By contrast, in proportional systems like Spain, Portugal and Norway, the average district has approximately 740,000, 464,000, and 204,000 constituents.
Second, while voter‐to‐representative ratios in proportional systems can be similar to those in majoritarian systems, the presence of multiple representatives in large districts introduces a key difference: the decision on which voters or areas to prioritize. Representatives may either distribute attention evenly across the district or focus on electorally significant areas, especially when multiple parties are involved. Coordination among representatives from the same party can lead to uniform representation, but those from different parties need incentives to align their efforts (Crisp & Desposato, Reference Crisp and Desposato2004; Kirkland, Reference Kirkland2012).
Third, in multi‐member districts, legislators have incentives to shirk and free ride on their colleagues' representation efforts (Geese & Martínez‐Cantó, Reference Geese and Martínez‐Cantó2023). In districted‐PR systems, the electoral formula pools votes across the party list, which makes electoral gains non‐divisible allowing all legislators to benefit from district representation work, regardless of their individual contribution. Against this backdrop, political parties serve as an institutional solution to induce cooperative behaviour by monitoring, coordinating and disciplining legislators representing the same district to hamper shirking and free riding (Saalfeld & Strøm, Reference Saalfeld, Strøm, Martin, Saalfeld and Strøm2014; Müller, Reference Müller2000). Thus, even when they establish personalized representation styles, they do it as party agents (Bøggild & Pedersen, Reference Bøggild and Pedersen2018).Footnote 1
Fourth, due to their larger size, electoral districts in proportional systems are more socio‐economically diverse, often encompassing urban, suburban, and rural areas with varying economic activities and income levels. For example, Portugal's Setúbal district includes the agricultural municipality of Odemira, with 29,000 residents and 40 per cent employed in agriculture, and the industrial suburb of Seixal, with 166,000 residents and only 0.26 per cent employed in agriculture. This diversity results in varying representation demands based on distinct economic structures, socio‐economic issues and policy goals.
Fifth, because of population heterogeneity, different political parties are likely to have heterogeneous electoral results across the district, which creates competing incentives about which areas they should privilege. In districted proportional systems, parties have incentives to focus on what Fenno (Reference Fenno1977) dubs ‘sub‐constituencies’, that is, subgroups within constituencies that are particularly relevant for the electoral goals of political parties. In so doing, party elites have incentives to forgo electorally irrelevant district areas.
This discussion leads to two building blocks for our analysis. First, municipalities within the same district vary significantly in their demographic, social, economic and political features, shaping parties' representation strategies. Second, examining representation only at the district‐level masks important within‐district heterogeneity, impacting our understanding of representation failures. Therefore, research must address both between‐district and within‐district inequalities. While within‐district diversity is relevant in both majoritarian and proportional systems, it is especially critical in the latter. The next section will explore how representatives decide which areas to prioritize, and how these decisions lead to geographical biases and representation failures.
Geographical biases in representation
In districted PR systems with large and heterogeneous electoral districts, representatives must decide which areas within their districts to focus on. Due to constraints on time and resources, they cannot provide uniform representation throughout the entire district. Therefore, it is crucial to examine: Which areas do representatives prioritize in their legislative efforts?
We begin our argument by looking at electoral and strategic motivations. When deciding which places within their district to favour, representatives carefully weigh the electoral costs and benefits of their choices. We argue that representatives choose to over‐represent the largest cities in their district, that is, the places with the highest share of a district's total electorate. The spatial concentration of voters in the largest cities makes the persuasion and mobilization efforts efficient insofar as the number of voters that representatives reach with their activities is high (Cox, Reference Cox1999). By speaking to the local concerns of the largest places in their districts, representatives hope to improve electoral support for their party in those places, in a mechanism similar to that associated with ‘friends‐and‐neighbours’ voting (Key, Reference Key1949; Hirano, Reference Hirano2006; Fiva et al., Reference Fiva, Halse and Smith2021). Our explanation for inequalities in place‐based representation in districted PR systems also builds on recent research in the US context showing that representatives ‘follow people and money’ when making strategic decisions on how to allocate political resources in their district, such as the presence of local offices (Kaslovsky, Reference Kaslovsky2022). Further, evidence shows that legislators are disproportionately drawn from large urban centres within their districts, exceeding their population share (Gimpel et al., Reference Gimpel, Lee and Thorpe2011). This overrepresentation increases their likelihood of having extensive knowledge and interest in these areas (Pereira, Reference Pereira2021).
In addition to large cities, municipalities with small populations are also efficient places to deliver representation efforts if we consider the ‘return on effort’ for representatives. Evidence suggests that citizens in small towns often exhibit higher political efficacy and participation in local governance (Dahl & Tufte, Reference Dahl and Tufte1973; Verba, Reference Verba1978; Denters et al., Reference Denters, Goldsmith, Ladner, Mouritzen and Rose2014; McDonnell, Reference McDonnell2020). Although our focus is on national parliament representation, this indicates that residents of small communities are likely to feel more connected to their national representatives. Additionally, small and peripheral places may have a stronger regional identity, leading their citizens to value geographical representation more than those in larger centres (Latner & McGann, Reference Latner and McGann2005; Munis, Reference Munis2022). For parliamentarians, this heightens the electoral benefits of providing place‐based representation to these smaller areas. In addition, although small municipalities represent only a small percentage of the district's total electorate, providing proportional representation requires minimal time and effort. Representatives can achieve moderate to high levels of place‐based representation for these small towns with just a few targeted mentions in their speeches, thereby securing significant electoral benefits.
Once party elites decide which places to over‐represent, the inevitable consequence is the underrepresentation of other areas within the same district. To favour some voters, others must be disadvantaged. It is logically impossible to offer higher‐than‐proportional representation to all. While this effect is a logical outcome of choosing to over‐represent certain places, it remains both empirically and normatively significant to examine the nature of the underrepresented areas within districts.
Who are these losers? Against received wisdom (originating mostly from studies on majoritarian systems), suggesting that large cities are the losers of representation (Rodden, Reference Rodden2019), in districted PR systems, we expect representatives' strategic choices to result in medium‐sized cities being the primary losers in representation. As population size increases, maintaining proportional representation becomes increasingly difficult due to time, labour and party constraints. Representatives face a trade‐off between investing time in medium‐sized cities or in the largest cities within the district. Given the higher electoral value of larger cities, representatives tend to focus their efforts there, leading to a lower ‘return on effort’ for medium‐sized cities. Consequently, representatives prioritize the largest and smallest places for different reasons, resulting in the systematic underrepresentation of medium‐sized cities.
The different dynamics of representation between large‐ and medium‐sized municipalities within the same electoral district can be further illustrated by examining the relative representation of core cities and their suburbs. In many European countries, an electoral district typically includes a major city and its surrounding municipalities, which often serve as residential areas for commuters and have businesses that benefit from proximity to the core city. Despite their significant populations, these peripheral or suburban municipalities often receive less political attention than the core city.Footnote 2 Therefore, suburban peripheries and medium‐sized cities frequently become the losers of representation in proportional representation systems with large electoral districts.
H1: In PR systems, there is a non‐linear U‐shape relationship between population size, as a share of the total district population, and the level of representation that a place receives.
Representatives do not forge their place‐based representation strategy based solely on the population of municipalities. District heterogeneity also implies differences in economic activities, voters' education and their income. Studies show that voters with higher socio‐economic status and levels of education are more likely to participate in politics, including in voting, demonstrating and engaging with political parties and various interest groups and organizations (Schlozman et al., Reference Schlozman, Verba and Brady2012; Gallego, Reference Gallego2015; Hall & Yoder, Reference Hall and Yoder2022). Consequently, representatives might have a strategic incentive to cater disproportionately to these groups and sub‐constituencies, providing them with higher levels of representation. In so doing, representatives have a higher level of ‘return on representation effort’ than if they focus on sub‐constituencies who are less likely to take part in politics.
Beyond strategic considerations, social and personal behavioural biases might lead legislators to focus disproportionately on specific places. Comparative data and multiple single‐country studies show that politicians, including representatives, are more likely to come from privileged backgrounds and disproportionately come from larger, richer and more educated urban centres, at higher percentages than their share of the population (Gimpel et al., Reference Gimpel, Lee and Thorpe2011; Carnes & Lupu, Reference Carnes and Lupu2015; Dal Bó et al., Reference Dal Bó, Finan, Folke, Persson and Rickne2017; Harjunen et al., Reference Harjunen, Saarimaa and Tukiainen2023). Two consequences follow. First, representatives may personally benefit from representing places where they are socially embedded. Second, representatives are also more likely to reflect the views of the voters who live in those places. Recent research indicates that politicians disproportionately focus on privileged voters when considering their constituents (Pereira, Reference Pereira2021). Representatives' group identities and social ties significantly influence whom they address and engage with in parliament, even in highly party‐centred environments (Fiva et al., Reference Fiva, Nedregard and Øien2023). These mechanisms contribute to the overrepresentation of wealthier and more educated areas.
While most research focuses on how representatives consider individual voters or the issues they address, we investigate whether they prioritize certain places over others. We expect that locations with higher income and education levels will receive disproportionately more parliamentary representation. Often, these areas are large urban centres with higher populations, as noted in Hypothesis 1 (Glaeser, Reference Glaeser2011; Denters et al., Reference Denters, Goldsmith, Ladner, Mouritzen and Rose2014). However, the correlation between income, education and population size is not perfect and varies by national and regional context. Thus, a place's education and income levels influence parliamentary representation beyond just population size. Our theory suggests that two places with the same population but differing socio‐economic characteristics, or vice versa, will receive different levels of representation. Additionally, recent research indicates that income and higher education, while related, can create distinct inequalities and have varying impacts on political competition in advanced democracies (Bosancianu, Reference Bosancianu2017; Gethin et al., Reference Gethin, Martínez‐Toledano and Piketty2022). This leads us to our second hypothesis:
H2: Places with higher average incomes and a higher share of population with a university degree will receive disproportionately higher levels of parliamentary representation.
Measuring geographic bias in legislative debates
Measuring geographical bias inside electoral districts is challenging, not least because it requires over time high data granularity for all municipalities. Existing research mostly uses birthplaces or places of residence as proxies to gauge geographical representation at the district‐level and within districts, because they are fairly easy to collect across different countries and there is evidence that voters reward legislators with local connections (Shugart et al., Reference Shugart, Valdini and Suominen2005; Gimpel et al., Reference Gimpel, Lee and Thorpe2011; André & Depauw, Reference André and Depauw2018; Carozzi & Repetto, Reference Carozzi and Repetto2016; Fiva et al., Reference Fiva, Halse and Smith2021). However, for all their usefulness, local roots are also insufficient to fully understand the dyadic relation between representatives and voters. Local roots are fixed attributes that do not always capture the changing behavioural incentives that legislators face at different stages in their careers and changes in local needs over time. When using birthplaces or places of residence, only one town is classified as being represented, even if the legislator works to represent other geographical places through visits, speeches, legislative debates, bills, budget amendments or roll‐call votes. Additionally, Campbell et al. (Reference Campbell, Cowley, Vivyan and Wagner2019) experimentally show that when voters have information about legislators' activities, they discount local roots as a voting cue.
In this paper, we turn to a specific legislative activity – legislative debates–to measure the extent to which legislators prioritize some areas in their electoral district. Legislative debates and speeches are ideal for legislators to cater to geographic sub‐constituencies for several reasons.
First, legislative debates allow legislators to signal responsiveness and establish policy priorities by reading into a public record. Legislative speeches constitute a kind of symbolic representation based on the idea of a politics of presence in parliament. Using legislative speeches, representatives can bring attention to specific local needs and challenges, which makes local voters feel that politicians do not ignore them. Furthermore, legislative debates also contain policy representation, as we include all the parliamentary debates that occur when specific bills and policy proposals are discussed in parliament, including those about public works projects. Second, because of their heterogeneity, frequency and dynamic nature, legislative debates provide higher levels of granularity in the analysis of representation over time and across space. They also allow for both party leaders and rank‐and‐file to take the floor. The latter often deliver party positions tailored to sub‐constituencies, including geographical sub‐constituencies.
Third, research shows that legislators use emotional rhetoric in speeches to engage voters, believing they are listening (Osnabrügge et al., Reference Osnabrügge, Hobolt and Rodon2021; Itzkovitch‐Malka et al., Reference Itzkovitch‐Malka, Mor, Oshri and Shenhav2024). They also use press releases to claim credit and showcase their parliamentary work (Grimmer et al., Reference Grimmer, Messing and Westwood2012). In the age of social media, legislators leverage it as a cost‐effective tool to inform constituents and enhance their image (Ansolabehere & Kuriwaki, Reference Ansolabehere and Kuriwaki2022). Short videos from legislative debates are particularly useful for creating inexpensive content that boosts visibility and electoral benefits (Yildirim et al., Reference Yildirim, Thesen, Jennings and De Vries2023).
While we believe legislative debates are vital tools of representation that should be analysed, we do not claim that they are capable of measuring the whole of representation activities that representatives provide to particular geographical places. Legislators have a plethora of tools at their disposal, including parliamentary questions, bills, budget amendments and dissent in roll‐call votes. Studies show that they use these tools strategically and in a complementary manner – when one tool falls short, they rely on another to better serve their constituencies (Strøm, Reference Strøm1997; Itzkovitch‐Malka et al., Reference Itzkovitch‐Malka, Mor, Oshri and Shenhav2024). We return to this matter in the conclusion.
To measure the extent to which geographical representation matters in legislative behaviour, we gathered data on legislative debates in Portugal. We retrieved data on all speech activity for all legislators in Portugal from 1999 through 2019; we collected data on 79,665 speeches taken from online transcriptions, available on the legislature's website in PDF format; we performed standard cleaning steps, isolating each speech based on the legislator's name and party affiliation; we reorganized our dataset of 79,665 speeches into a balanced panel in which we observed municipalities, our unit of observation, over time. The same municipalities $i$ were observed over $j$ legislative periods.Footnote 3 Our window of observation included six legislative terms. This data transformation left us with 1668 observations.
To answer our research questions, we went beyond a growing body of literature focusing on the number of explicit mentions that legislators make in the legislature to measure how responsive and attentive they are to their district (Martin, Reference Martin2011; Zittel et al., Reference Zittel, Nyhuis and Baumann2019). In contrast, our Place‐based Representation measure captures non‐explicit local mentions and operates at the sub‐district level, as we aimed to capture municipality‐level mentions. Of course, identifying municipality‐level mentions is challenging, not least because traditional explicit measures overlook references to local organizations whose name does not include a geographical marker. For example, while a mention of Universidade do Porto, a university in Porto, can be captured by traditional methods of identifying explicit mentions, if a legislator mentions Escola Garcia da Orta, a secondary school in Porto, a canonical search for geographical markers would fail to identify the municipality to which it belongs.
We overcome this challenge by going beyond merely counting explicit mentions. First, we turn to an NER to map geo‐locations and organizations onto municipalities. NER is an automated processing tool employed in natural language processing (NLP) settings to identify entities in large bodies of text. Consider the example ‘John traveled to New York to visit Columbia University’. Typically, NER classifies ‘John( ${\tt B-PER}$) traveled( ${\tt O}$) to( ${\tt O}$) New( ${\tt B-LOC}$) York( ${\tt I-LOC}$) to visit Columbia( ${\tt B-ORG}$) University( ${\tt I-ORG}$)’, where ${\tt PER}$ stands for ${\tt Person}$, ${\tt LOC}$ for ${\tt Location}$ and ${\tt ORG}$ for ${\tt Organization}$. For this paper, we trained our NER setting to identify geo‐locations and organizations in the Portuguese context. We use the Spacy (Honnibal & Montani, Reference Honnibal and Montani2017) package for Python, one of the most widely used tools for NLP tasks. Spacy operates as a pipeline allowing users to customize the NER component. Spacy permits users to incorporate pre‐trained models for transfer learning tasks. In this paper, we incorporated the BERTimbau model (Souza et al., Reference Souza, Nogueira and Lotufo2020) in our pipeline, a BERT‐based model trained using BrWaC (Brazilian Web as Corpus) containing 2.7 billion tokens. Next, we fine‐tuned our NER task using CINTIL (Barreto et al., Reference Barreto, Branco, Ferreira, Mendes, Nascimento, Nunes and Silva2006). CINTIL is a corpus for the Portuguese (European) language that contains 26,173 manually annotated sentences for persons, locations and organizations entities. Online Appendix B provides technical details of NER.
Next, after identifying the mentions to geo‐locations and organizations using NER, we map them onto Portuguese municipalities. We use a twofold strategy. First, for geo‐locations identified by NER we assign the municipality automatically. We created a dataset of administrative boundaries in Portugal containing district capital cities, municipalities, parishes and localities, which allowed us to match the locations identified using NER with their county.Footnote 4 In this step, we exclude all places that might create ambiguities across municipalities, for example, places with homograph names in different municipalities.Footnote 5 Furthermore, to avoid false positives, we exclude places whose name might be confused with countries, for example, a municipality named Cuba. Our NER unidirectional correspondence between cities, parishes and localities to municipalities includes a total number of 13,719 non‐unique entities.
Of course, if we only use the NER task, we would risk overlooking a significant number of non‐explicit mentions made by legislators on the floor. Thus, we further leverage the Google Places API service to map organizations and locations onto municipalities by using their geo‐coordinates (latitude and longitude). We took advantage of Google Places API functionalities to query physical entities from free text. This process is useful for organizations mentioned in legislative debates for which it is non‐trivial to find a geographical match. For example, Google Places API allows to find and classify a geo‐reference with Porto if a legislator mentions the Escola Garcia da Orta high school or to match the cultural equipment Theatro do Circo with Braga, even if the legislator does not make any place‐based explicit mentions to the cities of Porto and Braga, respectively. Furthermore, Google Places API allows us to maximize the most adequate geo‐reference in highly similar texts. Using the find_place tool, we increased the number of references in legislative debates for which we could map the municipality to 25,327 non‐unique references. To fine‐tune the results of find_place, we set the language parameter to Portuguese while allowing the locationbias parameter to bias the search to Portugal. We define the region as the rectangle made from the farthest south‐western and north‐eastern geographical points in mainland Portugal.
After using these two procedures (NER and Google Places), we find that legislators make a high number of mentions to extremely specific organizations and places in the national parliament. In total, our procedure allows us to identify 11,473 unique references, which legislators mentioned 68,871 times in the 20 years of legislative speech. On average, we observe around 3443 (non‐unique) geographical mentions made in parliament each year. In our window of observation, each unique legislator makes an average of 78.8 references that can be pinpointed to a geographical place.
Our measure assumes that citizens are geographically represented if any place, organization or infrastructure in their municipality is mentioned in parliamentary speeches. While one might contend that a mere indirect reference to a neighbouring municipality could be adequate, such an approach falls short of achieving comprehensive representation. Studies indicate that voters in neighbouring municipalities are acutely aware of local inequalities and may feel overlooked by politicians. Carozzi and Repetto (Reference Carozzi and Repetto2016) contend that legislators are well aware of these intra‐district disparities and strategically adjust their representation efforts accordingly. Place‐based inequalities in representation and local public good provision can significantly impact future economic and social outcomes (Harjunen et al., Reference Harjunen, Saarimaa and Tukiainen2023). Additionally, research shows that voters tend to view representation from a communal perspective, prioritizing their local community's interests over those of neighbouring areas in democratic considerations (Costa et al., Reference Costa, Johnson and Schaffner2018; Campbell et al., Reference Campbell, Cowley, Vivyan and Wagner2019).
Empirical model
We begin from the assumption that a PR of all municipalities would entail the allocation, for each of them, of a share of the total quantity of geographical representation of a district equal to its share of the district's population. We consider this the proportional baseline of representation deriving from a theoretical incentive to pay attention to citizens based on the ‘one citizen, one vote’ notion. If the population of a locality were a perfect predictor of the local level of attention it gets, then legislators would distribute their attention based solely on that criterion. However, our hypotheses adduce arguments against perfect proportionality. Our dependent variable gauges the deviation from perfect proportionality at the district level, specifically measuring how municipalities receive varying levels of local attention due to strategic and behavioural legislative incentives, relative to other municipalities within the same district. We assess deviation at the district level because all legislators are elected within a specific district and must decide which places within their district to prioritize. Additionally, legislators from the same party often coordinate their territorial representation efforts within the district as part of a division of labour.
We operationalize our dependent variable as follows. First, we measure the share of place‐based representation mentions that municipality $i$ receives relative to all geographical mentions made to its district $j$. Second, we measure the share of population that municipality $i$ has relative to the population of the district $j$ it belongs to. Our dependent variable – Deviation from perfect proportionality in place‐based representation – measures the difference between the first and the second numbers, as shown in the formula below. When a municipality is underrepresented relative to its population size (as a share of the district), its deviation from perfect proportionality has a negative sign. When a municipality is overrepresented, our measure takes a positive sign.
 $$\begin{equation*} DPP = {\left(\dfrac{\text{Mentions Municipality}_i}{\text{Mentions District}_J} \right)}-{\left(\dfrac{\text{Population Municipality}_i}{\text{Population District}_J} \right)} \end{equation*}$$
 Our models estimate the predicted Deviation from perfect proportionality based on a series of independent variables. First, we measure the Population (as a share of district), measured as the percentage of population that municipality $i$ accounts for in district $j$ in each period. Data for this variable has been retrieved from official sources from the National Statistical Bureau. Second, we add Average income, which gauges the average individual wage in the municipality during each period. Our models include time‐variant values retrieved from the datasets released by the Ministry of the Economy and the Ministry of Labor. Third, we include a variable measuring the Percentage of population with higher education, retrieved from the National Statistics Bureau, measured as the percentage of population in the municipality with a university degree, during the period in question. Our vector of controls includes two variables. First, we control for the effect of Turnout, measured at the municipality level, as the percentage of registered voters that cast a ballot in the previous election. We include this control because political parties may have incentives to overrepresent municipalities whose voters are more likely to go to the polls based on their past behaviour, not least because they have a better return‐on‐investment for vote‐seeking efforts. Our models include time‐variant data retrieved from the National Electoral Commission. Second, we add a measure of Magnitude, the number of seats that each district elects to parliament, as previous research indicates the importance of this variable in explaining geographic representation. Our models use a log‐transformed version of the variable to account for the skewness of its distribution.
Based on these data, we estimate a panel data regression model with district and legislative session fixed effects. This approach controls for time‐variant events and legislative period‐specific dynamics that could influence the disproportionality of territorial representation. Additionally, we account for unobserved, time‐invariant district‐specific characteristics that impact geographic representation patterns within each district. By controlling for district‐ and time‐specific idiosyncrasies and including a vector of controls to address competing explanations, we isolate the effect of our main independent variables – municipalities' population share, average income, and average education level (university degree) – on their representation levels.
Our approach relies on the selection of observables, which requires caution in causal interpretations. Since we cannot experimentally manipulate the population and socio‐economic characteristics of municipalities, we cannot rule out the possibility that unobserved confounders may influence our results. Despite the limitations of our identification strategy, our study aims to explore outcomes and patterns of political representation that are both empirically and normatively significant. Our observational analysis reveals systematic patterns and biases in representation that have not been previously examined in the literature. Our findings remain robust across various model specifications and measurement strategies, as detailed in Table 1 and Online Appendices F–J. Additionally, in Online Appendix K, we incorporate recent methodological advancements by performing a formal sensitivity analysis to assess the robustness of our results against potential unobserved confounders. This analysis evaluates the magnitude of an unobserved confounder required to entirely reject our findings.
Determinants of place‐based representation at the municipality level in Portugal

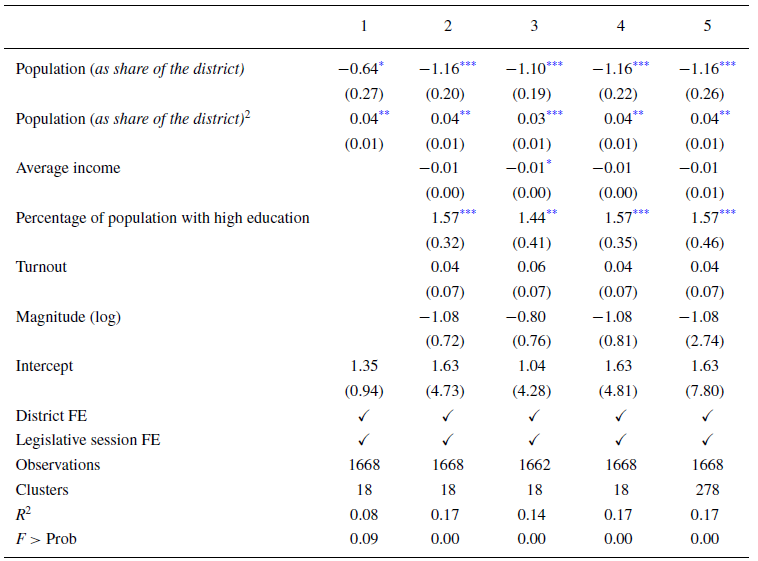
Note: Each column corresponds to a different regression specification. Specification 1 is a baseline specification. Specification 2 includes all independent variables and the control vector. Specification 3 drops Lisbon from the observations. Specification 4 shows a jackknife robustness test at the district level. Specification 5 shows a jackknife robustness test at the municipality level. Heteroscedasticity robust standard errors clustered at the district level in parentheses.
Abbreviation: FE, fixed effects.
*p $<0.05$, **p $<0.01$, ***p $<0.001$.
The Portuguese case
In Portugal, legislative elections use a districted PR system with 22 electoral districts. District magnitude is highly heterogeneous, varying between 2 and 49. The average district elects 11 representatives. Each district contains $n$ municipalities (municípios). Municipalities are nested into districts. In Portugal, there is a 1:1 correspondence between administrative and electoral districts.Footnote 6 Importantly, administrative boundaries have been remarkably stable in Portugal throughout history, which assuages concerns about institutional reforms biasing our results. The geographical boundaries of districts and municipalities may be traced back to the 19th century (Catroga, Reference Catroga2014; Caetano, Reference Caetano1937). The 1945 non‐competitive elections marked a watershed moment with the uncontested emergence of administrative districts as electoral districts. The establishment of free and fair elections in 1974 maintained the role of administrative districts as the primary electoral organization unit. Against a backdrop of political turmoil, the drafters of the first Portuguese democratic electoral law preferred not to politicize the matter. Therefore, we can safely say that there is no gerrymandering of electoral districts in Portugal and that administrative borders are remarkably stable.
Portugal's closed‐list PR electoral system constrains voters to choose only among party labels at the ballot box. There are no mechanisms for voters to punish or reward individual candidates. There are few, if any, incentives to cultivate a personal vote, not least because parties hold the keys for reselection and reelection. The importance of the party label in vote‐seeking activities creates incentives for legislative elites to keep tabs on who takes the floor. Consequently, rules of procedure bestow individual legislators with few rights to take the floor. Party leaders hold the monopoly of selecting legislators to deliver a speech on behalf of the party. Legislators' chief role is to act as an agent for the leadership to shore up the party brand and record the party's official position publicly.
Against this backdrop, Portugal makes for an excellent setting to study territorial representation and geographical biases (Borghetto et al., Reference Borghetto, Santana‐Pereira and Freire2020; Pilet et al., Reference Pilet, Freire and Costa2012). While Portugal falls squarely into the category of cases where geographic representation is less likely than in a majority system, it can also be considered a ‘typical case,’ whose findings can be useful to understand how political elites make choices about whose voices and places to represent. There are several countries, for example, Norway, Spain, Slovenia and South Africa, whose electoral system shares many similarities with Portugal.
Findings
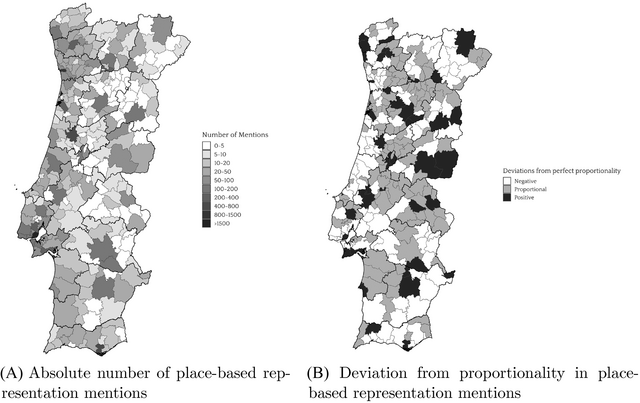
We begin our empirical analysis of geography and representation with descriptive maps. Figure 1 illustrates the average place‐based representation each municipality receives in legislative debates per term. Figure 1a shows the absolute number of mentions, while Figure 1b highlights deviations from PR, defined as when a municipality's mentions align with its population proportion in the district. Our analysis reveals significant variation, with many municipalities being either overrepresented or underrepresented.
Geographical distribution of place‐based representation at the national level in Portugal.
Note: Figures (a) and (b) show average values between 1999 and 2019 of our two empirical indicators at the national level.

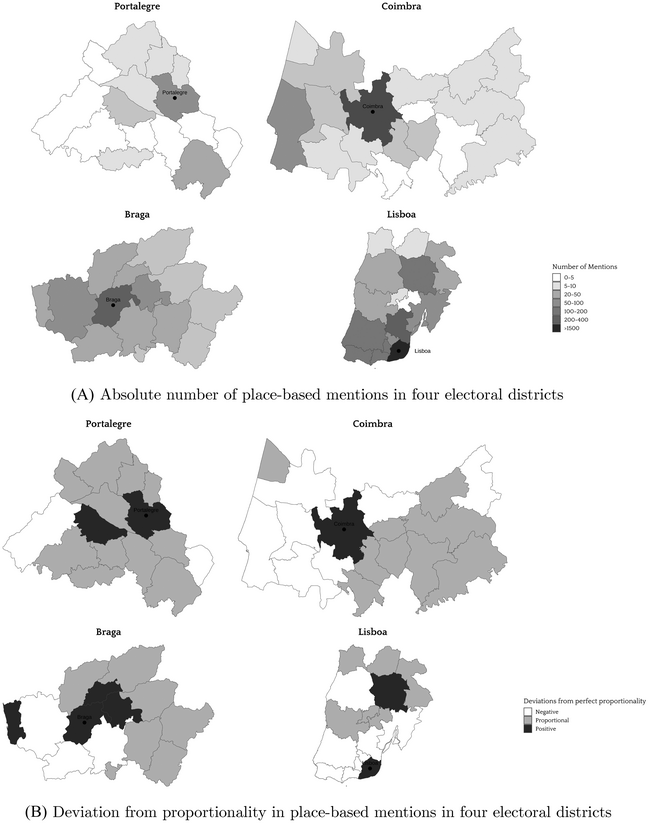
Figure 2 explores within‐district variation across four districts with different electoral magnitudes: Lisbon, Braga, Coimbra, and Portalegre. Figure 2a shows the absolute number of mentions, and Figure 2b examines deviations from proportionality. The data reveal two patterns: considerable variation in territorial representation and overrepresentation of district capitals, contrary to findings in majoritarian systems. Suburban areas in Lisbon and Braga, as well as most municipalities in Portalegre, are often underrepresented. Further bivariate analysis is provided in Online Appendix D.
Place‐based representation in four electoral districts in Portugal.
Note: Figures (a) and (b) show average values between 1999 and 2019 of our two empirical indicators using four electoral districts. These districts illustrate different electoral magnitudes: Portalegre (M = 2), Coimbra (M = 9), Braga (M = 19) and Lisboa (M = 49).

Next, we turn to our multivariate regression models. Table 1 shows the determinants of place‐based representation at the municipality level. All specifications use our measure of Deviation from perfect proportionality as a dependent variable. Also, all specifications include district and legislative session fixed effects. We cluster standard errors at the district level. Specification (1) includes only our first independent variable – Population Size (as a share of the district) – as well as its squared term. Specification (2) adds the covariates to test H2 – Average income and Percentage of population with high education. Specification (3) drops the municipality of Lisbon from the observations to confirm that our results are robust to the exclusion of the country's capital, which receives a disproportionate number of place‐based mentions in legislative debates. Specifications (4) and (5) show a jackknife resampling procedure at district and municipality levels, respectively. This procedure omits one district/municipality at a time and aggregates the results. The jackknife procedure is conducted to reduce potential biases in our estimates.
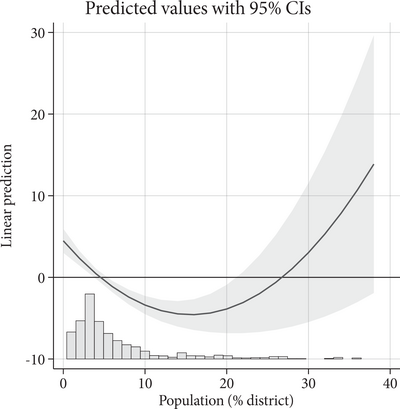
Results show that Population (as a share of the district) is a strong statistically significant determinant of party elites' choices of deviating from perfect proportionality in place‐based representation. Also, the squared term of this covariate, which allows us to test for its non‐linear effect, reaches the expected signal with the conventional levels of statistical significance. To better visualize the effect, Figure 3 plots the predicted values of the effects of population size as a share of the district. We find support for Hypothesis 1. Results show a curvilinear U‐shaped effect of a municipality's population as a share of the district and the amount of place‐based mentions it receives in legislative debates. Small and large municipalities receive higher representation proportionality to their size than medium‐sized municipalities, which receive fewer mentions than their population would indicate.
Predicted values of deviation from perfect proportionality in place‐based mentions.
Note: This figure shows the predicted values of deviation from perfect proportionality in place‐based mentions as a function of population size as a share of district's population. Figure estimated using Specification (2) from Table 1. 95 per cent confidence intervals.

Together with our descriptive findings above, this result has an important implication for our understanding of suburbs as a separate analytical category, which has been overlooked in political science (Lee & Rogers, Reference Lee and Rogers2019). Indeed, medium‐sized towns are often suburbs and peripheral towns to bigger cities. Our results fit with the existing literature from urban politics and economic geography that shows that suburbs are a distinct category with a hierarchical relation to the core city. Studies establish that, unlike urban dwellers, suburbanites have lower economic prospects, a declining social status, and more difficulties accessing public local services, making them more likely to support anti‐establishment parties (Moretti, Reference Moretti2012; Gidron & Hall, Reference Gidron and Hall2017; Florida, Reference Florida2017). Our findings suggest that place‐based representation in legislative speeches in national parliament replicates the same hierarchical relationship and local inequalities between core cities and peripheral towns also exist.
Next, we examine the importance of the socio‐economic composition of each municipality by determining the attention they receive from representatives. It is worth recalling that since representatives expect to receive votes in return for their efforts, they may focus on municipalities whose populations are more affluent (Gallego, Reference Gallego2015; Schlozman et al., Reference Schlozman, Verba and Brady2012). Results show that Average Income has a negative sign but fails to meet conventional levels of statistical significance. In contrast, the Percentage of population with high education covariate shows the expected positive sign with strong statistical significance. This result lends strong support to the idea of biases in political elites' behaviour and their potential strategic nature. Our results at the municipality level add evidence to the body of work showing that university‐educated citizens are often the most likely to participate politically and have their demands heard (Lupu & Warner, Reference Lupu and Warner2022). Education is particularly relevant in the Portuguese context, where low levels of higher education are prevalent, which increases the cultural and social similarity between representatives and voters.Footnote 7 Consequently, representatives are more likely to have a behavioural bias towards representing those citizens, as well as a rational‐strategic effort to represent those who are most likely to participate politically.
Robustness checks
Our findings are mostly descriptive, and we are cautious about their causal nature. Our models provide us with expected values of place‐based representation, conditional on observed confounders and unobserved district‐ and time‐specific invariant factors. The empirical distribution of place‐based representation within electoral districts is an important and overlooked quantity of interest. Furthermore, the confounders we observe and control for – turnout and district magnitude – include most of the theoretically relevant variables that previous literature has identified. Omitted variable bias would have to come from other unobserved confounders. To assuage concerns about mismeasurement and sensitivity to confounders, we conduct several robustness checks, including different measures of the dependent and independent variables, alternative model specifications and search for heterogenous treatment effects. We also conduct a formal sensitivity analysis to measure the robustness of findings to potential unobserved confounders.
First, in Online Appendix F, we inspect the existence of heterogeneous treatment effects by political party. Robust empirical results should not be driven by the behaviour of a single political party and its representatives. We should find our main results across different political parties and ideological blocs. In Online Appendix F, we observe that our main results hold across the ideological spectrum for the two largest and most important political parties – the PS, the main centre‐left party, and the PSD, the main centre‐right party. These are not only the two largest political parties but also the only parties in the country that elect representatives in all electoral districts, across different levels of magnitude, and have nationalized electoral support. The main empirical relationships also occur for smaller parties on the left and right.
Next, we turn to the robustness of our results to different measurements of the dependent and independent variables. Although we argue that some of these empirical measures are not as theoretically appropriate as the one we use in the main paper, they assuage concerns that our results are not driven by measurement artefacts. Online Appendix G includes several descriptive heatmaps, which show the curvilinear relationship between population size and place‐based representation within electoral districts.
In Online Appendix H, we find the same curvilinear relationship between population and place‐based representation using population density, instead of population share. Together with places with high population density, places with low population density are overrepresented, relative to places that have medium densities. The latter are the most underrepresented. Online Appendix I replicates the results using an alternative measurement of the dependent variable (a ratio), and results show that our main result is robust.
Online Appendix J tests whether our empirical results are robust to a change of measurement when we modify the level of analysis. While our argument and mechanisms operate at a district level, where representatives are elected and make representation work, we also estimate our models at the national level to understand whether the effects we observe at the district level aggregate to national patterns of place‐based representation. Our alternative modelling strategy reiterates that medium‐sized municipalities are underrepresented compared with both large and small municipalities, at the national level. Similarly, more educated municipalities are overrepresented at the national level.
Finally, following recent methodological developments (Cinelli & Hazlett, Reference Cinelli and Hazlett2020; Cinelli et al., Reference Cinelli, Ferwerda and Hazlett2020), in Online Appendix K we conduct a formal statistical analysis of the sensitivity of our results to unobserved confounders. Our analysis investigates how strong the unobserved confounders would have to be to eliminate the effect of the ‘treatment’ variable population size. According to our results, an unobserved confounder would have to have an effect more than twice as large as the effect of education, our strongest and significant covariate, in order to completely wash away the effect of population size on place‐based representation.
Conclusion
Over the past decade, the significance of geography in descriptive, substantive and symbolic representation has intensified, as place‐based identities have emerged as crucial political cleavages impacting voter attitudes and behaviour (Nasr & Rieger, Reference Nasr and Rieger2024; Munis, Reference Munis2022). Normative democratic theory posits that representation should align with population size. While such biases have been recognized in majoritarian systems (Rodden, Reference Rodden2010), they remain largely unaddressed in proportional systems. This oversight is particularly notable given that PR accounts for 70 per cent of electoral systems globally (Bormann & Golder, Reference Bormann and Golder2022).
This paper analyses the geographical winners and losers of representation in districted PR systems. Our contribution emphasizes the need to consider electoral districts to fully capture the social, economic and political diversity across regions. By employing an innovative method that combines NER and Google Places data, we offer a twofold contribution. First, we demonstrate that both the smallest and largest municipalities in each district are overrepresented in parliament, while medium‐sized cities and suburban peripheries tend to be underrepresented. Second, we find that the proportion of the population with higher education robustly predicts which places receive more or less parliamentary attention, whereas average income does not. This finding is particularly significant given the pronounced educational inequality in Portugal and aligns with recent research on the role of educational disparities in advanced democracies (Bosancianu, Reference Bosancianu2017; Gethin et al., Reference Gethin, Martínez‐Toledano and Piketty2022).
Our findings carry significant normative implications for political equality in modern democracies. Patterns of geographical inequality in representation – who wins and who loses – vary based on the outcome and context under examination. As representation is multi‐dimensional, geographical inequalities differ depending on the dimension being analysed. For instance, disparities in regional development and the provision of public goods may not align with those in parliamentary or symbolic place‐based representation. Both dimensions are crucial for understanding which individuals, groups and places hold political voice.
Although our findings are based on a case study, they likely generalize to political systems with districted party‐list PR and strong programmatic parties, such as Norway, Spain, Austria, Sweden, Slovakia and Uruguay. The empirical results and theoretical mechanisms are also pertinent to democracies with internally heterogeneous electoral districts that use legislative debates for territorial representation. Future research should explore whether place‐based representation within electoral districts varies across different systems, including open‐ and closed‐list PR, multi‐member versus single‐member districts and proportional versus majoritarian formulas. Our novel method for analysing place‐based mentions in legislative debates can be extended to other democracies to determine if similar patterns are observed globally. Both Google Places and NER offer versatile and valuable tools for advancing research in political geography.
Our study has two limitations. First, our focus is specifically on legislative debates, which is only one of many tools representatives use to address constituent interests. We cannot rule out the possibility that legislators strategically underrepresent certain areas during debates while compensating through other mechanisms, such as budgetary amendments. Recent research highlights this behaviour (Itzkovitch‐Malka et al., Reference Itzkovitch‐Malka, Mor, Oshri and Shenhav2024). Future research should explore multiple legislative tools simultaneously to assess their usage patterns and determine whether legislators use these tools in distinct or consistent ways.
A second limitation of our study is the potential for omitted variable bias due to unobserved confounders. Our panel data approach estimates place‐based representation based on observed confounders and unobserved district‐ and time‐specific factors. However, an unobserved causal variable might still account for the observed patterns. While we have theoretical reasons to support the relevance of our mechanisms and our results are robust across various model specifications, future research should further test the robustness of our findings using alternative identification strategies. Despite these limitations, the empirical and normative significance of our findings remains substantial, as understanding the distribution and proportionality of representation is crucial for studying political inequalities.
Our study opens several avenues for future research. First, it highlights the need for scholars to rigorously differentiate political representation failures from other economic and social inequalities. Researchers should investigate real‐world patterns of representation before assuming a simplistic rural–urban cleavage. Second, our findings urge political economy researchers to explore distributive policies – such as subsidies, welfare spending and infrastructure development – and other economic inequalities not only between different electoral districts but also within heterogeneous districts. Political economists should examine how economic heterogeneity influences political dynamics within the same electoral district, moving beyond district magnitude as the sole explanatory variable.
Finally, political scientists should investigate the behavioural mechanisms proposed here by conducting experimental surveys and interviews with political elites to understand their biases regarding the importance they place on different geographic areas within their districts. While such surveys are valuable, it is crucial to acknowledge that results may be influenced by demand effects, social desirability bias and the hypothetical nature of the surveys, potentially diverging from real‐world representation inequalities. Therefore, we recommend combining experimental studies of political elites' behaviour with observational research on existing geographical inequalities in political representation.
Acknowledgements
For comments and suggestions, we thank Torben Iversen, Jeffry Frieden, Orit Kedar, Ignacio Lago, Daniel M. Smith, Markus Wagner, Matthew S. Shugart, Michael Laver, Simon Hix, Christopher Wratil and Mariana Lopes da Fonseca. We thank audiences at ECPR Standing Groups on Parliaments (Paris 2022) and American Political Science Association (Montreal 2022). We acknowledge support of the publication fee by the CSIC Open Access Publication Support Initiative through its Unit of Information Resources for Research (URICI). All remaining errors are our own.
Data availability statement
Replication materials can be found at https://doi.org/10.7910/DVN/Q5UWRT.
Online Appendix
Additional supporting information may be found in the Online Appendix section at the end of the article:


 Open access