

Dementia affects around 35 million people worldwide, with numbers set to double in the next 30 years. Increasingly, dementia is an international governmental priority, with early and accurate assessment and diagnosis placed at the heart of effective management pathways. The two main causes of degenerative dementia in older people are Alzheimer's disease, responsible for about 65% of all cases, and dementia with Lewy bodies (DLB), responsible for 10–15% of cases in older people.
Most international guidelines for assessment and diagnosis of dementia advocate the use of structural imaging (computed tomography (CT) or magnetic resonance imaging (MRI)) as routine, both to exclude other intra-cerebral pathologies and determine the extent of regional brain atrophy. Reference Hort, O'Brien, Gainotti, Pirttila, Popescu and Rektorova1–3 Functional imaging methods such as fluorodeoxyglucose positron emission tomography (FDG-PET) and perfusion single-photon emission computed tomography (SPECT) are generally advocated as useful to clarify diagnosis when doubt remains after clinical assessment and structural imaging results.
In the National Institute on Aging's revised diagnostic guidelines Reference McKhann, Knopman, Chertkow, Hyman, Jack and Kawas4 proposed for Alzheimer's disease clinical diagnosis, three imaging biomarkers for Alzheimer's disease are proposed: medial temporal lobe atrophy (MTLA) on structural imaging; temporoparietal hypometabolism of FDG-PET; and raised amyloid binding on amyloid-PET. The authors suggest that further research is needed ‘to prioritize biomarkers and to determine their value and validity in practice and research settings’. This is important, not only to enable the appropriate sequencing of biomarkers but also from a health economic and patient perspective to ensure that investigations such as scans are only requested in situations where they will provide useful additional information to inform diagnosis, so that unnecessary cost and inconvenience to patients is minimised.
Modern multi-slice CT scanners allow assessment of MTLA comparable to T1 weighted MRI, Reference Wattjes, Henneman, van der Flier, de Vries, Träber and Geurts5 and assessment of MTLA with a visual rating scale Reference Scheltens, Leys, Barkhof, Huglo, Weinstein and Vermersch6 can be used to help distinguish Alzheimer's disease from DLB. Reference Burton, Barber, Mukaetova-Ladinska, Robson, Perry and Jaros7 Although there are imaging biomarkers (e.g. FP-CIT, SPECT with FPCIT (dopamine transporter) ligand Reference McKeith, O'Brien, Walker, Tatsch, Booij and Darcourt8 ) which have good diagnostic properties for the specific question of Alzheimer's disease v. DLB, the initial clinical picture is frequently unclear, and scans with more general diagnostic ability such as FDG-PET are often requested in the diagnosis of dementia. The aim of this study was thus to investigate the additional diagnostic utility of FDG-PET following visual rating of MTLA on CT using the question of Alzheimer's disease vs DLB as an exemplar. We hypothesised that for more severe MTLA, PET would add little further diagnostic information.
Method
Participants
Participants were part of a study investigating the relative performance of FDG-PET vs perfusion SPECT in the diagnosis of Alzheimer's disease and DLB. Main results from the study have been reported elsewhere. Reference O'Brien, Firbank, Davison, Barnett, Bamford and Donaldson9 The study participants were recruited prospectively from people aged over 60 with mild to moderate dementia (Mini-Mental State Examination score >12) referred to clinical services in north-east England, together with healthy controls of similar age, who were recruited from spouses of participants with dementia (n = 9), along with those who had previously indicated a willingness to participate in research (n = 22). Study participants were recruited between June 2010 and June 2012. Control participants had no symptoms of dementia, and patients met criteria for probable Alzheimer's disease Reference McKhann, Drachman, Folstein, Katzman, Price and Stadlan10 or probable DLB. Reference McKeith, Dickson, Lowe, Emre, O'Brien and Feldman11 The study was approved by Newcastle and North Tyneside Research Ethics Committee (REF 09/H0906/88), and all participants (or nominated Independent Mental Capacity Advocate where participant lacked capacity) gave informed consent before participating.
Clinical diagnosis was made by consensus between three experienced clinicians. Neither FDG-PET nor the MTLA ratings from CT were used to inform the diagnosis; the only information regarding CT available to the diagnostic raters was from a previous clinical CT report providing information about the extent of any vascular pathology present and confirmation that no space occupying lesion was present. All participants had to have sufficient command of English and adequate visual and auditory acuity to allow cognitive and neuropsychological testing. Exclusion criteria were (1) past history of alcohol or drug dependence; (2) contra-indications for FDG-PET scanning (e.g. inability to lie flat); (3) fasting blood glucose level more than 180 mg/dL. All those meeting in/exclusion criteria who consented to take part were included in the study. We recruited 102 individuals, of whom three withdrew before completing both scans, and two were excluded owing to scanner technical problems. A total of 37 people with Alzheimer's disease, 30 with DLB and 30 controls were successfully scanned with FDG-PET-CT.
Participants underwent detailed neuropsychiatric investigation including the Cambridge Cognitive Examination (CAMCOG), Reference Roth, Huppert, Mountjoy and Tym12 and the Rey Auditory Verbal Learning Test (AVLT). Reference Schmidt13 The Cornell scale for depression in dementia Reference Alexopoulos, Abrams, Young and Shamoian14 was used to assess mood, and for dementia participants we performed the Neuropsychiatric Inventory (NPI) Reference Cummings, Mega, Gray, Rosenberg-Thompson, Carusi and Gornbein15 and the Clinician Assessment of Fluctuation (CAF) scale. Reference Walker, Ayre, Cummings, Wesnes, McKeith and O'Brien16 Parkinsonian motor features were assessed in all participants using the motor subsection of the Unified Parkinson's Disease Rating Scale (UPDRS III). Reference Fahn, Elton, Fahn, Marsden and Calne17
Scanning
Scans were performed at Newcastle University using a Siemens Biograph-40 Truepoint FDG-PET-CT. CT scans were obtained using the 40 slice CT with 0.6 mm slices, pitch 0.8, 200 mAs, 120 kV, imaging time 12 s. FDG-PET head scans were done over 10 min starting 30 min after i.v. administration of 250 MBq F-18 FDG. Siemens software was used for iterative reconstruction with scatter and attenuation correction based on the CT scan data obtained immediately before the FDG-PET scan.
Visual rating
The CT scans were viewed and rated separately by different observers to the PET scans. All ratings were performed blind to diagnosis and to the other images from the same individual.
Computed tomography
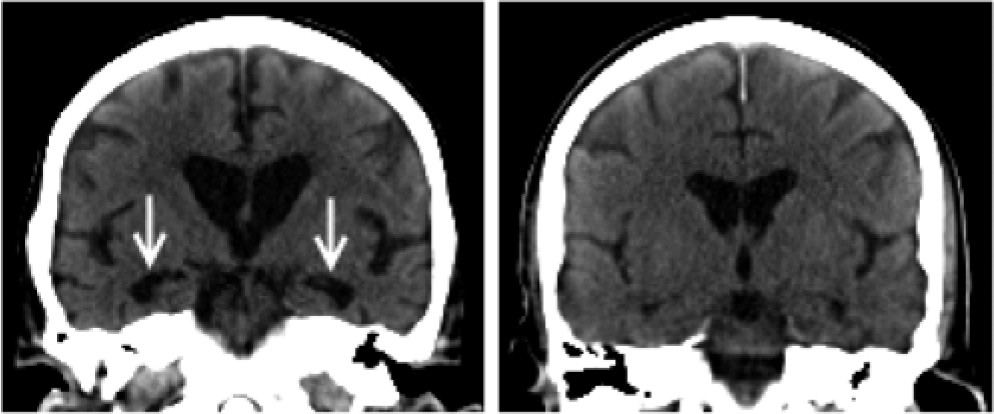
All CT scans were reconstructed as 3 mm thick coronal sections oriented perpendicular to the long axis of the hippocampus by the same operator. Visual rating was performed with a standardised scale (Scheltens scale) to rate right and left MTLA separately. Reference Scheltens, Leys, Barkhof, Huglo, Weinstein and Vermersch6 The scale rates atrophy on a 5-point scale (0 = absent, 1 = minimal, 2 = mild, 3 = moderate and 4 = severe) based on the height of the hippocampal formation and the width of the cerebrospinal fluid (CSF) spaces. For the purpose of analysis, the left and right scores were summed to give a combined MTLA score (maximum score 8). All scans were assessed by consensus between two experienced raters (SC and RB) blinded to diagnosis. Figure 1 shows example CT scans.
Computed tomography of dementia with Lewy bodies with (left) high and (right) low medial temporal lobe atrophy (MTLA): MTLA = 8 v. MTLA = 2, respectively. Greater medial temporal atrophy (arrowed) is clearly visible in the left-hand scan.
Fluorodeoxyglucose positron emission tomography
Visual rating of the scans was performed blind to diagnosis and any clinical information by three imaging specialists (MJF, EDW and JJL) experienced in analysing and reporting nuclear medicine brain scans.
To facilitate consistency in reporting, the imaging features associated with Alzheimer's disease and DLB were set out in a document – key points were (1) reduced uptake in precuneus and lateral parietal lobes in both Alzheimer's disease and DLB; (2) relative preservation of posterior cingulate in DLB; (3) occipital loss more likely in DLB; and (4) reduced uptake in temporal and frontal lobe more likely in Alzheimer's disease.
Each reader independently rated each scan on a 5-point scale for the degree of confidence in overall abnormality typical of dementia. For all scans not considered to be ‘definitely normal’, the match to Alzheimer's disease or DLB was also rated, again using a 5-point scale. After individual ratings were completed, the imaging team met to compare and review all their ratings and to produce a set of consensus ratings for each scan. Each scan was also given a tripartite consensus classification of normal, Alzheimer's disease or DLB.
Quantitative analysis
We also performed region of interest (ROI) analysis on the PET scans. Full details are given elsewhere Reference O'Brien, Firbank, Davison, Barnett, Bamford and Donaldson9 but briefly, the PET scans were normalised to standard space in SPM8 (www.fil.ion.ucl.ac.uk/spm), and mean intensity within standard ROIs were calculated for each scan. ROIs were taken from the AAL atlas Reference Tzourio-Mazoyer, Landeau, Papathanassiou, Crivello, Etard and Delcroix18 for medial temporal lobe, (hippocampus+parahippocampal gyrus) and medial occipital lobe (calcarine+lingual gyrus).
Statistics
Demographic and clinical rating data were analysed with SPSS 19.0 (SPSS, Chicago, IL). Continuous variables were compared using independent Student t-tests or analysis of variance (ANOVA). Chi-square tests were used to compare categorical data. receiver operating characteristic (ROC) analysis was performed in SPSS. The diagnostic statistics (sensitivity, etc.) were calculated for Alzheimer's disease vs DLB using R (www.r-project.org/ version 2.14.1) on those with a clinical diagnosis of dementia. For visual rating, the PET Alzheimer's disease positive cases were those with consensus visual rating of definitely or probably Alzheimer's disease, and PET Alzheimer's disease negative cases were all other cases (visual rating of normal scan, unclear, probably or definitely DLB). For the ROI analysis, those with a medial temporal/occipital lobe uptake ratio of <0.7 were classed as PET Alzheimer's disease positive, otherwise negative. The diagnostic classification tables from which the statistics were calculated are available in the supplementary material.
Results
Table 1 shows the participant demographics. The groups were well matched for age, years of education, sex and duration of dementia. There were no significant differences between Alzheimer's disease and DLB in CAMCOG scores. As expected, the DLB group had more Parkinsonian symptoms as demonstrated by significantly higher scores on the UPDRS, whereas the Alzheimer's disease group had poorer memory performance on the Rey AVLT. The NPI score was not different between groups, but the DLB patients had more fluctuations of consciousness as measured by the CAF.
Participant demographics

| Control (n = 30) |
Alzheimer's
disease (n = 37) |
DLB (n = 30) |
||
|---|---|---|---|---|
| Age | 76.3 (6.6) | 75.8 (7.6) | 76.5 (5.8) | F 2,94 = 0.11, P = 0.9 |
| Female: Male | 10:20 | 15:22 | 7:23 | χ2 = 2.2, P = 0.3 |
| Education (years) | 11.9 (2.8) | 11.5 (2.6) | 10.6 (2.3) | F 2,94 = 1.97, P = 0.15 |
| Duration of dementia (months) | – | 44.1 (23.2) [12–132] | 38.1 (27.3) [9–120] | t 65 = 0.97, P = 0.3* |
| MMSE | 28.9 (1.1) [26–30] | 20.9 (3.7) [15–28] | 21.8 (4.2) [14–28] | t 65 = −0.95, P = 0.3* |
| CAMCOG | 98.4 (4.0) | 71.5 (11.7) | 72.6 (13.1) | t 65 = −0.35, P = 0.7* |
| Rey total | 70.3 (12.3) | 25.1 (9.6) | 33.4 (12.1) | t 65 = −3.1, P = 0.002* |
| Cornell | 1.8 (1.8) | 4.5 (2.8) | 8.1 (3.8) | F 294 = 35.9, P<0.001 |
| CAF total | – | 1.5 (2.5) | 6.0 (4.7) | t 64 = −4.7, P<0.001* |
| NPI total | – | 14.8 (14.6) | 19.7 (15.6) | t 64 = −1.3, P = 0.2* |
| UPDRS III | 2.6 (2.7) | 3.7 (3.3) | 25.5 (11.9) | F 2 94 = 104, P<0.001 |
| MTLA55 | 0 (0%) | 23 (62%) | 6 (20%) | χ2 = 32.6; P<0.001 |
* Alzheimer's disease v. DLB, Student t-test
Values are mean (SD) [range]; DLB, dementia with Lewy bodies; CAF, Clinician Assessment of Fluctuation; CAMCOG, Cambridge Cognitive Examination; MMSE, Mini-Mental State Examination; MTLA, medial temporal lobe atrophy; NPI, Neuropsychiatric Inventory; UPDRS III, Unified Parkinson's Disease Rating Scale.
All of the control participants had an MTLA of <5. Table 2 shows the characteristics of the patients with dementia according to MTLA. Those with a high MTLA score were older than those with a lower score, but there were no other significant differences.
Demographics by MTLA for the patients with dementia
| Alzheimer's disease MTLA <5 (n = 14) |
Alzheimer's disease MTLA ⩾5 (n = 23) |
DLB MTLA
<5 (n = 24) |
DLB MTLA
⩾5 (n = 6) |
|||
|---|---|---|---|---|---|---|
| Age | 71.0 (7.1) | 78.7 (6.4) | T = 3.3, P = 0.002 | 75.3 (5.4) | 81.0 (5.7) | T = 2.3, P = 0.031 |
| Female: Male | 7:7 | 8:15 | χ2 = 0.8, P = 0.5 | 5:19 | 2:4 | χ2 = 0.4, P = 0.6 |
| Duration of dementia (months) | 39.7 (17) | 46.7 (26) | T=0.9, P=0.4 | 38.0 (26) | 38.0 (35) | T = 0.0, P = 1.0 |
| MMSE | 21.1 (4.2) | 20.8 (3.5) | T = −0.3, P = 0.8 | 22.5 (4.0) | 19.0 (3.8) | T = −1.9, P = 0.06 |
| CAMCOG | 74.0 (12) | 70.0 (11) | T = −1.0, P = 0.4 | 74.1 (11) | 66.5 (19) | T = −1.3, P = 0.2 |
| UPDRS III | 3.6 (4.1) | 3.7 (2.7) | T = 0.2, P = 0.9 | 24.3 (12) | 30.0 (11) | T = 1.0, P = 0.3 |
DLB, dementia with Lewy bodies; CAMCOG, Cambridge Cognitive Examination; MMSE, Mini-Mental State Examination; MTLA, medial temporal lobe atrophy; UPDRS III, Unified Parkinson's Disease Rating Scale.
Figure 1 shows typical CT scans, and Fig. 2 shows the MTLA rating scores by group. In our previous examination of MTLA, we found that a cut-off of ⩾5 optimally distinguished Alzheimer's disease from DLB and vascular dementia. Reference Burton, Barber, Mukaetova-Ladinska, Robson, Perry and Jaros7 With this cut-off, none of the control participants, 6/30 DLB, and 23/37 Alzheimer's disease, had marked MTLA. So a high MTLA score was a good test for excluding non-dementia and most DLB cases, with a positive predictive value of 79%, but a lower sensitivity (62%) for detecting all Alzheimer's disease cases.
Medial temporal lobe atrophy rating (L+R) for all participants. Horizontal bar shows group means. DLB, dementia with Lewy bodies; MTLA, medial temporal lobe atrophy.
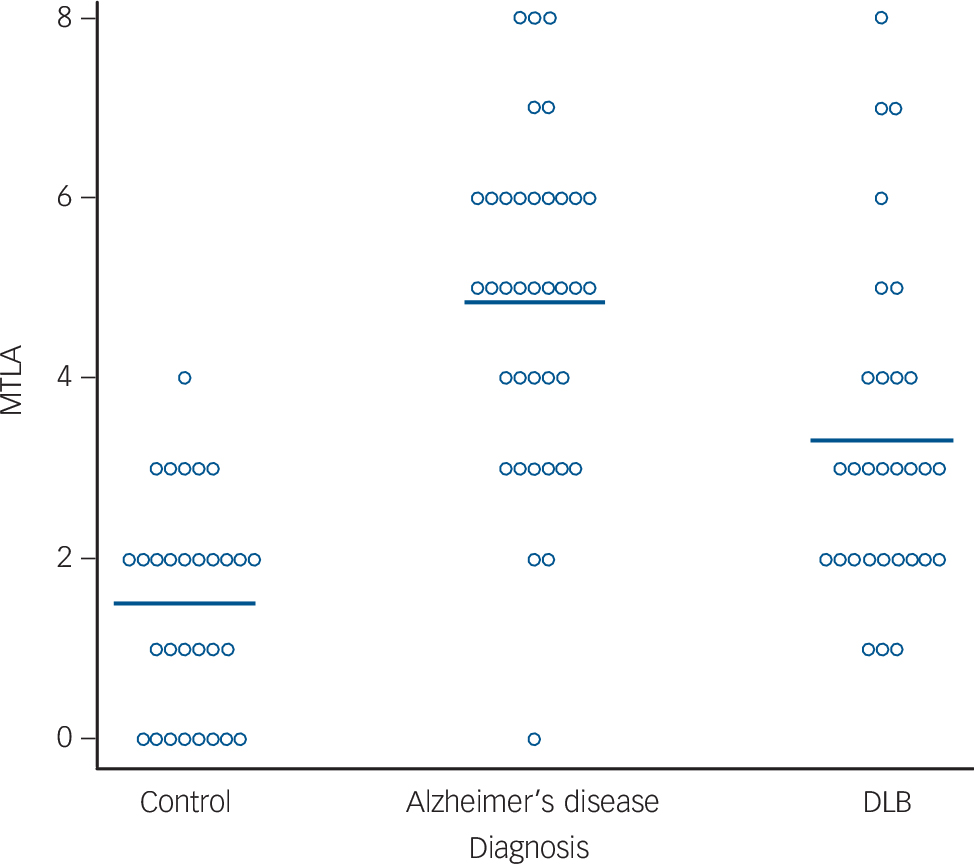
Table 3 presents the results of the FDG-PET visual rating consensus classification. PET performed generally very well at distinguishing controls from dementia at all levels of MTLA, with 24/30 (80%) of control scans being classed as normal and 61/67 (91%) of dementia cases as abnormal. For cases with MTLA <5, visual rating of PET had a sensitivity/specificity of 71%/79% for diagnosis of Alzheimer's disease vs DLB (Table 4). However, for those subjects with a MTLA ⩾5, visual inspection of PET performed poorly for distinguishing Alzheimer's disease from DLB, with a sensitivity of 52%.
Consensus visual rating from 3 observers of PET scans by different groups and MTLA severity
| PET visual rating consensus | ||||||
|---|---|---|---|---|---|---|
| MTLA | Definite/probable normal |
Definite/probable Alzheimer's disease |
Unclear
Alzheimer's disease v. DLB |
Definite/probable DLB |
PET MTL/occipital
ROI ratio mean (SD) |
|
| Alzheimer's disease | ||||||
| 0—4 | 14 | 1 (7%) | 10 (71%)* | 3 (21%) | 0 | 0.647 (0.032) |
| 5—8 | 23 | 1 (4%) | 12 (52%)* | 6 (26%) | 4 (17%) | 0.631 (0.069) |
| DLB | ||||||
| 0—4 | 24 | 4 (17%) | 5 (21%) | 1 (4%) | 14 (58%)* | 0.751 (0.080) |
| 5-8 | 6 | 0 | 1 (17%) | 3 (50%) | 2 (33%)* | 0.711 (0.123) |
| Controls | ||||||
| 0–4 | 30 | 24 (80%)* | 1 (3%) | 3 (10%) | 2 (7%) | 0.681 (0.039) |
| 5–8 | 0 | |||||
* Correct diagnoses. Ratio of FDG-PET uptake in medial temporal lobe to occipital lobe ROIs also shown. DLB, dementia with Lewy bodies; PET, positron emission tomography; MTL, medial temporal lobe; MTLA, medial temporal lobe atrophy.
Diagnostic statistics for identifying Alzheimer's disease (vs DLB)
| Sensitivity | Specificity | Positive predictive value |
Negative predictive value |
Accuracy | Likelihood ratio
for positive result |
|
|---|---|---|---|---|---|---|
| CT rating | 0.62 (0.45–0.77) | 0.80 (0.61–0.92) | 0.79 (0.60–0.91) | 0.63 (0.46–0.78) | 0.70 (0.58–0.80) | 3.11 (1.46–6.64) |
| PET visual rating, all cases | 0.59 (0.42–0.75) | 0.80 (0.61–0.92) | 0.79 (0.59–0.91) | 0.62 (0.45–0.76) | 0.69 (0.56–0.79) | 2.97 (1.39–6.38) |
| CT <5, PET visual rating | 0.71 (0.42–0.90) | 0.79 (0.57–0.92) | 0.67 (0.39–0.87) | 0.83 (0.60–0.94) | 0.76 (0.59–0.88) | 3.43 (1.47–8.00) |
| CT⩾5, PET visual rating | 0.52 (0.31–0.73) | 0.83 (0.36–0.99) | 0.92 (0.62–1.00) | 0.31 (0.12–0.59) | 0.59 (0.39–0.76) | 3.13 (0.50–19.5) |
| CT & PET visual rating | 0.89 (0.74–0.96) | 0.63 (0.44–0.79) | 0.75 (0.59–0.86) | 0.83 (0.60–0.94) | 0.78 (0.65–0.87) | 2.43 (1.50–3.94) |
| PET MTL/Occipital ROI | 0.89 (0.74–0.96) | 0.80 (0.61–0.92) | 0.85 (0.69–0.94) | 0.86 (0.66–0.95) | 0.85 (0.74–0.92) | 4.46 (2.16–9.20) |
| CT<5, PET ROI | 0.93 (0.64–1.00) | 0.83 (0.62–0.95) | 0.76 (0.50–0.92) | 0.95 (0.74–1.00) | 0.87 (0.71–0.95) | 5.57 (2.25–13.8) |
| CT⩾5, PET ROI | 0.87 (0.65–0.97) | 0.67 (0.24–0.94) | 0.91 (0.69–0.98) | 0.57 (0.2–0.88) | 0.83 (0.64–0.93) | 2.61 (0.83–8.18) |
| CT & PET ROI | 0.97 (0.84–1.00) | 0.67 (0.47–0.82) | 0.78 (0.63–0.89) | 0.95 (0.74–1.00) | 0.84 (0.72–0.91) | 2.92 (1.75–4.86) |
95% confidence interval in brackets. PET ROI is the MTL/occipital uptake ratio. The CT & PET visual rating figures are obtained by following the diagnostic flowchart in Fig. 3, i.e. an Alzheimer's disease diagnosis is given via either MTLA on CT, or Alzheimer's disease positive FDG-PET scan following normal MTL on CT. CT, computed tomography; DLB, dementia with Lewy bodies; MTL, medial temporal lobe; MTLA, medial temporal lobe atrophy; PET, positron emission tomography; ROI, region of interest.
Table 5 presents ROC analysis of Alzheimer's disease vs DLB for both the visual rating (5-point scale) and the ratio of uptake in the medial temporal to occipital lobe, which we found to have good distinguishing ability in the whole cohort. Reference O'Brien, Firbank, Davison, Barnett, Bamford and Donaldson9 Visual rating and ROI analysis had similar values of AUC in both low- and high-MTLA groups. For the high-MTLA group, the AUC was 0.69 for visual rating and 0.72 for ROI analysis, neither of which were significantly greater than chance (P>0.1). For low MTLA, both the visual rating and ROI analysis were significant (P<0.001) with AUC of 0.83 for visual rating, indicating good diagnostic ability. One factor influencing the less good diagnostic performance of PET at high MTLA is the increased variability, seen as higher s.d. for the AUC in the ROC analysis, and the ratio of MTLA/occipital lobe FDG uptake (Table 3), where the variance is higher in the MTLA ⩾5 group, significantly so in Alzheimer's disease (s.d. = 0.069 vs 0.032, F 22,13 = 0.22, P = 0.006).
Values from receiver operating characteristic analysis based on the consensus rating and the ratio of ROI in the occipital/medial temporal lobe
| MTL rating |
PET Alzheimer's disease
v. DLB consensus visual rating (n = 67) |
PET
ROI MTL/occipital (n = 67) |
|---|---|---|
| AUC (s.e.) | AUC (s.e.) | |
| 0–4 | 0.83 (0.07)*** | 0.85 (0.07)*** |
| 5–8 | 0.69 (0.13) | 0.72 (0.15) |
Values denote sensitivity/specificity for identifying Alzheimer's disease.
*** P<0.001. AUC, area under the curve; DLB, dementia with Lewy bodies; MTL, medial temporal lobe; PET, positron emission tomography; ROI, region of interest.
Discussion
Using a predetermined cut-off of ⩾5 on the MTLA visual rating scale on 3 mm slice CT for diagnosing Alzheimer's disease (compared to DLB), we found a sensitivity of 62% and a specificity of 80%. The cut-off also excluded all of the normal control participants and had good positive predictive value for Alzheimer's disease (79%). Analysis of PET scans in the high-MTLA group did not significantly improve diagnostic discrimination. In the group with low MTLA (14 Alzheimer's disease, 23 DLB), PET performed well for identifying controls, and also had a sensitivity and specificity of 71% and 79% for distinguishing Alzheimer's disease from DLB.
Visual rating of the hippocampus can be performed fairly quickly by a trained person, with good reliability, and studies have shown it to be comparable to volumetric measurement for assessment of the hippocampus in Alzheimer's disease. Reference Boutet, Chupin, Colliot, Sarazin, Mutlu and Drier19 CT scans are quick and relatively cheap to perform, and are frequently done for suspected dementia to exclude space occupying lesions or vascular disease. Alternatively, if coronal MRI head scans are available, MTLA could be rated from those. We suggest that rating of MTLA should form a standard part of the examination report, since our data suggest that when there is a high degree of MTLA present, then the most likely diagnosis is Alzheimer's disease, and it is unlikely that an FDG-PET scan will provide significant additional diagnostic information. In cases where MTLA is absent or mild, and the diagnosis is unclear, then an FDG-PET scan may provide additional information. Our results are consistent with those of Ossenkoppole et al Reference Ossenkoppele, Prins, Pijnenburg, Lemstra, van der Flier and Adriaanse20 who found that PET imaging contributed most to diagnosis when there was greater diagnostic uncertainty before considering the scan results. In the case where Alzheimer's disease is still suspected, but there is absent MTLA, testing levels of Aβ42 in CSF may be appropriate, as this has good sensitivity for detecting Alzheimer's disease. Reference Ferreira, Perestelo-Perez, Westman, Wahlund, Sarria and Serrano-Aguilar21
Reduction in FDG uptake in the posterior cingulate cortex (PCC) is one of the characteristic features of Alzheimer's disease. Previous work has shown that this is associated with disconnection between the PCC and the medial temporal lobe. Reference Bozoki, Korolev, Davis, Hoisington and Berger22,Reference Villain, Desgranges, Viader, de la Sayette, Mézenge and Landeau23 It is thus likely that the presence of severe MTLA on a CT scan will be accompanied by Alzheimer-like features on the FDG-PET scan due to this disconnection. This partly explains the relative lack of additional diagnostic information from FDG-PET in high MTLA. In the case of uncertain diagnosis in those with high MTLA, then a PET/SPECT scan examining a different neural system may be more useful (e.g. with an FP-CIT SPECT scan for detecting dopaminergic deficit associated with DLB Reference McKeith, O'Brien, Walker, Tatsch, Booij and Darcourt8 ).
Participants with high MTLA were older. Even in healthy individuals, MTLA tends to increase with age, Reference Fjell, McEvoy, Holland, Dale and Walhovd24 there is an age-related decrease in FDG-PET uptake, Reference Chételat, Landeau, Salmon, Yakushev, Ali Bahri and Mézenge25 and subjects with later onset Alzheimer's disease have previously been reported to have less pronounced FDG deficits. Reference Dukart, Mueller, Villringer, Kherif, Draganski and Frackowiak26 The poorer diagnostic performance of FDG-PET in the high MTLA may thus have been in part due to lower and less distinct FDG uptake patterns in older subjects. It is also possible that the DLB patients with high MTLA may have had some degree of Alzheimer's disease pathology present.
Caveats are that we only investigated Alzheimer's disease and DLB in this study. Evaluation of MTLA in cases of mild cognitive impairment has good predictive value for development of Alzheimer's disease Reference Clerx, van Rossum, Burns, Knol, Scheltens and Verhey27 and studies are needed as to how best to combine this with other biomarkers such as PET. Patients with fronto-temporal dementia commonly have hippocampal atrophy, and it is difficult to differentiate FTD from Alzheimer's disease on the basis of MTLA. Reference Muñoz-Ruiz, Hartikainen, Koikkalainen, Wolz, Julkunen and Niskanen28–Reference de Souza, Chupin, Bertoux, Lehericy, Dubois and Lamari30 In the case of suspected FTD, more detailed examination of structural scans may help the diagnosis, since the pattern of structural atrophy is different to that seen in Alzheimer's disease. Reference Boccardi, Laakso, Bresciani, Galluzzi, Geroldi and Beltramello31,Reference Agosta, Canu, Sarro, Comi and Filippi32 On FDG-PET scans, patients with FTD typically have greater frontal and temporal hypometabolism than Alzheimer's disease, Reference Mosconi, Tsui, Herholz, Pupi, Drzezga and Lucignani33 and studies have found generally good diagnostic differential ability for Alzheimer's disease vs FTD Reference Mosconi, Tsui, Herholz, Pupi, Drzezga and Lucignani33–Reference Foster, Heidebrink, Clark, Jagust, Arnold and Barbas35 though with, in general, lower reported sensitivity (53–72%) for FTD than specificity (95–99%).
We have previously shown that MTLA also discriminates Alzheimer's disease from vascular dementia, Reference Burton, Barber, Mukaetova-Ladinska, Robson, Perry and Jaros7 and other studies have also found MTLA in vascular dementia to be intermediate between controls and Alzheimer's disease Reference Dolek, Saylisoy, Ozbabalik and Adapinar36,Reference Van de Pol, Gertz, Scheltens and Wolf37 and hence the higher the MTLA score, the less likely there is vascular dementia. Examination of MRI scans for presence of vascular lesions is most likely to be of use to identify/exclude cases of vascular dementia. Reference Bhogal, Mahoney, Graeme-Baker, Roy, Shah and Fraioli38
We recruited control participants from a similar demographic to the dementia participants. Controls had the highest mean years of education of any group, but there were no significant differences between the groups in age, sex or years of education. Our diagnosis was based on clinical assessment, without the aid of neuroimaging or CSF biomarkers, an approach which has been validated in our group both against autopsy and other imaging markers and is a standard now accepted by regulatory authorities. Reference McKeith, O'Brien, Walker, Tatsch, Booij and Darcourt8 Although there may be some mistaken clinical diagnoses, we believe that they are unlikely to affect our main conclusion that a FDG-PET scan will probably not help the diagnosis of Alzheimer's disease in the presence of MTLA on CT.
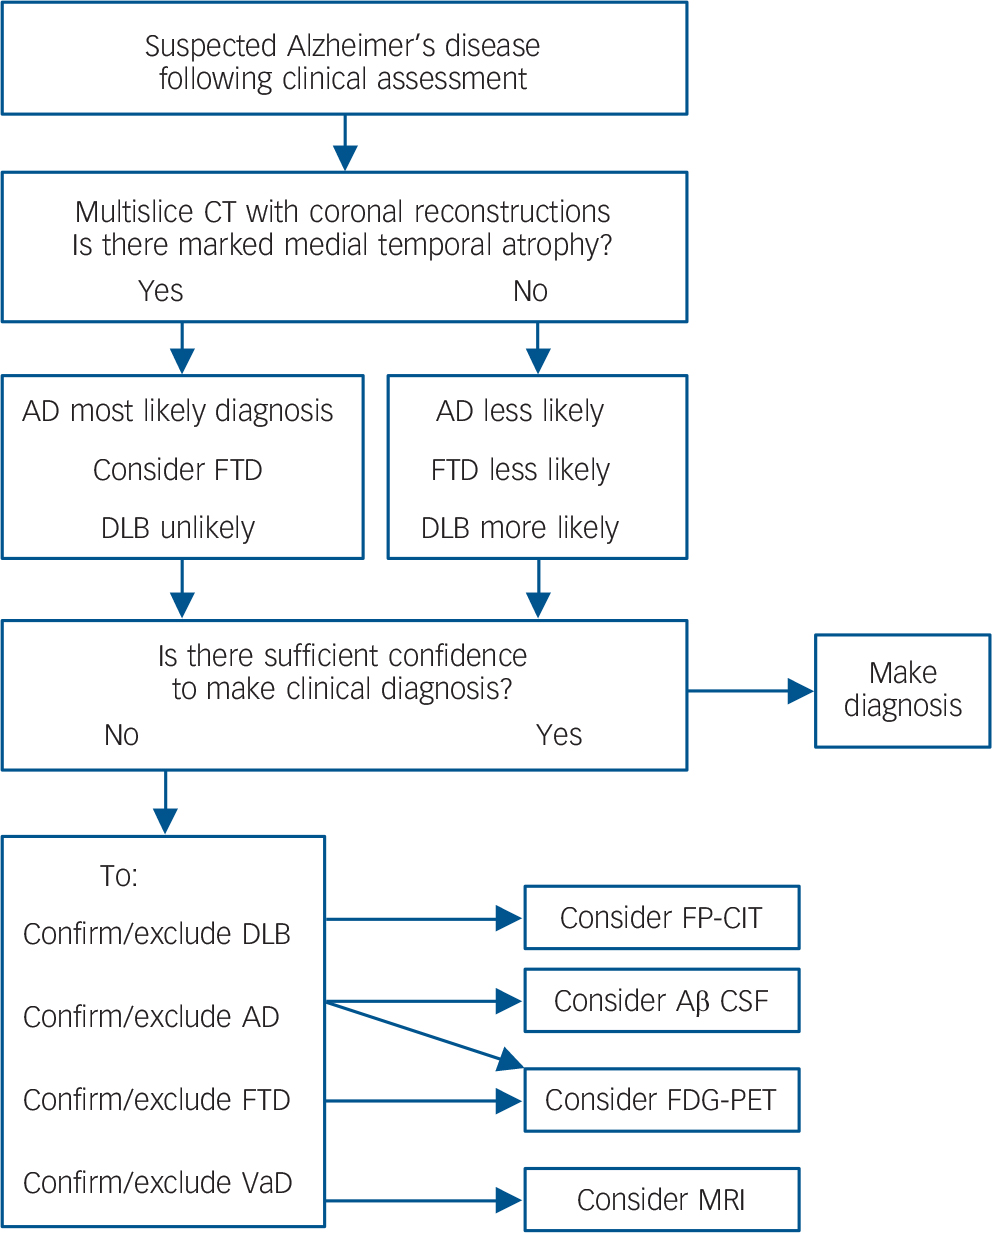
Many countries, including the UK, have initiatives aimed at raising the profile of dementia and increasing the numbers diagnosed, with some research estimating that currently less than half the people with dementia receive a formal diagnosis. Reference Connolly, Gaehl, Martin, Morris and Purandare39 There will also be a substantial increase in the numbers of patients with dementia over the next 40 years, due to increases in lifespan. 40 Neuroimaging services will be an important part of providing diagnoses to these increasing numbers. However, FDG-PET remains a relatively expensive option and involves a rather lengthy procedure for the patient compared to a CT scan. Therefore, to maximise health care resources, and minimise unnecessary investigations for people with dementia, FDG-PET will have to be used only as part of an evidence based diagnostic pathway. Based on our results, a suggested algorithm for considering neuroimaging, dependent on both the CT results and the clinical question, is presented in Fig. 3. Future work should seek to incorporate other imaging biomarkers into this algorithm, for example, amyloid-PET.
Evidence-based imaging algorithm for FDG-PET use.
DLB, dementia with Lewy bodies; FTD, fronto-temporal dementia; FP-CIT, single-photon emission computed tomography with FPCIT (dopamine transporter) ligand; CT, computed tomography; FDG-PET, fluorodeoxyglucose positron emission tomography; VaD, vascular dementia; Aβ, amyloid-beta; CSF, cerebrospinal fluid.
Funding
Funded by the National Institute for Health Research, NIHR Biomedical Research Centre and Lewy-body Dementia Biomedical Research Unit awarded to Newcastle upon Tyne Hospitals NHS Foundation Trust and Newcastle University, and the NIHR Biomedical Research Centre and Biomedical Research Unit in Dementia awarded to the Cambridge University Hospitals NHS Foundation Trust and the University of Cambridge.
Acknowledgements
We thank the Dementia and Neurodegenerative Diseases Research Network (DeNDRoN) for valuable support with clinical recruitment. This article presents independent research funded by the National Institute for Health Research (NIHR) under its Research for Patient Benefit (RfPB) Programme (grant reference number PB-PG-1207-131-05). The views expressed are those of the authors and not necessarily those of the NHS, the NIHR or the Department of Health.


eLetters
No eLetters have been published for this article.