
1. Introduction
The evolution of galaxies is often accelerated in the vicinity of galaxy clusters due to the presence of hot intra-cluster medium (ICM), and close proximity to large neighbouring galaxies. For several decades astronomers have focused on understanding the various mechanisms responsible for the morphology–density relation (Dressler, 1980) and star formation–density relation (e.g. Balogh et al., Reference Balogh2004) of galaxies. These mechanisms are believed to be the reason for the presence of more red, elliptical and passively evolving galaxies in and near clusters, relative to their counterparts farther away from the cluster centres.
Gravitational and tidal interactions with comparable-sized neighbours (Toomre & Toomre, Reference Toomre and Toomre1972; Moore et al., Reference Moore, Katz, Lake, Dressler and Oemler1996), emerge as the most important processes leading to the depletion of gas in galaxies residing in intermediate density environments such as the cluster outskirts and large-scale filaments (e.g. Porter & Raychaudhury, Reference Porter and Raychaudhury2005; Mahajan et al., 2010, Reference Mahajan, Raychaudhury and Pimbblet2012). On the other hand, ram-pressure stripping (RPS; Gunn & Gott, Reference Gunn, Gott and Richard1972) plays a significant role in the evolution of galaxies in the dense interiors of clusters and groups. The hydrodynamical interaction of the cold gas in a galaxy with the hot ICM can lead to the evaporation of the interstellar medium (ISM; Cowie & Songaila, Reference Cowie and Songaila1977), or complete removal of it from the galaxy via RPS. As a consequence, such a galaxy will eventually cease to form new stars, turn optically red and become elliptical on timescales of
 ${\sim} 1$
Gyr. This idea is in agreement with the presence of a large number of HI-deficient galaxies in nearby clusters (e.g. Gavazzi et al., Reference Gavazzi, O’Neil, Boselli and van Driel2006; Haines et al., Reference Haines2009; Vulcani et al., Reference Vulcani, Poggianti, Finn, Rudnick, Desai and Bamford2010; Boselli et al., Reference Boselli, Cortese, Boquien, Boissier, Catinella, Gavazzi, Lagos and Saintonge2014; Cybulski et al., Reference Cybulski, Yun, Fazio and Gutermuth2014).
${\sim} 1$
Gyr. This idea is in agreement with the presence of a large number of HI-deficient galaxies in nearby clusters (e.g. Gavazzi et al., Reference Gavazzi, O’Neil, Boselli and van Driel2006; Haines et al., Reference Haines2009; Vulcani et al., Reference Vulcani, Poggianti, Finn, Rudnick, Desai and Bamford2010; Boselli et al., Reference Boselli, Cortese, Boquien, Boissier, Catinella, Gavazzi, Lagos and Saintonge2014; Cybulski et al., Reference Cybulski, Yun, Fazio and Gutermuth2014).
Hydrodynamical simulations, however suggest that in the initial phase, for a short but significant duration of time RPS can lead to enhancement in the star formation rate (SFR) of galaxies (Bekki & Couch, Reference Bekki and Couch2003; Bekki, Reference Bekki2014; Steinhauser et al., Reference Steinhauser, Schindler and Springel2016; Lee et al., Reference Lee, Kimm, Katz, Rosdahl, Devriendt and Slyz2020; Troncoso-Iribarren et al., Reference Troncoso-Iribarren, Padilla, Santander, Lagos, García-Lambas, Rodríguez and Contreras2020). Using multi-wavelength datasets, several incidences of starbursts occurring in RPS galaxies have now been confirmed in nearby clusters (e.g. Crowl et al., Reference Crowl, Kenney, van Gorkom, Chung and Rose2006; Yagi et al., Reference Yagi2010; Gavazzi et al., Reference Gavazzi2015; Vulcani et al., Reference Vulcani2018; Boselli et al., Reference Boselli, Fossati and Sun2022; Lee et al., Reference Lee, Lee, Mun, Cho and Kang2022). In a systematic study of RPS candidates at low-redshift, Poggianti et al. (Reference Poggianti2016) found that at fixed mass, these galaxies have at least twice the rate of star formation relative to unstripped galaxies.
The environmental processes such as RPS, which influence the gas content of a galaxy can also impact its nuclear activity. The idea is based on the observations of enhanced star formation among galaxies experiencing RPS. Due to the turbulence and instabilities in the disc, resulting from the interaction of the galaxy with the intracluster medium, gas can be funnelled in towards the galaxy’s centre. This gas can thereby ignite the central supermassive black hole (Tonnesen & Bryan, Reference Tonnesen and Bryan2009), although observational evidence in favour of these ideas appear debatable at present. In a recent study of nearby galaxies, a high incidence of optical AGN was found to be present among RPS galaxies relative to a mass-matched control sample (Peluso et al., Reference Peluso2022). However, Cattorini et al. (Reference Cattorini, Gavazzi, Boselli and Fossati2022) suggest that the results of Peluso et al. (Reference Peluso2022) may be biased by the fact that they are considering both Seyfert and low-ionisation narrow-emission-line region (LINERs) as AGN, and they are evaluating the AGN fraction with respect to the emission-line galaxies only. RPS can also have a significant effect on the surface brightness, temperature and metallicity of the hot ISM of a galaxy (Kapferer et al., Reference Kapferer, Sluka, Schindler, Ferrari and Ziegler2009).
In this paper, we present multi-wavelength data and analysis, including new far-ultraviolet (FUV) observations from AstroSat/UVIT for the RPS galaxy UGC 10420 which is a member of the cluster Abell 2199 (
 $z=0.031$
) and has been observed in many wavebands from X-ray to radio. Some empirical facts about the X-ray cluster Abell 2199, sourced from Rines et al. (Reference Rines, Geller, Diaferio and Hwang2016) are provided in Table 2, while physical properties of UGC 10420 compiled from the literature, or derived for this analysis, are listed in Table 3. It is noteworthy that UGC 10420 has a very small radial offset with the cluster’s mean line-of-sight (l.o.s.) velocity, such that
$z=0.031$
) and has been observed in many wavebands from X-ray to radio. Some empirical facts about the X-ray cluster Abell 2199, sourced from Rines et al. (Reference Rines, Geller, Diaferio and Hwang2016) are provided in Table 2, while physical properties of UGC 10420 compiled from the literature, or derived for this analysis, are listed in Table 3. It is noteworthy that UGC 10420 has a very small radial offset with the cluster’s mean line-of-sight (l.o.s.) velocity, such that
 $\Delta v \sim 372$
km s
$\Delta v \sim 372$
km s
 $^{-1}$
. The structure of the paper is as follows: in the following section we describe various observations and data used in this paper, followed by our analysis in
$^{-1}$
. The structure of the paper is as follows: in the following section we describe various observations and data used in this paper, followed by our analysis in
 $\S$
3. In
$\S$
3. In
 $\S$
4, we discuss the results in the context of the existing literature and finally conclude the paper with an epilogue in
$\S$
4, we discuss the results in the context of the existing literature and finally conclude the paper with an epilogue in
 ${\S}$
5. Throughout this work we use concordance
${\S}$
5. Throughout this work we use concordance
 $\Lambda$
cold dark matter cosmological model with
$\Lambda$
cold dark matter cosmological model with
 $H_0 = 70$
km s
$H_0 = 70$
km s
 $^{-1}$
Mpc
$^{-1}$
Mpc
 $^{-1}$
,
$^{-1}$
,
 $\Omega_\Lambda = 0.7,$
and
$\Omega_\Lambda = 0.7,$
and
 $\Omega_m = 0.3$
to calculate distances and magnitudes.
$\Omega_m = 0.3$
to calculate distances and magnitudes.
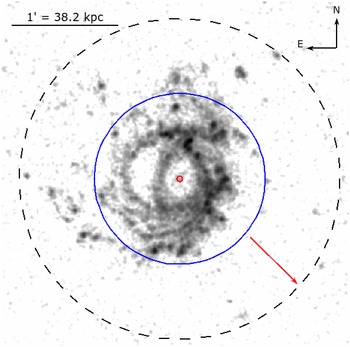
This is the AstroSat/UVIT image of UGC 10420. The small red circle represents the
 $3{^{\prime\prime}}$
diameter SDSS fibre drawn on the optical centre of the galaxy. The spectrum obtained from this region is shown in Fig. 5, and represents a broadline emission region. The solid blue and dashed black circles having radius of
$3{^{\prime\prime}}$
diameter SDSS fibre drawn on the optical centre of the galaxy. The spectrum obtained from this region is shown in Fig. 5, and represents a broadline emission region. The solid blue and dashed black circles having radius of
 $0.8^{\prime}\,\rm{and}\,1.5^{\prime}$
, respectively, are shown for reference to represent the region used for photometric measurements in various filters. The arrow points in the direction of the cluster centre.
$0.8^{\prime}\,\rm{and}\,1.5^{\prime}$
, respectively, are shown for reference to represent the region used for photometric measurements in various filters. The arrow points in the direction of the cluster centre.

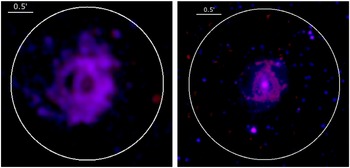
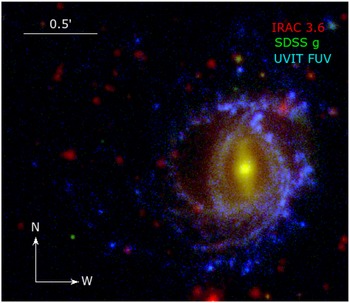
(left:) The GALEX image of UGC 10420 where blue and red represent the FUV and NUV broadband images, respectively. (right:) This composite image of UGC 10420 shows the NIR emission in the IRAC 3.6
 $\mu$
m (blue) and 5.8
$\mu$
m (blue) and 5.8
 $\mu$
m (red) bands. A circle of
$\mu$
m (red) bands. A circle of
 $1.5{^{\prime}}$
radius is shown in both the images for comparison. It is evident that the image of the galaxy is much smaller in the infrared bands.
$1.5{^{\prime}}$
radius is shown in both the images for comparison. It is evident that the image of the galaxy is much smaller in the infrared bands.

2. Observations and data reduction
In this section we describe the source and properties of data compiled for UGC 10420.
2.1. Ultraviolet data
UGC 10420 was observed with the ultraviolet imaging telescope (UVIT) aboard the AstroSat mission (Kumar et al., Reference Kumar and Takahashi2012; Singh et al., Reference Singh and Takahashi2014; Tandon et al., Reference Tandon2017). This field (observation ID: A05_063T03_9000003066; PI: Smriti Mahajan; observation date: 30-July-2019) was observed by the UVIT simultaneously in the broadband BaF2 FUV filter (mean
 $\lambda = 1541$
Å;
$\lambda = 1541$
Å;
 $\Delta\lambda = 380$
Å; Tandon et al., Reference Tandon2017, Reference Tandon2020), and visible wavebands (
$\Delta\lambda = 380$
Å; Tandon et al., Reference Tandon2017, Reference Tandon2020), and visible wavebands (
 $3040-5500$
Å), although the latter data have not been used for scientific analysis here. The raw data from the mission are processed by the Indian Space Science Data Centre (ISSDC), and the Level 1 data from all instruments are provided to the users. A more comprehensive account of processing of data and analysis of this field will be presented in an accompanying paper (Mahajan et al., in preparation), but is briefly mentioned below for completion.
$3040-5500$
Å), although the latter data have not been used for scientific analysis here. The raw data from the mission are processed by the Indian Space Science Data Centre (ISSDC), and the Level 1 data from all instruments are provided to the users. A more comprehensive account of processing of data and analysis of this field will be presented in an accompanying paper (Mahajan et al., in preparation), but is briefly mentioned below for completion.
The UVIT data used in this paper have a total exposure time of 9600.3 seconds and resolution of
 ${<}1.2{^{\prime\prime}}$
. The L1 data were processed using the CCDLAB software (Postma & Leahy, Reference Postma and Leahy2017), following the procedure described in Postma & Leahy (Reference Postma and Leahy2021, also see Mahajan et al. (Reference Mahajan, Singh, Postma, Pradeep, George and Côté2022) for a step-wise account of creating science images of similar data). The final UVIT FUV image of UGC 10420 is shown in Fig. 1. For comparison, we show two circles of radii
${<}1.2{^{\prime\prime}}$
. The L1 data were processed using the CCDLAB software (Postma & Leahy, Reference Postma and Leahy2017), following the procedure described in Postma & Leahy (Reference Postma and Leahy2021, also see Mahajan et al. (Reference Mahajan, Singh, Postma, Pradeep, George and Côté2022) for a step-wise account of creating science images of similar data). The final UVIT FUV image of UGC 10420 is shown in Fig. 1. For comparison, we show two circles of radii
 $0.8{^{\prime}}$
and
$0.8{^{\prime}}$
and
 $1.5{^{\prime}}$
, respectively. While the
$1.5{^{\prime}}$
, respectively. While the
 $1.5{^{\prime}}$
region better captures the UV emission of UGC 10420, the smaller circle is a better representation of the size of the galaxy at longer wavebands, as shown below.
$1.5{^{\prime}}$
region better captures the UV emission of UGC 10420, the smaller circle is a better representation of the size of the galaxy at longer wavebands, as shown below.
UGC 10420 was also observed by the Galaxy and Mass Evolution Explorer (GALEX) in the near and far ultraviolet broadbands as shown in Fig. 2 (left). It is noteworthy that the shallow exposure time and poor resolution renders this image unimpressive relative to the UVIT counterpart shown in Fig. 1. These data were taken as part of GALEX’s medium imaging survey (MIS) and have a total exposure time of 1649.1 seconds in both the bands.
In order to measure the flux from UGC 10420, an aperture had to be chosen manually because the commonly used software split the galaxy into multiple components due to its large size and discontinuous emission in almost all filters. The aperture photometry was performed using the SAOImageDS9 software package (Joye & Mandel, Reference Joye, Mandel and Payne2003), by choosing an aperture size of
 $1.5{^{\prime}}$
centred at the optical nucleus (
$1.5{^{\prime}}$
centred at the optical nucleus (
 $\alpha$
: 16h29m51.04s;
$\alpha$
: 16h29m51.04s;
 $\delta$
: +39d45m59.42s) for all three UV images. First, we estimated the background counts by averaging over multiple source-free circular regions of radius
$\delta$
: +39d45m59.42s) for all three UV images. First, we estimated the background counts by averaging over multiple source-free circular regions of radius
 $\geq 1.5{^{\prime}}$
and subtracted them from the counts obtained for the region centred on UGC 10420. The counts were then converted to fluxes using the standard conversion factors given in Tandon et al. (Reference Tandon2020) for the UVIT image, and https://asd.gsfc.nasa.gov/archive/galex/FAQ/counts_background.html for the GALEX images, respectively. The final flux values, measurement uncertainty in flux, and the effective wavelength for all wavebands are listed in Table 1.
$\geq 1.5{^{\prime}}$
and subtracted them from the counts obtained for the region centred on UGC 10420. The counts were then converted to fluxes using the standard conversion factors given in Tandon et al. (Reference Tandon2020) for the UVIT image, and https://asd.gsfc.nasa.gov/archive/galex/FAQ/counts_background.html for the GALEX images, respectively. The final flux values, measurement uncertainty in flux, and the effective wavelength for all wavebands are listed in Table 1.
2.2. X-ray Data
UGC 10420 was in the field of view of an observation with the XMM-Newton EPICFootnote a. This observation (Obs. ID: 0784521201, PI: Takayuki Tamura, Obs. time: 40 ks) carried out on 2017 March 17 was centred at
 $\alpha$
: 16h30m32s and
$\alpha$
: 16h30m32s and
 $\delta$
: +39d44m52s and focused on the intermediate regions (
$\delta$
: +39d44m52s and focused on the intermediate regions (
 ${\lt} 3/4$
virial radius) of Abell 2199. All the three detectors aboard XMM-Newton, viz., EPIC PN, MOS1 amd MOS2 detectors were operated in the Full Frame mode and medium optical blocking filter was used. The dataset for this observation was retrieved from the HEASARCFootnote b archive, then processed and analysed using the XMM-Newton Science Analysis System (SAS) version 20.0.0 and the Extended Source Analysis Software (XMM-ESAS) package integrated into SAS. The latest calibration files were employed to produce the PN (MOS) event files using the SAS tasks epchain (emchain).
${\lt} 3/4$
virial radius) of Abell 2199. All the three detectors aboard XMM-Newton, viz., EPIC PN, MOS1 amd MOS2 detectors were operated in the Full Frame mode and medium optical blocking filter was used. The dataset for this observation was retrieved from the HEASARCFootnote b archive, then processed and analysed using the XMM-Newton Science Analysis System (SAS) version 20.0.0 and the Extended Source Analysis Software (XMM-ESAS) package integrated into SAS. The latest calibration files were employed to produce the PN (MOS) event files using the SAS tasks epchain (emchain).
The X-ray data were first screened to remove the particle backgrounds as described below:
-
a) The event files were filtered for soft proton (SP) background flares using the tasks pn-filter and mos-filter. The SP flare filtering resulted in useful exposure times of 28.92, 35.46, and 38.20 ks for the PN, MOS1, and MOS2 detectors, respectively. We examined the output of the task mos-filter and verified that none of the MOS detectors operated in an anomalous state during the observation.
-
b) The events arising due to quiescent particle background (QPB) produced by the interaction of high energy particles (
 ${>} 100$
MeV) with the X-ray detectors and the surrounding structure was then removed. QPB shows only small intensity variations over the time scale of a typical X-ray observation and therefore not detected as flares. The standard norm to subtract out the QPB contribution from the data is to either use blanksky observations or model the QPB. The XMM-ESAS package models the QPB using a combination of a database of unexposed-region data and filter-wheel-closed data based on the methods of Kuntz & Snowden (Reference Kuntz and Snowden2008), and we have used this method to model and subtract the QPB instead of using blanksky files.
${>} 100$
MeV) with the X-ray detectors and the surrounding structure was then removed. QPB shows only small intensity variations over the time scale of a typical X-ray observation and therefore not detected as flares. The standard norm to subtract out the QPB contribution from the data is to either use blanksky observations or model the QPB. The XMM-ESAS package models the QPB using a combination of a database of unexposed-region data and filter-wheel-closed data based on the methods of Kuntz & Snowden (Reference Kuntz and Snowden2008), and we have used this method to model and subtract the QPB instead of using blanksky files.

The filtered event files thus produced were used for making the images and spectra and analysed as described below.
The XMM-ESAS tasks pn-spectra (mos-spectra) followed by pn
 $\_$
back (mos
$\_$
back (mos
 $\_$
back) were used to generate the PN (MOS1/MOS2) images of UGC 10420 in three different energy bands (one at a time), viz. soft:
$\_$
back) were used to generate the PN (MOS1/MOS2) images of UGC 10420 in three different energy bands (one at a time), viz. soft:
 $400-2000$
eV, hard:
$400-2000$
eV, hard:
 $2000-7000$
eV, and total:
$2000-7000$
eV, and total:
 $400-7000$
eV, by setting the elow and ehigh energy parameters to the requisite values (unit: eV). These tasks also generated the QPB images and exposure maps for each EPIC detector. The individual PN, MOS1, and MOS2 counts images, exposure maps, and model QPB images were then combined into a single counts, exposure, and QPB image using the task comb. Finally, a combined PN, MOS1, and MOS2 particle-background-subtracted, exposure-corrected, and adaptively smoothed surface brightness image of UGC 10420 was generated using the task adapt. A smoothing scale of 10 counts and a pixel size of
$400-7000$
eV, by setting the elow and ehigh energy parameters to the requisite values (unit: eV). These tasks also generated the QPB images and exposure maps for each EPIC detector. The individual PN, MOS1, and MOS2 counts images, exposure maps, and model QPB images were then combined into a single counts, exposure, and QPB image using the task comb. Finally, a combined PN, MOS1, and MOS2 particle-background-subtracted, exposure-corrected, and adaptively smoothed surface brightness image of UGC 10420 was generated using the task adapt. A smoothing scale of 10 counts and a pixel size of
 $2.5{^{\prime\prime}}$
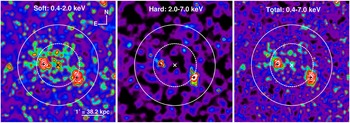
were used. X-ray images of UGC 10420 in the three energy bands are shown in Figure 4. The nuclear region around the optical centre appears to be very faint and soft in X-rays, with two bright spots, neither of which is coincident with the optical centre, and surrounded by some diffuse emission. Emission from the central region cannot be seen in the hard X-ray band, however. The two bright sources far away from the nuclear region on the east and west are confirmed as point sources using the ESAS task cheese, which runs point source detection by calling the SAS task edetect
$2.5{^{\prime\prime}}$
were used. X-ray images of UGC 10420 in the three energy bands are shown in Figure 4. The nuclear region around the optical centre appears to be very faint and soft in X-rays, with two bright spots, neither of which is coincident with the optical centre, and surrounded by some diffuse emission. Emission from the central region cannot be seen in the hard X-ray band, however. The two bright sources far away from the nuclear region on the east and west are confirmed as point sources using the ESAS task cheese, which runs point source detection by calling the SAS task edetect
 $\_$
chain. We used a detection box of
$\_$
chain. We used a detection box of
 $5\times 5$
pixels for this purpose. Further analysis of these X-ray sources is presented in § 3.3.
$5\times 5$
pixels for this purpose. Further analysis of these X-ray sources is presented in § 3.3.
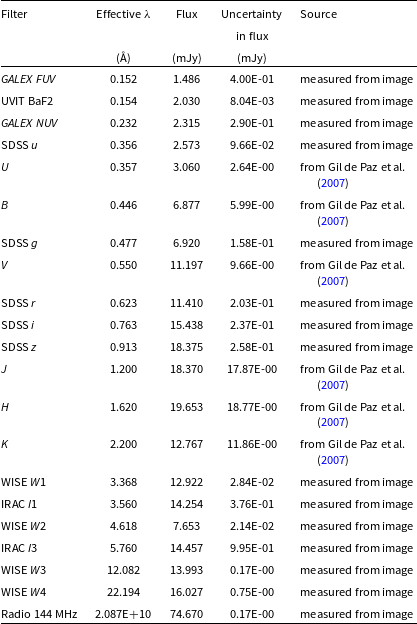
Integrated flux measurements for UGC 10420 in different wavebands, in increasing order of wavelength from top to bottom.

Empirical facts about Abell 2199 (Rines et al., Reference Rines, Geller, Diaferio and Hwang2016).

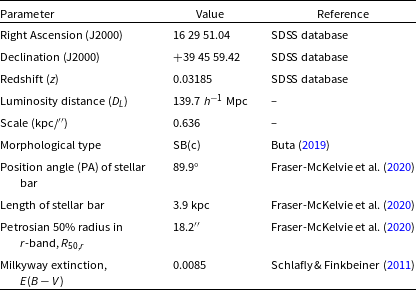
Observed properties of UGC 10420, a member galaxy of cluster Abell 2199.

2.3. Optical data
The optical photometric and spectroscopic data used in this paper are sourced from the Sloan Digital Sky Survey (SDSS, data release 14; Abolfathi et al., Reference Abolfathi2018), unless mentioned otherwise. The SDSS images have an exposure time of 53.9 seconds in each of the five filters u, g, r, i, z. Photometry was performed in all five wavebands using an aperture size of
 $0.8{^{\prime}}$
, following the procedure described in Sec. 2.1. The measured counts were then converted to fluxes using the standard conversion factor from maggies to Jy and are listed in Table 1.
$0.8{^{\prime}}$
, following the procedure described in Sec. 2.1. The measured counts were then converted to fluxes using the standard conversion factor from maggies to Jy and are listed in Table 1.
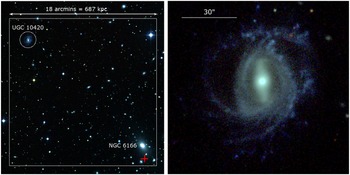
In Fig. 3 (left), we show the position of the galaxy relative to the centre of Abell 2199, on the digitised sky survey (DSS) image of the field. UGC 10420 is
 ${\sim} 680$
kpc away from the cD galaxy NGC 6166 of the cluster. A composite g, r, i image of UGC 10420, shown in Fig. 3 (right), clearly shows the asymmetry in the spiral arms of UGC 10420, and the presence of a bar at the centre, in agreement with the morphological classification of type SB(c) (Buta, Reference Buta2019). Even though the outer regions of UGC 10420 are optically blue, majority of the optical emission from the disc is dominated by red stellar populations, as quantified by a colour value of
${\sim} 680$
kpc away from the cD galaxy NGC 6166 of the cluster. A composite g, r, i image of UGC 10420, shown in Fig. 3 (right), clearly shows the asymmetry in the spiral arms of UGC 10420, and the presence of a bar at the centre, in agreement with the morphological classification of type SB(c) (Buta, Reference Buta2019). Even though the outer regions of UGC 10420 are optically blue, majority of the optical emission from the disc is dominated by red stellar populations, as quantified by a colour value of
 $(g-r) \sim 0.8$
mag, which is typical for passively-evolving late-type galaxies (e.g. Mahajan & Raychaudhury, Reference Mahajan and Raychaudhury2009; Song et al., Reference Song, Hwang, Park and Tamura2017; Mahajan et al., Reference Mahajan2020).
$(g-r) \sim 0.8$
mag, which is typical for passively-evolving late-type galaxies (e.g. Mahajan & Raychaudhury, Reference Mahajan and Raychaudhury2009; Song et al., Reference Song, Hwang, Park and Tamura2017; Mahajan et al., Reference Mahajan2020).
(left:) The combined B, R, and I band digitised sky survey (DSS) image of the sky around UGC 10420. The central elliptical galaxy of Abell 2199, NGC 6166 is marked along with the X-ray centre of the cluster (red cross; Mahdavi & Geller, Reference Mahdavi and Geller2001) at the bottom right to show the relative position of UGC 10420 in the cluster. (right:) This is an optical g, r, i image of UGC 10420 created using the SDSS photometric data. North is up and east is on the left for both images.

left to right: Particle-background-subtracted, exposure-corrected, combined PN, MOS1, and MOS2 XMM-Newton surface brightness image of UGC 10420 in the soft (0.4–2.0 keV), hard (2.0–7.0 keV), and total (0.4–7.0 keV) X-ray energy bands. The surface brightness contours are as follows – soft band: 6 levels (9.9, 20.9, 36.1, 61.1, 105.0, and 184.3 cts s
 $^{-1}$
deg
$^{-1}$
deg
 $^{-2}$
) between 3
$^{-2}$
) between 3
 $\sigma$
and
$\sigma$
and
 $88\sigma$
above a background level of 3.7 cts s
$88\sigma$
above a background level of 3.7 cts s
 $^{-1}$
deg
$^{-1}$
deg
 $^{-2}$
; hard band: 3 levels (17.1, 30.8, and 81.3 cts s
$^{-2}$
; hard band: 3 levels (17.1, 30.8, and 81.3 cts s
 $^{-1}$
deg
$^{-1}$
deg
 $^{-2}$
) between 3
$^{-2}$
) between 3
 $\sigma$
and 19
$\sigma$
and 19
 $\sigma$
above a background level of 5.1 cts s
$\sigma$
above a background level of 5.1 cts s
 $^{-1}$
deg
$^{-1}$
deg
 $^{-2}$
; total band: 5 levels (16.5, 43.9, 87.4, 172.8, and 350.2 cts s
$^{-2}$
; total band: 5 levels (16.5, 43.9, 87.4, 172.8, and 350.2 cts s
 $^{-1}$
deg
$^{-1}$
deg
 $^{-2}$
) between
$^{-2}$
) between
 $3\sigma$
and
$3\sigma$
and
 $98\sigma$
above a background level of 6 cts s
$98\sigma$
above a background level of 6 cts s
 $^{-1}$
deg
$^{-1}$
deg
 $^{-2}$
. In each panel, the
$^{-2}$
. In each panel, the
 $\times$
symbol marks the optical centre of UGC 10420, and the
$\times$
symbol marks the optical centre of UGC 10420, and the
 $+$
symbols mark the centres of the two X-ray point sources detected in the galaxy. The solid white and dashed white circles represent the
$+$
symbols mark the centres of the two X-ray point sources detected in the galaxy. The solid white and dashed white circles represent the
 $1.5{^{\prime}}$
and
$1.5{^{\prime}}$
and
 $0.8{^{\prime}}$
radius apertures, respectively, centred at the optical centre.
$0.8{^{\prime}}$
radius apertures, respectively, centred at the optical centre.

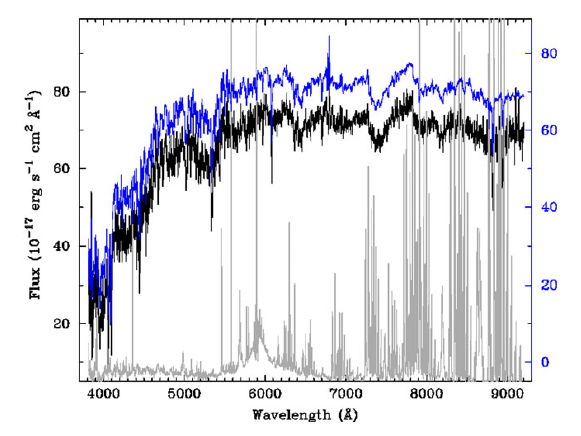
The optical spectrum of UGC 10420 obtained from the
 $3{^{\prime\prime}}$
diameter SDSS fibre is shown in Fig. 5 (also see Fig. 1 for a comparison between the size of the fibre relative to the galaxy). On the basis of emission line fluxes obtained from this spectrum, UGC 10420 is classified as a LINER galaxy, using the BPT (Baldwin et al., Reference Baldwin, Phillips and Terlevich1981) emission-line diagnostic diagram (Toba et al., Reference Toba2014).
$3{^{\prime\prime}}$
diameter SDSS fibre is shown in Fig. 5 (also see Fig. 1 for a comparison between the size of the fibre relative to the galaxy). On the basis of emission line fluxes obtained from this spectrum, UGC 10420 is classified as a LINER galaxy, using the BPT (Baldwin et al., Reference Baldwin, Phillips and Terlevich1981) emission-line diagnostic diagram (Toba et al., Reference Toba2014).
2.4. Infrared data
The infrared (IR) observations for UGC 10420 were obtained from the Infrared Science Archive (IRSA) of the NASA Infrared Processing and Analysis Center (IPAC)Footnote c. For this work we used the images from the Wide-field Infrared Survey Explorer (WISE; Wright et al., Reference Wright2010), as well as the Infrared Array Camera (IRAC) aboard the Spitzer mission.
WISE observed the sky in the near- and mid-infrared wavebands between 3.6 and 22
 $\mu$
m. We performed photometry on all the four band ALLWISE images, and channels 1 and 3 IRAC images (3.6 and 5.8
$\mu$
m. We performed photometry on all the four band ALLWISE images, and channels 1 and 3 IRAC images (3.6 and 5.8
 $\mu$
m, respectively) in the same manner as described in sec. 2.1, but using an aperture of
$\mu$
m, respectively) in the same manner as described in sec. 2.1, but using an aperture of
 $0.8{^{\prime}}$
. Our choice of aperture size is dictated by the fact that the UGC 10420’s image is much smaller in these bands, and, the aperture of
$0.8{^{\prime}}$
. Our choice of aperture size is dictated by the fact that the UGC 10420’s image is much smaller in these bands, and, the aperture of
 $1.5{^{\prime}}$
used for the UV data would include many galactic and extragalactic sources not visible in other bands, thereby contaminating the flux measurement. The estimated fluxes are listed in Table 1. A glimpse of the IR emission relative to the light in the optical and FUV filters can be seen in Fig. 2 (right) and Fig. 6. Figs. 1–3 and 5 show that the optical-IR emission is concentrated in the central region of the galaxy encompassing the nucleus and the stellar bar, where as the FUV emission dominates the outer regions of the galaxy.
$1.5{^{\prime}}$
used for the UV data would include many galactic and extragalactic sources not visible in other bands, thereby contaminating the flux measurement. The estimated fluxes are listed in Table 1. A glimpse of the IR emission relative to the light in the optical and FUV filters can be seen in Fig. 2 (right) and Fig. 6. Figs. 1–3 and 5 show that the optical-IR emission is concentrated in the central region of the galaxy encompassing the nucleus and the stellar bar, where as the FUV emission dominates the outer regions of the galaxy.
The spectrum (black line) from the nuclear region of UGC 10420 (also see Fig. 1), based on which it is classified as a LINER galaxy. The blue and grey lines represent the best-fit model to the spectrum, and emission from the sky, respectively. The model spectrum is offset along the ordinate for clarity, and the corresponding shifted axis is shown in blue on the right. All the data shown in this image are sourced from the SDSS database.

A composite image of UGC 10420 created using the IRAC 3.6
 $\mu$
m (red), SDSS g-band (green) and UVIT FUV (blue) data, respectively. Despite different pixel sizes and depth of the three datasets, this image shows the distorted spiral arms of UGC 10420 which are likely perturbed by the interaction with the intracluster medium. It is also evident that most of the star-formation is now occurring in the outer regions of the galaxy.
$\mu$
m (red), SDSS g-band (green) and UVIT FUV (blue) data, respectively. Despite different pixel sizes and depth of the three datasets, this image shows the distorted spiral arms of UGC 10420 which are likely perturbed by the interaction with the intracluster medium. It is also evident that most of the star-formation is now occurring in the outer regions of the galaxy.

2.5. Radio data
The radio image of UGC 10420 is obtained from the data release 2 of the ongoing LOw-Frequency ARray (LOFAR) Two-metre Sky Survey (LoTSS; 120–168 MHz; Shimwell et al., Reference Shimwell2022). The LoTSS images were derived from the LOFAR high band antenna data, which were corrected for the direction-independent instrumental properties as well as direction-dependent ionospheric distortions with fully automated, data processing. At
 ${\sim} 6{^{\prime\prime}}$
resolution, the full bandwidth Stokes I continuum maps of these data at a central frequency of 144 MHz, have a median root mean square (rms) sensitivity of
${\sim} 6{^{\prime\prime}}$
resolution, the full bandwidth Stokes I continuum maps of these data at a central frequency of 144 MHz, have a median root mean square (rms) sensitivity of
 $83\,\mu$
Jy/beam, a flux density scale accuracy of approximately 10%, and astrometric accuracy of
$83\,\mu$
Jy/beam, a flux density scale accuracy of approximately 10%, and astrometric accuracy of
 $0.2{^{\prime\prime}}$
.
$0.2{^{\prime\prime}}$
.
The radio flux density mentioned in Table 1 was obtained using aips. In order to determine the flux density, the counts in a polygon region centred at UGC 10420 were determined and divided by the area covered by the beam. The uncertainty in the flux was calculated as the product of the square root of the number of beams within the polygon region, and the rms uncertainty (
 $=0.017$
mJy) in a similar sized source-free region. The flux density scale uncertainty for the LoTSS data is found to be
$=0.017$
mJy) in a similar sized source-free region. The flux density scale uncertainty for the LoTSS data is found to be
 ${\sim} 6\%$
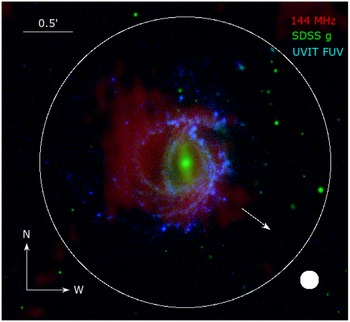
(Shimwell et al., Reference Shimwell2022). The 144 MHz emission encompasses the optical disc of the galaxy as shown in an optical-UV-radio composite image of UGC 10420 in Fig. 7. The radio emission appears to be orientated along the direction of motion of the galaxy with a gap in the middle, in line with the FUV image of the galaxy (Fig. 1).
${\sim} 6\%$
(Shimwell et al., Reference Shimwell2022). The 144 MHz emission encompasses the optical disc of the galaxy as shown in an optical-UV-radio composite image of UGC 10420 in Fig. 7. The radio emission appears to be orientated along the direction of motion of the galaxy with a gap in the middle, in line with the FUV image of the galaxy (Fig. 1).
This composite image of the UGC 10420 shows the low-frequency LOFAR radio emission (red), the optical g-band (green) and the UVIT FUV emission (blue), respectively. The synthesised radio beam is represented by the
 $6{^{\prime\prime}}$
radius circle at the bottom right. It is noteworthy that an excess of radio emission is detected in the northwestern part of the galaxy, opposite to the direction of the cluster centre. The arrow points in the direction of the cluster centre.
$6{^{\prime\prime}}$
radius circle at the bottom right. It is noteworthy that an excess of radio emission is detected in the northwestern part of the galaxy, opposite to the direction of the cluster centre. The arrow points in the direction of the cluster centre.

3. Analysis and results
3.1. Spectral energy distribution
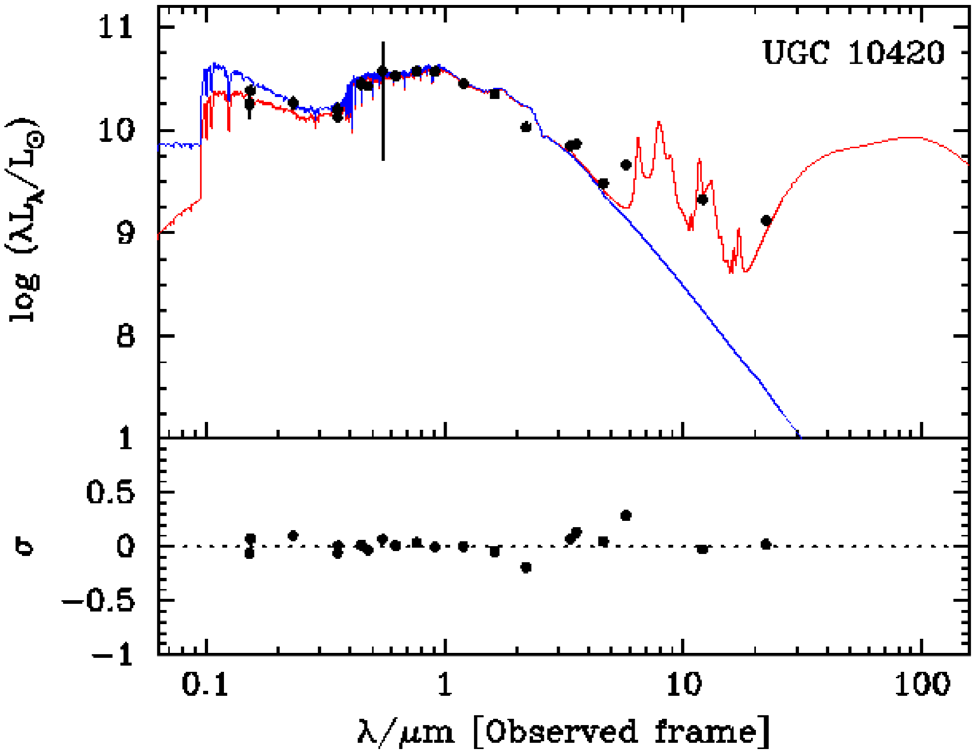
The arsenal of data mentioned in Section 2 can be used to derive useful information about the stars, gas, and dust of UGC 10420 by means of its spectral energy distribution (SED). In this work we use the self-contained model package called Multi-wavelength Analysis of Galaxy Physical Properties (magphys; da Cunha et al., Reference da Cunha, Charlot and Elbaz2008) to model the SED of UGC 10420. magphys takes the photometric data from UV to IR wavebands as input, to model the attenuated and unattenuated SED of a galaxy. It makes use of the stellar evolution models by Bruzual & Charlot (Reference Bruzual and Charlot2003), assuming a Chabrier (Reference Chabrier2003) initial mass function and a Charlot & Fall (Reference Charlot and Fall2000) attenuation law. For UGC 10420 we input the data listed in Table 1 (sans radio flux).
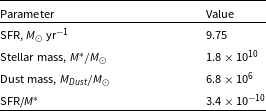
The output is shown in Fig. 8, and some of the derived physical parameters: SFRFootnote d, stellar mass (
 $M^*$
), dust mass (M
$M^*$
), dust mass (M
 $_{Dust}$
) and specific star formation rate (SFR/
$_{Dust}$
) and specific star formation rate (SFR/
 $M^*$
; sSFR henceforth) are listed in Table 4, respectively. The physical properties of UGC 10420 are typical of optically-selected red spiral galaxies explored in the literature (e.g. Mahajan et al., Reference Mahajan2020).
$M^*$
; sSFR henceforth) are listed in Table 4, respectively. The physical properties of UGC 10420 are typical of optically-selected red spiral galaxies explored in the literature (e.g. Mahajan et al., Reference Mahajan2020).
The integrated UV to near-infrared spectral energy distribution (SED) of the galaxy UGC 10420. In the top panel, photometric data from Table 8 are shown as black points. These data are used to fit an SED using the code magphys (da Cunha et al., Reference da Cunha, Charlot and Elbaz2008). The attenuated (red line), and unattenuated (blue line) best-fit SEDs are also shown. The residuals with respect to the best-fit are shown in the bottom panel. Also see Table 4 for the physical parameters derived from this SED.

Some physical parameters estimated from the SED of UGC 10420 fitted using the magphys code (da Cunha et al., Reference da Cunha, Charlot and Elbaz2008).

3.2. Star-forming regions
It has been shown that the detection of extended UV (XUV) emission beyond the optical extent of the galaxy is not very uncommon in nearby star-forming galaxies (e.g. Thilker et al., Reference Thilker2007). A comparison between this star formation far away from the centre of the galaxy, and that in the optical disc is therefore crucial in understanding star formation processes. Moreover, we are unaware of any XUV disc observed in clusters, which makes UGC 10420 a very unique galaxy.
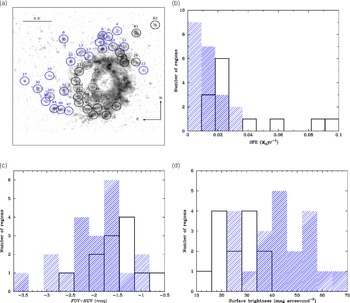
We take advantage of the high resolution of the UVIT to get a better perspective on the individual regions which have been resolved in UGC 10420. In order to do so, we classified these regions based on their distance from the centre of the galaxy. As shown in Fig. 9(a), all regions
 ${>}0.5^\prime$
from the centre of the galaxy are classified as XUV regions (blue circles) and are mostly located outside the optical disc of the galaxy. Most of these XUV regions have a faint or no optical counterpart in the SDSS g-band image. The regions which are part of the galactic disc are further sub-classified into two categories: regions which are comparable to the XUV regions in size and luminosity, and having an optical counterpart are shown in solid black circles; these are henceforth referred to as the inner regions. Secondly, the regions closer to the centre of the galaxy, which form the bulk of the emission from UGC 10420 in almost all filters are represented by dashed black circles. In total there are 21 XUV regions which are compared to 13 inner regions, while the 11 innermost regions are ignored in the following analysis because they are much more luminous (and massive) than the XUV regions. The objects marked as B1 and B2 are background galaxies and are ignored hereafter.
${>}0.5^\prime$
from the centre of the galaxy are classified as XUV regions (blue circles) and are mostly located outside the optical disc of the galaxy. Most of these XUV regions have a faint or no optical counterpart in the SDSS g-band image. The regions which are part of the galactic disc are further sub-classified into two categories: regions which are comparable to the XUV regions in size and luminosity, and having an optical counterpart are shown in solid black circles; these are henceforth referred to as the inner regions. Secondly, the regions closer to the centre of the galaxy, which form the bulk of the emission from UGC 10420 in almost all filters are represented by dashed black circles. In total there are 21 XUV regions which are compared to 13 inner regions, while the 11 innermost regions are ignored in the following analysis because they are much more luminous (and massive) than the XUV regions. The objects marked as B1 and B2 are background galaxies and are ignored hereafter.
(a) Individual ‘regions’ detected by the sextractor overlaid on the UVIT image are shown. The regions are colour-coded as follows: the regions with little to no optical emission are classified as XUV regions shown in (blue), those which have optical emission in the g-band, and lie
 ${>} 0.5^\prime$
away from the optical centre as regions in galaxy (solid black), respectively. Objects marked as B1 and B2 are background galaxies and not considered in our analysis. The counterparts of the latter form the bulk of the galaxy photometry in almost all the filters (and hence are very different from the smaller star-forming regions/clumps explored in this analysis) are shown as (dashed black) circles. The other panels show a comparison between the (b) SFR determined from FUV luminosity, (c) the FUV-NUV colour, and (d) surface brightness of the regions in the galaxy (solid black), and the XUV regions (hatched blue), respectively. It is evident that the XUV regions are bluer, brighter and have lower SFR relative to similar regions closer to the centre of the galaxy.
${>} 0.5^\prime$
away from the optical centre as regions in galaxy (solid black), respectively. Objects marked as B1 and B2 are background galaxies and not considered in our analysis. The counterparts of the latter form the bulk of the galaxy photometry in almost all the filters (and hence are very different from the smaller star-forming regions/clumps explored in this analysis) are shown as (dashed black) circles. The other panels show a comparison between the (b) SFR determined from FUV luminosity, (c) the FUV-NUV colour, and (d) surface brightness of the regions in the galaxy (solid black), and the XUV regions (hatched blue), respectively. It is evident that the XUV regions are bluer, brighter and have lower SFR relative to similar regions closer to the centre of the galaxy.

FUV light is emitted by stars with masses of several solar masses, and a mean age of 10 Myr (
 $10-100$
Myr), with the shortest wavelengths corresponding to the shortest timescales (Hao et al., Reference Hao, Kennicutt, Johnson, Calzetti, Dale and Moustakas2011; Murphy et al., Reference Murphy2011; Kennicutt & Evans, Reference Kennicutt and Evans2012). The UV continuum emission from 1200 to 3200 Å is therefore an inevitable consequence of recent star formation. As a result, FUV luminosity is a direct tracer of recent star formation (few tens of Myr) occurring in a galaxy and can be used to estimate the rate of star formation (SFR). In this work we employ the prescription provided by Iglesias-Páramo et al. (Reference Iglesias-Páramo2006):
$10-100$
Myr), with the shortest wavelengths corresponding to the shortest timescales (Hao et al., Reference Hao, Kennicutt, Johnson, Calzetti, Dale and Moustakas2011; Murphy et al., Reference Murphy2011; Kennicutt & Evans, Reference Kennicutt and Evans2012). The UV continuum emission from 1200 to 3200 Å is therefore an inevitable consequence of recent star formation. As a result, FUV luminosity is a direct tracer of recent star formation (few tens of Myr) occurring in a galaxy and can be used to estimate the rate of star formation (SFR). In this work we employ the prescription provided by Iglesias-Páramo et al. (Reference Iglesias-Páramo2006):
 \begin{equation} {\rm log(SFR}_{FUV}/{\rm M}_{\odot} \,yr^{-1}) = {\rm log}(L_{FUV}/L_{\odot}) - 9.51 \end{equation}
where,
 $L_{FUV}$
is the FUV luminosity of the galaxy corrected for galactic extinction (
$L_{FUV}$
is the FUV luminosity of the galaxy corrected for galactic extinction (
 $A_{FUV}$
). The calibration for this prescription is derived from Starburst99 models (Leitherer et al., Reference Leitherer1999), assuming a solar metallicity and a Salpeter IMF from
$A_{FUV}$
). The calibration for this prescription is derived from Starburst99 models (Leitherer et al., Reference Leitherer1999), assuming a solar metallicity and a Salpeter IMF from
 $0.1-100\,{\rm M}_{\odot}$
. Galactic extinction,
$0.1-100\,{\rm M}_{\odot}$
. Galactic extinction,
 $A_{FUV} = 8.06 \times E(B-V)$
(Bianchi, Reference Bianchi2011), where the colour excess
$A_{FUV} = 8.06 \times E(B-V)$
(Bianchi, Reference Bianchi2011), where the colour excess
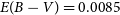 $E(B-V) = 0.0085$
for UGC 10420 is obtained from the dust reddening maps of Schlafly & Finkbeiner (Reference Schlafly and Finkbeiner2011)Footnote e.
$E(B-V) = 0.0085$
for UGC 10420 is obtained from the dust reddening maps of Schlafly & Finkbeiner (Reference Schlafly and Finkbeiner2011)Footnote e.
Fig. 9(b) shows a comparison between the SFR estimated for the XUV regions, and the inner regions using the SFR derived from UVIT data. It is notable that the XUV regions on average have lower SFR and smaller dispersion relative to similar regions closer to the centre of the galaxy. Specifically, the mean and standard deviation of SFR for the XUV regions is
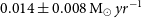 $0.014\pm0.008\,{\rm M}_{\odot} \,yr^{-1}$
, relative to the value for the inner regions
$0.014\pm0.008\,{\rm M}_{\odot} \,yr^{-1}$
, relative to the value for the inner regions
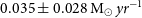 $0.035\pm0.028\,{\rm M}_{\odot} \,yr^{-1}$
. The Kolmogorov-Smirnov (KS) statistical test probability (p), in favour of the hypothesis that the two distributions are drawn from the same parent sample is 1.77E-03, thus suggesting that they are disparate. Furthermore, the XUV regions have bluer
$0.035\pm0.028\,{\rm M}_{\odot} \,yr^{-1}$
. The Kolmogorov-Smirnov (KS) statistical test probability (p), in favour of the hypothesis that the two distributions are drawn from the same parent sample is 1.77E-03, thus suggesting that they are disparate. Furthermore, the XUV regions have bluer
 $FUV-NUV$
colours (Fig. 9(c);
$FUV-NUV$
colours (Fig. 9(c);
 $p =$
2.99E-02), and are brighter than the inner regions (Fig. 9(d);
$p =$
2.99E-02), and are brighter than the inner regions (Fig. 9(d);
 $p =$
2.09E-03). The respective mean surface brightness value for the XUV regions is
$p =$
2.09E-03). The respective mean surface brightness value for the XUV regions is
 $42.8\pm12.1$
magnitude arcseconds
$42.8\pm12.1$
magnitude arcseconds
 $^{-2}$
, relative to only
$^{-2}$
, relative to only
 $26.1\pm7.2$
magnitude arcseconds
$26.1\pm7.2$
magnitude arcseconds
 $^{-2}$
for the inner regions.
$^{-2}$
for the inner regions.
It is noteworthy that even though a correction for internal extinction is important when converting FUV luminosity to SFR (e.g. Mahajan et al., Reference Mahajan, Ashby, Willner, Barmby, Fazio, Maragkoudakis, Raychaudhury and Zezas2019), in this case we are unable to do so because of the unavailability of FIR data, and hence the estimated SFRs may be regarded as lower limits. The result from these comparisons therefore should only be considered in a qualitative sense, assuming that the internal extinction in the XUV regions and inner regions is the same. Also, resolution effects may play a significant role in this comparison, since only the most massive star-forming regions may be resolved at the distance of UGC 10420. Most of the ‘regions’ considered here, therefore may be much larger than typical star-forming regions observed in nearby galaxies.
This distinction suggests that the XUV regions are statistically different from the inner regions. In our opinion, these qualitative differences suggest that they have different origins. As UGC 10420 interacts with the surrounding ICM, some of the cold atomic gas from the galaxy is stripped, leaving a wake in the direction opposite to the direction of the motion of the galaxy. The fact that the cluster centre lies diametrically opposite to the direction of the XUV tail(s) pointing towards the north-east, forms the basis of this idea. Star-forming regions beyond the optical disc have been observed in several other nearby galaxies (e.g. Cortese et al., Reference Cortese2007; Werk et al., Reference Werk2010; Poggianti et al., Reference Poggianti2017; Boselli et al., Reference Boselli2021). In particular, the galaxy IC 3476 in the Virgo cluster which is experiencing edge-on stripping is worth mentioning, since it shows HII regions in the two diametrically opposite ends of the galaxy just like UGC 10420 (see fig. 4 of Boselli et al., Reference Boselli2021). Also, even though we only have access to the low-frequency radio data for UGC 10420, it is evident from Fig. 7, that there is more radio emission on the trailing edge of the galaxy relative to the western side facing the cluster centre. In this situation, the inner regions are formed where the stripped gas experiences a shock, while the XUV regions are formed in the wake of the RPS gas tails.
3.3. Diffuse X-ray emission from UGC 10420
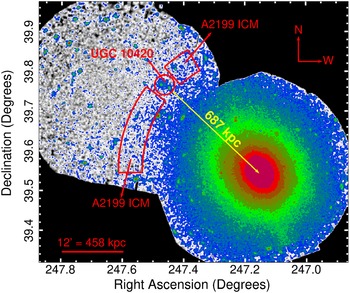
In § 2.2 we pointed out the existence of diffuse soft X-ray emission connecting two bright point-like sources and the nucleus of the galaxy (Fig. 4 left panel). Here, we have tried to isolate the diffuse component in UGC 10420 and study its properties. The properties of the point sources are studied and presented in the next section. In Figure 10, we show the X-ray emission from Abell 2199 and its outskirts. The location of UGC 10420 with respect to Abell 2199 is also shown. This figure was derived from both the current observation and another XMM-Newton observation centered on the cluster centre. To isolate and study the properties of the diffuse X-ray emission associated with the galaxy, we have to estimate and remove the contribution of the backgrounds, cluster emission and the point sources.
X-ray image in the energy band 0.4–2.0 keV showing the location of UGC 10420 within its host galaxy cluster Abell 2199. The galaxy is located at a projected distance of
 ${\sim} 680$
kpc from the X-ray peak of Abell 2199. The small red circle (labelled UGC 10420) is used for estimating the properties of the diffuse X-ray emission associated with UGC 10420. The partial annular regions sandwiching UGC 10420 (highlighted in red colour and labelled A2199 ICM) are used for estimating the properties of the Abell 2199 ICM at the location of the galaxy.
${\sim} 680$
kpc from the X-ray peak of Abell 2199. The small red circle (labelled UGC 10420) is used for estimating the properties of the diffuse X-ray emission associated with UGC 10420. The partial annular regions sandwiching UGC 10420 (highlighted in red colour and labelled A2199 ICM) are used for estimating the properties of the Abell 2199 ICM at the location of the galaxy.

We performed spectral analysis of emission within the red circular region (radius:
 $1.5{^{\prime}}$
; label: UGC 10420) shown in Figure 10 to estimate the properties of overall diffuse X-ray emission from UGC 10420. The contribution from the two point sources in UGC 10420, shown in Figure 4, was removed using the mask image generated by the task cheese (Sec. 2.2). The source spectrum, the modelled background spectrum, and the spectral response of the EPIC were extracted within the red circular region encompassing the diffuse emission in UGC 10420 using the tasks pn-spectra (mos-spectra) and pn
$1.5{^{\prime}}$
; label: UGC 10420) shown in Figure 10 to estimate the properties of overall diffuse X-ray emission from UGC 10420. The contribution from the two point sources in UGC 10420, shown in Figure 4, was removed using the mask image generated by the task cheese (Sec. 2.2). The source spectrum, the modelled background spectrum, and the spectral response of the EPIC were extracted within the red circular region encompassing the diffuse emission in UGC 10420 using the tasks pn-spectra (mos-spectra) and pn
 $\_$
back (mos
$\_$
back (mos
 $\_$
back). All spectra were suitably grouped using the FTOOL grppha (HEASoft version 6.30.1) and analysed using XSPEC version 12.12.1 (Arnaud, Reference Arnaud and Jacoby1996). The diffuse background components towards UGC 10420 include the diffuse soft X-background (SXRB) and the cosmic X-ray background (CXB) which are described in detail in Tiwari & Singh (Reference Tiwari and Singh2021). Since UGC 10420 is located in the outskirts of Abell 2199, there is also a significant contribution from the intracluster gas. Therefore, in addition to the X-ray background components, it is also necessary to account for the emission from the ICM of Abell 2199 at the galaxy’s location, when modelling its diffuse emission, as described below.
$\_$
back). All spectra were suitably grouped using the FTOOL grppha (HEASoft version 6.30.1) and analysed using XSPEC version 12.12.1 (Arnaud, Reference Arnaud and Jacoby1996). The diffuse background components towards UGC 10420 include the diffuse soft X-background (SXRB) and the cosmic X-ray background (CXB) which are described in detail in Tiwari & Singh (Reference Tiwari and Singh2021). Since UGC 10420 is located in the outskirts of Abell 2199, there is also a significant contribution from the intracluster gas. Therefore, in addition to the X-ray background components, it is also necessary to account for the emission from the ICM of Abell 2199 at the galaxy’s location, when modelling its diffuse emission, as described below.
The partial annular regions sandwiching UGC 10420 shown in Figure 10 (label: A2199 ICM) were used to estimate the properties of the intracluster gas in the region around the galaxy. The PN, MOS1, and MOS2 spectra extracted from these annular regions were fitted jointly in the energy range 0.4–7.0 keV with the Rosat All Sky Survey (RASS) diffuse background spectrum using the model constant*(apec+tbabs*(apec+apec+pegpwrlw) + tbabs*apec). We refer the reader to Tiwari & Singh (Reference Tiwari and Singh2021) for definitions of the individual XSPEC models and details of the background modelling. For completeness, we mention that the model component apec+tbabs*(apec+apec+pegpwrlw) in the expression above represents the complete X-ray background (SXRB + CXB). The second model component tbabs*apec represents the absorbed X-ray emission from the cluster outskirts. The constant factor is used to scale the model normalisation of the PN, MOS1, and MOS2 data to ensure consistency with the RASS spectral data which is in units of cts s
 $^{-1}$
arcmin
$^{-1}$
arcmin
 $^{-2}$
. We fixed the total Hydrogen column density,
$^{-2}$
. We fixed the total Hydrogen column density,
 $N_H$
, along the line of sight to UGC 10420/Abell 2199 outskirts to
$N_H$
, along the line of sight to UGC 10420/Abell 2199 outskirts to
 $9.63\times 10^{19}$
cm
$9.63\times 10^{19}$
cm
 $^{-2}$
, based on the work of Willingale et al. (Reference Willingale, Starling, Beardmore, Tanvir and O’Brien2013)Footnote f. The redshift was frozen at 0.03185. Two additional models – gauss (1.49 keV) and gauss (1.75 keV) – were used to model the instrumental background lines – the Al K
$^{-2}$
, based on the work of Willingale et al. (Reference Willingale, Starling, Beardmore, Tanvir and O’Brien2013)Footnote f. The redshift was frozen at 0.03185. Two additional models – gauss (1.49 keV) and gauss (1.75 keV) – were used to model the instrumental background lines – the Al K
 $\alpha$
line at
$\alpha$
line at
 ${\sim}$
1.49 keV for PN, MOS1, and MOS2, and the Si K
${\sim}$
1.49 keV for PN, MOS1, and MOS2, and the Si K
 $\alpha$
line at
$\alpha$
line at
 ${\sim}$
1.75 keV for the MOS1 and MOS2 detectors – as and when required.
${\sim}$
1.75 keV for the MOS1 and MOS2 detectors – as and when required.
The intracluster gas at the location of UGC 10420 was found to have a temperature of
 $3.3^{+0.9}_{-0.7}$
keV and metallicity of
$3.3^{+0.9}_{-0.7}$
keV and metallicity of
 ${\sim}$
0.2 Z
${\sim}$
0.2 Z
 $_{\odot}$
(
$_{\odot}$
(
 $\chi^{2}=366.07$
,
$\chi^{2}=366.07$
,
 $\text{dof}=354$
). These properties of the ICM of Abell 2199 are in agreement with previous studies by Kawaharada et al. (Reference Kawaharada, Makishima, Kitaguchi, Okuyama, Nakazawa and Fukazawa2010) and Mirakhor & Walker (Reference Mirakhor and Walker2020).
$\text{dof}=354$
). These properties of the ICM of Abell 2199 are in agreement with previous studies by Kawaharada et al. (Reference Kawaharada, Makishima, Kitaguchi, Okuyama, Nakazawa and Fukazawa2010) and Mirakhor & Walker (Reference Mirakhor and Walker2020).
The properties of the diffuse X-ray emission associated with UGC 10420 were then estimated by fitting the PN, MOS1, and MOS2 spectra extracted from the red circular region in Figure 10 simultaneously with the RASS background data using the model constant*(apec+tbabs*(apec+apec+pegpwrlw) + tbabs*(apec+apec)). The newly added apec component represents emission from the hot interstellar gas in the galaxy. The other model components have the same definitions as described previously. Here, the spectral parameters for the X-ray background, and the temperature and abundance of the Abell 2199 ICM were fixed based on the results of the spectral analysis mentioned above. The energy range 0.4–7.0 keV was used for the spectral fitting. We found the hot gas in UGC 10420 to have a temperature of
 $0.24^{+0.09}_{-0.06}$
keV, with the metal abundance, Z, frozen at the solar value (
$0.24^{+0.09}_{-0.06}$
keV, with the metal abundance, Z, frozen at the solar value (
 $\chi^2=104.53$
, dof
$\chi^2=104.53$
, dof
 $=114$
). If the abundance was left free to vary during the fit, we obtained Z
$=114$
). If the abundance was left free to vary during the fit, we obtained Z
 $=0.8$
Z
$=0.8$
Z
 $_{\odot}$
with the gas temperature unchanged, but the errors in the abundance could not be constrained due to low number of counts.
$_{\odot}$
with the gas temperature unchanged, but the errors in the abundance could not be constrained due to low number of counts.
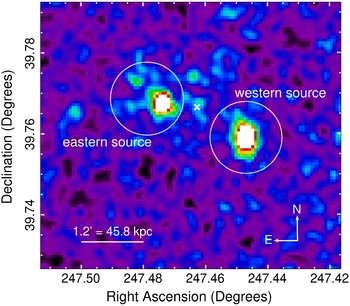
The total band (0.4–7.0 keV) X-ray image showing the eastern and western X-ray point sources in UGC 10420. The
 ${\bf \times}$
symbol marks the optical centre of UGC 10420. The solid white circles mark the regions used for the spectral extraction and analysis of each point source.
${\bf \times}$
symbol marks the optical centre of UGC 10420. The solid white circles mark the regions used for the spectral extraction and analysis of each point source.

3.4. X-ray emission from the two hot spots and nuclear region
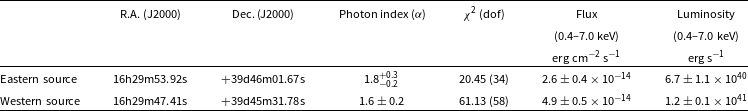
Spectral analysis of the two bright point sources in UGC 10420 was carried out by extracting spectra from the circular regions shown in Figure 11 to estimate their general properties. These relatively large regions, extending beyond the actual size of the detected sources, were used so as to enclose enough counts to make the spectral modelling possible. Since these circular regions also enclose the diffuse emission from the cluster and galaxy, we accounted for these contributions in the spectral analysis as described above. The spectrum of each point source was well fitted by a power-lawFootnote g in the energy range 0.4–7.0 keV. The unabsorbed flux (luminosity) of each point source was estimated by convolving the powerlaw model with the XSPEC model cflux (clumin) after freezing the power-law model normalisation. The results of the spectral analysis and the derived properties of the two point sources are given in Table 5.
Properties of the two X-ray point sources in UGC 10420. The errors in photon index, flux, and luminosity are quoted at 90 per cent confidence level.

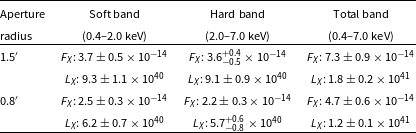
The unabsorbed X-ray flux and luminosity of the entire galaxy (hot spots + diffuse emission) were estimated within two circular apertures of radii
 $0.8{^{\prime}}$
and
$0.8{^{\prime}}$
and
 $1.5{^{\prime}}$
centred at the optical centre of the galaxy (see Figure 4). In order to do so, the PN, MOS1, and MOS2 spectra extracted within the
$1.5{^{\prime}}$
centred at the optical centre of the galaxy (see Figure 4). In order to do so, the PN, MOS1, and MOS2 spectra extracted within the
 $1.5{^{\prime}}$
radius aperture were simultaneously fitted with the RASS data using the model constant* (apec+tbabs*(apec+apec+pegpwrlw) + tbabs*(apec+ apec + powerlaw + powerlaw
)). The highlighted model component represents the total X-ray emission – point sources + diffuse – from UGC 10420. Here, apec represents the diffuse emission from UGC 10420, and the two powerlaw components model the emission from the two point sources in UGC 10420 which lie within the aperture of radius
$1.5{^{\prime}}$
radius aperture were simultaneously fitted with the RASS data using the model constant* (apec+tbabs*(apec+apec+pegpwrlw) + tbabs*(apec+ apec + powerlaw + powerlaw
)). The highlighted model component represents the total X-ray emission – point sources + diffuse – from UGC 10420. Here, apec represents the diffuse emission from UGC 10420, and the two powerlaw components model the emission from the two point sources in UGC 10420 which lie within the aperture of radius
 $1.5{^{\prime}}$
. For modelling the X-ray spectrum within the smaller aperture of radius
$1.5{^{\prime}}$
. For modelling the X-ray spectrum within the smaller aperture of radius
 $0.8{^{\prime}}$
, we used only one powerlaw model since only the eastern point source falls within this aperture. The X-ray flux in the two apertures was then estimated by convolving the apec + powerlaw + powerlaw component with the XSPEC model cflux. Similarly, the total X-ray luminosity was estimated using the XSPEC convolution model clumin. The total X-ray flux and luminosity values for the two apertures in the soft, hard, and total bands are reported in Table 6.
$0.8{^{\prime}}$
, we used only one powerlaw model since only the eastern point source falls within this aperture. The X-ray flux in the two apertures was then estimated by convolving the apec + powerlaw + powerlaw component with the XSPEC model cflux. Similarly, the total X-ray luminosity was estimated using the XSPEC convolution model clumin. The total X-ray flux and luminosity values for the two apertures in the soft, hard, and total bands are reported in Table 6.
Total unabsorbed X-ray flux (
 $F_X$
in erg cm
$F_X$
in erg cm
 $^{-2}$
s
$^{-2}$
s
 $^{-1}$
) and luminosity (
$^{-1}$
) and luminosity (
 $L_X$
in erg s
$L_X$
in erg s
 $^{-1}$
) estimates of UGC 10420. The errors are quoted at 90 per cent confidence level.
$^{-1}$
) estimates of UGC 10420. The errors are quoted at 90 per cent confidence level.

A limit to the soft X-ray flux from the nuclear region, which is not fully resolved, was estimated from the PN data in the soft band and using a circular region with a radius of 9 arcsec. Scaling the estimated PN background to the same size, we obtain a 3
 $\sigma$
upper limit on the soft emission from the nuclear region around the optical centre to be
$\sigma$
upper limit on the soft emission from the nuclear region around the optical centre to be
 ${\sim}$
0.004 counts s
${\sim}$
0.004 counts s
 $^{-1}$
. Assuming the central source to have a photon index of 2, this limit translates to a flux of 5.4
$^{-1}$
. Assuming the central source to have a photon index of 2, this limit translates to a flux of 5.4
 $10^{-15}$
erg cm
$10^{-15}$
erg cm
 $^{-2}$
s
$^{-2}$
s
 $^{-1}$
in the soft energy band, giving a 3
$^{-1}$
in the soft energy band, giving a 3
 $\sigma$
limit on luminosity of 1.4
$\sigma$
limit on luminosity of 1.4
 $10^{40}$
ergs s
$10^{40}$
ergs s
 $^{-1}$
for an AGN like source in the centre.
$^{-1}$
for an AGN like source in the centre.
4. Discussion
In this paper we have presented the UVIT FUV data and ancillary data in other wavebands for the spiral galaxy UGC 10420, a member of the cluster Abell 2199. Our analysis shows that this galaxy, at a projected distance of
 ${\sim} 680$
kpc from the cluster’s centre is being ram-pressure stripped by the ICM of the cluster. It is notable that the l.o.s. velocity offset of UGC 10420 with respect to the mean velocity of Abell 2199 is only
${\sim} 680$
kpc from the cluster’s centre is being ram-pressure stripped by the ICM of the cluster. It is notable that the l.o.s. velocity offset of UGC 10420 with respect to the mean velocity of Abell 2199 is only
 ${\sim} 372$
km s
${\sim} 372$
km s
 $^{-1}$
, which is much smaller than the velocity dispersion of the cluster. This, together with the FUV observations presented in this work, suggests that UGC 10420 must be moving with a very high speed towards the cluster centre, in a direction normal to the l.o.s. As a consequence of stripping, the outer spiral arms of the galaxy are being removed and turned into what looks like a wake of star-forming knots on the south-eastern side of the galaxy (Fig. 1). These observations agree with the simulations of RPS galaxies suggesting that the SFR increases in the gaseous wake of the galaxy rather than the disc itself, and hence is strongly dependant on the density of the surrounding ICM (Kapferer et al., Reference Kapferer, Sluka, Schindler, Ferrari and Ziegler2009).
$^{-1}$
, which is much smaller than the velocity dispersion of the cluster. This, together with the FUV observations presented in this work, suggests that UGC 10420 must be moving with a very high speed towards the cluster centre, in a direction normal to the l.o.s. As a consequence of stripping, the outer spiral arms of the galaxy are being removed and turned into what looks like a wake of star-forming knots on the south-eastern side of the galaxy (Fig. 1). These observations agree with the simulations of RPS galaxies suggesting that the SFR increases in the gaseous wake of the galaxy rather than the disc itself, and hence is strongly dependant on the density of the surrounding ICM (Kapferer et al., Reference Kapferer, Sluka, Schindler, Ferrari and Ziegler2009).
There is an increasing consensus building up in the recent literature that most of the enhanced star formation in RPS galaxies is observed on the ‘leading edge’ of the galaxies (Gavazzi et al., Reference Gavazzi2015; Vulcani et al., Reference Vulcani2018; Hess et al., Reference Hess, Kotulla, Chen, Carignan, Gallagher, Jarrett and Kraan-Korteweg2022; Roberts et al., Reference Roberts, van Weeren, Timmerman, Botteon, Gendron-Marsolais, Ignesti and Rottgering2022a). Such galaxies, showing an unambiguous tail of material stripped from the disc are often called the ‘jellyfish galaxies’ and are considered to be a product of RPS in clusters. It is believed that the stripped gas must cross the entire galaxy disc before leaving it and therefore is more likely to cause instabilities and turbulence, which in turn triggers starburst in jellyfish galaxies (Boselli et al., Reference Boselli, Fossati and Sun2022). Several examples of such jellyfish galaxies have been observationally discovered (Poggianti et al., Reference Poggianti2016; Vulcani et al., Reference Vulcani2018; Safarzadeh & Loeb, Reference Safarzadeh and Loeb2019; Lee et al., Reference Lee, Kimm, Katz, Rosdahl, Devriendt and Slyz2020; Cramer et al., Reference Cramer2021; Roberts et al., Reference Roberts2022b). The FUV observations of UGC 10420, showing intense star-forming knots on the western side of the disc (Fig. 1), also favours this scenario.
In order to test the significance of the increase in the SFR of UGC 10420, we adopted the following SFR main sequence relation derived by Speagle et al. (Reference Speagle, Steinhardt, Capak and Silverman2014) as a function of stellar mass and cosmic time:
 \begin{equation*} {\rm log\,SFR}(M^*,t) = (0.84-0.026t){\rm log}M^*-(6.51-0.11t),\end{equation*}
where, t is the age of the Universe (Gyr) at the redshift of the galaxy. In line with many other observations in the literature (Lee et al., Reference Lee, Lee, Mun, Cho and Kang2022, and references therein), we find that the SED derived SFR of UGC 10420 is at least a factor of nine larger than that expected for star-forming field galaxies of similar mass at
 $z\sim0.03$
.
$z\sim0.03$
.
The observations presented in this work are also in good agreement with a recent study of cluster galaxies in the EAGLE simulations, where Troncoso-Iribarren et al. (Reference Troncoso-Iribarren, Padilla, Santander, Lagos, García-Lambas, Rodríguez and Contreras2020) have shown that properties such as the SFR, star formation efficiency and ISM pressure are enhanced on the leading edge of the normal star-forming galaxies. On the other hand, an increase in the gas particles is observed on the ‘trailing edge’ of these galaxies, suggesting removal of cold gas via RPS. Similar results were obtained by Boselli et al. (Reference Boselli2021), who presented hydrodynamical simulations of the RPS galaxy IC 3476 along with its multi-wavelength data. The fact that UGC 10420 seems to have more gas present on the trailing edge (Fig. 7), and an asymmetric distribution of star-forming regions, supports the results from the simulations.
These results from simulations were recently tested observationally by Roberts et al. (Reference Roberts2022b), who found them to agree with the resolved analysis of the integral field spectroscopic data of 29 jellyfish galaxies. A case study of IC 3949 presented by these authors is further evidence in favour of a scenario where the increased ISM pressure on the leading edge compresses the atomic Hydrogen and turns it into molecular gas, thereby triggering a localised burst of star formation. Troncoso-Iribarren et al. (Reference Troncoso-Iribarren, Padilla, Santander, Lagos, García-Lambas, Rodríguez and Contreras2020) also showed that this effect is most pronounced in galaxies in the stellar mass range of
 $10^{9.5}-10^{10.5}\,M_{\odot}$
, which conveniently includes UGC 10420 (Table 4).
$10^{9.5}-10^{10.5}\,M_{\odot}$
, which conveniently includes UGC 10420 (Table 4).
An examination of the individual XUV star-forming regions (defined in Sec. 3.2) shows that they are statistically brighter than their counterparts at lower galactocentric distances and have relatively bluer FUV-NUV colours and lower SFR. These observations are in agreement with the results of Werk et al. (Reference Werk2010), who analysed the HI and FUV data for some nearby star-forming galaxies. Werk et al. (Reference Werk2010) found that 8%–11% of emission-line point sources, near star-forming galaxies in their sample, are HII regions associated with the extended UV disc of the galaxies.
Any environmental mechanism which influences the gas content of a galaxy, thereby affecting its SFR, can potentially impact the AGN activity as well. In order to test this hypothesis, Peluso et al. (Reference Peluso2022) have recently exploited the integral field data for 115 RPS galaxies from MANGA and MUSE. Peluso et al. (Reference Peluso2022) find that AGN fraction among RPS galaxies is higher than their non-RPS counterparts. Furthermore, the incidence of optical AGN (classifiable using the BPT diagnostics) is 51% among massive (
 $M^* \geq 10^{10} M_{\odot}$
) RPS galaxies. It therefore comes as no surprise that UGC 10420 is optically classified as a LINER (Toba et al., Reference Toba2014). On the contrary, evidence has been presented in the literature to show that presence of a low-ionisation emission region may not always correspond to nuclear activity (e.g. Belfiore et al., Reference Belfiore2016). Interested readers are directed to Boselli et al. (Reference Boselli, Fossati and Sun2022, and references therin), for a detailed discussion on the subject, while deeper and high resolution data would be required to confirm presence of AGN in UGC 10420.
$M^* \geq 10^{10} M_{\odot}$
) RPS galaxies. It therefore comes as no surprise that UGC 10420 is optically classified as a LINER (Toba et al., Reference Toba2014). On the contrary, evidence has been presented in the literature to show that presence of a low-ionisation emission region may not always correspond to nuclear activity (e.g. Belfiore et al., Reference Belfiore2016). Interested readers are directed to Boselli et al. (Reference Boselli, Fossati and Sun2022, and references therin), for a detailed discussion on the subject, while deeper and high resolution data would be required to confirm presence of AGN in UGC 10420.
Analysis of archival X-ray data shows that UGC 10420 lies just at the edge of the X-ray emitting region of Abell 2199. Two bright X-ray sources, a few tens of kpc away from the centre of the galaxy without any optical counterpart are clearly visible, along with very faint emission from the central region of the galaxy. Such bright sources (hot spots, hereafter), are reminiscent of those generally observed around bright active galactic nuclei like Pictor A. Although such hot spots are often connected with a jet seen as faint diffuse emission (Hardcastle et al., Reference Hardcastle2016), such is not the case with UGC 10420. The eastern hot spot appears to be embedded in diffuse radio emission at that location as has been seen in Pictor A (Thimmappa et al., Reference Thimmappa, Stawarz, Balasubramaniam and Marchenko2021). It should be noted that the nucleus in Pictor A is about 20 times brighter than the hot spots (Hardcastle et al., Reference Hardcastle2016), while almost the reverse is true here.
The X-ray spectrum of the two hot spots in UGC 10420 are well fitted by a power-law with photon index of
 $1.8^{+0.3}_{-0.2}$
and
$1.8^{+0.3}_{-0.2}$
and
 $1.6\pm{0.2}$
for the eastern and western source, respectively. The luminosities of these hot spots are similar to the hot spots in Pictor A, while the nucleus is an order of magnitude weaker. If confirmed with deeper Chandra observations with higher resolution, this would be the first case of hot spots associated with such a weak nucleus. This also indicates that we do not find any evidence of enhancement in the nuclear activity in the galaxy due to the RPS process, which has a luminosity typical of low-activity nucleus in LINERS.
$1.6\pm{0.2}$
for the eastern and western source, respectively. The luminosities of these hot spots are similar to the hot spots in Pictor A, while the nucleus is an order of magnitude weaker. If confirmed with deeper Chandra observations with higher resolution, this would be the first case of hot spots associated with such a weak nucleus. This also indicates that we do not find any evidence of enhancement in the nuclear activity in the galaxy due to the RPS process, which has a luminosity typical of low-activity nucleus in LINERS.
A careful analysis of diffuse X-ray emission indicates that the hot galactic plasma in UGC 10420 has a temperature of
 $0.24^{+0.09}_{-0.06}$
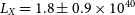
keV, consistent with that observed in spiral galaxies (e.g. Li et al., Reference Li, Li, Wang, Irwin and Rossa2008; Mineo et al., Reference Mineo, Gilfanov and Sunyaev2012). Also, the X-ray luminosity of the diffuse gas component in UGC 10420 is
$0.24^{+0.09}_{-0.06}$
keV, consistent with that observed in spiral galaxies (e.g. Li et al., Reference Li, Li, Wang, Irwin and Rossa2008; Mineo et al., Reference Mineo, Gilfanov and Sunyaev2012). Also, the X-ray luminosity of the diffuse gas component in UGC 10420 is
 $1.8\pm{0.9}\times 10^{40}$
erg s
$1.8\pm{0.9}\times 10^{40}$
erg s
 $^{-1}$
(0.4–2.0 keV), which is typical of spiral galaxies (Tyler et al., Reference Tyler, Quillen, LaPage and Rieke2004; Owen & Warwick, Reference Owen and Warwick2009; Mineo et al., Reference Mineo, Gilfanov and Sunyaev2012). This also indicates that the RPS has no effect on the hot gas in the galaxy.
$^{-1}$
(0.4–2.0 keV), which is typical of spiral galaxies (Tyler et al., Reference Tyler, Quillen, LaPage and Rieke2004; Owen & Warwick, Reference Owen and Warwick2009; Mineo et al., Reference Mineo, Gilfanov and Sunyaev2012). This also indicates that the RPS has no effect on the hot gas in the galaxy.
In a nutshell, multi-wavelength analysis of UGC 10420 confirms that it is a RPS galaxy which is undergoing a short-lived phase of intense star formation, as it interacts with the ICM in the cluster Abell 2199. While the star-forming knots on the western side of the disc are formed as a consequence of the compression of ISM of the galaxy due to RPS, the star formation on the eastern side is part of the wake which comprises loosely bound or ejected gas from the galaxy. References from the literature suggest that deep narrow-band and radio continuum imaging of UGC 10420 should produce further evidence to support the ideas presented in this paper. Although it is worth mentioning that UGC 10420 is unique not only because of the asymmetric distribution of star-forming regions, but also due to its status as an XUV disc galaxy hosted by a cluster.
5. Epilogue
Although the multi-wavelength analysis of the data for UGC 10420 has thrown some light on the evolution of this and such similar objects, it is worth mentioning the paucity of narrow-band data. We believe narrow-band imaging (H
 $\alpha$
), sensitive to the presence of massive O stars would be a key to probing the XUV star-formation in this galaxy. Also, continuum and HI emission and molecular gas observations can throw light on the distribution of gas in and around the galaxy and may prove very helpful in understanding the role of RPS in the evolution of UGC 10420, just like other RPS galaxies observed in clusters (e.g. Smith et al., Reference Smith2010; Werk et al., Reference Werk2010; Cortese et al., Reference Cortese2007; Yagi et al., Reference Yagi2010; Roman-Oliveira et al., Reference Roman-Oliveira, Chies-Santos, Rodríguez del Pino, Aragón-Salamanca, Gray and Bamford2019; Boselli et al., Reference Boselli2021).
$\alpha$
), sensitive to the presence of massive O stars would be a key to probing the XUV star-formation in this galaxy. Also, continuum and HI emission and molecular gas observations can throw light on the distribution of gas in and around the galaxy and may prove very helpful in understanding the role of RPS in the evolution of UGC 10420, just like other RPS galaxies observed in clusters (e.g. Smith et al., Reference Smith2010; Werk et al., Reference Werk2010; Cortese et al., Reference Cortese2007; Yagi et al., Reference Yagi2010; Roman-Oliveira et al., Reference Roman-Oliveira, Chies-Santos, Rodríguez del Pino, Aragón-Salamanca, Gray and Bamford2019; Boselli et al., Reference Boselli2021).
Acknowledgements
S. Mahajan was funded by the SERB Research Scientist (SRS) award (SB-SRS/2020-21/56/PS), Department of Science and Technology (DST), Government of India. Kulinder Pal Singh thanks the Indian National Science Academy for support under the INSA Senior Scientist Programme. Authors are grateful to Dr. Dharam Vir Lal for his help with the LOFAR data. We are grateful to the anonymous reviewer and the associate editor for their constructive criticism which helped in improving the readability of this manuscript.
This publication uses data from the AstroSat mission of the Indian Space Research Organisation (ISRO), archived at the Indian Space Science Data Centre (ISSDC). UVIT project is a result of collaboration between IIA (Bengaluru), IUCAA (Pune), TIFR (Mumbai), several centres of ISRO, and the Canadian Space Agency (CSA). This research has made use of the NASA/IPAC Infrared Science Archive, which is funded by the National Aeronautics and Space Administration and operated by the California Institute of Technology. The topcat software (Taylor, Reference Taylor and Shopbell2005) was used for some of the analysis presented in this paper. This publication makes use of data products from the Wide-field Infrared Survey Explorer, which is a joint project of the University of California, Los Angeles, and the Jet Propulsion Laboratory/California Institute of Technology, funded by the National Aeronautics and Space Administration. This dataset or service is made available by the Infrared Science Archive (IRSA) at IPAC, which is operated by the California Institute of Technology under contract with the National Aeronautics and Space Administration. We acknowledge the use of LOFAR data in accordance with the credits given on https://lofar-surveys.org/credits.html, and SDSS data given on https://www.sdss.org/collaboration/citing-sdss/. The X-ray data were downloaded from the High Energy Astrophysics Science Archive Research Center (HEASARC), maintained by NASA’s Goddard Space Flight Center. This research has made use of SAOImageDS9, developed by Smithsonian Astrophysical Observatory, and the HEASoft FTOOLS (http://heasarc.gsfc.nasa.gov/ftools).
Data Availability
Not applicable.