

Introduction
In 2011, the European Commission adopted a new strategy to halt the loss of biodiversity by 2020 and restore previous losses as far as this is feasible. The situation amongst the farmland birds relates especially to the third of six targets in the strategy that focuses on improving the integration of biodiversity conservation into key policies for agriculture and forestry (European Commission 2011).
Denmark has one of Europe’s most intensively farmed landscapes, with approximately 66% of the total area cultivated (Danmarks Statistik 2009) mostly under winter wheat, grass ley, fodder and spring barley (Brink and Jensen Reference Brink, Jensen, Oppermann, Beaufoy and Jones2012). The total area of arable agriculture has been more or less stable at c.27,000 km2 during 1920–1980, since when there has been a slight decline (Levin and Normander Reference Levin and Normander2008). Danish farmland consists of two major predominant landscape types, arable areas (where tillage predominates) and mixed farming (with more permanent and managed grassland). These two types of farming have become increasingly regionally discrete, with pastoral agriculture primarily practiced in the west of Denmark and a more homogeneous arable landscape predominating in the east of the country, a process that has continued since the 1980s (Reenberg Reference Reenberg1988). The intensity of agricultural activity has been increasing in both the arable and pastoral sectors and in particular, arable practices have changed over time, especially in choice of crops, which has had an adverse effect on associated bird populations in Denmark (Fox Reference Fox2004) as elsewhere in Europe (Donald et al. Reference Donald, Green and Heath2001) and across continents (Reif Reference Reif2013).
The reformed EU Common Agricultural Policy (CAP) for 2014–2020 aims at reducing biodiversity loss but has been criticised for having ‘such diluted environmental prescriptions that they are unlikely to benefit biodiversity’ (Pe’er et al. Reference Pe’er, Dicks, Visconti, Arlettaz, Báldi, Benton, Collins, Dieterich, Gregory, Hartig, Henle, Hobson, Kleijn, Neumann, Robijns, Schmidt, Shwartz, Sutherland, Turbé, Wulf and Scott2014). Because such a high proportion of Denmark is subject to intensive cultivation, farmland makes a disproportionate contribution to the maintenance of Danish biological diversity. This is particularly the case amongst bird species, which are a conspicuous and well monitored element of Danish biodiversity and which contribute greatly to that of farmland landscapes. Because of their mobility and situation in the upper trophic levels of such ecosystems, birds are considered to be good habitat indicators, showing sensitivity and rapid responses to anthropogenic change in the environment. Furthermore, monitoring data exist in the form of long term time-series on their abundance and distribution across large parts of Europe (Gregory and van Strien Reference Gregory and van Strien2010). Here, we use data from the Common Bird Monitoring programme to study whether there has been a reduction in the decline of specialised farmland birds in Denmark, and use this information to provide a basis for raising key questions in the Discussion section about how we can achieve the 2020 goal.
Populations of common birds have been monitored in all Danish habitats and regions since the mid-1970s, providing information on changes in population size and their trends for common breeding bird species in Denmark over nearly 40 years. This programme is a powerful tool for monitoring changes in abundance within the bird community in any given period, as well providing insight to enable judgements as to whether the 2020-target is likely to be achieved. An earlier analysis showed that after major changes in the 1980s, the breeding birds of Danish farmland had shown less radical variation in abundance up until the early 2000s than in UK (Fox Reference Fox2004). However, that study considered a wide spectrum of generalist avian species occurring in agricultural landscapes in Denmark, of which only limited proportions of their populations depend purely upon farmland as breeding habitat.
Here, we divide our study into two major parts. Firstly, we take the broad perspective and compare the rates of change of specialist farmland birds with those which specialised in using other habitats. Secondly we define a group of breeding bird species that show a high degree of specialism for farmland habitats (i.e. those species largely confined to farmland for breeding habitat; see Methods below for specific definitions) for more detailed studies and use these species to compare changes in their abundance during 2001–2014 with those during 1987–2001.
There have been substantial changes in the Danish agricultural landscape in the study period (see Discussion) and we seek to find support for the hypotheses that changes in abundance of different farmland specialist bird species are related to their responses to differences in (i) farming type (species exploiting grasslands versus arable land), (ii) nest-site (those species which nest on the ground, usually within fields, versus those that build their nests elsewhere) to separate those species that nest in the fields and are thus fully dependent on the field environment from those species that are only partly dependent on field habitats and (iii) migratory strategy (long-distance, short-distance versus resident species). We use a model selection framework to explain the trends for each species incorporating these features as explanatory variables, contrasting those in the periods 1987–2001 and 2001–2014.
Materials and methods
Data collection and time series
The Danish Common Bird Monitoring (CBM) programme estimates indices and trends for common birds. It is based upon a point count census of breeding birds undertaken since 1976. This programme has involved sampling bird species abundance at more than 70 routes (>300 routes since 1987; mean ± 95% CI, 1987–2014 = 341 ± 11, median 346.5) throughout the country. Most routes consist of 20 (but always > 10) ‘points’ which are identical in subsequent years at which all birds seen and heard regardless of distance from observer were registered and recorded in a 5-min observation period (Heldbjerg Reference Heldbjerg2005). Observers simultaneously counting birds also ascribe the habitat in quarters surrounding each count point to one or more of nine predefined basic habitat types: 1) Coniferous woodland, 2) Deciduous woodland, 3) Arable, 4) Grassland, 5) Heath, 6) Dunes/Shore, 7) Bog/Marsh, 8) Lake and 9) Urban. The best covered habitat types were combined into four broader habitat types: Urban (habitat type 9; Annual mean of 10% of totally monitored habitats; Eskildsen et al. Reference Eskildsen, Larsen and Heldbjerg2013), Farmland (3,4; 39%), Freshwater (7,8; 10%), Forest (1,2; 38%) whereas the habitats with least coverage are omitted (5,6; 3%). Although only c.13.2% of the count points came from purely arable landscapes and c.1.5% from permanent meadows/grassland plots, the majority of the surveyed count points were from ‘mixed’ habitats, which included extensive areas of farmland. In total an annual mean of 27.8% and 11.1% of all habitat descriptions were from arable habitat and grasslands respectively. Each route was monitored by the same observer each year, at the same time of year (± 7 days), same time of day (± 30 min) and under comparable weather conditions. Although the CBM started in 1976 (Heldbjerg et al. Reference Heldbjerg, Brandtberg and Jørgensen2014), because of rapid increases in the number of participants in the early years we restricted the time series to 1987–2014 to ensure robust and comparable data with more even coverage in all years for the more detailed analysis.
Selection of common bird species
Initially, we included all species from the Danish CBM (Heldbjerg et al. Reference Heldbjerg, Brandtberg and Jørgensen2014). Mallard Anas platyrhynchos and Pheasant Phasianus colchicus were omitted from the analysis because their Danish populations are heavily influenced by rearing and releases (Noer et al. Reference Noer, Asferg, Clausen, Olesen, Bregnballe, Laursen, Kahlert, Teilmann, Christensen and Haugaard2009). For the remaining 102 species, we compared the trends for the specialist farmland species with all specialist species from other major habitats in order to compare the trends of farmland specialists to trends of specialists in other habitats.
Defining species relative habitat use
Not all avian species are habitat specialists, in the sense that they are almost exclusively found in only one of the above nine habitat types, so it is important to establish the degree to which species are confined to specific habitats or to what extent they are habitat generalists. Each species’ habitat association in the breeding season was defined in terms of their Relative Habitat Use (RHU), calculated as the abundance of a given species in a particular habitat relative to the mean abundance of that species in all other habitats. The number of observed individuals at each point was weighted with the proportion of the given habitat at the point. The sum of the weighted number of individuals of each species in a particular habitat could then be used to calculate a RHU value from the following equation:
 $$Relative\,Habitat\,Use = {{{n_i}/{p_i}} \over {(N - {n_i})/(P - {p_i})}}$$
where n i is the number of individuals in the i th habitat, p i is the total number of i-habitat points, adjusted according to proportional habitat share at each point, N is the total number of individuals and P is the total number of points. For full details and examples, see Larsen et al. Reference Larsen, Heldbjerg and Eskildsen2011 (Figure 1) and Eskildsen et al. (Reference Eskildsen, Larsen and Heldbjerg2013).
Histograms showing the mean percentage change per year in index values generated by log-linear modelling of Danish breeding bird point count data (± 95% CI) showing long term (1987–2014) trends for 102 common Danish breeding bird species divided into their Relative Habitat Use specialist groups (RHU > 2; HiU).

A RHU > 2 indicates an abundance in the specified habitat at least twice the mean abundance in all other habitats, representing a High use habitat specialist (HiU). Where 2 > RHU > 1, this indicates an abundance in the given habitat above the mean elsewhere (but less than double) defined here as Intermediate use habitat specialist (IU). Where RHU < 1, the species is considered a generalist, which uses the given habitat less than other habitats, and these are omitted from this study.
Defining farmland
The habitat here defined as Farmland (F) is a combination of the two habitat categories in the CBM programme, Arable (A) and Grassland (G) habitats. A consists of arable areas such as fields and fallow land, as well as associated lesser elements within the arable landscape like hedgerows, farms and orchards. G consists of meadows, salt marshes, pastures, dry grassland and other grass-dominated areas with or without scattered trees and/or shrubs.
Defining farmland birds
We defined Farmland birds (FB) as all species which had a RHU value for F (consisting of A and G ) that was larger than 1. However, the G constitutes a relatively small area but is broad in its definition (e.g. including salt marshes). G therefore included breeding species that were not typically confined to farmland habitats, which we subsequently removed (e.g. Greater Black-backed Gull Larus marinus). We also removed those species with a Danish breeding population of less than 1,000 pairs (e.g. Curlew Numenius arquata) and species for which less than 50 individuals were registered per year (e.g. Sparrowhawk Accipiter nisus, Common Wheatear Oenanthe oenanthe and Grasshopper Warbler Locustella naevia). The final list of FB therefore included 41 species (Appendix S1 in the online Supplementary Material).
Levels of analysis
In this study, we undertook two levels of analysis. First, we compared the trends for High Use Farmland Birds (HiUFB) with HiU species of other habitats and then we focused only on farmland birds. For the latter group we first compared HiUFB with Intermediate Use Farmland Birds (2 > RHU > 1; IUFB) and then we combined these two categories to generate a broader category of avian species associated with farmland (RHU > 1; FB).
Defining and comparing specialists in different habitat categories
We followed the indicator species selection from Eskildsen et al. (Reference Eskildsen, Larsen and Heldbjerg2013) where the HiU indicators for the broad habitats Urban, Farmland, Freshwater and Forest was found to cover 75% of all species included in the CBM and categorized the rest as Non-habitat specific.
We analysed changes in abundance with regard to these major habitats and compared trends (mean percentage change per year), using the additive slope provided by TRIM for 1987–2014 between groups by presenting an assessment of the variance within each group to show differences. In order to describe recent trends in farmland birds we also introduced a change point in 2001 (the last year included in Fox Reference Fox2004) also used as base year (index 100) and compared the changes before and after this year.
Population indices and trends
Population indices and trends for all 102 species were calculated by fitting a log linear regression model to point count data with Poisson error terms using the software TRends and Indices for Monitoring data (TRIM; Pannekoek and van Strien Reference Pannekoek and van Strien2004), where the count at a given site in a given year is assumed to be the result of a site and a year effect. The programme also estimates the dispersion factor, correcting for over-dispersion where this occurs, and takes account of serial correlation between counts at the same site in different years. Standard errors for the indices are generated based on the assumption that the variance is proportional to the mean, and a pattern of serial correlation, which declines exponentially with time between counts (Pannekoek and van Strien Reference Pannekoek and van Strien2004). The assessment of the annual rate of change was used in this study to generate species trends, taking the standard errors into account. The population changes were described by indices and we are only interested in the relative changes (not the absolute number) for each species during the study period. Subsequently, individual species indices were combined into a single indicator value in each year for all species belonging to the same farmland birds specialisation category. The multi-species indicators were calculated as the geometric mean of the individual species indices for each year. The index mean is considered a measure of biodiversity change, a stable indicator trend reflects a balance between positive and negative indices whereas a reduction in index mean will occur if more species are declining than increasing and vice versa (Buckland et al. Reference Buckland, Magurran, Green and Fewster2005; Gregory et al. Reference Gregory, van Strien, Vorisek, Meyling, Noble, Foppen and Gibbons2005). Two indicators were produced for those bird species which specialised in each habitat: one for HiUFB and one for IUFB. Low-use species with an RHU < 1 were omitted from the analyses on the assumption that such species were habitat generalists.
Since there was a high degree of consistency between the population trends calculated using habitat-specific point counts and using all point counts irrespective of habitat (Eskildsen et al. Reference Eskildsen, Larsen and Heldbjerg2013; based on percentage population changes on the same data across 24 years (1986–2009) from 12 habitat categories, r 2 = 0.82), in this study we used data from all point counts relating to a given species, not only those from points in their primary habitat.
Model for the trends for all 41 farmland birds
Among the 41 FB we included a number of parameters in a model analysed separately for the earlier (1987–2001) and most recent (2001–2014) 14-year periods by using generalised linear models (GLIMMIX procedure in SAS 9.4) on the basis of maximum likelihood optimisation (‘method=mspl’ statement).
1. Influence of farmland type
We compared the trends for species in grassland habitat to species in arable habitat. For this purpose we used the RHU in each of the habitat types Grassland (RHUG) and Arable (RHUA) as well as the combined Farmland habitat (RHUF).
2. Influence of nesting site
We compared ground-nesting species to species nesting outside of the fields (defined using Ferguson-Lees et al. Reference Ferguson-Lees, Castell and Leech2011) to test whether those species habitually exploiting fields for nest sites were more likely to be declining than those more associated with field margins and other elements of the agricultural landscape.
3. Influence of migratory patterns
Declining farmland bird species that winter elsewhere could potentially be subject to factors acting at other points in the annual life cycle other than on Danish farmland. Given the general decline among Trans-Saharan migrants in Denmark (Heldbjerg and Fox Reference Heldbjerg and Fox2008) and Europe in general (Vickery et al. Reference Vickery, Ewing, Smith, Pain, Bairlein, Skorpilov and Gregory2014), we also grouped species by their migratory strategy, i.e. long distance migrants (Trans-Saharan migrants), short distance migrants (Europe and North Africa) and resident species based on ringing-recovery data on Danish breeding birds (Bønløkke et al. Reference Bønløkke, Madsen, Thorup, Pedersen, Bjerrum and Rahbek2006).
Statistical analysis
The most parsimonious models to describe the trend patterns were identified by comparing AICc weight of 16 candidate models representing all main effect combinations of nesting behaviour (ground nester or not ground nester), migration strategy (resident, short distance migrator, long distance migrator) and specialisation to F, A or G (using log-transformed RHU-variables in order to achieve normal distributed data).
To investigate whether population trends differed between the two periods, we compared AICc weights of models explaining the 14-year population trends in the combined dataset (41 species × 2 periods = 82 trend values). For this analysis, we evaluated models with and without time period, nesting behaviour and specialization to arable land as main effects and interaction terms between time period and nesting behaviour, migration strategy and specialisation to arable land, respectively. Nesting behaviour and specialization to arable land were selected as the top-ranked variables in the initial analysis.
In addition to the candidate models with different predictor combinations of central tendency described above, we also evaluated models with heteroscedasticity (unequal variance) between groups (nesting behaviour, migration strategy and time period).
Results
Farmland specialists compared to specialists in other habitats
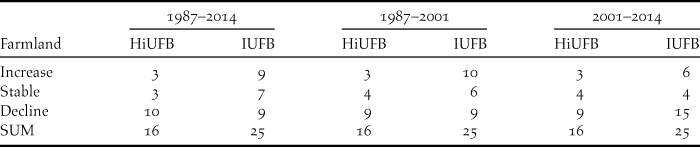
Of all the major Danish habitat types, the strongest declines in habitat specialists (RHU > 2, Eskildsen et al. Reference Eskildsen, Larsen and Heldbjerg2013) among the 102 common breeding birds in the period 1987–2014 were found in the farmland habitat (Figure 1). The majority of farmland bird populations showed decreasing or stable trends (Table 1) and overall tended to show more negative trends compared to species exploiting other habitats. This fact is the background for more detailed studies on all 41 Farmland birds (FB).
Numbers of common Danish bird species showing differing long and short term trends, broken down by High use (HiUFB) and Intermediate use (IUFB) of farmland habitats (see text for details).
Differences in trends related to the specialization of the farmland birds
Long term (1987–2014) declines amongst the 41 FB species mainly occurred among HiUFB, of which 63% declined and 19% increased. On average, there was an annual -1.55% long term decline (95% CI: -1.76% to -1.33%) in HiUFB species over the period 1987–2014 (n = 28, r 2 = 0.893, P < 0.0001, Fig. 2). In comparison, species categorised as IUFB decreased on average with -0.33% (95% CI: 0.49% to -0.16%, n = 28, r 2 = 0.379, P = 0.0005; Figure 2) per annum over the same period.
Geometric mean annual indices of 41 farmland species divided into High use farmland species (HiUFB; r 2 = 0.89, P < 0.0001, n = 16) and Intermediate use farmland species (IUFB; r 2 = 0.38, P < 0.001, n = 25) in 1987–2014. Trend indices are generated from log linear regressions models using the results of Danish Common Bird Monitoring data (Index 100 = 2001).

During 1987 to 2001 the multispecies indicator of all the 41 FB declined at -0.39% (95% CI: -1.42 to 0.064), a trend that was not statistically significant (P = 0.45). From 2001 to 2014, the average population index of the same 41 FB species declined at -1.22% per annum (95% CI: -1.93 to -0.52%, P = 0.0007). The multispecies indicator for the HiUFB declined significantly in both periods: -1.26% per annum in 1987-2001 (95% CI: -1.94% to -0.58%; P = 0.0017) to -1.48% per annum in 2001-2014 (95% CI: -2.11% to -0.84%; P = 0.0003) while the multispecies index for the IUFB was only significantly declining in 2001–2014: (0.15% per annum in 1987–2001 (95% CI: -0.35% to 0.65%; P = 0.538) to -0.71% per annum in 2001–2014 (95% CI: -1.10% to -0.31%; P = 0.0022).
In 1987–2001, a larger proportion of the IUFB were increasing compared to the HiUFB but the ratio of increasing to declining species in these two groups was the same in 2001-2014, indicating that the IUFB are also now declining (Table 1 and Appendix S1).
Effects of nest sites 1987–2001
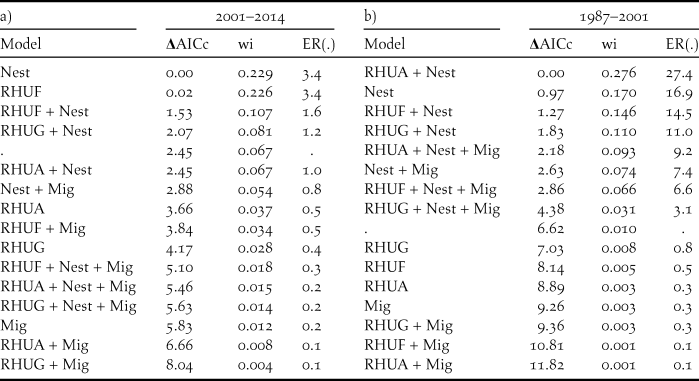
Regarding the 41 FB, all models that differentiated between ground-nesters and non-ground nesters had substantially higher AICc-weights than the basic model without any covariates indicating that this is a key factor. None of the models lacking nesting behaviour performed better than the basic model (Table 2). According to the top-ranked model, the mean population trend did not differ from 0 for species not nesting on the ground, whereas ground-nesters declined statistical significantly at greater than 3% per year (Table 2 and Figure 3).
Parsimony statistics of candidate models to explain variation in population trends of 41 common breeding bird species in Denmark 2001-14 (a) and 1987-2001 (b). wi = Akaike’s weight, ER(.) = evidence ratio in Akaike’s weights relative to the basic model only estimating the intercept. Abbreviations for predictor variables: Nest = Ground nester or non-ground nester, Mig = Migration strategy (resident, short-distance migrant, long-distance migrant), RHUA = specialization to arable habitats, RHUG = specialization to grassland habitats, RHUF = specialization to farmland habitats.
Mean annual changes (± 95% CI) in population abundance index of common Danish farmland bird species divided on period and nesting behaviour (n = 8 ground nesting species, 33 non-ground nesting species).

Effects of nest sites 2001-2014
The model discriminating between ground-nesters and non-ground nesters (Nest) and the model that included specialisation to farmland (RHUF) had modestly more support than the basic model without covariates (Table 2), suggesting that ground-nesting FB showed more negative population trends during this period (Figure 3).
Comparison between Arable and Grassland specialists
Three times as many farmland bird species were significantly declining during 2001–2014 as were significantly increasing amongst the HiUFB and IUFB (Table 1; see Appendix S1 in supporting information). The RHU for each farmland species is included for Arable habitat, Grassland habitat and for the combined Farmland habitat to categorize each species as an Arable species or a Grassland specialist.
Of the seven Arable HiU species, five, Kestrel Falco tinnunculus, Grey Partridge Perdix perdix, Lapwing Vanellus vanellus, Skylark Alauda arvensis and Yellow Wagtail Motacilla flava, have all been declining in this period. Ten out of 17 Grassland HiU species have significantly declined over this period. Greylag Goose Anser anser, Marsh Harrier Circus aeruginosus and Herring Gull Larus argentatus are the only exceptions that were significantly increasing.
Comparison of 1987–2001 vs. 2001–2014 and the two periods combined
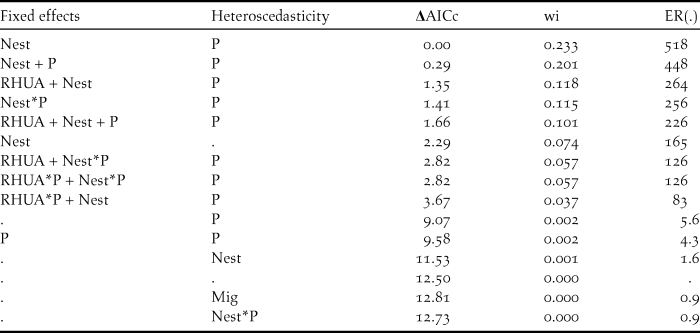
The top-ranked model for the combined dataset (trends 1987–2001 and 2001–2014) predicted more negative population trends for ground nesters than non-ground nesters with higher residual variance in the first than in the second period (Table 3). Models including effects of habitat specialisation (RHUF) or migratory behaviour all performed worse than model alternatives without these terms (Table 3). Models with main effects of period or interaction effects of period with nesting behaviour performed marginally worse than model alternatives without these effects (Table 3), suggesting little support for substantial differences in population trend patterns in the two periods. Predictions from models with interactive effects of period and nesting behaviour, suggested that ground nesters declined at an average rate of about 3% per year in both periods, whereas non-ground nesters appeared to be stable in the first period, but declined with an average rate of 1% per year in the second period. The top-ranked model included nesting behaviour without any effect of period. This model generated an average annual decline of c.3% for ground nesters, but found no significant decline for non-ground nesters throughout the entire period, 1987–2014 (Figure 3). Only three out of 16 HiUFB showed significant increases during 1987–2014, namely Marsh Harrier increasing at 3.3% per year, Common Gull Larus canus at 2.2 % per year and Common Whitethroat Sylvia communis at 0.5% per year. The two former are both breeding in other habitat types and only partly foraging in the farmland habitat, which shows the potential importance of farmland as foraging habitat for birds nesting in other habitats. In contrast, 10 species declined significantly, of which Whinchat Saxicola rubetra showed an average decline of > 5% per year, corresponding to a halving of the population within 14 years. Another seven species were declining at > 2% per year, halving their population size within 35 years: Grey Partridge, Oystercatcher Haematopus ostralegus, Lapwing, Skylark, Meadow Pipit Anthus pratensis, Yellow Wagtail, and Starling Sturnus vulgaris.
Parsimony statistics of candidate models to explain variation in population trends of common breeding bird species in Denmark 1987-2001 and 2001-14 (n = 82 time series from 41 species, (see Appendix S1). wi = Akaike’s weight, ER(.) = evidence ratio in Akaike’s weights to ‘base’ model only estimating the intercept. Abbreviations for predictor variables: Nest = Ground nester or non-ground nester, P = period (1987-2001 vs 2001-2014), Mig = Migration strategy (resident, short-distance migrant, long-distance migrant), RHUA = specialization to arable habitats.
Discussion
This analysis established that Danish specialist farmland birds have shown greater long term declines in abundance than specialists in other habitats. The analysis also showed that amongst these farmland birds, ground nesting species showed greater declines in the period 1987–2001 and whereas in 2001–14 this trend continued, in the latter period there are also significant declines amongst species not nesting on the ground as well.
Long-term declines in farmland bird populations
After apparent stability in 1987–2001, the farmland specialist species in Denmark are now showing long term declines in contrast to species in other habitats. Although less dramatic than in the late 1970s and early 1980s (Eskildsen et al. Reference Eskildsen, Larsen and Heldbjerg2013), this is important within Denmark because such a large area of the land surface is under cultivation.
Fox (Reference Fox2004) analysed Danish farmland bird populations in 1983–2001 in relation to changes in 26 agricultural variables, comparing these with the situation in UK and found marked differences between national patterns of agriculture and more favourable population trends in Denmark compared to the UK. The present study included additional data from 13 more years (2002–2014), calculated trends using TRIM software (rather than the chain-index method) and selected species based on their habitat preferences in the Danish landscape. Eskildsen et al. (Reference Eskildsen, Larsen and Heldbjerg2013) found that while generalist species using farmland showed stable trends, the specialist species have shown consistent declines since the 1990s (see their Figure 3).
The situation in Denmark is now very similar to that found throughout Europe in general. The Farmland Bird Indicator (FBI) combines the aggregate population trends of 39 species classified as farmland birds on a European scale, of which 24 are decreasing and only six are increasing, with a further six showing stable and three uncertain trends. Overall, the indicator shows a decline of 54% during 1980–2012 (EBCC 2014).
Because the farming landscape represents two-thirds of the total land area in Denmark, agri-biodiversity makes an important contribution to overall biological diversity, so it is important to establish hypotheses relating to potential factors responsible for species declines in order to develop adaptive management options and mitigating actions to reduce and reverse species declines where possible.
Arable versus grassland species
The Farmland birds generally showed adverse population trends across both grassland and arable agriculture, however, model selection for the period 1987–2001 suggested that ground-nesting species associated with arable habitat were suffering more acute problems associated with this type of farming.
With the notable exception of Grey Partridge, all of the declining HiU species are associated with grazed grassland habitats at some stage in their breeding cycle, which suggest changes in such habitats may be implicated in their change of status. The consequences of the decline in grazing pressure is known to have an adverse effect on the Starling (Heldbjerg et al. Reference Heldbjerg, Fox, Levin and Nyegaard2016). Given the dramatic expansion in rotational grassland throughout Denmark and the removal of grazing animals from grassland outdoors into buildings for most or all of the year, there is an urgent need for more detailed investigation of how these major changes in agriculture affects the changes in population sizes of the species associated with different types of managed grassland (which include Snipe Gallinago gallinago, Oystercatcher, Lapwing, Skylark, Meadow Pipit and Yellow Wagtail).
The number of species significantly declining among the IUFB was less than the HiUFB in 1987–2001 but at the same level in 2001-2014, suggesting that the most specialised farmland species experienced the greatest difficulties in the first period but both groups have problems in the contemporary Danish agricultural landscape.
Effects of nest site
Ground-nesting species showed significant decreases, whilst those species not nesting on the ground only shows declines since 2001, even though both sets of species tend to forage within the same habitat. This could suggest some causal link with tillage and conditions within the field where we assume that most nests are placed, but these are factors that need to be further investigated with regards to the species concerned. It has been shown in several studies that the effects of agricultural intensification affects farmland specialists (Donald et al. Reference Donald, Green and Heath2001) and habitat generalists if they feed in farmland and especially if they are specialist seed eaters, e.g. Linnet Carduelis cannabina (Hewson and Noble Reference Hewson and Noble2009, Reif et al. Reference Reif, Bohning-Gaese, Flade, Schwarz and Schwager2011). The only arable HiUFB species that was not declining in the long term period and/or the most recent short term period was the Barn Swallow Hirundo rustica, which does not nest in fields. The remainder of the ground-nesting species with less affiliation to arable habitat were declining and all eight ground-nesting species of the 41 FB also showed significant declines in the long term and/or the most recent period which underlines the need for further research to uncover the reasons for these patterns. Van Turnhout et al. (Reference Van Turnhout, Foppen, Leuven, van Strien and Sipel2010) also found ground-nesting species to be declining in the Netherlands, although Reif et al. (Reference Reif, Vermouzek, Voříšek, Šťastný, Bejček and Flousek2010) found no general relationship between species’ nest sites and their population trends in the Czech Republic.
Effects of migratory behaviour
Although we investigated the alternative hypothesis that it could be factors outside the Danish farmland landscape that could be affecting the status of populations, and despite the fact that the three species with the largest decline are African migrants, there was little evidence that long or short distance migrants were suffering more adverse population trends than sedentary birds (confirmed by Vickery et al. Reference Vickery, Ewing, Smith, Pain, Bairlein, Skorpilov and Gregory2014). This suggests the declines are somehow mainly connected to factors operating within the Danish agricultural landscape. This seems to be the case for the Whinchat, based on levels of unoccupied suitable wintering habitat in Africa, see Hulme and Cresswell (Reference Hulme and Cresswell2012), but which is associated with low intensity grazing of marginal grasslands in Denmark, which are increasingly being abandoned or intensified.
Agricultural changes in Denmark
Farmland practices have changed drastically before and up to the start of our study period. The first and most important change that occurred in the Danish farming landscape between the early 1980s and the mid-1990s was the change from spring barley (which declined from 1.4 to 0.6 mill. hectares) to winter wheat (which increased from 0.18 to 0.7 mill. hectares) which undoubtedly affected many farmland specialist bird species at the time (see Figure 1 in Fox Reference Fox2004). However, since then, the most marked changes in the Danish farming landscape have been: (i) the 50% increase in the area of rotationally managed grassland and clover since 2004, especially after set-aside was removed from the Danish farmland landscape after 2008, (ii) the upsurge in rape cultivation and especially (iii) the 15-fold increase in the area of maize cultivated (Danmarks Statistik 2016; Appendix S2 in the Supplementary Materials). Between 1993 and 2008, 150,000–200,000 ha of land were taken out of production as set-aside. Although some authors suggest very little biodiversity benefit from such land abandonment without set management goals (e.g. Sotherton Reference Sotherton1998, Sotherton et al. Reference Sotherton, Boatman, Mañosa and Roberston1994), in Ireland, non-rotational set-aside attracted many birds species, in particular Skylark and Meadow Pipit, at densities much higher than adjacent agricultural fields (Bracken and Bolger Reference Bracken and Bolger2006). In the UK rotational set-aside was equally effective at attracting higher densities and species diversity of birds in summer compared to adjacent cultivated fields (Henderson et al. Reference Henderson, Cooper, Fuller and Vickery2000a, Reference Henderson, Vickery and Fuller2000b), including those species showing declines in Danish farmland, Grey Partridge, Skylark, Linnet and Yellowhammer Emberiza citrinella (e.g. Buckingham et al. Reference Buckingham, Evans, Morris, Orsman and Yaxley1999). Hence, it seems likely that loss of set-aside in 2008 from the Danish agricultural landscape could have contributed to the declines of some key species since that time. Finally, the most dramatic and ongoing change in the agricultural landscape since the millennium has been the increase in the areas of land cultivated for maize, which have increased from 50,000 ha in 2000 to c.180,000 ha in 2015 (Appendix S2). Maize generally grows too late and develops above ground biomass too densely to support breeding bird species of any kind in Europe (e.g. Engel et al. Reference Engel, Huth and Frank2012, Sauerbrei et al. Reference Sauerbrei, Ekschmitt, Wolters and Gottschalk2014). Hence, one urgent line of enquiry is to better understand the effects of maize cultivation on breeding birds across Denmark and the consequences for its continued spread in the future.
Although the combination of changes in cropping (cereals, maize and rape) could have contributed to the long-term declines in specialist farmland bird populations, it is not easy to assign specific declines in farmland birds to one single parameter, especially when changes in crop area are spread over many years of gradual change. Reif et al. (Reference Reif, Storch, Voříšek, Šťastný and Bejček2008) suggests that we should analyse patterns at a finer scale than the classical broad habitat classes such as “farmland”, “forest” etc. to understand the direct reasons behind general declines because habitat association is a continuous rather than categorical variable. There is no doubt we need to understand more about how individual species exploit very specific crops and biotopes and in what ways during the course of the annual avian and agricultural cycle, not least because with a single habitat the same change can adversely affect one species whilst benefitting another.
Achieving the 2020 goal
We now have good knowledge about the trends for each of the common birds in Denmark and we witness a general major decline in avian farmland specialists, which raises two questions. Firstly, do we know what is needed to identify the reasons behind the declines in a way that help to restore the different species to more favourable conservation status? Secondly, does Danish society care enough about these facts to be willing to try to improve the situation for the farmland birds? The key questions here relate to (i) What are the species-specific reasons for declines? (ii) What can we do in practical terms to reverse these trends? (iii) What are the costs of these actions to farmers, society and food security? (iv) Is this a price society is willing to pay? But before we can answer these questions, we will need studies focussed on the key declining species throughout the annual cycle in the Danish farmland landscape as undertaken elsewhere in order to understand their breeding biology and the reasons for the specific declines among farmland species.
Conclusions
This study shows that farmland specialists in Denmark are in decline and most problems are associated with those that nest on the ground which are showing the worst declines. There was also weak support for species associated with arable agriculture are suffering more than those on grazing areas, but species are suffering in both agricultural landscapes. This suggests that species specific studies are needed to understand the changes in abundance of single species in relation to changing patterns of agriculture and especially arable farming in time and space. Such knowledge will be essential if we hope to reverse changes in declining farmland bird populations before 2020 through evidence-based conservation interventions and targeted conservation management actions.
Supplementary Material
To view supplementary material for this article, please visit https://doi.org/10.1017/S0959270916000654
Acknowledgements
This study would not have been possible without the large numbers of birdwatchers that have contributed data to the common bird monitoring year after year: our very sincere thanks to each and every one of you. HH acknowledges the support of an industrial PhD stipend awarded by Innovationsfonden, which, together with Aage V Jensen Naturfond and 15. Juni Fonden also supported this work. We also gratefully acknowledge The Danish Nature Agency for funding the project: “Agerlandets almindelige og sjældne fugle”, of which this study is part and to Jiri Reif and two anonymous referees for helpful suggestions for how to improve an earlier version of the manuscript.



