


Impact Statement
The interaction between sand particles and turbulence occurs at the smallest turbulent scales, i.e. the Kolmogorov length scale. Conventionally this interaction could not be fully included in the simulation of sand particle transport in the atmospheric Ekman boundary layer due to the large grid size used. In order to quantify this small-scale interaction, it is imperative to provide a direct numerical simulation, which can fully resolve the smallest scale and also include the Coriolis force to simulate the realistic Ekman spiral in the atmosphere, as a benchwork for further comparison with large eddy simulation. Using the one-way coupling Eularian–Lagrangian method, we show that an Ekman spiral can be observed in the slip velocity profiles, from which the viscous sublayer, buffer layer and log-law region are also clearly distinguishable. Besides, large sand particles are significantly influenced by gravity and experience higher drag forces in the viscous sublayer.
1. Introduction
The atmospheric Ekman boundary layer (AEBL) is the layer of the Earth's atmosphere influenced by the Ekman spiral. This layer experiences changes in wind speed and direction with height due to the combined effects of friction and the Coriolis force (Reference Cushman-Roisin and BeckersCushman-Roisin & Beckers 2011). The AEBL extends from the Earth's surface up to a certain height, known as the geostrophic wind level, which varies depending on atmospheric and topographic conditions, typically ranging from a few hundred metres to a few kilometres. The AEBL plays a critical role in various atmospheric processes, including the exchange of mass, momentum and heat between the atmosphere and surfaces below (Reference Nottrott, Kleissl and KeelingNottrott, Kleissl & Keeling 2014; Reference BoucherBoucher 2015; Reference Theeuwes, Barlow, Teuling, Grimmond and KotthausTheeuwes et al. 2019; Reference Shao, Zhang, Ishizuka, Mikami, Leys and HuangShao et al. 2020; Reference Heisel, Chen, Kok and ChameckiHeisel et al. 2021). These processes directly impact weather patterns, air–sea interaction, dispersion of airborne pollutants and other related phenomena (Reference Black, D'Asaro, Drennan, French, Niiler, Sanford, Terrill, Walsh and ZhangBlack et al. 2007; Reference Han, Baik and LeeHan, Baik & Lee 2014; Reference Peng and RichterPeng & Richter 2017; Reference Seino, Aoyagi and TsugutiSeino, Aoyagi & Tsuguti 2018; Reference Adebiyi and KokAdebiyi & Kok 2020).
The flow dynamics of AEBL has been extensively studied by direct numerical simulation (DNS) (Reference Coleman, Ferziger and SpalartColeman, Ferziger & Spalart 1990; Reference Marlatt, Waggy and BiringenMarlatt et al. 2012; Reference Waggy, Marlatt and BiringenWaggy, Marlatt & Biringen 2011; Reference Deusebio, Brethouwer, Schlatter and LindborgDeusebio et al. 2014; Reference Shah and Bou-ZeidShah & Bou-Zeid 2014; Reference Lee, Gohari and SarkarLee, Gohari & Sarkar 2020) and large eddy simulation (LES) (Reference Mason and DerbyshireMason & Derbyshire 1990; Reference Taylor and SarkarTaylor & Sarkar 2007, Reference Taylor and Sarkar2008; Reference Kirkil, Mirocha, Bou-Zeid, Chow and KosovićKirkil et al. 2012; Reference Nishizawa, Yashiro, Sato, Miyamoto and TomitaNishizawa et al. 2015; Reference Kazemi and HeinzKazemi & Heinz 2016) over the past 30 years. In one of the early efforts, Reference Coleman, Ferziger and SpalartColeman et al. (1990) simulated a neutral turbulent Ekman boundary layer to find that the ‘f-plane’ approximation, where Coriolis force f is constant, was affected by latitude and horizontal rotation, challenging its applicability. Reference Coleman, Ferziger and SpalartColeman, Ferziger & Spalart (1992) also compared their DNS results of the stably stratified Ekman layer with the LES counterpart of Reference Mason and DerbyshireMason & Derbyshire (1990), implying that the DNS results from a low-Reynolds-number case can be used, to some extent, in high-Reynolds-number atmospheric flows, and that LES is suitable for simulating the stable Ekman layer.
More recently, Reference Shah and Bou-ZeidShah & Bou-Zeid (2014) conducted a series of DNS to explore the effect of the Richardson number on the characteristics of a statically stable turbulent Ekman boundary layer at three moderate Reynolds numbers, showing that buoyancy can reduce turbulence kinetic energy production through decreasing momentum fluxes  $\langle u^{\prime}w^{\prime}\rangle $ and $\langle v^{\prime}w^{\prime}\rangle $, with $u'$,
$u'$,  $v'$ and $w'$ being velocity fluctuation. This remarkable finding provided critical guidance to developing high-order turbulence closure models. Reference Kazemi and HeinzKazemi & Heinz (2016) investigated the influence of sub-grid-scale (SGS) models on LES results by DNS comparison, demonstrating that results from the Smagorinsky–Lilly (Reference LillyLilly 1967) and the stabilized dynamic Smagorinsky models (Reference Germano, Piomelli, Moin and CabotGermano et al. 1991; Reference LillyLilly 1992) have the greatest discrepancies, especially in the standard deviation profiles of the velocity and in the direction of the turbulence structure in the instantaneous fields. The realizable linear dynamic model (Reference HeinzHeinz 2008; Reference Heinz and GopalanHeinz & Gopalan 2012) registered the optimal results among the three.
Previous studies on the AEBL have mainly focused on the flow dynamics, and only a few studies have utilized DNS to explore the dynamics and transport mechanisms of inertial particles such as sand particles or cloud droplets in the AEBL. Some limited LES studies with the Lagrangian point-particle method exist to study windblown sand transport in the atmosphere when considering the Coriolis force. Reference Vinkovic, Aguirre, Ayrault and SimoënsVinkovic et al. (2006) studied the sand dispersion in the AEBL using LES and achieved good agreement with measurements; they included the SGS effect in the particle dynamic equation through a stochastic differential equation but did not quantify the effect of the SGS model on the sand dynamics, so its usefulness remains unknown. Reference Li, Wang and ZhangLi, Wang & Zhang (2014) also used the LES and Lagrangian point-particle method to study windblown sand with experimental comparisons, but excluded the effects of the Coriolis force and SGS in their simulation. Their results show sand velocity profiles have a good agreement with measurements and the slip velocity between sand particles and the fluid phase contributes most to the motion of the sand particles.
Apart from windblown sand transport in the atmosphere, there are many studies in oceanography investigating particulate material transport in the oceanic mixing layer (OML) where the Ekman spiral is formed (Reference ShapiroShapiro 2004; Reference Inghilesi, Stocca, Roman and ArmenioInghilesi et al. 2008; Reference Soldati and MarchioliSoldati & Marchioli 2012; Reference Drivdal, Broström and ChristensenDrivdal, Broström & Christensen 2014; Reference Elghannay and TaftiElghannay & Tafti 2018; Reference Lai, Fang, Huang, He and ReibleLai et al. 2018; Reference van Sebillevan Sebille et al. 2018; Reference Chamecki, Chor, Yang and MeneveauChamecki et al. 2019; Reference Liu, Liu and FuLiu, Liu & Fu 2019; Reference Boufadel, Socolofsky, Katz, Yang, Daskiran and DewarBoufadel et al. 2020; Reference Higgins, Vanneste and BremerHiggins, Vanneste & Bremer 2020). Reference Chamecki, Chor, Yang and MeneveauChamecki et al. (2019) summarized four aspects (i.e. preferential concentration, settling velocity, vertical distribution and horizontal transport) of material transport in the OML using LES studies, but the studies they reviewed did not explicitly investigate how particulate material could transport in the Ekman layer. Reference ShapiroShapiro (2004) utilized a 2.5-dimensional model to study the effect of the Ekman spiral on sand transport in a shallow sea and discovered that sand could deviate 5–30° with respect to the direction of free-stream water flow at typical shelf sea parameters. Reference Inghilesi, Stocca, Roman and ArmenioInghilesi et al. (2008) carried out two LES investigations to study the dispersion of buoyant particles in neutral and stratified wind-driven Ekman layers. Their simulation adopted one-way coupling Eulerian–Lagrangian two-phase LES and demonstrated that stratification could trap buoyant particles in the pycnocline region and prevent them from reaching the free-surface region. Reference Soldati and MarchioliSoldati & Marchioli (2012) compared DNS and LES results in a sediment–water flow and aimed at LES feasibility for flows with high sediment concentration near the boundary where particle–particle collision cannot be ignored. Reference Liu, Liu and FuLiu et al. (2019) investigated the saltation of sediments near the boundary using Eulerian–Lagrangian two-phase LES. However, Reference Soldati and MarchioliSoldati & Marchioli (2012) and Reference Liu, Liu and FuLiu et al. (2019) did not intend to study sand transport in the upper region of the atmospheric boundary, and the Coriolis force was not included in the governing equation.
Previous studies show that LES has been extensively used to study the transport and saltation of sand particles in the atmosphere and ocean. However, the smallest turbulent eddies (i.e. the Kolmogorov length scale), which are strongly linked to particulate material, cannot be directly computed and must be modelled in LES (Reference Wang and MaxeyWang & Maxey 1993; Reference Yang and LeiYang & Lei 1998; Reference BalachandarBalachandar 2009; Reference Wang, Lam and LuWang, Lam & Lu 2018). It is still debated whether it is necessary to include SGS effects in the particle dynamic equation when modelling particles in turbulent flow using LES (Reference Fede and SimoninFede & Simonin 2006; Reference Pozorski and AptePozorski & Apte 2009; Reference FoxFox 2011; Reference MarchioliMarchioli 2017; Reference Rosa and PozorskiRosa & Pozorski 2017; Reference Bassenne, Esmaily, Livescu, Moin and UrzayBassenne et al. 2019). Therefore, DNS, where the smallest turbulent eddies can be fully resolved, should be the first step to studying particle transport in the AEBL. The results of DNS can then serve as a benchmark for comparison with LES and experimental results in the future. In this manuscript, we perform a two-phase DNS study to explore the dynamics of sand particle transport in the AEBL using the Eulerian–Lagrangian method.
In composition, § 2 presents the detailed formulation of the two-phase DNS method; § 3 presents the numerical implementation and parameters; § 4 presents the significant results and discussions; § 5 concludes the major findings.
2. Direct numerical simulation formulation
This work adopted the Eulerian–Lagrangian two-phase DNS to simulate sand particles transporting in the neutrally stable ABEL. In this method, the air phase is modelled by the incompressible Navier–Stokes (NS) equations, and the particle dynamic equations follow the trajectory and velocity of the discrete sand particle phase.
2.1 Navier–Stokes equations
The three-dimensional (3-D) incompressible NS equations under the influence of the Coriolis force read as
 \begin{gather}\boldsymbol{\nabla }\boldsymbol{\cdot }\boldsymbol{u} = 0,\end{gather}
 \begin{gather}\frac{{\partial \boldsymbol{u}}}{{\partial t}} + \boldsymbol{u}\boldsymbol{\cdot }\boldsymbol{\nabla }\boldsymbol{u} = {-} \frac{{\boldsymbol{\nabla }p}}{{{\rho _0}}} + \nu {\nabla ^2}u - \boldsymbol{f} \times \boldsymbol{u}\boldsymbol{.}\end{gather}
Here,  $\boldsymbol{u} = (u,v,w)$ is the velocity vector of air, u, v and w represent three velocity components along the coordinates x (streamwise), y (spanwise) and z (vertical), respectively; p is the pressure, ${\rho _0}$ is the reference density, $\nu $ is the kinematic viscosity of the air; $\boldsymbol{f} = 2\varOmega \,\textrm{sin}\,\theta \boldsymbol{k}$ represents the Coriolis force, where $\boldsymbol{k}$ is the unit vertical vector, $\theta $ is the latitude and $\varOmega $ is the Earth's rotation rate (Reference Deusebio, Brethouwer, Schlatter and LindborgDeusebio et al. 2014). Since the centrifugal force is normally considered as a part of geopotential $\boldsymbol{\varPhi } = g\boldsymbol{z}$, with g being gravity acceleration, which is assumed to be a function of the vertical coordinate alone (Reference VallisVallis 2017), its effect on fluid and particle phases would not be investigated in this study. However, it is interesting to observe that the centrifugal force could push the inertial particles outwards (Reference Xia, Yu and GuoXia et al. 2020), serving to counteract the effect of the gravitational force.
The AEBL is driven by a constant pressure gradient
 \begin{equation}\boldsymbol{\nabla }p/{\rho _0} = {-} \boldsymbol{f} \times \boldsymbol{G},\end{equation}
where  $\boldsymbol{G}$ is the geostrophic wind vector aligned with axis x. We can normalize the NS equations using the laminar Ekman layer thickness, ${\delta _E} = \sqrt {2\nu /f} $ with $f = |\boldsymbol{f} |$ and the geostrophic wind speed $G = |\boldsymbol{G} |$. Thus, the normalized air viscosity is represented by the Ekman Reynolds number $Re = G{\delta _E}/\nu $ and the term associated with the Coriolis force $\boldsymbol{f} \times \boldsymbol{u}$ will become
 \begin{equation}( - v{\delta _{i1}} + u{\delta _{i2}})/Ro,\end{equation}
where  $Ro = Re/2 = G/f{\delta _E}$ is the Rossby number. We can also define another Reynolds number $R{e_\tau } = {u_\tau }{\delta _\tau }/\nu $ by the ground friction velocity ${u_\tau } = \sqrt {{\tau _w}/\rho } $ and the turbulent Ekman layer thickness ${\delta _\tau } = {u_\tau }/f$.
The boundary conditions (BCs) are set as periodic boundaries in the streamwise and spanwise directions. At the ground wall,  $z = 0$, all air velocities are applied as zero and at the upper boundary, $z = {l_z}$, a free-slip boundary applies:
 \begin{equation}\frac{{\partial u}}{{\partial z}} = \frac{{\partial v}}{{\partial z}} = 0,\quad w = 0.\end{equation}
2.2 Particle dynamic equations
The dynamic equations of sand particles are shown as
 \begin{equation}\frac{{{\textrm{d}^2}{\boldsymbol{x}_p}}}{{\textrm{d}{t^2}}} = \frac{{\textrm{d}{\boldsymbol{u}_p}}}{{\textrm{d}t}} = \frac{{{C_D}({\boldsymbol{u}_{f@p}} - {\boldsymbol{u}_p})}}{{{\tau _p}}} + \left( {1 - \frac{1}{{{\rho^\ast }}}} \right)\boldsymbol{g}.\end{equation}
Here,  ${\boldsymbol{x}_p}$ and ${\boldsymbol{u}_p}$ are the position and velocity vectors of one sand particle; ${\boldsymbol{u}_{f@p}}$ is the air velocity vector at the position of the sand particle; ${C_D} = 1 + 0.15Re_p^{0.678}(R{e_p} > 1.0)$ is the drag force coefficient and the particle Reynolds number $R{e_p} = {d_p}|{{\boldsymbol{u}_{f@p}} - {\boldsymbol{u}_p}} |/\nu $; ${\tau _p} = {\textstyle{1 \over {18}}}({\rho _p}/{\rho _f})(d_p^2/\nu )$ is the particle relaxation time; density ratio ${\rho ^\ast } = {\rho _p}/{\rho _f}$; and $\boldsymbol{g} = g\boldsymbol{k}$ is gravitational acceleration. In (2.5), the first term on the right side represents the drag forces, while the second term is the difference between gravity and the buoyancy force. This equation is applicable only to round particles, thus, we assume all sand particles in our simulation to be spherical. The BCs for sand particles are identical to those of the air phase, with attention only given to the BC on the ground wall. We treat the ground wall as a smooth wall and employ a perfectly elastic collision scheme, implying no kinetic energy losses during the particle–wall collision process. Although Reference Konan, Kannengieser and SimoninKonan, Kannengieser & Simonin (2009) suggested the adoption of a stochastic rough wall algorithm when the direction of gravity is perpendicular to the ground wall, to prevent solid particles trapped near the ground wall, we do not consider this modification, as it would contaminate the gravitational effect near the ground wall. We further neglect the Coriolis force effect on the particle phase, due to the difficulty it raises for a clear investigation of the effect of gravity and fluid flow on the particles (see § D in the supplementary material available at https://doi.org/10.1017/flo.2024.20 where the Coriolis force effect is discussed), which is the focus of our study.
3. Simulation parameters
We utilized the computational code developed by Reference Wang, Lam and TseWang, Lam & Tse (2021) with modifications made to account for the Coriolis force. The DNS code was initially developed and published by Reference CostaCosta (2018) and Reference Wang, Lam and TseWang et al. (2021) and incorporates a module that solves the dynamic equation of the solid phase using the point-particle method. This one-way coupling Eulerian–Lagrangian method is applicable when the ratio between the diameter of the solid phase and the characteristic turbulent scale is much smaller than unity (Reference ElghobashiElghobashi 2019) and the particle volume fraction is smaller than 10−5 (Reference KuertenKuerten 2016).
The detailed algorithm to solve the NS equations for the air phase can be found in Reference CostaCosta (2018). For the solid phase, the particle dynamic equations are solved using the third-order Runge–Kutta scheme. It is important to note that the time step  $\Delta t$ is now determined simultaneously by the air and solid phases. We used the same criteria as Reference Wang, Lam and TseWang et al. (2021), i.e.
 \begin{gather}\Delta {t_p} = \min \left( {{\tau_p},\min \left( {\frac{{\Delta x}}{{|{{u_p}} |}},\frac{{\Delta y}}{{|{{v_p}} |}},\frac{{\Delta z}}{{|{{w_p}} |}}} \right)} \right),\end{gather}
 \begin{gather}\Delta t = \min (\Delta {t_f},\lambda \Delta {t_p}).\end{gather}
Here,  $\Delta {t_f}$ and $\Delta {t_p}$ are the time steps of the air and solid phases, respectively; $\lambda = 0.25$ is a relaxation factor to adjust the ratio between $\Delta {t_f}$ and $\Delta {t_p}$. In this study the same dimensionless time step $\Delta \tilde{t} = \Delta tG/{\delta _E} = 0.005$ is adopted for both the discretized NS equations and particle dynamic equations.
Our computational domain has the dimensions  ${l_x} \times {l_y} \times {l_z} = 96{\delta _E} \times 48{\delta _E} \times 32{\delta _E}$, corresponding to a mesh size of $480 \times 240 \times 120$. The grids are uniform along the x and y axes, and non-uniform along the z axis with denser grids near the ground. The resolution expressed as a normalized grid spacing $\Delta {x^ + } = \Delta x{u_\tau }/\nu = \Delta {y^ + } = \Delta y{u_\tau }/\nu = 5.2$. In the vertical direction, it is ensured that more than 10 grid points are within the region $0 < {z^ + } < 10$ and the grid spacing $\Delta z$ is always smaller than or nearly equal to the local Kolmogorov length scale, $\eta = {\nu ^{3/4}}/{\varepsilon ^{1/4}}$. In this study, $Re = G{\delta _E}/\nu $ is set to be 400, and the corresponding normalized shear stress ${u_\tau }/G$ is equal to 0.065, which is similar to Reference Coleman, Ferziger and SpalartColeman et al. (1992), attesting to the correctness of our simulation.
After the turbulence is fully developed, solid particles are released only within the turbulent Ekman region  ${\delta _\tau } \approx 13{\delta _E}$. Two series of DNS of a particle-laden turbulent Ekman boundary layer are carried out. One group has zero gravity and another sets the dimensionless gravity $\tilde{g} = g{\delta _E}/{G^2}$ to be $1 \times {10^{ - 3}}$, which is determined with the same Froude number $Fr = u_\tau ^3/\nu g$ between simulation and real-world measurement. The friction velocity was set to be 0.2516 m s−1, which accords closely with the field measurements (Reference Andreas, Claffey, Jordan, Fairall, Guest, Persson and GrachevAndreas et al. 2006). Correspondingly, the Froude number is 109.85, using which we determine the dimensionless gravity as $\tilde{g} = 1 \times {10^{ - 3}}$.
In each simulation group, there are 8 sub-groups corresponding to 8 different particle diameters, which are decided by the Stokes number  $S{t^ + } = {\tau _p}u_\tau ^2/\nu $, as defined by ${u_\tau }$ and ${\rho ^\ast } = 2000$. Therefore, there are 16 simulation cases in total. A particle Froude number $F{r_p} = {u_\tau }/{\tau _p}g$ is also defined to reflect the gravitational effect: a large $F{r_p}$ represents a weak gravitational effect and a smaller terminal vertical velocity of solid particles. The computational parameters for each case are summarized in table 1.
Simulation parameters for particle-laden turbulent Ekman boundary layer.

After releasing the solid particles when the dimensionless time  $\tilde{t} = tG/{\delta _E}$ is denoted as the initial time 0, we recorded data in every 1000 steps ( $\Delta \tilde{t} = 5$) until the duration time exceeded the inertial time, $2\pi /f \cdot G/{\delta _E} = 2\pi Ro = 400\pi $ (Reference Deusebio, Brethouwer, Schlatter and LindborgDeusebio et al. 2014). Because of the gravitational effect, most of the solid particles for case $S{t^ + } = 48$ will deposit on the ground wall after $\tilde{t} > 1000$. Thus, not all recorded data can be used for statistical analysis. After examining the time-varying averaged velocity profiles for cases $S{t^ + } = 0.2$, 3 and 48 and profiles of particle vertical velocity (see figures S1 and S2 in the supplementary material), the same time interval $\tilde{t} \in [350,900]$ was chosen for all 16 simulation cases in the subsequent statistical analysis, which is at least 5-fold the cycling time ( ${l_x}/G = 96{\delta _E}/G$) and sufficient to attain reliable statistical results. Besides, we also provide validation results compared with previous studies in figure S3 in the supplementary material, showing that the Coriolis force is correctly introduced in the NS equation. A typical vortex structure of an Ekman boundary layer is also depicted in figure S5, revealing tangled vortex filaments that are oblique with respect to the x direction.
4. Results and discussions
4.1 Vertical profiles of sand particle velocity
We first investigate numerically the vertical profiles of first- and second-order moments of the sand particles’ velocities. The mean velocities are presented in figure 1; the root-mean-square (r.m.s.) and Reynolds stress of the velocities are shown in figure 2 with gravity  $\tilde{g} = 0$ and figure 3 with gravity $\tilde{g} = 1 \times {10^{ - 3}}$.
Profiles of mean velocities of sand particles with (a–c) gravity  $\tilde{g} = 0$ and (d–f) gravity $\tilde{g} = 1 \times {10^{ - 3}}$. Panels show (a,d) $\overline {{u_p}} $; (b,e) $\overline {{v_p}} $; (c,f) hodograph of mean horizontal velocities.

Profiles of r.m.s. of sand particle velocities with gravity  $\tilde{g} = 0$: (a) r.m.s. of ${u^{\prime}_p}$; (b) r.m.s. of ${v^{\prime}_p}$; (c) r.m.s. of ${w^{\prime}_p}$; (d) Reynolds stress $\overline {{{u^{\prime}}_p}{{w^{\prime}}_p}} $.

Profiles of r.m.s. of sand particle velocities with gravity  $\tilde{g} = 1 \times {10^{ - 3}}$: (a) r.m.s. of ${u^{\prime}_p}$; (b) r.m.s. of ${v^{\prime}_p}$; (c) r.m.s. of ${w^{\prime}_p}$; (d) Reynolds stress $\overline {{{u^{\prime}}_p}{{w^{\prime}}_p}} $.

The impact of gravity on the vertical profiles of the horizontal components of sand particle velocities, as depicted in figure 1, is evidently significant. Notably, when gravity is turned off, the profiles of normalized streamwise velocity,  ${u_p}/G$ (see figure 1a), exhibit remarkable consistency across all Stokes numbers examined in this investigation. Upon closer inspection of figure 1(a), it is discernible that the Stokes number exerts a discernible influence on the $\overline {{u_p}} /G$ profile. Specifically, an increase in the Stokes number results in an increase in $\overline {{u_p}} /G$ at ${z^ + } = 3{\sim}6$, whereas the opposite trend is observed at ${z^ + } = 20{\sim}30$, with $\overline {{u_p}} /G$ decreasing as the Stokes number increases.
Meanwhile, the  $\overline {{u_p}} /G$ profiles collapse at ${z^ + } \approx 10$ in the central region of the buffer layer. It is noteworthy that the velocity profile in the vicinity of the wall boundary can typically be classified into three distinct zones, namely the viscous sublayer, buffer layer and log-law (turbulent) region, with the wall distance ${z^ + }$ increasing (also see figure S4 in the supplementary material showing that ${z^ + } = 3$ and ${z^ + } = 30$ could be identified as two interfaces among three layers). The wall distances that demarcate these three regions are in line with those at which the Stokes number has a discernible impact on the $\overline {{u_p}} /G$ profiles. Correspondingly, for the normalized spanwise velocity, $\overline {{v_p}} /G$, when gravity is turned off (see figure 1b), the profiles in the buffer layer and log-law region are influenced by the Stokes number significantly, showing that, with increasing Stokes number, the value of $\overline {{v_p}} /G$ is decreasing and the maximum $\overline {{v_p}} /G$ occurs at ${z^ + } = 20{\sim}30$, which separates the buffer layer and log-law region. Besides, it is very interesting to find that the $\overline {{v_p}} /G$ profiles collapse at ${z^ + } \approx 5$, which separates the viscous sublayer and buffer layer.
When we link two components of the horizontal velocity at the same wall distance, as illustrated in figure 1(c), it becomes clear that the Stokes number exerts a significant influence on the behaviour of the velocity profiles within the buffer layer and log-law region, characterized by values of  $\overline {{u_p}} /G \in [0.2,1]$ and $\overline {{v_p}} /G \in [0.1,0.25]$. Moreover, as the Stokes number increases, these two velocity components exhibit a simultaneous decrease and gradually deviate from the profiles observed for the air phase.
The vertical profiles of the two components of the horizontal velocity under the influence of gravity are presented in figure 1(d–f). On the one hand, it is notable that the velocities are significantly altered by the presence of gravity, particularly within the viscous and buffer layers. In contrast to the scenario where gravity is absent, the streamwise component  $\overline {{u_p}} /G$ displays a consistent trend within both the viscous and buffer layers, with an increase in $\overline {{u_p}} /G$ as the Stokes number rises. By comparing figure 1(a,d), it is apparent that gravity can amplify $\overline {{u_p}} /G$ within the viscous and buffer layers when the Stokes number exceeds 6. On the other hand, in the case of the spanwise velocity, $\overline {{v_p}} /G$, the presence of gravity does not affect the underlying trend compared with the case without gravity. Nonetheless, a clear reduction in $\overline {{v_p}} /G$ can be observed as the Stokes number is larger than 6 and ${z^ + }$ is approximately above 5. Interestingly, gravity also exhibits the capability to enhance the $\overline {{v_p}} /G$ within the viscous layer, particularly for Stokes numbers greater than 6.
Figures 2 and 3 display the profiles of the r.m.s. of the sand particle velocities for gravity  $\tilde{g} = 0$ and $\tilde{g} = 1 \times {10^{ - 3}}$, respectively. The observed Stokes number effect is evident from the figures, indicating that, in the absence of gravity, the r.m.s. of streamwise particle velocity increases with the size of the particles in the vicinity of the peak. By contrast, the r.m.s. of the spanwise and vertical particle velocities decreases with increasing Stokes number also in the vicinity of the peak, especially the vertical velocity at $St = 48$ is almost half of that at $St = 0.2$. The Reynolds stress $\overline {{{u^{\prime}}_p}{{w^{\prime}}_p}} /{G^2}$ profiles reveal that, at $St = 3\ {\rm and}\ 6$, the Reynolds stress peaks at ${z^ + } = 30$, which corresponds to the separation between the buffer layer and log-law region. This finding suggests that, in the vicinity of the separation interface, the mean flow of sand particles is subjected to substantial forces that are attributed to the fluctuations in their motion.
After gravity is introduced, the profiles for cases with  $St \le 3\ {\rm and}\ 6$ remain similar to those without gravity. However, larger Stokes number cases exhibit higher fluctuations than the smaller ones, and the largest fluctuations approach the ground wall. Notably, the trend observed at $St = 48$ is the result of insufficient data to obtain more stable statistics. As discussed in § 3, the selected time interval for statistical analysis is the maximum possible when gravity is turned on. Given that the results for $St = 48$ are similar to those for $St = 24$, we consider them reliable enough to support the general conclusion previously mentioned.
4.2 Statistical results of slip velocity
As evidenced by (2.5), the motion of sand particles is governed by buoyancy forces attributable to gravity and drag forces determined by the difference in the velocities between sand particles and air at their location. In the absence of a gravitational effect, only the drag forces would contribute to the dynamics of the sand particles. Thus, it is imperative to scrutinize the dominant component of the drag force, which is the velocity difference, denoted as  $\mathrm{\Delta }\boldsymbol{u} = {\boldsymbol{u}_{f@p}} - {\boldsymbol{u}_p}$. We present a simple qualitative and quantitative analysis on the slip velocity for the representative case $St = 6$ (see § C in supplementary material), but more detailed statistical results are useful to fully understand the dynamics of the slip velocity and the gravitational effect.
The simulated profiles of the average and r.m.s. slip velocities are shown in figures 4 and 6, respectively, in the absence of gravity. Analogous to figure 1, it is noteworthy that the mean slip velocities of each component manifest three subregions within the Ekman boundary layer. In the vicinity of the separation between the viscous sublayer and buffer layer, i.e.  ${z^ + } = 3{\sim}6$, local maximum peaks (labelled ‘A’ in figure 4) are observed from the $\overline {\mathrm{\Delta }u} $ and $\overline {\mathrm{\Delta }v} $ profiles, which increase with increasing Stokes number, signifying that large sand particles are unable to follow the fluid motion due to their inertial effect. These maximum peaks are negative; therefore, the corresponding drag forces hinder the forward motion of sand particles, causing reduced streamwise and spanwise velocities.
Profiles of mean slip velocities with gravity  $\tilde{g} = 0$: (a) $\overline {\Delta u} $; (b) $\overline {\Delta v} $; (c) $\overline {\Delta w} $; (d) hodograph of mean horizontal slip velocities (the three coloured patches are roughly determined by cases $St = 3\;\textrm{and}\;6$). Here, VL, BL and LR stand for viscous sublayer, buffer layer and log-law region, respectively.

Furthermore, at the interface between the buffer layer and the log-law region, another local maximum peak (labelled ‘B’ in figure 4) is observed in the  $\overline {\mathrm{\Delta }u} $ and $\overline {\mathrm{\Delta }v} $ profiles. In contrast to the previous maximum peaks, these second maximum peaks are positive, indicating that sand particles experience an enhancement in both streamwise and spanwise velocities. Comparing the profiles of mean velocities of sand particles in figure 1, it is evident that these negative and positive peaks of slip velocities contribute to the convex shapes in figure 1 at ${z^ + } = 3{\sim}6$ and ${z^ + } = 20{\sim}30$, i.e. the two interfaces among three subregions.
In contrast to the streamwise and spanwise slip velocities, the vertical slip velocity does not serve as a marker for the interfaces between the three subregions. Instead, the vertical slip velocity exhibits one peak of  $\overline {\mathrm{\Delta }w} $ that is positioned marginally above ${z^ + } = 10$, with a second peak at ${z^ + } = 50{\sim}60$ manifesting solely in cases where $St$ exceeds 12. It is noteworthy that the magnitude of the vertical slip velocity is an order of magnitude smaller than the other two components. Hence, in the absence of gravity, sand particles can closely follow the fluid motion in the vertical direction.
In addition, figure 4(d) illustrates the joint relationship between the streamwise and spanwise slip velocities. The joint relationship can be separated into three subregions, shaded by light purple, light golden and light blue colours, respectively. Based on the relative relationship between the streamwise and spanwise slip velocities, these three subregions are corresponding to viscous sublayer, buffer layer and log-law region, respectively. The separation points, which vary for each case, are labelled as A and B in terms of the peak values. One example of subregion division from case  $St = 3\ {\rm and} \ 6$ is shown in figure 4(d). The normalized slip velocities show a clear Stokes number effect, with the most prominent changes occurring in the light purple region, where both streamwise and spanwise slip velocities decrease significantly as the Stokes number increases from 0.2 to 3 or 6. This decrease in slip velocities leads to a substantial reduction in sand velocities.
Furthermore, with an increase in Stokes number from 0.2 to 3 or 6, the spanwise slip velocity decreases in the light golden region and the streamwise slip velocity increases in the light blue region. When the Stokes number increases from 3 or 6 to 48, the opposite trend is observed in all three subregions in figure 4(d). We also provide another strategy using particle diameters to normalize the slip velocity (see figure S9 in the supplementary material), which would be closer to the drag force formula and shows a similar trend to figure 4(d). This finding supports the notion that, at  $St = 3\; \textrm{or}\; 6$, the normalized slip velocities are at their maximum, indicating that their contribution to drag forces in (2.5) are the largest, and the interaction between sand particles and turbulence is the strongest.
In figure 6, the second-order moment of the slip velocities exhibits similar trends for all three components, with an increase in Stokes number resulting in an increase in the fluctuation of the slip velocities. The only discernible distinction is the location of the peak. The peak location shifts gradually from  ${z^ + } = 10{\sim}20$ to ${z^ + } = 20{\sim}30$ and finally to ${z^ + } = 40{\sim}60$. These locations correspond to regions positioned slightly below the separation of the buffer layer and log-law region, the separation of these regions and slightly above their separation, respectively. Additionally, the flux $\overline {\Delta u^{\prime}\Delta w^{\prime}} $ profiles demonstrate that sand particles at the separation of the buffer layer and log-law region and its vicinity contain the strongest transport capacity, consistent with the findings of the vertical profiles in figure 4. This suggests that the interaction between sand particles and turbulence is strongest in this region compared with other regions.
Profiles of mean slip velocities with gravity  $\tilde{g} = 1 \times {10^{ - 3}}$: (a) $\overline {\Delta u} $; (b) $\overline {\Delta v} $; (c) $\overline {\Delta w} $; (d) hodograph of mean horizontal slip velocities (the three coloured patches are roughly determined by cases $St = 3\ {\rm and} \ 6$). VL, BL and LR stand for viscous sublayer, buffer layer and log-law region, respectively.

Profiles of r.m.s. of slip velocities with gravity  $\tilde{g} = 0$: (a) r.m.s. of $\Delta u^{\prime}$; (b) r.m.s. of $\Delta v^{\prime}$; (c) r.m.s. of $\Delta w^{\prime}$; (d) Reynolds stress $\overline {\Delta u^{\prime}\Delta w^{\prime}}$.

Upon the introduction of gravity, significant changes in the slip velocity profiles are observed, as depicted in figures 5 and 7. Notably, gravity amplifies the slip velocities in the streamwise and spanwise directions in the viscous sublayer. This observation is of great interest since the direction of gravity is perpendicular to these two directions. The substantial difference in slip velocities in the viscous sublayer also suggests that sand particles tend to accumulate in regions of low fluid velocity (Reference Sardina, Schlatter, Brandt, Picano and CasciolaSardina et al. 2012; Reference Shao, Wu and YuShao, Wu & Yu 2012), given that the slip velocities in the horizontal directions are all negative near the ground wall. However, the overall shape of the horizontal slip velocities remains unaffected by gravity.
Profiles of r.m.s. of slip velocities with gravity  $\tilde{g} = 1 \times {10^{ - 3}}$: (a) r.m.s. of $\Delta u^{\prime}$; (b) r.m.s. of $\Delta v^{\prime}$; (c) r.m.s. of $\Delta w^{\prime}$; (d) Reynolds stress $\overline {\Delta u^{\prime}\Delta w^{\prime}} $.

Conversely, the vertical slip velocity is significantly influenced by gravity, such that its magnitude is now comparable to that of the other two components. Due to the effect of gravity, the vertical velocity of sand particles is negative, particularly for larger sand particles. As such, the vertical slip velocity is positive and exhibits a larger magnitude for larger sand particles, as evidenced by figure 5(c). The peak of the vertical slip velocity observed at  ${z^ + } = 10{\sim}40$ is also a consequence of the strong interaction between the two phases. Furthermore, the joint relationship between slip velocities when gravity is turned on yields similar results to those without gravity. The most conspicuous difference is observed in the light golden region, which denotes the buffer layer, as the negative streamwise slip velocity penetrates into the log-law region for large sand particles, as seen in figure 5(a).
Figure 7 illustrates the impact of gravity on slip velocity fluctuations. As with the profiles of mean slip velocity, the fluctuations of horizontal slip velocities are significantly influenced by gravity. Analysis of figure 7(a,b) reveals that gravity causes a shift in the slip velocity fluctuations towards lower positions closer to the ground wall. Moreover, when large sand particles are present, a second peak emerges in the fluctuational profile of the spanwise slip velocity, which is located near the separation between the viscous sublayer and buffer layer. It is apparent that the presence of gravity results in the highest flux  $\overline {\Delta u^{\prime}\Delta w^{\prime}} $ of the slip velocities being shifted into the buffer layer compared with the case without gravity, indicating that gravity has the capacity to modify the interaction between the solid and fluid phases.
4.3 Three-dimensional Voronoï diagram analysis of sand particles
In this section, we are investigating the clustering behaviour of sand particles within the AEBL. To this end, the Voronoï diagram methodology, which has been extensively utilized in the solid–fluid two-phase flow (Reference Monchaux, Bourgoin and CartellierMonchaux, Bourgoin & Cartellier 2010; Reference García-Villalba, Kidanemariam and UhlmannGarcía-Villalba, Kidanemariam & Uhlmann 2012; Reference Tagawa, Mercado, Prakash, Calzavarini, Sun and LohseTagawa et al. 2012; Reference Rabencov and van HoutRabencov & van Hout 2015; Reference Yuan, Zhao, Andersson and DengYuan et al. 2018), is employed in the present investigation. The Voronoï diagram serves to compute the spatial volume that can be occupied by each sand particle, and the inverse of this spatial volume is presented as a proxy for the spatial concentration of sand particles. We will utilize this Voronoï diagram approach to quantify the clustering property in subsequent analyses.
4.3.1 Clustering and preferential concentration of sand particles
In order to quantify the proximity level of sand particles to one another, we compute the probability density function (PDF) of the normalized Voronoï volume  ${{\mathcal{V}}}/\langle {{\mathcal{V}}}\rangle $. The results are presented in figure 8 with gravity $\tilde{g} = 0$. We observe in figure 8(a) that the PDFs of ${{\mathcal{V}}}/\langle {{\mathcal{V}}}\rangle $ deviate from that of the Poisson process, which represents the 3-D random uniform distribution (Reference Ferenc and NédaFerenc & Néda 2007) in the whole computational domain. Specifically, as the Stokes number increases, the clustering level of sand particles is enhanced, as evidenced by an increase in the deviation of the PDFs from that of the Poisson process. Conversely, when St is smaller than 1, the PDFs of ${{\mathcal{V}}}/\langle {{\mathcal{V}}}\rangle $ are consistent with that of the Poisson process, indicating that sand particles do not exhibit any preference for accumulation in these cases.
The PDF of the Voronoï volume with gravity  $\tilde{g} = 0$. The four panels represent PDF results of sand particles in (a) whole domain, (b) slab of ${z^ + } = 5.6$, (c) slab of ${z^ + } = 30.7$ and (d) slab of ${z^ + } = 101.9$.

Furthermore, the PDFs of sand particles intersect with that of the Poisson process at  ${{\mathcal{V}}}/\langle {{\mathcal{V}}}\rangle = 0.5$ and 2.0. Previous studies (Reference Monchaux, Bourgoin and CartellierMonchaux et al. 2010) suggest that these points can be used as thresholds for identifying clusters and voids of sand particles. We employ this criterion to colour the Voronoï volume in figure 9 with yellow for ${{\mathcal{V}}}/\langle {{\mathcal{V}}}\rangle < 0.5$, green for ${{\mathcal{V}}}/\langle {{\mathcal{V}}}\rangle > 2$ and cyan representing values between these two extremes. Notably, although the PDFs of clusters are significantly higher than that of the Poisson process, the total spatial volume of clusters is smaller compared with voids, as evidenced in figure 9. Interestingly, when the Voronoï volume ${{\mathcal{V}}}/\langle {{\mathcal{V}}}\rangle $ is significantly larger than 2.0, even for cases with $St < = 1$, the spatial distribution of sand particles deviates significantly from that of a Poisson distribution, as shown in figure 8(a). This could be attributed to sand particles floating in the very high altitude region with ${z^ + } > 200$ where the turbulence intensity is very small (see figure S3 in the supplementary material) and the r.m.s. of the Voronoï volume is very large (see figure 10).
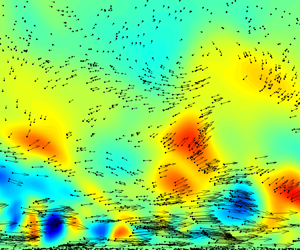
Top view of Voronoï diagram of sand particles for case  $St = 6$ in the buffer layer ( ${z^ + } = 15{\sim}25$) with gravity $\tilde{g} = 0$.

Vertical profiles of r.m.s. of the Voronoï volume. (a) Gravity  $\tilde{g} = 0$ and (b) gravity ${\tilde{g} = 1 \times 10^{-3}}$.

Since we observe that the profiles of sand velocities and slip velocities have some features near the interfaces between the viscous sublayer, buffer layer and log-law regions, it is of great importance to examine the clustering property near these interfaces. Therefore, we extract the 3-D Voronoï volumes of sand particles in the slabs near  ${z^ + } = 5.6$, $30.7$ and $101.9$, and compute their PDFs, which are depicted in figure 8(b–d). The PDF of a Poisson process representing the 2-D random uniform distribution is also included in these figures.
Interestingly, the PDFs exhibit a property of 3-D data, and cases with St smaller than 1 collapse well with the 3-D Poisson process instead of the 2-D one. From figure 8(b), representing sand particles accumulating near  ${z^ + } = 5.6$, we could observe that all cases present smaller PDFs than those near ${z^ + } = 30.7$ and $101.9$, indicating that, near the ground wall, clustering levels are weaker for all sand particles investigated in our study. From figure 8(b–d), as sand particles locate farther away from the ground wall, each case with St larger than 1 gradually obtains a higher clustering level. Besides, in the viscous sublayer and buffer layer, the cases $St = 12\;\textrm{and}\;24$ deviate most from the uniform distribution, instead of the case $St = 48$ having the strongest clustering level. Once sand particles with $St = 48$ enter the log-law region where turbulence becomes fully developed, they could have a relatively stronger interaction with the turbulent flow, leading to a stronger clustering result.
The gravity effect on the PDFs of the Voronoï volume is shown in figure S13 of the supplementary material. However, we could not find any clearly discernible difference from the gravity-off cases. To further examine the influence of gravity on the clustering level along the vertical direction, we adopt the r.m.s. of the Voronoï volume, which is an index commonly used for quantifying the clustering level (Reference Tagawa, Mercado, Prakash, Calzavarini, Sun and LohseTagawa et al. 2012). The r.m.s. profiles of the Voronoï volume are presented in figure 10. The results indicate a significant increase in the Voronoï volume r.m.s. values after the introduction of gravity, particularly in the buffer layer, where the r.m.s. values are doubled, indicating a dramatic enhancement in the clustering level in this layer.
Moreover, the clustering level along the vertical direction is observed to be much stronger in the log-law region, where turbulence is fully developed. By comparing figure 10 with figures 2 to 5, we find that the local peaks at  ${z^ + } = 60{\sim}70$ from the r.m.s. profiles are in close proximity to the peaks at ${z^ + } = 40{\sim}60$ from the profiles of the sand vertical velocity and vertical slip velocity. Therefore, it can be inferred that the spatial clustering level of sand particles is greatly influenced by their vertical velocity and vertical slip velocity. The direct evidence for this inference is demonstrated in figure 10, where gravity significantly changes the r.m.s. values of the Voronoï volume. As gravity exerts a vertical force on the sand particles, it can directly influence their vertical velocity and vertical slip velocity. Besides, in figure S14 of the supplementary material, the relationship between the Voronoï volume and the vorticity magnitude is provided for a further discussion on the particle clustering level.
4.3.2 Spatial and temporal analysis of Voronoï polygons of sand particles
We carried out a geometrical analysis on clusters similar to that conducted by Reference Monchaux, Bourgoin and CartellierMonchaux et al. (2010), who experimentally studied the characteristics of the area and periphery of 2-D Voronoï polygons. The superiority of our analysis is that the 3-D DNS data enable us to conduct a 3-D spatial analysis of Voronoï polygons. The relationship between the Voronoï volume  ${{\mathcal{V}}^{1/3}}/{\delta _E}$ and Voronoï surface area ${{{\mathcal{A}}}^{1/3}}/{\delta _E}$ is presented in figure S15 of the supplementary material. The result shows, irrespective of whether they are clusters or voids, that small and large Voronoï polygons exhibit an exponential law between ${{{\mathcal{V}}}^{1/3}}/{\delta _E}$ and ${{{\mathcal{A}}}^{1/3}}/{\delta _E}$ with a single fractal factor ${C_{{\mathcal{V}}}}$.
Furthermore, the effect of Stokes number on the observed fractal behaviours is presented in figure 11(a). In the absence of gravity, we observed that, as  $St$ increases from 0.2 to 48, the fractal factor initially decreases and then increases, with the error bar (i.e. r.m.s.) exhibiting a similar trend. The cases with the smallest fractal factors (i.e. $St = 3$ and 6) correspond to a steeper curve in ${{{\mathcal{V}}}^{1/3}}/{\delta _E}$ versus ${{{\mathcal{A}}}^{1/3}}/{\delta _E}$, indicating the strongest interaction between sand particles and turbulence, as discussed in § 4.2. Upon the introduction of gravity, the fractal factor increases, especially for large $St$ cases, with case $St = 3$ exhibiting a relatively smaller fractal factor and cases with $St > 3$ showing a noticeable increase. This observation is consistent with figure 10, which illustrates the effect of gravity on the clustering level.
(a) Stokes number effect on geometrical characteristics of Voronoï polygons. (b) Integral time scale of Voronoï volume against Stokes number.

We then investigate the temporal characteristics of the Voronoï volume. The variation of the Voronoï volume against time and the time autocorrelation coefficient  ${{\mathcal{R}}}$ of the Voronoï volume are given in figure S16 of the supplementary material. The ensemble average results of ${{\mathcal{R}}}$ reveal that the Voronoï volume becomes uncorrelated after $\tilde{t} = 125$, which is approximately 1.3 times one cycling time. This value is smaller than our sampling time of $5 \times 96{\delta _E}/G$, indicating that our chosen sampling period is sufficient for obtaining reasonable statistical results.
By integrating  ${{\mathcal{R}}}$ until the first occurrence where ${{\mathcal{R}}}$ equals zero we could define a time scale ${t_{{\mathcal{V}}}} = \int {{{\mathcal{R}}}\,\textrm{d}t} $ to quantify the duration for which sand particles can alter their clustering status. Figure 11(b) illustrates the results of this integral time scale as a function of $St$. Notably, for $St$ values smaller than 3, the mean integral time scale remains unchanged regardless of the Stokes number. Conversely, for $St$ exceeding 6 in the absence of gravity, larger sand particles with higher $St$ exhibit longer integral time scales, indicating that they can maintain their clustering status longer than smaller particles. This outcome can be attributed to the inertial effect, where larger sand particles are less influenced by turbulence and cannot follow the fluid flow.
However, introducing gravity alters this relationship. Specifically, larger sand particles with higher  $St$ experience a shorter integral time scale, even reaching ${t_{{\mathcal{V}}}} = 48{\delta _E}/G$ for case $St = 48$, which is equivalent to half of one cycling time. The gravitational force acting on sand particles results in larger particles being more easily dragged into low altitude regions where fluid fluctuations are higher (see figures 3 and 6). This effect reduces the particle's’ inertial effect and enhances the preferential concentration effect. Thus, when gravity is present, larger sand particles can change their clustering status more rapidly than smaller particles.
5. Conclusion
In this study, we have conducted DNS coupled with a Lagrangian point-particle method to investigate the dynamic properties of sand particles transport in the neutrally stable AEBL. We seek to explore the effect of Stokes number and gravity on the statistical results of the dynamics of sand particles in order to provide a benchmark for further comparison with full-scale measurement and LES where the exact interaction between particles and the smallest turbulent scales is normally neglected or modelled.
The main findings of this study are twofold. Firstly, It is interesting to observe that, within the viscous and buffer layers, the averaged horizontal slip velocities are magnified by gravity almost 5 times, leading to a very large impediment to forward motion of the sand particles, since the slip velocity is the key component of the drag force. From the hodograph of the mean horizontal slip velocity, we could see that, when the Stokes number is approximately 3 or 6, the normalized slip velocities are at their maximum, indicating that their contributions to the drag forces are the largest and the interaction between sand particles and turbulence is the strongest. It is also worth noting that the profiles of mean slip velocity are apparently divided into three regions i.e. viscous sublayer, buffer layer and log-law region.
Besides, from the PDF and r.m.s. profiles of the Voronoï volume of sand particles, we find that, with increasing Stokes number and gravity, the clustering level of sand particles is increasing no matter whether the sand particles are near to or far away from the ground. The spatial and temporal analysis also presents that gravity can change the Voronoï volume spatially and temporally, especially for those having a large Stokes number. This observation is another justification of the gravitational effect on the clustering level of sand particles, which proves that gravity can alter the interaction between sand particles and turbulence.
Acknowledgements
We give special thanks to the HPCs at HKUST for supporting us the computations of DNS.
Funding statement
We gratefully acknowledge the support of the National Natural Science Foundation of China (Project No. HW2023001), the Supporting Scheme of Chongqing for Returned Overseas Chinese Entrepreneurial Start-ups (No. cx2023004), the Fundamental Research Funds for the Central Universities of China (No. 0218005203003), the Start-Up Found of Chongqing University (No. 02180011080006 and No. 0218005203008) and the Research Grants Council of Hong Kong SAR, China (No. 16207719 and No. 16211821).
Declaration of interests
The authors report no conflict of interest.
Data availability statement
Data to support the findings in this article are available on request.
Supplementary material
Supplementary material is available at https://doi.org/10.1017/flo.2024.20.


 Open access