


A considerable challenge in understanding the invasion process is in developing useful tools to track changes in the abundance of nonnative species over time, with the goal of predicting when some of these species may begin to expand geographically and become invasive (i.e., a subset of nonnative species that exert negative effects on the environment [Convention on Biological Diversity 2000 ; International Union for Conservation of Nature 2000] or, according to other definitions, that experience rapid population expansion regardless of their environmental effects [Blackburn et al. Reference Blackburn, Pyšek, Bacher, Calton, Duncan, Jarošik, Wilson and Richardson2011; Richardson et al. Reference Richardson, Pyšek, Rejmẚnek, Barbour, Panetta and West2000, Reference Richardson, Pyšek and Carlton2011]). Significant benefits can be derived from being able to monitor and predict the temporal and spatial dynamics of recent introductions of nonnative plant species. This is critical to cost-efficient management in terms of both the prioritization of control actions (e.g., Ellstrand and Schierenbeck Reference Ellstrand and Schierenbeck2000; Mack et al. Reference Mack, Simberloff, Lonsdale, Evans, Clout and Bazzaz2000; Smolik et al. Reference Smolik, Dullinger, Essl, Kleinbauer, Leitner, Peterseil, Stadler and Vogl2010) and the implementation of rapid-response techniques (e.g., Reichard and Hamilton Reference Reichard and Hamilton1997; Ricciardi et al. Reference Ricciardi, Palmer and Yan2011). Being able to inform these processes is critical, given that financial support for these actions is limited (see Latombe et al. Reference Latombe, Pyšek, Jeschke, Blackburn, Bacher, Capinha, Costello, Fernández, Gregory and Hobern2017).
Management Implications
Invasive plant management is an extraordinary challenge, in part because nonnative species are common in many areas, and it is difficult to tell which of these may at some point start to expand and eventually become invasive. As such, it is difficult to determine where resources should be allocated. It is therefore critical to expand research that may help us predict the likelihood that a nonnative species will become invasive and the trajectory of invasion. We argue that the targeted expansion of herbarium data collections and subsequent construction and comparison of standardized invasion curves for many species can help. First, expanded and systematic herbarium collection will help managers to more easily understand what nonnative species are present and provide clues as to their preferred habitat and how long they have been present. This information alone is of value, as it allows managers to better monitor nonnatives, some of which might not be obvious. Second, the development of standard invasion curves has the potential to increase our knowledge of what species traits can predict important transitions that nonnative species make on the path to becoming invasive. For example, most invasive plants follow a population growth curve that typically includes a lag phase (i.e., starting almost flat before rising exponentially). We propose paths toward the implementation of consistent approaches to create invasive species curves from herbarium records. We think that this would enable establishing comparisons among nonnative species, which in turn can help us to understand what traits may determine lag times. This information would be invaluable for practitioners looking to identify not only which nonnative species are present in their region but also which ones are most likely to become invasive in a given time.
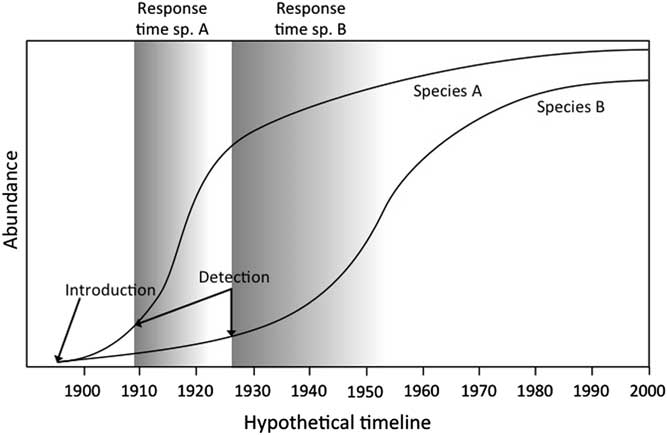
Invasion curves illustrate the path (i.e., area) of invasion as a function of time (Figure 1). We argue that there is a pressing need to develop standardized invasion curves for nonnative species to better estimate probable lag and response times across many species by combining multiple studies (see Aikio et al. Reference Aikio, Duncan and Hulme2010; Crooks Reference Crooks2005; Larkin Reference Larkin2012). Common measures of invasion include the area in which the species is found or the cost of invasive species management, depending on the goal of the curve’s author (see Cousens and Mortimer Reference Cousens and Mortimer1995; Hobbs and Humphries Reference Hobbs and Humphries1995). Important information emerges from these curves regarding the path some nonnative species take in becoming invasive. Invasive species generally follow a three-phase pathway: (1) lag phase, (2) expansion phase, and (3) plateau phase (Figure 1) (Shigesada and Kawasaki Reference Shigesada and Kawasaki1997). Invasive species curves vary both in the length of the expansion phase and the slope, which quantifies the aggressiveness of spread. These three phases, as well as the rate of spread, will vary across species (e.g., Larkin Reference Larkin2012). Understanding the source of this variation is critical to the goal of predicting what traits may indicate the potential for a nonnative species to become invasive and for the prioritization of invasive species management.
Invasive species curves for two hypothetical species (species A and B) with different lag and management-response times. Invasion curves quantify four components of the invasion process: the duration of the lag phase, the expansion phase, and the plateau phase (represented for species A on the figure), and the rate of the expansion phase (Shigesada and Kawasaki Reference Shigesada and Kawasaki1997). The lag phase, the time ranging from the species’ introduction to the inflection point into the population’s exponential growth (i.e., expansion phase), is defined as “the delayed onset or relatively slow rate of an invasion event or process” (Crooks Reference Crooks2011: 404). We define response time as the critical period after detection, which typically occurs at the onset of a population’s exponential growth. The earlier the response after detection (darker shaded areas), the more cost-effective invasive species control and possible eradication will be.
Considerable potential exists for building invasion curves from a variety of data sources (i.e., floristic surveys, literature, unpublished data, and online data). This potential is expanding as novel digital data acquisition (e.g., mobile technologies for species identification and their geographical positioning), storage, and analytical systems keep developing. Data collected by way of these systems are becoming of greater interest and utility, especially when combined with data from “citizen science” projects organized and led by institutions such as natural history museums or universities. Data collected via iNaturalist (https://www.inaturalist.org) or EDDMapS (http://www.eddmaps.org) are good examples of this. However, because invasion curves have largely relied upon historical data, the contribution of herbarium records toward the construction of invasion curves has thus far dominated (e.g., Follak et al. Reference Follak, Aldrian, Moser and Essl2015; see Table 1). Herbaria also represent a standard for data collection that can be used to devise data-quality standards that maximize the potential of new technologies.
Species for which invasions curves were constructed either using herbarium data (visited directly or accessed indirectly through digital records of specimens).Footnote a
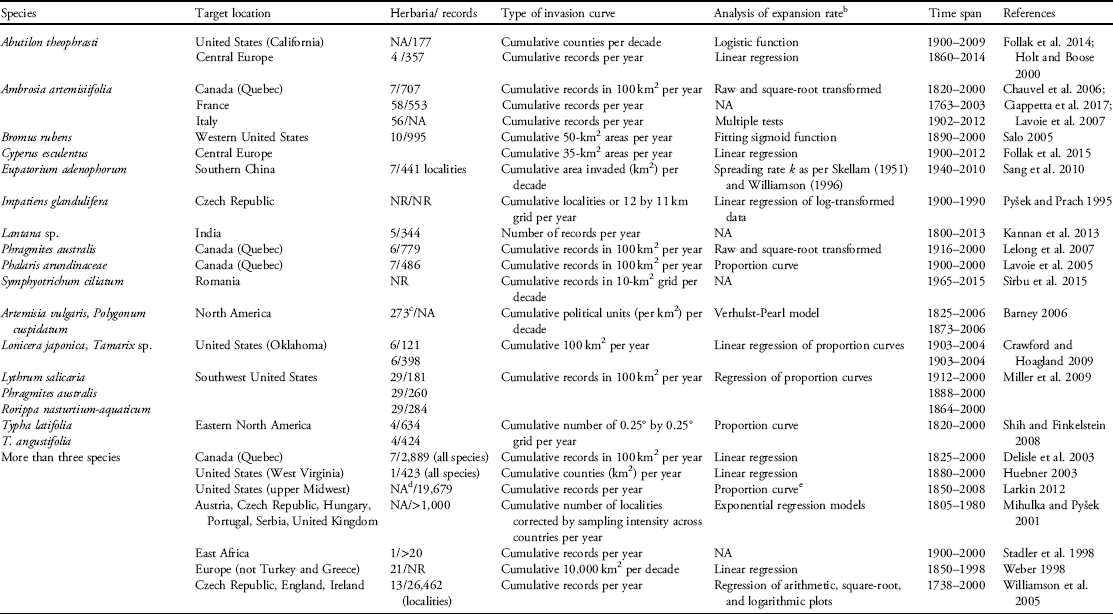
a In addition to herbarium records, curves may include data from field research, floristic records not from herbaria, literature, and other online data with digital images. We conducted a search on Web of Science and Google Scholar using the search terms “invas*” AND “curve” AND “plant,” ‘invasive” AND “impact,” ‘invasion curve,” and “invasive species curve” between the years 1990 to 2017. We then determined whether the papers reported invasive species curves using herbarium data, which were the large majority, and how these data were used to construct the curves. NR, not reported; NA, not applicable.
b Various statistical methods were used to compare expansion rates among species in studies of multiple species.
c Using the Index Herbarium, a global database of public herbaria (http://sciweb.nybg.org/science2/ih/searchih.html).
d Collection records from online herbaria databases, the vPlants portal (http://symbiota4.acis.ufl.edu/seinet/vplants/portal/index.php) and Wisflora (http://www.botany.wisc.edu/wisflora).
e Lag phases compared among species using the method by Aikio et al. (Reference Aikio, Duncan and Hulme2010).
Data can be combined from several sources to build invasion curves; for instance, Pyšek and Hulme (Reference Pyšek and Hulme2005) noted that data to estimate rates of invasive plant spread are collected at various spatial and temporal scales, using a variety of methods. Invariably, each method to construct invasion curves will have strengths and weaknesses that contribute to difficulties in comparing such curves across species. However, standardizing invasion curves offers considerable potential for addressing vital questions related to variation in the abovementioned three phases of invasion and the rate of spread during the expansion phase. The question then becomes, based on current resources, how can the goal of standardizing the process of constructing invasion curves be achieved? Although several studies have reported on the population dynamics of invasive plant species and constructed invasion curves, there is considerable variation in how the data that are typically obtained from herbaria are used in the building of these curves (Table 1).
A standardized methodology for preparing invasion curves in combination with appropriate data will enable researchers to more reliably study and compare the invasion trajectories of different species or functional groups of species, including their ecology and evolution (e.g., Flory and Clay Reference Flory and Clay2013). Specifically, comparing the four components of the invasion process across a wide variety of species may allow researchers to better understand previous invasions and anticipate future invasions. This could serve as a basis for establishing possible management plans, allowing managers to take advantage of longer response times (i.e., the time it takes before a nonnative species can no longer be eradicated or control costs are too high) (Figure 1). This is of acute importance in eastern North America, for example, which hosts a wealth of naturalized nonnative species (i.e., “those that maintain self-sustaining populations independently of direct human intervention”) that are not yet invasive but may someday become so (see Pyšek et al. Reference Pyšek, Pergl, Essl, Lenzner, Dawson, Kreft, Weigelt, Winter, Kartesz, Nishino, Antonova, Barcelona, Cabezas, Cardenas, Cardenas-Toro, Castano, Chacon, Chatelain, Dullinger, Ebel, Figueiredo, Fuentes, Genovesi, Groom, Henderson, Inderjit, Kupriyanov, Masciadri, Maurel, Meerman, Morozova, Moser, Nickrent, Nowak, Pagad, Patzelt, Pelser, Seebens, Shu, Thomas, Velayos, Weber, Wieringa, Baptiste and van Kleunen2017: 208). Standardizing methods of data collection may also help reverse the decline in traditional herbarium-based floristic survey work that has been so important for developing invasion curves; such declines have been noted as potentially limiting our ability to detect and track newly naturalized nonnative plant species (Lavoie et al. Reference Lavoie, Saint‐Louis, Guay, Groeneveld and Villeneuve2012).
To accurately predict if and when a nonnative naturalized species may begin to follow an invasion trajectory requires an understanding of the factors that influence both invasiveness (i.e., which traits are prevalent in invasive species; e.g., Hayes and Barry Reference Hayes and Barry2008) and invasibility (i.e., which factors influence the susceptibility of an area to invasion; e.g., Grotkopp et al. Reference Grotkopp, Rejmánek and Rost2002; Lonsdale Reference Lonsdale1999; Rejmánek and Richardson Reference Rejmánek and Richardson1996; Tilman Reference Tilman1999). A broad collection of standardized invasion curves can be cross-referenced with trait databases (both species traits and environmental traits; e.g., see TRY, a collection of worldwide trait databases [Kattge et al. Reference Kattge, Diaz, Lavorel, Prentice, Leadley, Bönisch, Garnier, Westoby, Reich, Wright and Cornelissen2011]), to allow researchers to test whether particular traits are associated with different kinds of invasion curves and whether traits may be predictive of invasion trajectory.
In this paper, we explore the limitations of approaches and data used to build invasion curves for plants and call for changes to these approaches that allow for the development of standardized invasion curves. Specifically, we focus on the use of herbarium records, which are the most readily available and commonly used data source for building invasion curves for plant species (Table 1). Additionally, we propose a list of critical questions that may be addressed by the broad adoption of a standardized method of invasion curve preparation (Table 2).
A summary of important questions that may be explored using standardized invasion curves for plant species.Footnote a

a Invasion curves quantify four components of the invasion process: the duration of the lag phase, the expansion phase, the plateau phase, and the rate of the expansion phase. The questions are designed to better understand variation in these components.
Herbarium Records
Herbaria are common across many regions globally. In North America and Europe, they can be found in virtually every university, in natural history museums, and as part of environmental government organizations. Herbarium records of nonnative invasive plants have been collected at least as far back as the 18th century (Table 1). Consequently, these records are the sensible starting point for invasion curves, which require reliable information on the likely location of original introduction or naturalization. Furthermore, availability of multiple specimens and of digital information from virtual herbaria may provide clues about a species’ potential to spread, including its preferred habitat. The problem is that specific information on the likelihood that any given nonnative species may become invasive in a certain location or under a set of environmental conditions is not available. This is because, at least in part, detailed historical plant censuses rarely exist, particularly comprehensive censuses for a given species or region. Furthermore, studies (which are mostly available from Europe and North America) have relied heavily on herbarium records to analyze the dynamics of plant invasions and build invasion curves at various geographic scales (Table 1). Inevitably, the scale of the analysis will depend on the range of the species under consideration. This can pose problems related to herbarium data, which are collected nonuniformly and with different efforts and agendas. Nevertheless, there are clear advantages to using herbarium records to develop invasion curves. Herbarium specimens are generally well preserved and typically include detailed information, including where and when each specimen was collected and its habitat type. However, researchers need to be mindful of the temporal and spatial biases associated with using herbarium records (Rich and Woodruff Reference Rich and Woodruff1992). It is thus important to determine common biases and how they can be minimized to develop standard invasion curves.
One of the most frequently noted limitations that may lead to bias when building invasion curves is variable collection intensities over time. Pyšek (Reference Pyšek1991) explains that the knowledge of a species’ distribution is strongly influenced by the intensity of floristic research in a given area, and the reported abundance reflects the surveying intensity as well. This can depend strongly on the presence or absence of a few driven individual collectors and the floristic interests of those collectors; herbarium collections are rarely systematic in approach. Similarly, such biases will greatly influence the perceived abundance of the target species within the region of interest. This is perhaps the greatest reason for concern about the use of herbarium records for invasion curves. However, at this time, these records are likely the best information available, although it is not clear whether they are sufficient for the larger goal of creating standardized invasion curves that can be used collectively to understand the invasion process. We note that there is an opportunity here for herbarium networks to come together to discuss these limitations and develop network projects capable of producing the necessary data for the construction of standardized invasion curves.
Studies have found that certain groups of species, including nonnative species, are recorded less consistently than native species (Cousens and Mortimer Reference Cousens and Mortimer1995; Delisle et al. Reference Delisle, Lavoie, Jean and Lachance2003; Huebner Reference Huebner2003; Rich and Smith Reference Rich and Smith1996; Rich and Woodruff Reference Rich and Woodruff1992; Urmi and Schnyder Reference Urmi and Schnyder2000), andcertain areas are surveyed more frequently than others (e.g., near urban areas and accessible roadsides) (Huebner Reference Huebner2003). Conversely, it is likely that species adapted to unusual habitats such as alvars, which are characterized by rare plants or by showy species, may be overrepresented. Bias may also exist toward species that are easy to press and mount whereas those with large characteristics [e.g., common reed [Phragmites australis (Cav.) Trin. ex Steud.]) or that can cause health problems (e.g., giant hogweed [Heracleum mantegazzianum Sommier & Levier]) might be underrepresented in herbarium collections. These issues are necessarily related to the manner in which collections proceed in herbaria. Inevitably, they will differ greatly depending on the herbarium curator and the interests of contributing collectors.
In many cases there is a difference between the recorded and actual time of naturalization for nonnative species in herbarium records. The recorded time since naturalization is typically an underestimate; that is, the plant became naturalized earlier than estimated from herbarium data. This is simply because it is unlikely that a nonnative species will be found and collected very soon after arrival, although this will again depend on the strength of the herbarium collection program. Also, in some cases, estimates of time since naturalization may rely on a false record that overestimates the time since naturalization occurred; however, such errors can be investigated by examining the specific record. Consequently, studies estimating the time to naturalization for a given species are actually estimating time to recorded naturalization. Researchers need to be aware of this subtle difference when drawing conclusions or thinking about using multiple invasion curves to generalize about the invasion process. The way forward would be to undertake annual, or at least regularly scheduled, collection campaigns by herbaria aimed at collecting species across representative habitats, as this would minimize the difference between actual and recorded naturalization time, thereby contributing to standard invasion curves.
Despite these issues, herbarium records provide some of the most comprehensive plant distribution information available and therefore continue to be critical information sources for constructing invasion curves (Huebner Reference Huebner2003). Building on this premise, it becomes important to identify ways to minimize bias and strengthen our ability to make comparisons between invasion curves across studies. The following sections outline key issues and provide clear recommendations regarding best practices.
Ensure That Herbarium Records Are Valid for the Species of Interest
There may be cases in which the uncertainties associated with herbarium data are simply too great to conduct a meaningful species-level study to construct an invasive curve. A number of suggestions have been put forward concerning when it is appropriate to use herbarium records in vegetation studies in general (Pyšek Reference Pyšek1991). Several of these suggestions are of particular relevance when the goal is to use herbarium data to produce an invasion curve. First, and perhaps most importantly, there must be clear evidence of sufficiently and uniformly intense floristic research within the area of interest and over the relevant time span. For invasive species, this typically means data spanning many decades, often more than a century (see Table 1). Second, the species of interest should be conspicuous, so that sampling by those contributing to herbarium records is likely to have occurred shortly after its arrival. As such, the main prerequisite before undertaking the construction of an invasion curve from herbarium data should be to identify whether sufficient and uniform intensity of floristic research within an area has occurred. Herbarium records will not accurately represent a target species’ spatial distribution or change in abundance if this condition is not met.
Sampling Bias and Spatiotemporal Scale
It is important to verify the accuracy of herbarium or other historic data to identify any issues such as field identification errors and inaccurate dates or locations (Barney Reference Barney2006) and confirm the origin and taxonomic status of each specimen (e.g., Caley et al. Reference Caley, Groves and Barker2008; Weber Reference Weber1998). We recommend using criteria established by FAO (2006) for this purpose. Field identification errors are of particular concern in establishing when the species of interest arrived; consequently, all invasion curves built from herbarium data should double-check the earliest samples to ensure taxonomic accuracy. Researchers should also take steps to ensure that redundant specimens from the same locale/community are only counted once (Lambrinos Reference Lambrinos2001; Weber Reference Weber1998); we suggest adopting a rule that within-season replicate samples for a species be spatially separated by a minimum standard difference (e.g., 10 km), as we consider some baseline is necessary. Some researchers have taken steps to reduce the variation in collection frequency per location by including only the first collection per political unit at the finest possible resolution in the data set (i.e., county for the United States or regional municipality for Canada; Barney Reference Barney2006), or by excluding areas that had been less intensively surveyed (Wilson et al. Reference Wilson, Richardson, Rouget, Procheş, Amis, Henderson and Thuiller2007). Of course, excluding poorly surveyed areas may reduce some bias, but it also leads to valid questions regarding the accuracy of the resulting invasion curve. Ensuring that redundant specimens are excluded and collection frequency is adequate and balanced across the area under consideration is essential to characterize spatiotemporal patterns of population dynamics and to enable comparisons across invasion curves.
We recognize that most herbarium data are quantified mainly in terms of “county” or “municipal region,” and older records do not contain geographic coordinates that can easily be placed within map grids. This represents a major challenge. With the widespread use of global positioning systems (GPS), data collected from herbarium records to build invasion curves are recorded as cumulative points on a map (e.g., Miller et al. Reference Miller, Carroll, Wilson and Shaw2009). However, they are then interpreted in different ways. In most instances, map quadrats (grids) provide insight on the distribution within the “area of occupancy” (Ciappetta et al. Reference Ciappetta, Ghiani, Gilardelli, Bonini, Citterio and Gentili2016; Gaston Reference Gaston2003). An important question is whether there is a best scale at which to construct invasive species curves suitable to serve as a management tool. Although quadrats are generally recognized as the preferred mapping method for reasons of equal-area density changes (i.e., to determine spread), the size of the grid cells researchers use has varied considerably. For instance, studies reporting data for constructing invasion curves have used grids with 100 by 100 km squares (Weber Reference Weber1998), 10 by 10 km squares (Williamson et al. Reference Williamson, Pyšek, Jarošík and Prach2005), 0.5° by 0.5° squares (Lambrinos Reference Lambrinos2001), 12 by 11 km squares (Pyšek Reference Pyšek1991), 10′ (longitude) by 6′ (latitude) squares (roughly 133.2 km2 at the latitude of the study [Williamson et al. Reference Williamson, Pyšek, Jarošík and Prach2005]), and 0.25° grid cells (approximately 630 to 710 km2 [Wilson et al. Reference Wilson, Richardson, Rouget, Procheş, Amis, Henderson and Thuiller2007]).
Researchers are often limited in their choice of grid-square size, as it depends on the data set available. For instance, the three main surveys that have been conducted in Britain and Ireland recorded the presence of species in hectads, the 10 by 10 km quadrats of the British and Irish transverse Mercator grids (Williamson et al. Reference Williamson, Pyšek, Jarošík and Prach2005). SAPIA, a South African database, presents its records at a resolution of a quarter degree (Wilson et al. Reference Wilson, Richardson, Rouget, Procheş, Amis, Henderson and Thuiller2007). Different spatial scales may explain differing results between studies (Powell et al. Reference Powell, Chase and Knight2013), and greater insights can be drawn when analyzing data on a finer scale (Wiens Reference Wiens1989). For instance, Foxcroft et al. (Reference Foxcroft, Richardson, Rouget and MacFadyen2009) found Kruger National Park in South Africa to be highly invaded when assessed at a quaternary-watershed level, but the 0.1 by 0.1 km scale revealed finer details, including more significant associations, such as that between the invader, largeleaf lantana [Lantana camara L.], and rivers. These associations may have important management implications but are lost at coarser scales. Spatial scale also influences estimates of the timing and duration of the different phases of population growth (lag, exponential, and asymptote). Coarser scales tend to overestimate both the area occupied and the rate of spread (Pyšek and Hulme Reference Pyšek and Hulme2005). These authors went a step further, recommending that data be collected at more than one scale, arguing that a hierarchical approach will improve predictions and better integrate landscape attributes into invasion dynamics. Inevitably, choices concerning scale are often made based on data limitations; we suggest that to properly develop standardized invasion curves for larger comparisons, using a single scale would be most appropriate. Any proposed scale will most likely require further exploration and debate; admittedly, this issue must be taken into consideration, given the low likelihood of greatly expanding herbarium specimen-collection programs.
There is no doubt that constructing invasion curves based on spatial analyses at the finest possible resolution leaves greater opportunities for future applications. This would allow scaling up (Pyšek and Hulme Reference Pyšek and Hulme2005), which may be useful when comparing the findings with other data collected at a coarser scale (Foxcroft et al. Reference Foxcroft, Richardson, Rouget and MacFadyen2009). However, based on the studies cited earlier (see also Table 1) and the present capacity of herbarium collection campaigns to include GPS data, we consider quadrats of 10 by 10 km assessed annually for presence/absence to be a good compromise to report abundance in standard invasive species curves. Based on the herbarium data available, we believe that this scale maximizes the chances of consistency across many different invasion curves. A 10 by 10 km area is large enough to adequately be used to inform general policy but manageable in terms of planning invasive species management activities. We further consider that this scale is reasonable to pursue, given what we believe is the low likelihood that there will be considerable improvement in the resources allocated to maintaining or expanding efforts related to herbarium specimen collection.
It is important that researchers weight their data to reduce biases stemming from inconsistent collection intensities. In the past, researchers have approached this in a variety of ways. For example, some have compared trends in spatial expansion and abundance between native and nonnative species (Delisle et al. Reference Delisle, Lavoie, Jean and Lachance2003; Stadler et al. Reference Stadler, Mungai and Brandl1998), with the expectation that native species will act as a relevant baseline. This can be effective but will not produce standardized invasion curves that can be used to address the questions outlined in Table 2. In an attempt to enable comparisons of invasion curves among different countries, some researchers have standardized data by accounting for differences in the intensity of floristic research in each country, which was estimated based on the total number of herbarium specimens per country (Mihulka and Pyšek Reference Mihulka and Pyšek2001). Hedenäs et al. (Reference Hedenäs, Bisang, Tehler, Hamnede, Jaederfelt and Odelvik2002) randomly selected specimens in a herbarium and evaluated how the collecting frequency of a species changed in relation to the number of random samples collected during a particular time period for a given region. This approach is useful for documenting species decline, but it may be inappropriate for constructing invasion curves, because it does not address the spatial aspect of the data, which is necessary for standardizing species abundance across invasion curves (Delisle et al. Reference Delisle, Lavoie, Jean and Lachance2003).
Delisle et al. (Reference Delisle, Lavoie, Jean and Lachance2003) developed “proportion curves” to address inconsistent collection intensities in herbarium data. These proportion curves are created by comparing the recorded distribution of nonnative and native (but see Shih and Finkelstein Reference Shih and Finkelstein2008), nonexpanding, species over time, with the expectation that records of natives and nonnatives will be equally impacted by variable collection intensity. Proportion curves may serve as an improvement on other herbarium-based invasion curves, for which it is impossible to know whether the observed rapid expansion of a focal species is the result of actual rapid spread versus changes in the activities and interests of botanists in the area during that time (Delisle et al. Reference Delisle, Lavoie, Jean and Lachance2003; Pyšek and Prach Reference Pyšek and Prach1993). Proportion curves, however, may be susceptible to other problems; for example, their production assumes that the native species used as a baseline shares initial abundance and distribution with the nonnative under consideration—it is unlikely that inconsistent collection intensities impact the collections of species with different background abundances and distributions equally. Another possible drawback is the expectation that when the nonnative under study is expanding in range, this approach assumes that the inconsistent sampling relevant to the baseline native species is consistent across the expanding range of the nonnative. It might be possible to address this by using several baseline native species across the expanding range of the focal nonnative species and spanning the range considered by multiple herbaria. However, the more expansive such an approach is, the more opportunity there is for bias and the less appealing the approach is likely to be to a large number of researchers. Additionally, if nonnative species are of greater interest to collectors, as we discussed earlier, this bias in sampling effort can lead to proportion curves overestimating the frequency of nonnatives relative to reference species.
Regardless of their drawbacks, proportion curves should be seen as an improvement to the methods generally used in developing invasion curves. The problems related to both approaches are inevitably derived from the limitations of herbarium data. Additionally, because the rates of expansion of focal nonnative species in proportion curves are relative to baseline native species for a given herbarium data set, they cannot be compared with other proportion curves without some knowledge of absolute, not relative, rates of expansion. Future work is needed to explore whether the proportion method can in some way be standardized across different species spanning different herbarium collections and to determine whether proportion curves can accurately recreate the sigmoidal pattern of species invasion. One possible method to standardize proportion curves would be to ground truth the relevant time frames using punctuated periods of highly intense sampling. Additional improvements may include ensuring that baseline native species used in this process are of equivalent growth form and visibilities, perhaps a close relative. These changes can increase the likelihood that the proportion curve uses species with similar life histories and chances of being collected. Measures of species traits have been developed to understand escape from insect herbivory (e.g., Chew and Courtney Reference Chew and Courtney1991); such a system may be useful here. Classifications of plant growth form, such as the Raunkiaer system of plant life-form categories (Raunkiaer Reference Raunkiaer1934), may also prove helpful in this regard.
Supplement Herbarium Data
It is common for researchers building invasion curves to supplement herbarium data with information from local floras, where available (e.g., Lambrinos Reference Lambrinos2001; Pyšek Reference Pyšek1991; Weber Reference Weber1998; Williamson et al. Reference Williamson, Pyšek, Jarošík and Prach2005). For instance, Lambrinos (Reference Lambrinos2001) obtained additional data from census data by Costas-Lippmann (Reference Costas-Lippmann1976) and from new censuses, and Weber (Reference Weber1998) obtained additional localities from Wagenitz (Reference Wagenitz1964) and local floras. In cases in which supplementary information has been collected in a more consistent, standardized manner than typical herbarium data, it can be treated separately for other in-depth analyses, but it is unlikely it can be used in place of herbarium data to construct standard invasive curves. Pyšek (Reference Pyšek1991) determined that invasion by H. mantegazzianum first followed the courses of main rivers. This information is clearly useful in risk assessment; however, it is not immediately useful for constructing invasion curves. Supplemental data sources suffer from problems similar to those of herbarium data, unless the data have been collected systematically and consistently over space and time.
Molecular biology techniques can provide valuable data to recreate invasive species routes, and there is an extensive body of literature demonstrating this (e.g., Keller et al. Reference Keller, Gilbert, Fields and Taylor2012; Taylor and Keller Reference Taylor and Keller2007). Indeed, some researchers have used genetic analyses in conjunction with herbarium data to look for hybridization events, study evolutionary trajectories, or identify a species’ geographic origin, although not specifically to generate invasion curves. For instance, by employing DNA-based techniques to detect and identify unique genotypes, along with herbarium specimens and historical records, Novak and Mack (Reference Novak and Mack2001) were able to comprehensively reconstruct the spread of downy brome [Bromus tectorum L.] in North America. Genetic analyses have also improved our understanding of the expansion of P. australis in North America, highlighting the potential role of hybridization with native lineages (Meyerson et al. Reference Meyerson, Viola and Brown2010). In cases in which hybridization or multiple introductions of interacting genotypes contribute to invasiveness, it may be useful to take such information into consideration while collecting data to construct invasion curves. As such, the combination of standardized invasion curves and genetic data may be valuable in answering important questions; for example, together, these data can test whether lag time in the invasion process is predicted by genetic variation within a population (see Ciappetta et al. Reference Ciappetta, Ghiani, Gilardelli, Bonini, Citterio and Gentili2016; Larkin Reference Larkin2012).
Accounting for Phylogenetic Relatedness
Hypothetically, closely related species are more likely to have similar invasive species curves compared with more distantly related species (Harvey and Pagel Reference Harvey and Pagel1991). Taking phylogenetic relatedness into account may be an important element in the comparative analysis of standardized invasion curves, and this can be accomplished by generating a phylogenetic tree or using an existing one (e.g., Durka and Michalski Reference Durka and Michalski2012). A phylogenetic distance matrix can be constructed to account for phylogenetic relatedness in statistical models comparing metrics associated with the different elements of invasion curves for multiple species. Bayesian approaches are also available that could be used to explore trait and phylogenetic associations with different phases of invasion curves (e.g., Pagel and Meade Reference Pagel and Meade2004). These approaches can be invaluable in addressing questions outlined in Table 2.
Concluding Remarks
In summary, while we recognize that context dependency may limit our ability to predict the population dynamics of introduced species, our current approaches to understanding invasive plant population dynamics is inadequate for making meaningful predictions. More specifically, we have a limited understanding of what typical lag times are for species that eventually become invasive, and we have limited understanding of the typical rates of expansion that these species experience once the lag time ends (see Aikio et al. Reference Aikio, Duncan and Hulme2010; Larkin Reference Larkin2012). These are critical pieces of our understanding of the invasion process that are lacking, which may be addressed through a coordinated approach toward the creation of standardized invasion curves. Without these invasion curves, and the standardized data collection that is needed for their creation, we will remain limited in our ability to detect invasions early and will consequently be less prepared to implement rapid responses. This leaves us with the status quo, wherein invasions are generally recognized only when a species has spread and become problematic, at which point we have missed the window for the most effective and cost-efficient management.
The ability to compare between different invasion curves requires consistency in data collection, treatment, and analysis. Clearly, herbarium data are being collected with decreasing vigor as funding becomes increasingly limited. However, the need for standardized invasion curves may constitute a strong motivation for the reinvigoration of herbaria, calling for increased funding and a more directed mandate to collect data in a way that meets traditional herbarium goals but also serves the more focused purpose of accumulating data for constructing these curves. Even though it could be argued that a number of invasive species reporting apps for smartphones have recently been developed (e.g., EDDMapS [http://www.eddmaps.org]), they may not ensure the required level of consistency/quality in data collection, nor do they lead to voucher specimens that are needed for scrutinizing taxonomic accuracy. Furthermore, comparing the invasion dynamics of the same species in different environments (Rodgers et al. Reference Rodgers, Stinson and Finzi2009) or of different species in the same environment (e.g., Klironomos Reference Klironomos2002; Miller et al. Reference Miller, Carroll, Wilson and Shaw2009) allows for substantially more insight into the factors influencing invasion success. Comparability relies on the previously discussed recommendations (i.e., most importantly, undertaking annual collection campaigns by herbaria aimed at collecting systematically across 10 by 10 km grids). Thus, adhering to a set of accepted standards will improve comparability between studies.
In this paper, we have begun the process of developing standards by identifying best practices for working with existing (herbarium) data and by recommending parameters for the use of supplementary information in future studies. As our knowledge increases, we can strengthen our capacity to make informed predictions about the likelihood of particular species becoming invasive and the timelines on which they will become so. Should an invasion be detected, managers would be better positioned to take advantage of lag times, which are recognized as critical moments for effective and cost-efficient management interventions.
Future work should continue to refine these recommendations and explore additional ways to standardize invasion curves. Researchers will certainly continue to investigate particular species in ways that are specific to their goals. We hope, however, that they will also consider producing standardized invasion curves that can serve the broader goals that can be achieved through comparative work (Table 2).
Acknowledgments
PMA is supported by a Canada Research Chair in Invasive Species Biology and both authors are supported Discovery Grants from the Natural Sciences and Engineering Research Council of Canada (NSERC).



