


Authoritarianism plays a central role in American politics (Stenner, Reference Stenner2005). The difference between Americans who have high and low levels of authoritarianism, or as Hetherington and Weiler put it, between people with “fixed” and “fluid” value preferences, has become a central divide in politics (Hetherington and Weiler, Reference Hetherington and Weiler2018). It serves as an organizing principle between the political parties and directly shapes Americans' views on issues including immigration, crime, gay marriage, and democracy itself (Brandt and Reyna, Reference Brandt and Reyna2014; Johnston and Wronski, Reference Johnston and Wronski2015; Cohen and Smith, Reference Cohen and Smith2016; Dunwoody and McFarland, Reference Dunwoody and McFarland2018; Hetherington and Weiler, Reference Hetherington and Weiler2018; Vasilopoulos and Lachat, Reference Vasilopoulos and Lachat2018). This effect has a long history, and the strategic choices made by politicians have heightened authoritarianism's role since the 1950s (Cizmar et al., Reference Cizmar, Layman, McTague, Pearson-Merkowitz and Spivey2014). Because of the important role of authoritarianism in our understanding of political behaviors and attitudes, it is vital to understand how the dominant measurement scheme for authoritarianism performs (Engelhardt et al., Reference Engelhardt, Feldman and Hetherington2021). This scheme, relying on preferences for desirable qualities in children, is a reliable, valid, and consistent measure of the underlying value predisposition of authoritarianism.
In this paper, we explore one aspect of this measurement approach. The standard approach, included in the American National Election Study since 1992, asks respondents a series of paired choices about the desirable qualities that it is more important for a child to have. This question-wording, which uses the word “child,” is intentionally gender-neutral. How the respondent perceives the question may not be. The surveyor may ask about a child, but the respondents themselves may answer the question thinking specifically about a boy or a girl. The gendered norms about the pairs of traits used in the authoritarianism scale may induce extraneous variance in the measure, potentially making the measure at least partially about the gendered image of the word “child” to the respondent. The respondents' views on gender may be responsible for at least some of what appears to be the effect of authoritarianism on political behaviors and attitudes.
We present data from three experiments that test how the gender identity of the child in the mind of the respondent influences the measurement properties of the authoritarianism scale. By measurement properties, we mean both the simple means of the itemsFootnote 1 and the parameters from an item response theory (IRT) model of the child-rearing items. When respondents are asked to think of a boy or a girl instead of the gender-neutral term “child,” the measurement properties of the responses change. Respondents who are asked to think about a girl exhibit substantially lower scores on the authoritarianism measure. The results, consistent across the three experiments, indicate that respondents who impute a gender on the hypothetical child in the survey question interpret the questions differently, resulting in differences in the means and measurement properties but not the correlates of the authoritarianism scale. We also include an additional survey asking respondents if they were thinking about a boy, a girl, or neither after the authoritarianism items. This allows us to explore the prevalence of each interpretation of the items and the correlates of how respondents think about those questions.
This paper proceeds as follows. In the next section, we discuss the standard measure of authoritarianism and how the question-wording when asking about a child may paper over differences in respondents based on the gender of the child the respondent has in mind. We emphasize how the choice of items in the authoritarianism scale may be connected to gendered expectations of children. We then present the data from three experiments where we randomly assigned the respondents to one of three conditions that centered on the authoritarianism scale. In the “control” condition, respondents received the standard questions asking about a child. In the second and third conditions, we replaced “child” with “boy” and “girl,” respectively. The next section presents three sets of results. We compare the means of the items and the overall authoritarianism scale across the conditions. The second set of results explores how the changes in question-wording alter the measurement properties of the authoritarianism scale. We then test how modifying the questions changes how authoritarianism correlates with other variables. The next section presents the fourth study and examines which respondents report thinking of a girl or a boy. Finally, we conclude with a discussion of what these results mean for the measurement of authoritarianism.
1. Measuring authoritarianism
Authoritarianism is generally conceived of as a value predisposition that captures how much one prefers social cohesion and conformity over personal freedom and autonomy (Feldman and Stenner, Reference Feldman and Stenner1997; Stenner, Reference Stenner2005). In many countries, particularly the USA, the gap between those whose value predispositions have high and low levels of authoritarianism defines the differences between identification with right- and left-wing parties. Authoritarians fear social change and perceive challenges to societal cohesion as fundamental threats to society (Feldman, Reference Feldman2003; Kehrberg, Reference Kehrberg2017). This manifests as stark divides over issues like immigration, criminal justice, race, and LGBTQ+ rights (Hetherington and Weiler, Reference Hetherington and Weiler2009; Feldman et al., Reference Feldman, Mérola, Dollman, Sajó, Uitz and Holmes2021).
There is a long intellectual history of how scholars have measured authoritarianism. The earliest attempts (Adorno's F-Scale and Altemeyer's Right-Wing Authoritarianism scale) have been roundly criticized for conflating authoritarianism with right-wing politics. Political scientists have, for the most part, coalesced around the items that have been included in the American National Election Studies (ANES) since 1992. These items ask respondents to choose between two different desirable qualities in children. A large literature shows that the responses to these items correlate with a wide range of political attitudes and behaviors. This measurement approach has become the industry standard for over a decade, but its measurement properties have not received the type of scrutiny that it deserves until quite recently.
One of the main concerns with the child-rearing items is what is known as measurement invariance—whether the items in the scale measure the same concept in the same way for all respondents (Mellenbergh, Reference Mellenbergh1989; Guenole and Brown, Reference Guenole and Brown2014). There is a growing body of research that suggests some issues with the child-rearing questions. Pérez and Hetherington (Reference Pérez and Hetherington2014) demonstrate that the measure is not invariant to the race of the respondent—African Americans and Whites construct their answers to the items differently and, as a result, the scale correlates with important political variables differently based on the race of the respondent. Luttig (Reference Luttig2021) argues that the measures are more the effect than the cause of political attitudes (though see Engelhardt et al., Reference Engelhardt, Feldman and Hetherington2021 for contrary evidence). Pietryka and MacIntosh (Reference Pietryka and MacIntosh2022) include the authoritarianism scale in their examination of a wide range of measures regularly included in the ANES. They find that the measure does not have measurement invariance across a range of features of the respondents.
In response to some of these concerns, Engelhardt et al. (Reference Engelhardt, Feldman and Hetherington2021) provide a clear treatment of the use of the child-rearing items to measure authoritarianism. They demonstrate that the scale is a valid measure of authoritarianism, is exogenous to political attitudes, and exhibits high levels of stability. Moreover, they suggest that adding four additional items to the scale substantially improves the performance of the measure, suggesting that this longer set of items should become the new standard. However, the measurement faces a potential problem. The battery of items asks respondents:
Although there are a number of qualities that people think children should have, every person thinks that some are more important than others. Although you may feel that both qualities are important, please tell me which one of each pair you think is more important for a child to have (emphasis added).
This leads to the set of gender-neutral paired qualities using the words “children” and “child” instead of “boy” or “girl.” The intention is clear. The questions are not designed to cue the respondent to gender with the expectation, even if implicit, that this would insulate these items from any gender-based preferences for the specific pairs of qualities. That intention may not be met. Respondents may read this differently. Some respondents may think of a son or daughter instead of a gender-neutral child when answering.
It is important to think about what is going on in the minds of respondents when they encounter these questions. Stenner and Feldman's work developing the items demonstrates that these items, unlike previous measures of authoritarianism, are not inherently political. They do not, for instance, explicitly connect to conservative policy positions. Engelhardt et al. (Reference Engelhardt, Feldman and Hetherington2021) make it clear that these items do, at least partially, tap into the underlying construct of authoritarianism. The emphasis in the literature, rightfully responding to the limitations of previous attempts to measure authoritarianism, is on illustrating what is not included in the items; these items are not explicitly tapping political attitudes.
Respondents are likely thinking about other considerations when answering these questions, however. The process of survey response has four major components: (1) comprehension of the question, (2) retrieval of considerations from memory, (3) use of those considerations to make judgments, and (4) selection of an answer (Tourangeau et al., Reference Tourangeau, Rips and Rasinski2000). That first step, the construction of the meaning of the question, is our focus. When asked these questions, respondents are asked to think about a child in the abstract. It seems plausible that not all respondents will have the same image of the child. The word “child” may, for instance, conjure an image of a three-year-old for one respondent and a nine-year-old for another. More important for our purposes, respondents may differ in the gender of the child they imagine the question is asking about. Some may think of a boy, while others think of a girl.
This would not be problematic if there were no differences in the preferences for the qualities of children based on the gender of the child. If respondents felt that the relative balance between a child being obedient and self-reliant was the same for boys and girls, then some respondents thinking about a boy while some think about a girl should not affect either the distribution of responses to the items or how the individual items map onto and construct the underlying measure of authoritarianism.
This seems unlikely. While some may not see these traits as gendered, there is a sizable literature documenting that most people do hold prescriptive gender stereotypes about children (Martin, Reference Martin1990; Fiske and Stevens, Reference Fiske and Stevens1993; Koenig Reference Koenig2018). These stereotypes (beliefs about what boys and girls should do) are what the authoritarianism items measure. Often the measures of these gender stereotypes will ask about the desirability of individual qualities instead of the paired choice between two, but the implied ranking from those measures should mimic the forced choice of the authoritarianism items. The prescribed gender differences in the value of the qualities connect to the items that are used in the traditional measure and the eight-item scale developed by Engelhardt et al. (Reference Engelhardt, Feldman and Hetherington2021). These prescriptive stereotypes hold that girls should be more communal, eager to please, well-mannered, and respectful (Martin, Reference Martin1990, Reference Martin1995; Koenig Reference Koenig2018). Boys, in contrast, should be more independent and agentic (Martin, Reference Martin1990, Reference Martin1995; Koenig Reference Koenig2018). These stereotypes map clearly onto the pairs of qualities included in the authoritarianism scale. If a respondent holds these prescriptive stereotypes and is then asked about the desirable qualities of a girl, they should be more likely to choose the answer that corresponds with higher levels of authoritarianism than if they are asked about a boy (hypothesis 1).
A second possibility is that the respondents may react to these same gendered stereotypes about child-rearing differently depending on their acceptance and rejection of those norms. For some respondents, the question asking them to choose between these traits in children may trigger a more negative reaction to the gendered stereotype implied in the question. Those respondents, then, may be unwilling to endorse the gendered, traditional stereotypes, and end up appearing to score lower on the authoritarianism measure when they are asked about a girl instead of a boy or child. We expect that the mean differences between the boy and girl treatments will be larger for female respondents than male respondents (hypothesis 2a), for respondents who have a daughter (hypothesis 2b), and for respondents who endorse sexist attitudes (hypothesis 2c). Specifically, we expect that the relationship between sexist attitudes and the measure of authoritarianism will be strongest in the “girl” condition.
The seriousness of the problem depends on more than just the mean levels of the authoritarianism items and scale. It is possible that the only difference that exists is a simple mean shift in the scale that does not alter how the authoritarianism items perform. This may not be the case, however. In addition to there being mean differences in the prescriptive stereotypes based on the gender of the child, the stereotypes are not merely mirror images of one another. Koenig (Reference Koenig2018) makes the distinction between positive prescriptive stereotypes (girls should be well-mannered) and negative prescriptive stereotypes (boys should not be emotional). Differences in these prescriptions may mean that how the specific pairs of qualities map onto the underlying authoritarianism shifts based on the gender of the hypothetical child. Returning to the Tourangeau et al. (Reference Tourangeau, Rips and Rasinski2000) model, these stereotypes may intercede between authoritarianism the latent construct, and how that construct maps onto the specific items of the scale. The result, we hypothesize, is that the measurement performance of the scale (the slope and intercept parameters for the items and the mean and variance of the latent variable estimate by an IRT model) should differ based on whether the respondent is thinking about a boy or a girl (hypothesis 3).
These differences will be more important if they change how the measure of authoritarianism correlates with other important political variables. This question is the most consequential for the broader study of authoritarianism. Much of the political science research is interested in authoritarianism because it explains important political attitudes. If there are heterogeneous effects of authoritarianism on these attitudes based on the gender of the target in the question, it implies that the effects of authoritarianism need to be empirically unpacked more. In particular, we focus on four sets of variables that either are often cited as correlated with authoritarianism or may be influenced by the gender cue in our question-wording experiment. The first set measures a person's feelings toward individuals or politically meaningful groups. These include former President Trump, President Biden, the Democratic and Republican Parties, Black Lives Matter activists, and the police. The second set of variables is a person's attitudes about three issues that are usually correlated with authoritarianism: immigration, gay rights, and criminal justice. Finally, we test if there are different relationships between authoritarianism and partisanship and ideology. If hypothesis 3 is correct and the authoritarianism scale is confounded with attitudes about sexism in the “girl” condition, then it is likely that authoritarianism's relationship with other politically meaningful concepts will be different in that condition. The exact nature of that change depends on the relationship between the nature of the sexist attitudes and the other political variables.
Overall, if the results conform to our expectations, they will raise concerns about the dominant measurement approach for the study of authoritarianism. Respondents will be processing these survey questions based on how they envision the children they are asked about. Mean differences in the levels of authoritarianism (hypothesis 1) would suggest that some of the observed differences in the levels of authoritarianism in the sample depend on who processes the question as being about a boy and who processes it as being about a girl. If the differences in the means across the conditions are driven by the gender of the respondent, if they have a daughter, or their levels of sexism, then it is possible that the measure is confounded and that some of the correlations between the authoritarianism measure and other politically meaningful concepts are partially spurious. Similarly, if the measurement properties of the authoritarianism scale vary across the conditions, then the scale is not measuring the same construct, which raises other concerns about the interpretation of the results from research relying on this scale.
The potential issues of invariance with the authoritarianism items are similar to the many differences that exist with the traditional fact-based measures of political knowledge. The gender gap in political knowledge, for instance, depends heavily on the type of factual questions asked (Barabas et al., Reference Barabas, Jerit, Pollock and Rainey2014; Dolan and Hansen, Reference Dolan and Hansen2020). Similarly, the knowledge gaps between White and minority respondents are larger or smaller based on the questions being asked (Abrajano, Reference Abrajano2015; Pérez, Reference Pérez2015; Cohen and Luttig, Reference Cohen and Luttig2020; Wolak and Juenke, Reference Wolak and Juenke2021). These differences manifest themselves in the measured levels of political knowledge across demographic groups and in how the political knowledge measure correlates with other variables. This difference has led scholars to explore the distinctive paths by which people learn different types of knowledge (Barabas et al., Reference Barabas, Jerit, Pollock and Rainey2014; Cohen and Luttig, Reference Cohen and Luttig2020). It has also led to the recognition that different measures of political knowledge will result in stronger or weaker correlations with important political phenomena (Gilens, Reference Gilens2001).
2. Data
We report the results from three survey experiments. The first survey experiment, conducted between July 23 and July 26, 2019, had 650 respondentsFootnote 2 who were recruited by Lucid. This first survey experiment was intended to pilot the design and focused on testing the measurement properties of the authoritarianism items. We replicated the experiment in our second survey, conducted between December 5 and December 12, 2019. We again had Lucid recruit our respondents and ended with a sample of 1684 respondents. These first two studies only included the traditional four items that make up the standard authoritarianism scale. After the publication of Engelhardt et al. (Reference Engelhardt, Feldman and Hetherington2021), we conducted a third study with Lucid between July 15 and July 19, 2021, that had 2446 respondents. This final survey included the full set of eight items from Engelhardt et al. (Reference Engelhardt, Feldman and Hetherington2021) and several of the dependent variables they used in their analysis.Footnote 3
Each survey had a first section that asked a series of demographic questions, including education, race, ethnicity, gender, income, age, state of residence, marital status, religion, partisanship, and ideology. In the third survey, we also included a question about whether the respondent has any children, and if so, if they are sons, daughters, or both. In the first two surveys, this section was followed by the randomly assigned experimental treatments. The second survey included two other experiments after the randomization of the authoritarianism questions that are not included in this paper.
In the third survey, the demographics section was followed by a section that included our measure of gender attitudes. We included items from both the Ambivalent Sexism Inventory and the Ambivalence Toward Men Inventory (Glick and Fiske, Reference Glick and Fiske1996, Reference Glick and Fiske1997, Reference Glick and Fiske1999). These measures reflect the understanding that people hold stereotypical attitudes about gender roles that can be hostile, focusing on the negatives of traditional gender roles, and benevolent, viewing women or men in presumably positive but still status-reinforcing ways. The hostile sexism items ask the respondent to endorse a dominant form of paternalism toward women and a competitive view of gender roles. Benevolent sexism, in contrast, endorses communal traits and subordinate roles for women. Hostile attitudes toward men endorse resentment toward men's status in society; benevolent attitudes toward men entail supporting the view of men as protectors.
In each of the surveys, we randomly assigned subjects to one of the three conditions. The first condition is the standard authoritarianism items with the cue asking about a “child.” In the first two surveys, this only included the four traditional items. The third survey included the eight items proposed by Engelhardt et al. (Reference Engelhardt, Feldman and Hetherington2021). These serve as the controls in our analyses that follow. The next two conditions replace the word “child” with either “boy” or “girl.”
The third survey included a final section with the measures that we expect to be predicted by authoritarianism. This section included feeling thermometers rating Donald Trump, Joe Biden, the Democratic Party, the Republican Party, Black Lives Matter, and police officers. We also included the same items as Engelhardt et al., capturing attitudes about immigration, gay rights, and the death penalty.
The tests of the specific models are relatively straightforward. The test of hypothesis 1 is that there are mean differences in the items, and the full scale based on the gender of the child in the question only requires a straightforward analysis of variance (ANOVA). The tests of the measurement hypothesis explore the measurement properties of the scale across the conditions. To test these, we use a series of multiple-group IRT models that allow the parameters in the IRT to vary across the experimental conditions.Footnote 4 We then explore how the treatment changes the correlates of authoritarianism through a series of regression models. In these models, the relationship between authoritarianism and the other variables varies across the treatment conditions, and we test if the coefficients are significantly different based on which prompt the respondent received.
3. Results
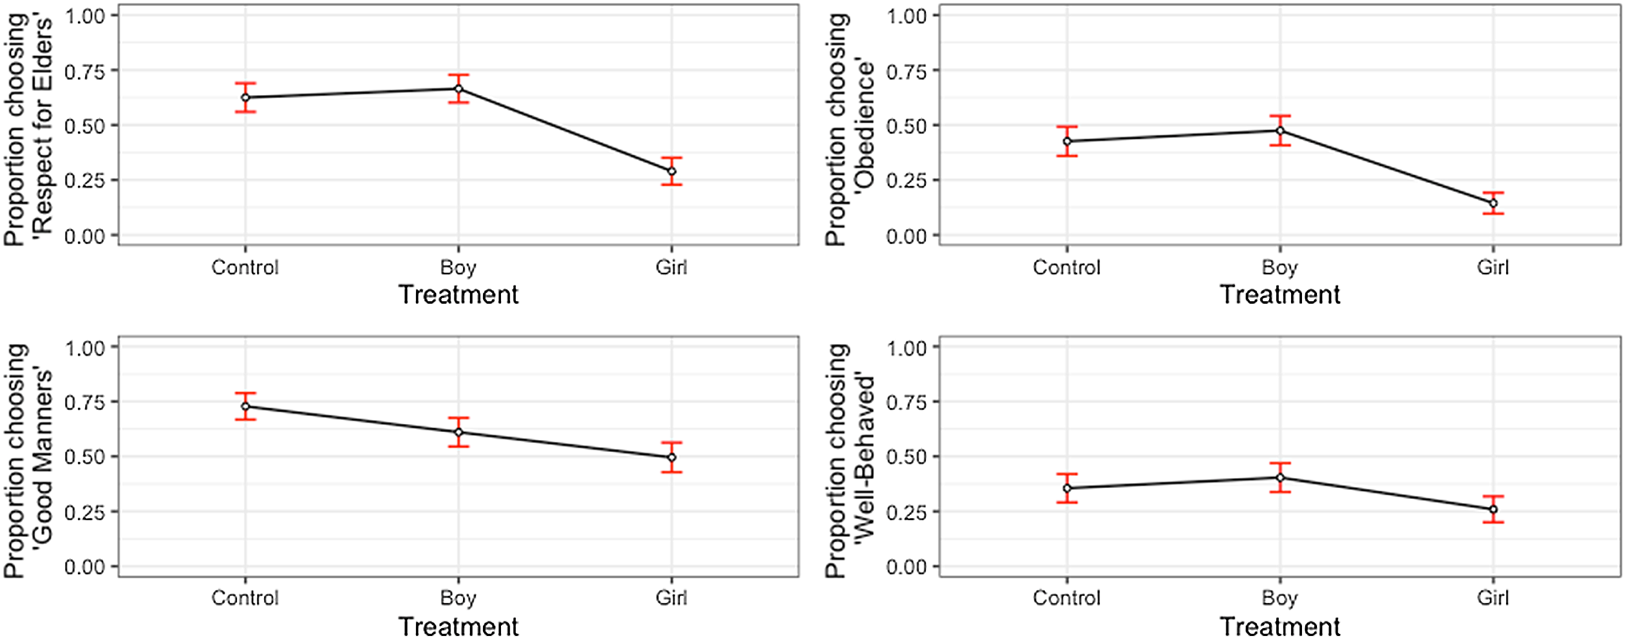
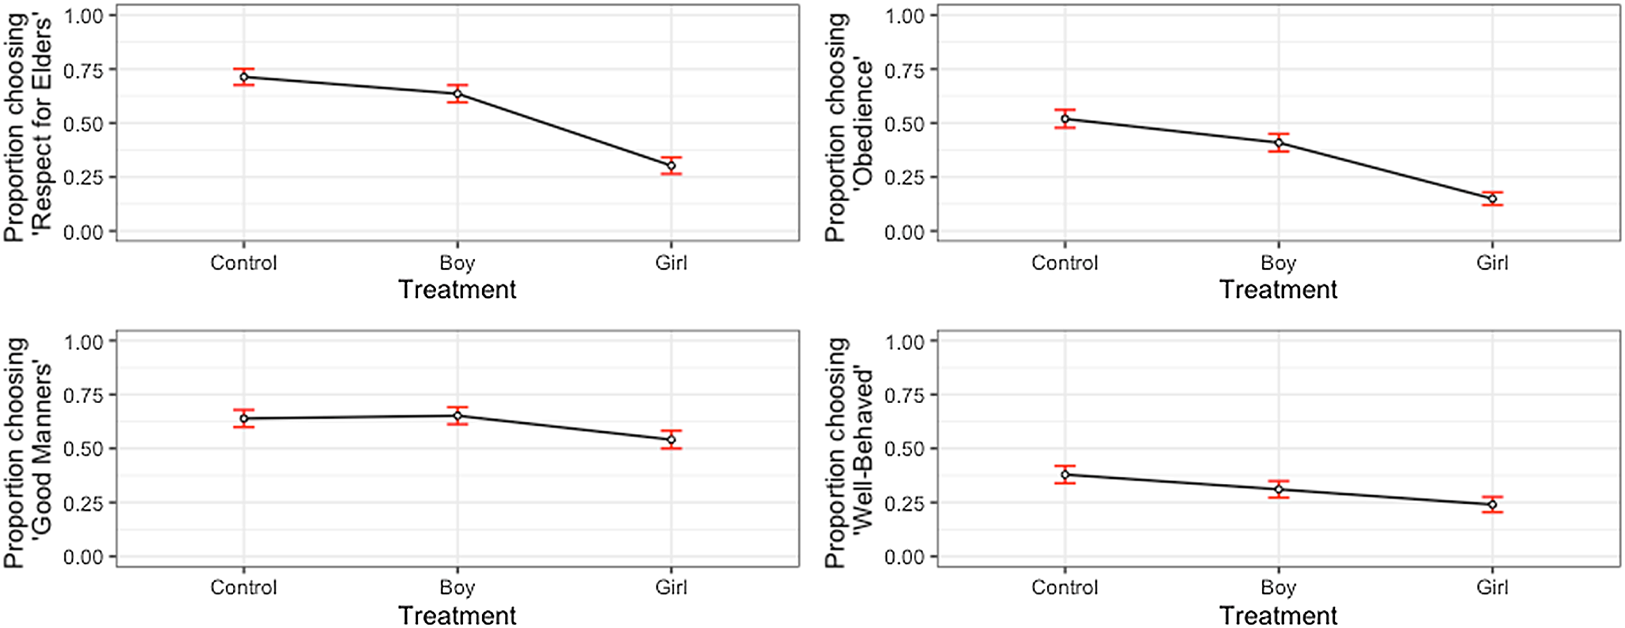
We begin our test by comparing the proportion of respondents who chose the more authoritarian child-rearing trait based on the condition they were in, comparing the “control” condition with the “boy” and “girl” conditions. As a reminder, the first two survey experiments only included the traditional four items, and only the third study included the full set of eight items suggested by Engelhardt et al. (Reference Engelhardt, Feldman and Hetherington2021). Figure 1 plots these differences for the four items from our first survey experiment, Figure 2 plots them for the second experiment, Figure 3(a) presents the four items traditionally included in the authoritarianism scale, and Figure 3(b) presents the four new items suggested by Engelhardt et al.. For each of the items, higher values on the y-axis indicate a larger proportion of the respondents chose the trait associated with higher levels of authoritarianism.
Proportion of respondents choosing the more authoritarian trait (standard items) based on the gender of the child in the question (study 1).
Note: Data from a survey conducted by the authors in 2019. The plot contains the mean and 95 percent confidence interval of the authoritarianism items for the listed conditions.
Proportion of respondents choosing the more authoritarian trait (standard items) based on the gender of the child in the question (study 2).
Note: Data from a survey conducted by the authors in 2019. The plot contains the mean and 95 percent confidence interval of the authoritarianism items for the listed conditions.
(a) Proportion of respondents choosing the more authoritarian trait (standard items) based on the gender of the child in the question (study 3). (b) Proportion of respondents choosing the more authoritarian trait (Engelhardt et al. items) based on the gender of the child in the question (study 3).
Note: Data from a survey conducted by the authors in 2021. The plot contains the mean and 95 percent confidence interval of the authoritarianism items for the listed conditions.
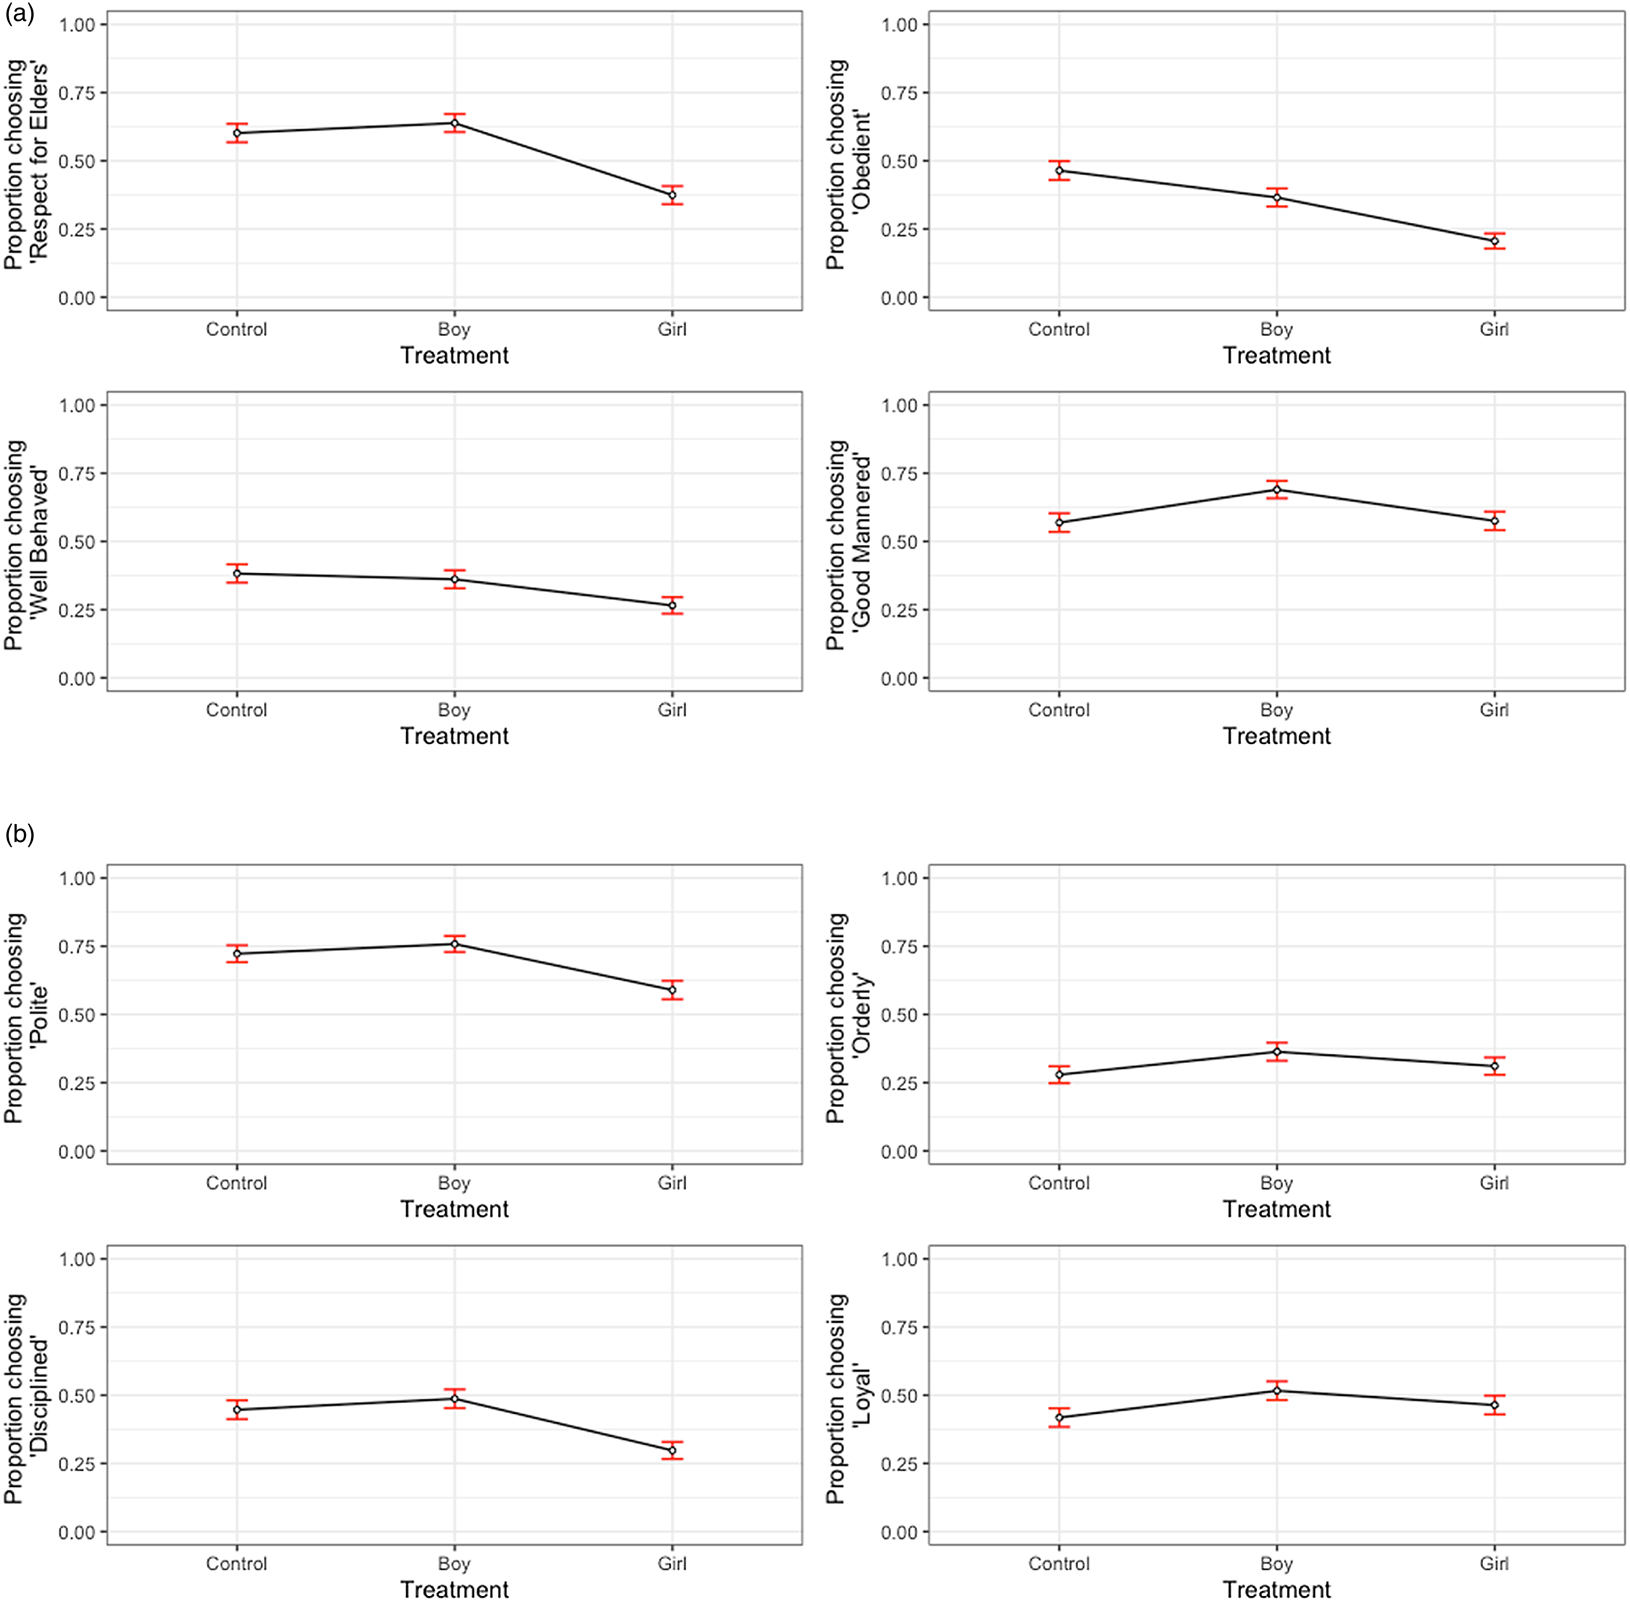
For the traditional items in Figures 1–3, ANOVAs indicate that there are significant differences across the conditions for all the items. In the first two studies, respondents in the “girl” condition were significantly less likely to give the authoritarian answer to each of the items. For the third study, the results are a little less consistent. The pattern for the “respect for elders” and “well-behaved” items is the same. The “girl” condition results in significantly lower levels of preference for the more authoritarian trait than both the “control” condition and the “boy” condition, and there is no difference between the “control” and “boy” conditions.Footnote 5 The “obedient” item is significantly different in all three conditions (control > boy > girl). The “good-mannered” item produced the highest level of authoritarianism for the “boy” condition, but the “control” and the “girl” conditions have essentially the same pattern of responses.
The new items proposed by Engelhardt et al. show a similar inconsistent set of results. The “polite” and “disciplined” items show the same pattern as two of the items in the original set: the “girl” condition has significantly lower levels of authoritarianism than either the “control” or “boy” conditions, which are indistinguishable from each other. The other two items have a different pattern. In both the “loyal” and “orderly” items, the “boy” condition produces significantly higher levels of reported authoritarianism than the “control” and “girl” conditions, but those two are not significantly different from one another.
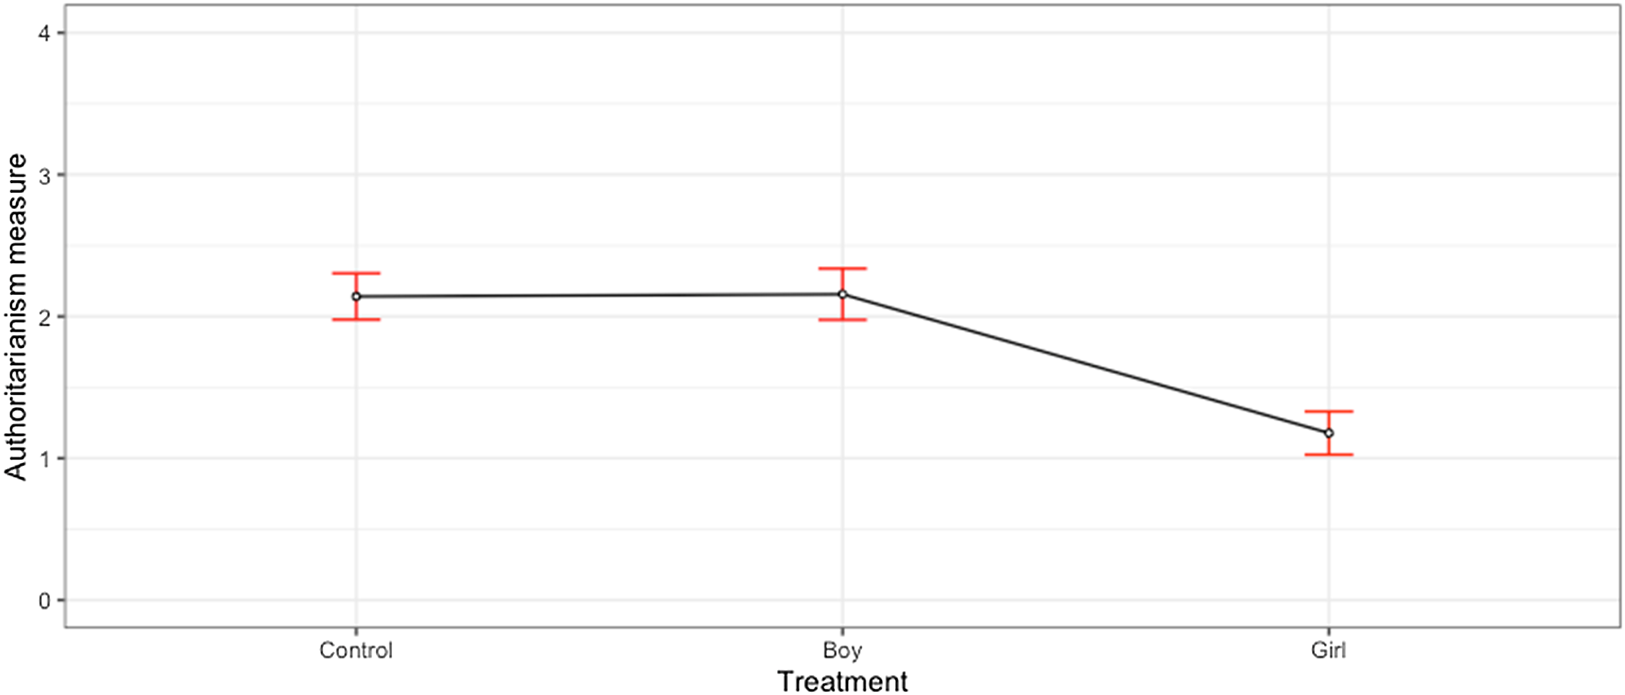
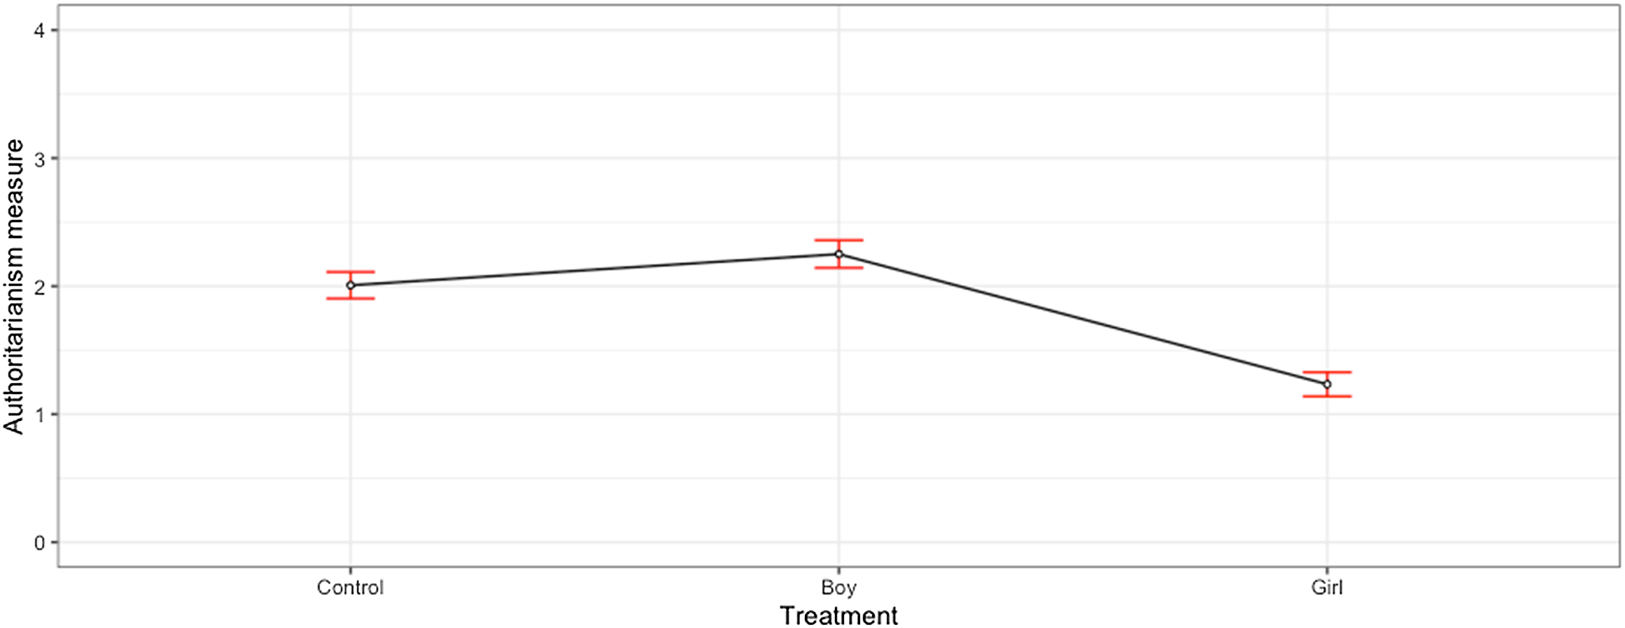
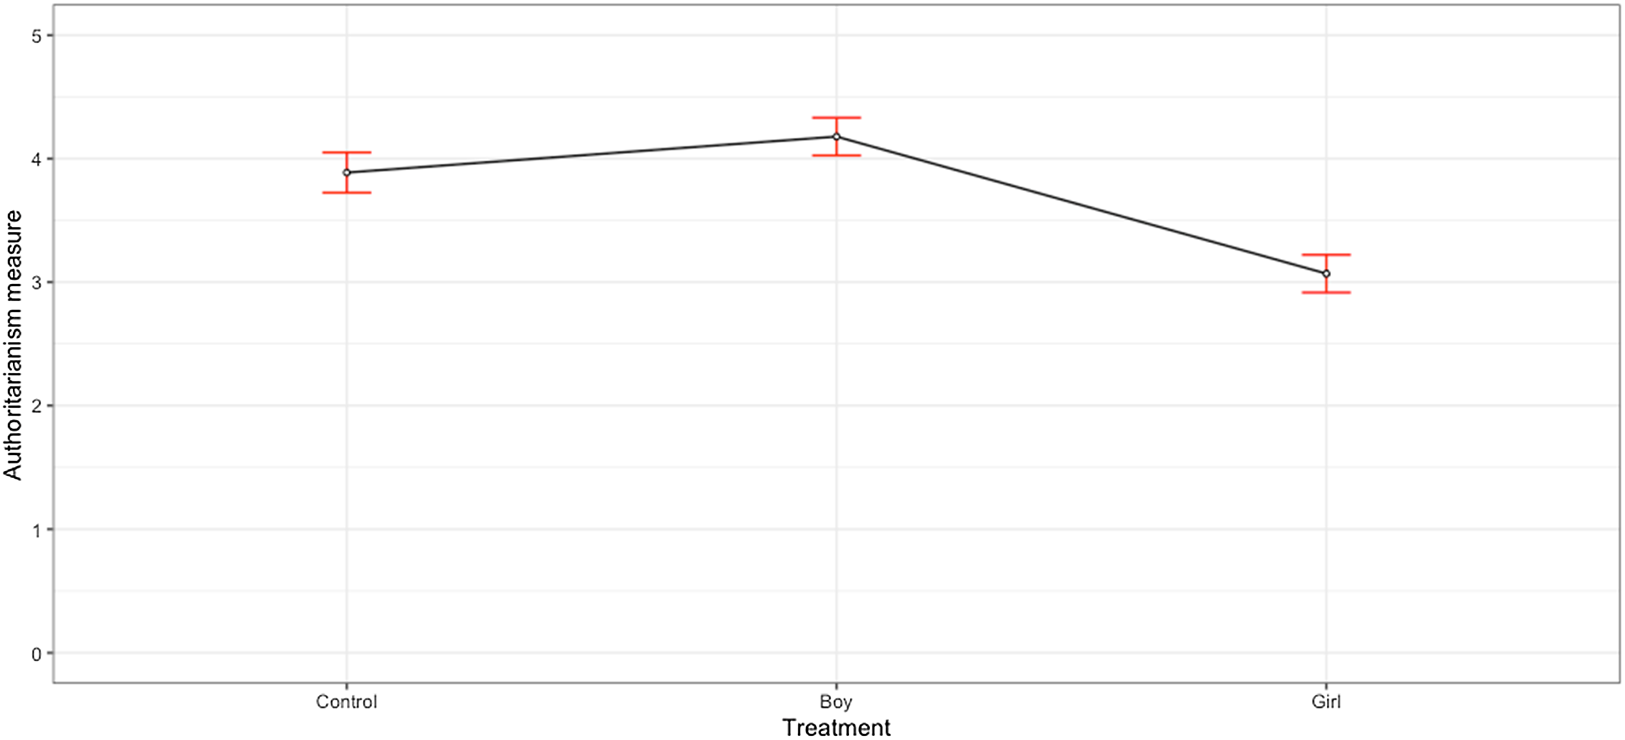
These results are largely counter to our expectations. We hypothesized, given how these traits are often gendered, that the “girl” conditions would produce higher levels of reported authoritarianism. If anything, our results show the exact opposite. The “girl” condition is consistently lower in the reported level of authoritarianism than the “boy” condition. This is illustrated clearly in Figures 4–6, which plot the differences in the mean authoritarianism measures created as an additive scale of the full set of four or eight items. In the first survey, the “girl” condition is significantly lower than the other two conditions, and the “boy” and “control” conditions are not different from one another. For the other two surveys, all three conditions are significantly different from one another, with the “control” condition between the “boy” and “girl” conditions. The differences in means are not trivial. In the first study, respondents in the “girl” condition are almost a full point (out of four) lower than the other two conditions. In the second survey, respondents in the “girl” condition are 0.85 points (out of four) lower than the “boy” condition and 0.60 points lower than the “control” condition. Finally, in the third survey, the mean in the “girl” condition is more than a full point (out of eight) lower than the “boy” condition and 0.88 points lower than the “control” condition. The mean of the “control” condition is only 0.29 points below the “boy” condition, but the difference is statistically significant.
Mean levels of authoritarianism based on the gender of the child in the question (study 1).
Note: Data from a survey conducted by the authors in 2019. The plot contains the mean and 95 percent confidence interval of the eight-item authoritarianism scale for the listed conditions.
Mean levels of authoritarianism based on the gender of the child in the question (study 2).
Note: Data from a survey conducted by the authors in 2019. The plot contains the mean and 95 percent confidence interval of the eight-item authoritarianism scale for the listed conditions.
Mean levels of authoritarianism based on the gender of the child in the question (study 3).
Note: Data from a survey conducted by the authors in 2021. The plot contains the mean and 95 percent confidence interval of the eight-item authoritarianism scale for the listed conditions.
To summarize these results, we conducted a mini meta-analysis (Goh et al. Reference Goh, Hall and Rosenthal2016). This type of internal meta-analysis of a small number of related studies can provide greater transparency are more accurate effect sizes across the studies. In particular, a mini meta-analysis combines the effect size measures to summarize the distribution of the likely magnitude of the effect from across the treatment conditions. The analyses presented above are based on a series of ANOVAs comparing across the “boy,” “girl,” and “control” conditions. The standard effect measure from this type of 3 × 1 ANOVA would be η 2, which captures the percent of the variation in the dependent variable explained by the treatment conditions.
For this type of mini meta-analysis, however, η 2 captures the differences across the three conditions and is not directional. As such, η 2 is an inappropriate effect size for the mini meta-analysis calculations (Goh et al., Reference Goh, Hall and Rosenthal2016). Instead of relying on η 2, we choose to focus on the effect size of just the “boy” versus “girl” treatment. To do this, we follow Goh et al.'s (Reference Goh, Hall and Rosenthal2016) advice of calculating Cohen's d for the differences between these two treatments and using their calculations to estimate the effect size across all three studies and calculate the z-statistic and confidence interval of the effect size.
We present the results in Table 1. In this analysis, we limited the measures to the original four items in the authoritarianism scale because the items suggested by Engelhardt et al. (Reference Engelhardt, Feldman and Hetherington2021) were not included in the first two studies. Cohen (Reference Cohen1992) provides a rough idea of the magnitude of the effect sizes based on Cohen's d. In his classification, the effect sizes for the differences between the “boy” and “girl” conditions for the good-mannered and well-behaved items are small even though they are statistically robust. In contrast, Cohen's categorization would describe the effect sizes for the obedient and respect items and full scale as medium to large effects. Overall, it is clear that the difference between the “boy” and “girl” experimental conditions produces sizable differences in the proportion of the sample who give the more authoritarian answer and changes the average level of authoritarianism.
Mini meta-analysis of studies 1–3
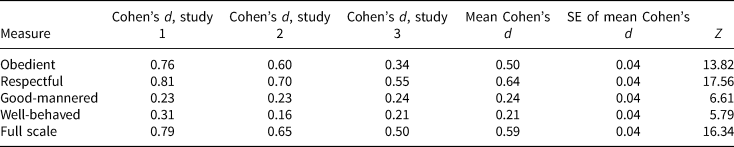
Columns 2–4 present Cohen's d.
Note: Data from three surveys conducted by the authors.
We next explore how these differences in the mean levels of the authoritarianism items vary with the lived experience of the respondents (their gender and having a daughter) and their willingness to express sexist attitudes using only data from our third study. Our expectation here is that the gender of the respondent and having a daughter might change how sensitive respondents are to the experimental treatment. In Figure 7, we recreate the results in Figure 6 but calculate the means and confidence intervals separately based on the characteristics of the respondents, with the left panel based on whether or not they have a daughter and the right based on their gender.
Mean levels of authoritarianism based on the gender of the child in the question, if the respondent has a daughter, and the respondent's sex (study 3).
Note: Data from a survey conducted by the authors in 2021. The plot contains the mean and 95 percent confidence interval of the eight-item authoritarianism scale for the listed conditions.
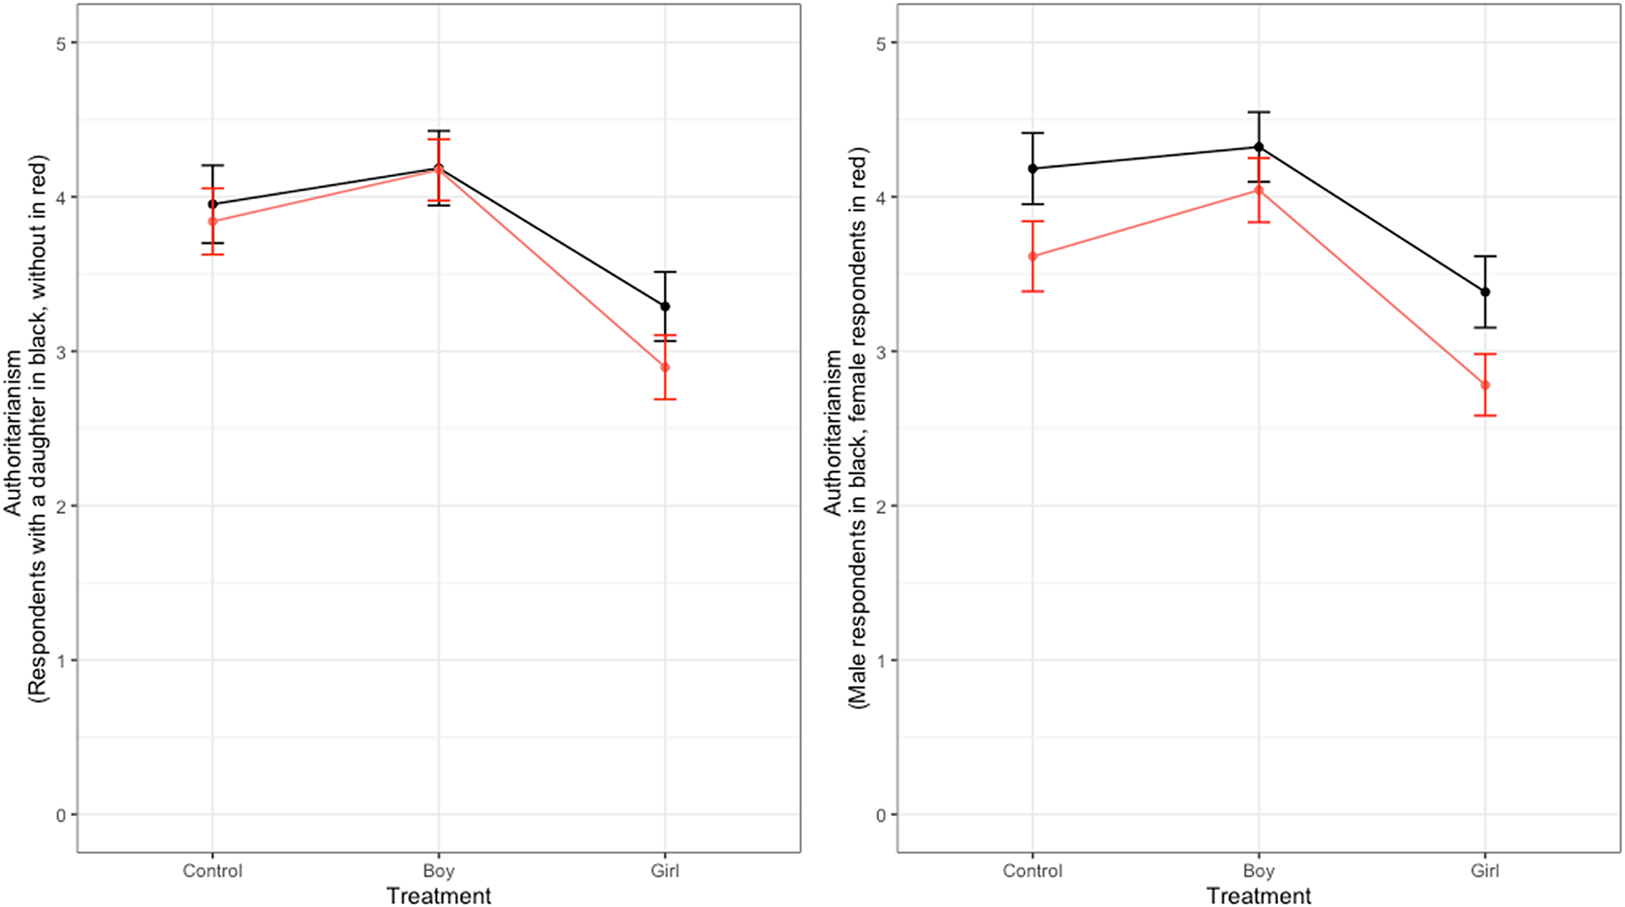
Whether or not the respondent has a daughter has no significant effect on the respondent's level of authoritarianism in any of the conditions. More importantly, the pattern across the three conditions is the same. It is not the case that respondents with a daughter responded to the cue to think about a girl differently than respondents without a daughter. The pattern is similar based on the gender of the respondent. In the right-hand panel, there are mean differences in the control conditions, with male respondents being more authoritarian. The difference based on the gender of the respondent is not significant in the “boy” condition. Even with these mean differences, the general pattern is the same across the three conditions: the “boy” condition is the highest, the “girl” is the lowest, and the control is in the middle.
Testing how the respondents' sexism intersects with our experimental treatments is a bit more complicated. As a reminder, we have four different measures of sexist attitudes based on the Ambivalent Sexism and the Ambivalence Toward Men Inventories. The regression model we run here has authoritarianism as the dependent variable and includes indicators of the “boy” and “girl” conditions, the measures of hostile sexism, hostility toward men, benevolent sexism and benevolence toward men, and interactions between the two treatment conditions and the four sexism measures. In Figure 8, we plot the regression lines and confidence intervals for the relationship between the sexism measures and the authoritarianism items.
Regression coefficients for sexism and authoritarianism based on the gender of the child in the question (study 3).
Note: Data from a survey conducted by the authors in 2021. The plot contains the regression line and 95 percent confidence interval from a regression of the sexism attitude on the eight-item authoritarianism scale for the listed conditions.
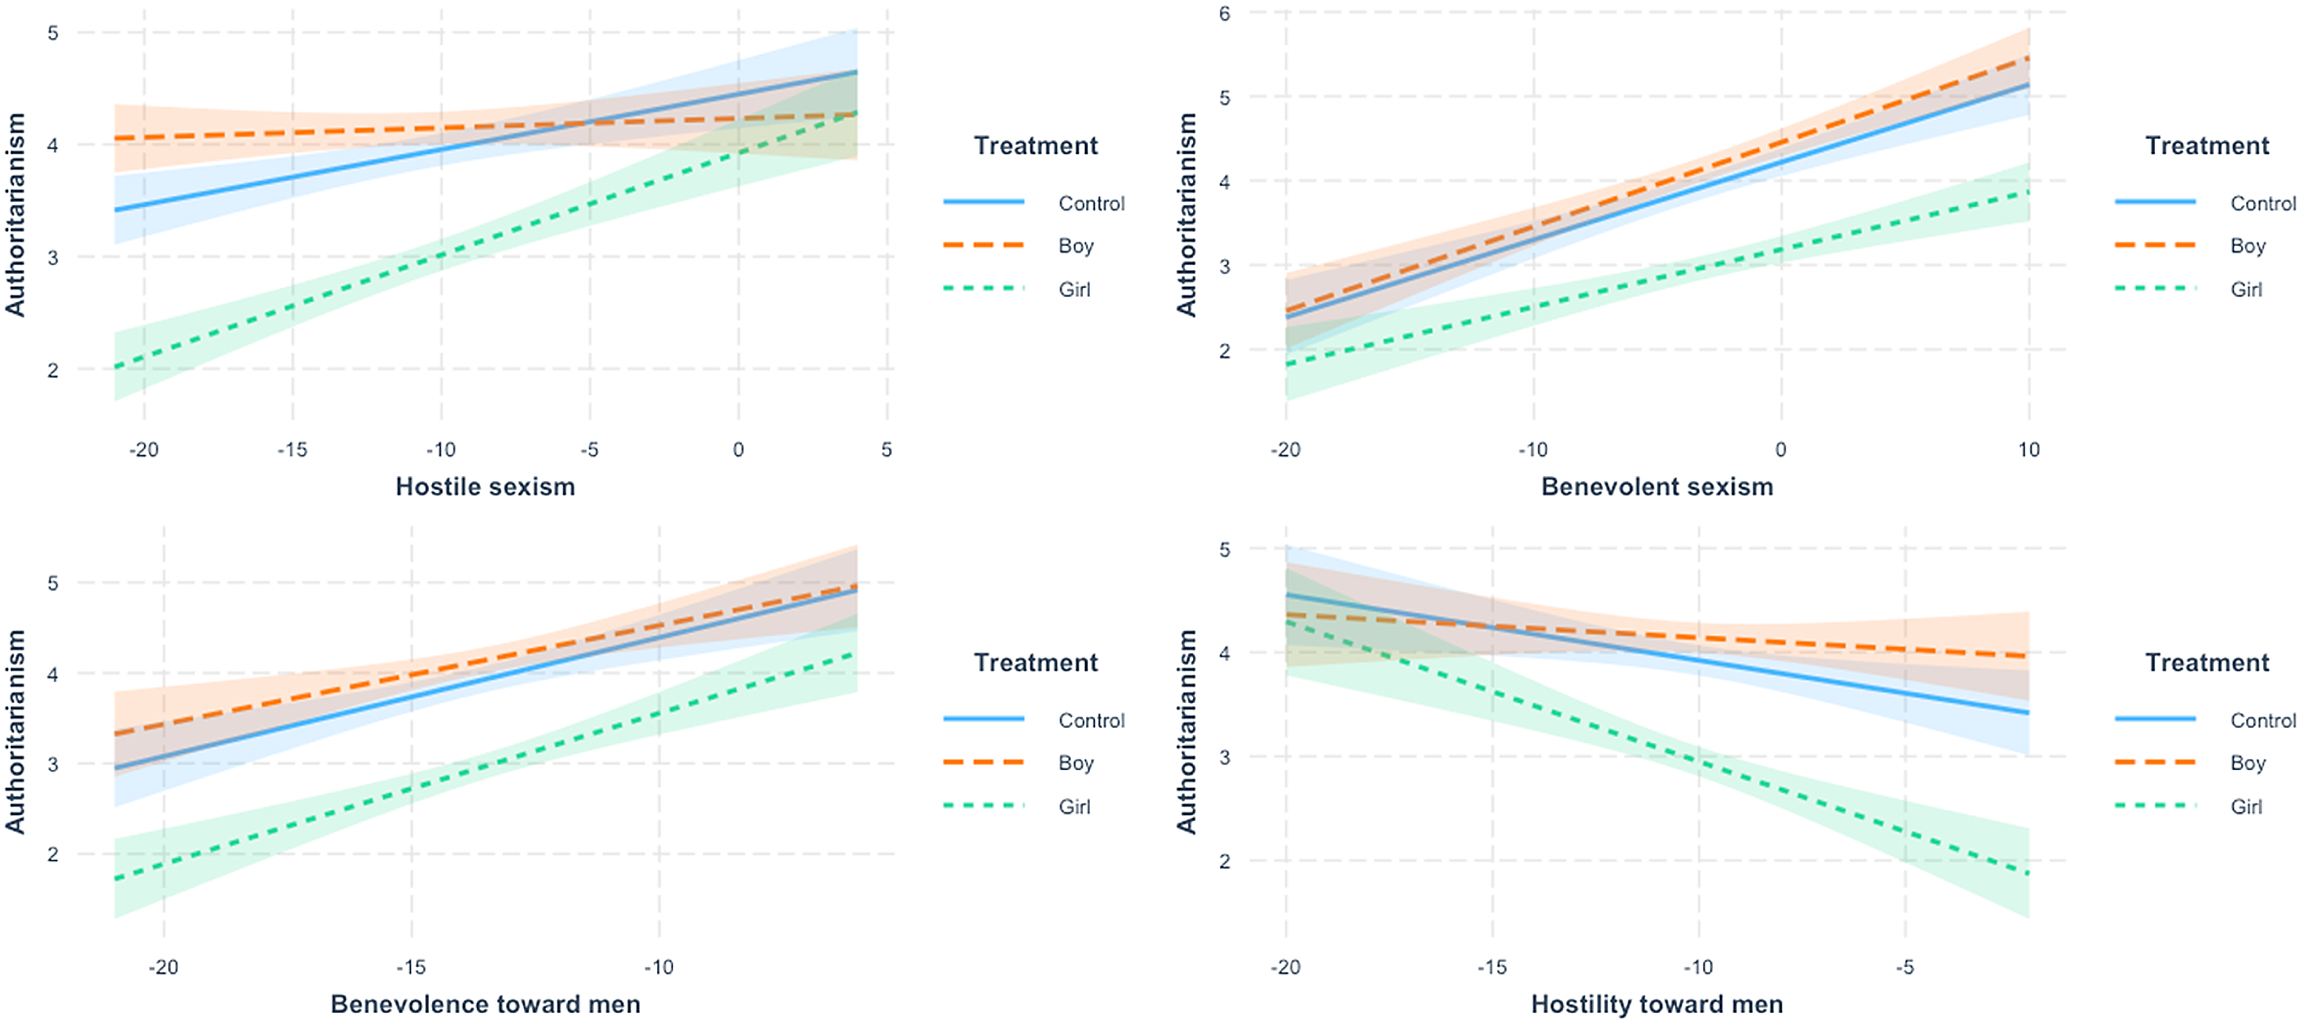
The patterns for the two benevolence items are uninteresting. There are, as should be expected, mean shifts between the treatment conditions, but the lines are essentially parallel. The two hostility items, however, have a much more interesting pattern. In the top left panel, for respondents who were asked about the more important qualities in boys, there is no relationship between the respondent's level of hostile sexism and their level of authoritarianism. To be clear, it is not just that the relationship is insignificant. The slope of the orange line in that panel is 0.0008. It is a flat line. In the “girl” condition, the link between authoritarianism and hostile sexism is strong and positive. The coefficient between hostile sexism and authoritarianism in the “boy” condition is almost half that of the “girl” condition, and the slopes of all three lines are significantly different from one another. The hostility toward men results is less stark, but the pattern is similar. In all three conditions, there is a significant negative slope, but the slope of the line representing the “girl” condition is much steeper than the other two conditions. The slopes in the “boy” and “control” conditions are not significantly different from one another.
The results in Figure 8 also provide evidence about why the mean differences exist across the conditions. These results suggest that when respondents are cued to think about the qualities that a girl should have, their process of constructing their answers is different, and the measure is tapping into other attitudes. Returning to the model of survey response, the implication is that in the second step of the survey response, when the respondent is retrieving considerations from memory, the considerations are different when they are thinking about a girl instead of a boy or child. The experimental treatments have no discernible effect on respondents who have the highest level of hostility toward women or the lowest levels of hostility toward men. The difference between the “boy” and “girl” conditions is highest for respondents who have low levels of hostility toward women or high levels of hostility toward men. These are the respondents who appear to have the lowest levels of authoritarianism, but they are the ones most sensitive to the differences in the question-wording. The girl condition does not trigger sexists to connect their sexism to the authoritarianism items. Instead, it leads those who do not hold hostile sexist attitudes or do have hostility toward men to appear to be less authoritarian than they would otherwise.
3.1 Measurement properties
These initial results indicate that changing the wording of the items causes a shift in the reported levels of authoritarianism, if not in the direction we hypothesized, and changes some of the considerations used when answering the items. In this section, we now expand on these results by examining how the measurement properties and correlates of the full authoritarianism measure vary across the initial “boy,” “girl,” and “child” conditions. The mean differences show that, on average, it appears to be harder for people to provide an authoritarian response on most of the items when thinking about girls instead of boys or children. In this section, we take this further by systematically testing the measurement properties of the items.
Our main approach to testing for differential measurement properties of the scale across the condition is to rely on a series of nested multiple-group IRT models.Footnote 6 We start by running an IRT model where all the parameters are allowed to vary across the three conditions. We then constrain a set of parameters to be equal across the conditions and compare the model fit. We compare five different models: (1) all of the parameters are different across the conditions, but the structure of the model is the same (configural); (2) the slopes (discrimination) of the items are all the same, but every other parameter varies; (3) the intercepts (difficulty) of the items are all the same but, every other parameter varies; (4) the slopes and intercepts are the same, but the mean and variance of the latent variables are the same; and (5) the slopes, intercepts, mean of the latent variable, and the residual variances on the items are the same (strict invariance). Each of these models is nested from the configural model. The test is simply a comparison of model fits between the configural model and the successive models fixing specific parameters to be equal across the conditions.
Tables 2–4 present the fit statistics from the five models, including the χ 2 test that directly compares the fit of the model to the configural model. In each survey, the results are clear: the best-fitting model is the one that only fixes the slope parameters to be constant across the conditions. Imposing strong invariance, where the parameters for the items are the same across the three conditions, significantly decreases the fit of the model. Besides fixing the slopes, each of the restrictions imposed on the measurement model makes the fit significantly worse in all three surveys. In each case, the CFI does suggest that the configural model fits better than the model with the slopes fixed across the conditions, but the χ 2 tests and the ΔCFI indicate that these differences are not statistically significant.
Similarity in the measurement properties of the authoritarianism items by experimental condition (multigroup IRT model fit, study 1)

Note: Data from a survey conducted by the authors in 2021. Cell entries provide the comparative model fit statistics from several nested multigroup IRT models.
*p < 0.05.
Similarity in the measurement properties of the authoritarianism items by experimental condition (multigroup IRT model fit, study 2).

Note: Data from a survey conducted by the authors in 2019. Cell entries provide the comparative model fit statistics from several nested multigroup IRT models.
*p < 0.05.
Similarity in the measurement properties of the authoritarianism items by experimental condition (multigroup IRT model fit, study 3).

Note: Data from a survey conducted by the authors in 2019. Cell entries provide the comparative model fit statistics from several nested multigroup IRT models.
*p < 0.05.
The results in Tables 2–4 demonstrate that there are statistically significant differences in the model fit based on the wording of the authoritarianism items. They do not, however, provide any sense of the effect sizes of these differences. To estimate these effect sizes, we provide the expected score version of Cohen's d for each of the items and the expected test score standardized difference for the full scale (Meade, Reference Meade2010). The advantage of these effect size estimates is that they can be interpreted via Cohen's (Reference Cohen1992) guidelines for small, medium, and large effects.Footnote 7 The one difficulty with these estimates of effect size is that they are designed for comparing two groups. In the top half of Table 5, we provide the effect size estimate when comparing the “boy” condition to the control condition. In the bottom half, we compare the “girl” condition to the control condition.
Effect sizes of the differences in the measurement properties of the authoritarianism items by experimental condition (multigroup IRT model fit)
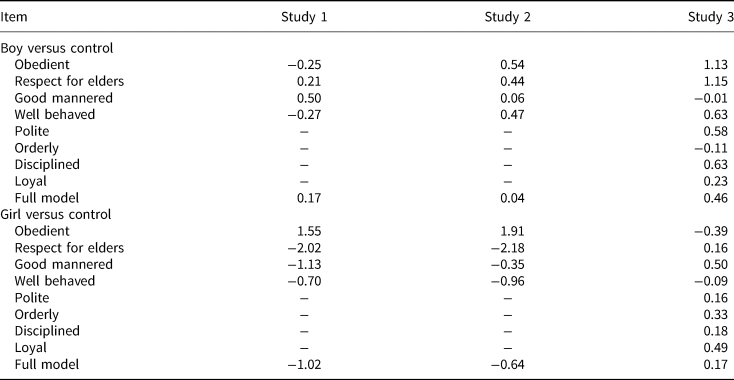
The effect sizes for the specific items are mixed. For the boy versus control comparison, there are 16 different effect sizes across the three datasets. One of the effects is very small (0.01), two are small (<0.20), seven are medium (<0.50), four are large, and two are very large (see Sawilowsky (Reference Sawilowsky2009) for the extended set of effect size categories). There are also 16 items estimating the effect sizes for the specific items comparing the girl and control conditions. Four of these are small, five are medium, one is large, two are very large, and two are huge.
The effect sizes for the full scales are generally more modest for the “boy” versus control condition than the “girl” versus control condition. For studies 1 and 2, the differences between the “boy” versus control conditions are small, while the difference in study 3 is medium-sized. In contrast, the effect size of the full scale for study 3 comparing the “girl” and control conditions is small, while for study 2, it is large and for study 1, it is very large. In sum, these do not appear to be trivial differences in the model fits.
3.2 Correlates of authoritarianism
At this point, we have raised an important concern with the standard measurement of authoritarianism. How respondents construct their responses to the items depends on whether they are asked about children, boys, or girls. Respondents interpreting the question to be about girls are less likely to provide the more authoritarian answer and rely more on their attitudes about men and women in constructing the responses. In classical psychometric measurement theory, these results would result in questions about the scale. But for many, the key concern with the authoritarianism scale is in its predictive validity. Are there differences in the correlates of authoritarianism across the conditions? This is the final question we address.
In this section, we focus on three sets of possible correlates with authoritarianism. We start by examining the consistency in the relationship between authoritarianism and two variables: partisanship and ideology. The second set is six different feeling thermometers asking the respondents their opinions of Donald Trump, Joe Biden, Democrats, Republicans, Black Lives Matter, and the police. The final set measures the respondent's attitudes about immigration, the death penalty, and gay rights. In each of these tests, the independent variables in the model are interactions between the measure of authoritarianism and which condition the respondent was in (and the constituent measures).Footnote 8
From these models, we calculate the marginal means of the linear effects of the independent variables. We first test if allowing these marginal means to vary across the conditions improves the fit of the model. We then test if the marginal means are equal for the three pairs' conditions (with the Tukey's method correcting the p-values for multiple comparisons). Figure 9 plots the marginal means of the effect of the independent variable across the three conditions for the models for our three sets of variables.
Ordinary least squares slopes of authoritarianism on three sets of political variables (study 3).
Note: Data from a survey conducted by the authors in 2021. Entries in the figure are the coefficients and 95 percent confidence interval from a regression model of the respondent's level of authoritarianism predicting the dependent variable.
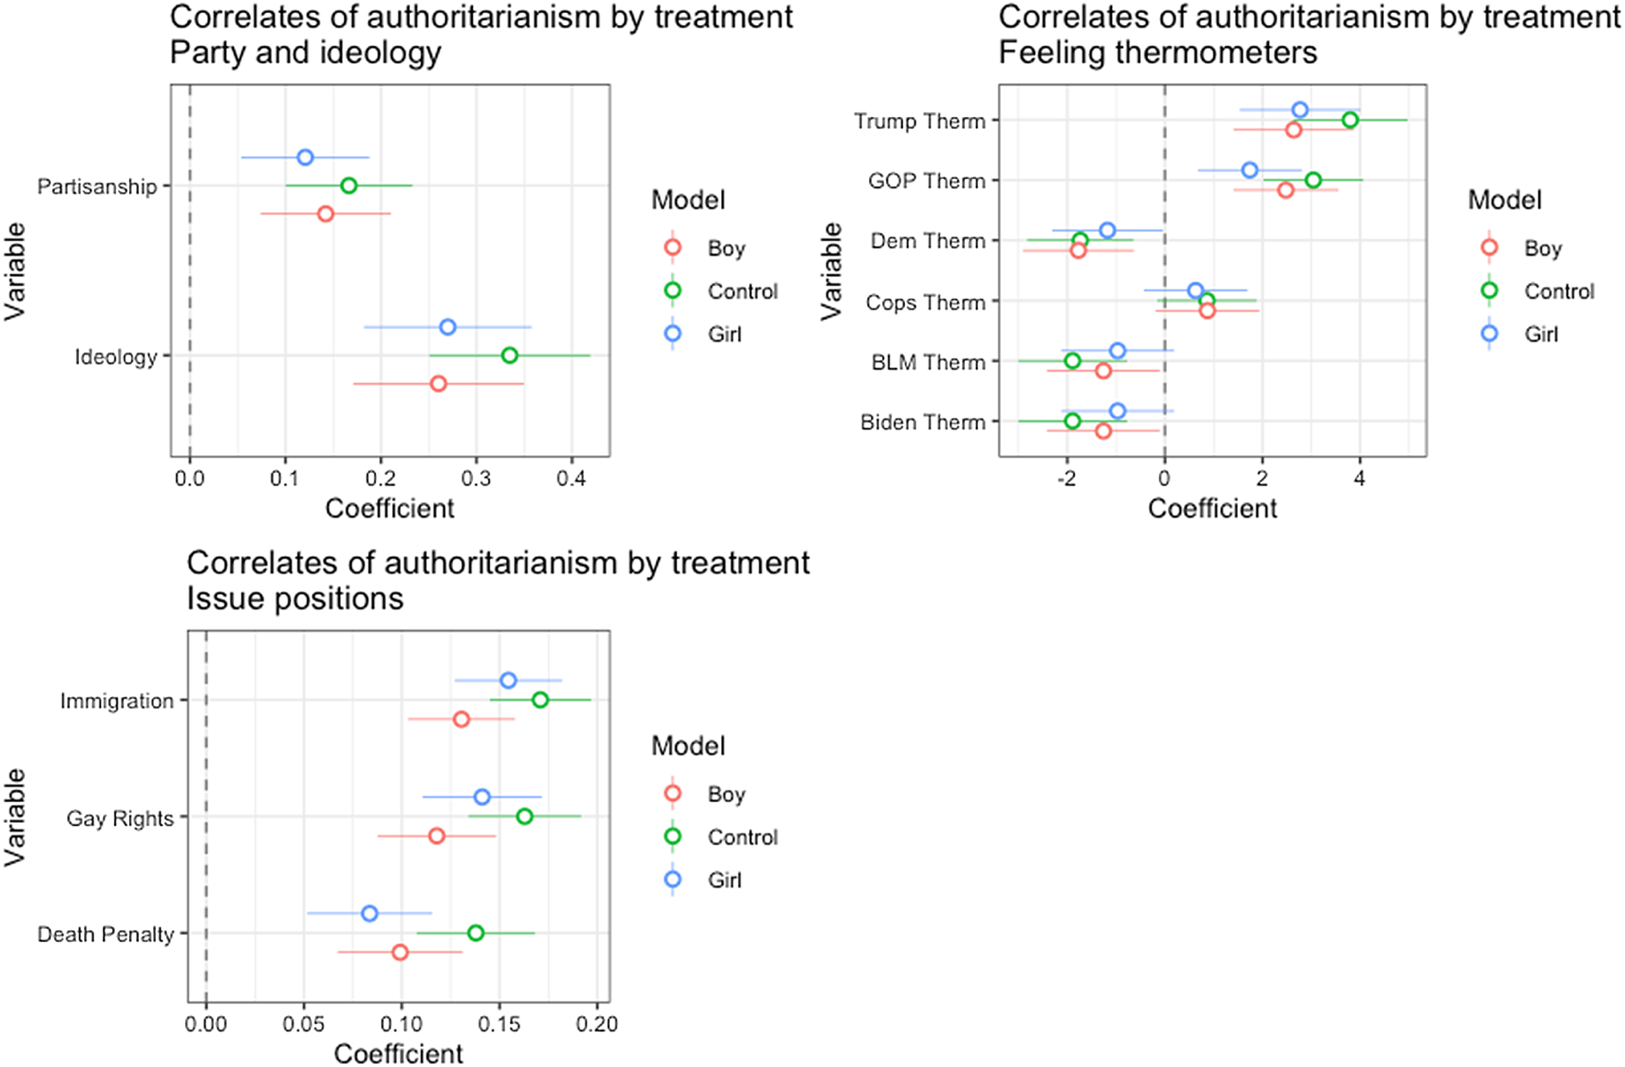
The overall conclusion from Figure 9 is that, unlike the measurement results, there are not a lot of significant differences across the conditions. Our initial set of tests, in the top left figure, is for the models predicting partisanship and ideology. The dots illustrate the regression coefficient, and the bars are the 95 percent confidence interval. In each of the three conditions, there is a significant relationship between the independent variable and authoritarianism. There are, however, no significant differences in those relationships across the conditions. The coefficients are largest in the control condition for both variables, but none of these differences are statistically significant.
Including the interactions between authoritarianism and the treatment condition does not improve the fit of the model for any of the feeling thermometers for the models where the feeling thermometers are dependent variables, including the interactions. Additionally, none of the pairs (control versus boy, boy versus girl, or control versus girl) of effects are different for any of the feeling thermometers either. There are a couple of effects where the coefficients from the respondents in the “girl” condition are not significant when they are in the other conditions, but again, these coefficients are not different from one another.
The final panel plots the marginal effects of authoritarianism on our three issue position measures. Here we find some evidence of differences in the connection between authoritarianism and the issue attitudes. In the models predicting immigration and gay rights, respondents in the “boy” condition have smaller coefficients than those in the “control” condition, though this effect is not statistically significant (p-values = 0.09 for both issue attitudes). For both of those issues, the F-test for the inclusion of the interactions is also statistically insignificant (p-value of 0.11 for both models). In the death penalty attitude model, there are significant differences. The coefficient for respondents in the “girl” condition has a significantly weaker relationship between authoritarianism and attitudes about the death penalty than in the “control” condition (p-value = 0.04), though the effect is not different from respondents in the “boy” condition (p-value = 0.20). Thus, there is some evidence that asking about girls instead of children can change the observed relationships between authoritarianism and issue attitudes.
Overall, these results suggest that, unlike the measurement results, our experimental manipulation does not substantially alter the empirical connections between authoritarianism and other politically relevant variables, with two exceptions. There are a few cases where the knife-edged statistical tests differ across the conditions, but most of the results indicate that the correlations between authoritarianism and other variables are consistent across the conditions.
The combination of results leads us to conclude that the standard measurement approach using the child-rearing questions has partial measurement equivalence across our experimental conditions (Byrne et al., Reference Byrne, Shavelson and Muthén1989; Borsboom, Reference Borsboom2006). While all the items used to measure authoritarianism do not appear to consistently measure the underlying construct, enough of them do, which allows for valid tests of the relationship between authoritarianism and other political concepts. Given that the attention paid to authoritarianism is generally more to its predictive power than the mean levels of authoritarianism in the population, the results in Figure 9 should provide a fair amount of relief to any concerns raised in the measurement results. If, instead, scholars are concerned about the mean level of authoritarianism—for example by treating it as a dependent variable—then the threshold differences across the items are a much more serious concern.
4. Who thinks of boys and girls?
While the results from the previous section illustrate how the experimental treatment changed responses to the authoritarianism titles, they do not provide any guidance about how widespread these differences are in the population. As a final part of our exploration of how this question-wording matters for the measurement of authoritarianism, we conducted one final study in November 2023 using Lucid. This survey of 1015 respondents included the full set of eight questions developed by Engelhardt et al. (Reference Engelhardt, Feldman and Hetherington2021) and used the stem referring to a “child.” At the end of the battery of items, we asked respondents if they were thinking of a boy or a girl and gave them the option of choosing neither. This study will allow us to explore what proportion of the respondents report thinking of a boy or girl, if the measurement properties of the authoritarianism measure differ across these responses, and the predictors of thinking of a boy or girl when answering these questions.
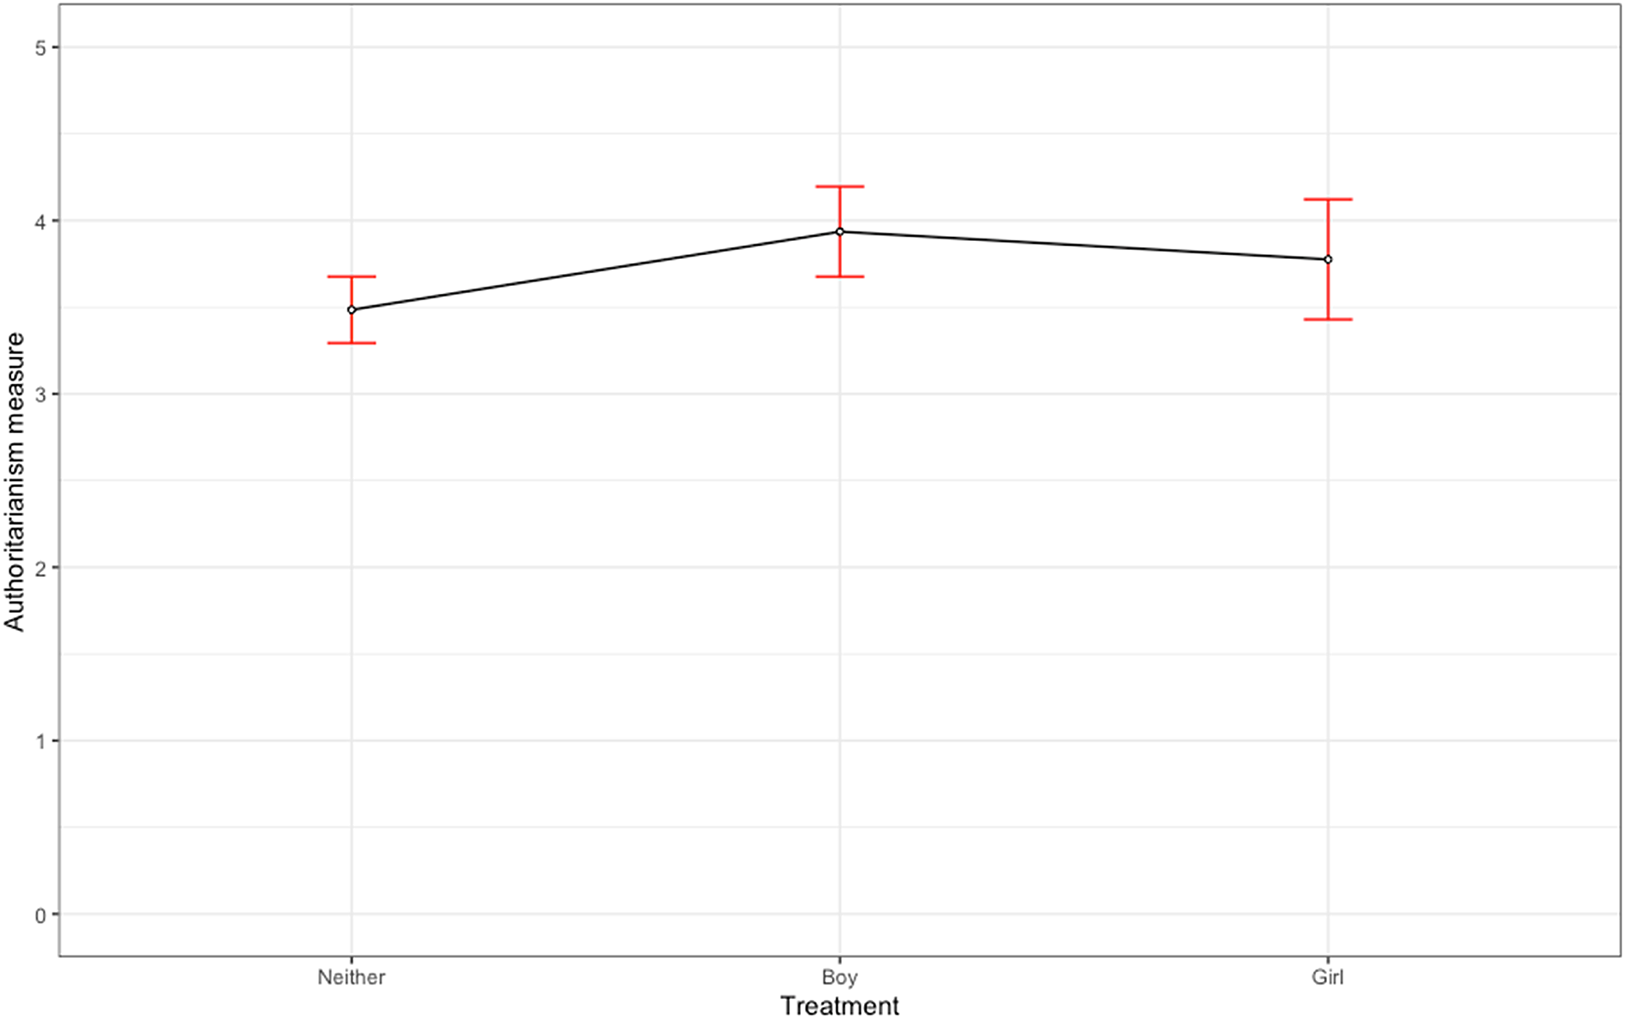
The majority of the respondents (61 percent) chose the “neither” option, just under a quarter responded that they were thinking of a boy, and just under 15 percent said they were thinking of a girl. The fact that a majority of the respondents were neither explicitly thinking of a boy or girl provides some clarity that the effects we have identified are not ubiquitous in the population. An ANOVA explaining the overall measure of authoritarianism based on the answer to this question suggests that there are significant differences in the level of authoritarianism based on the answer to the gender of the child in the mind of the respondent. We plot the means and standard deviations in Figure 10. Surprisingly, post-hoc tests indicate that while respondents thinking of a girl have lower levels of authoritarianism than those thinking of a boy, the difference is not statistically significant. Instead, the respondents who chose the “neither” option have significantly lower levels of authoritarianism than those thinking of a boy, but no significant difference from respondents thinking of a girl.
Mean levels of authoritarianism based on the gender of the child in the mind of the respondent (study 4).
Note: Data from a survey conducted by the authors in 2023. The plot contains the mean and 95 percent confidence interval of the eight-item authoritarianism scale for the listed conditions.
We have also estimated the same measurement models presented in Tables 2–4 for these data and present these results in Table 6. Unlike the models analyzing the experiments, the results indicate that the configural model is the best fitting for these respondents. The model that constrains the slopes to be constant across the three groups fits the model worse than the model that allows the parameters to be free. However, these effects are more muted than in the experiments. The models that constrain the parameters do not reduce the fit of the model for these data as much as the analyses of the experimental data.
Similarity in the measurement properties of the authoritarianism items by experimental condition (multigroup IRT model fit, study 4)

Note: Data from a survey conducted by the authors in 2023. Cell entries provide the comparative model fit statistics from several nested multigroup IRT models.
*p < 0.05.
The final set of results from this study explores the correlates of the response to the question asking if the respondent was thinking of a boy or a girl. Our survey included standard demographic questions asking the respondent's age, gender, race, ethnicity, education, income, if they identify as born again, and partisanship. We also included an item asking if the respondent had a daughter and the Ambivalent Sexism and Ambivalence Toward Men Inventories. We model these data as a multinomial logit, with the “neither” answer as the baseline condition. The results in Table 7 present the effect of the independent variables on the probability that the respondent would answer boy (column 2) or girl (column 3) instead of neither.
Multinomial logit model predicting the gender of the child in the mind of the respondent
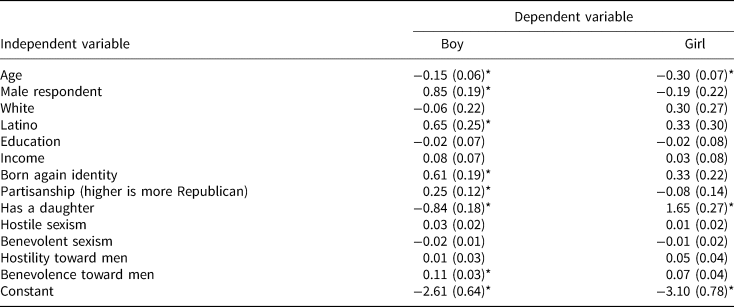
Note: Data from a survey conducted by the authors in 2023. Cell entries provide the coefficient and standard errors from a multinomial logit with the “neither” answer as the baseline condition.
*p < 0.05.
There are a few conclusions from these results. First, having a daughter is the most robust predictor of the gender of the child in the mind of the respondent. Parents of daughters were much more likely to think of a girl and less likely to think of a boy than respondents who did not have a daughter. Second, male respondents were more likely to think of a boy, though the difference between the “neither” and “girl” option is not significant. Third, older respondents were less likely to report thinking of a boy or a girl, being more likely to give the “neither” answer. Republicans, Latinos, and born-again respondents were also more likely to indicate that they were thinking of a boy instead of the other options. Finally, the ambivalent sexism and ambivalence toward men scales have limited explanatory power. The benevolence toward men scale is correlated with being more likely to think of both a boy and a girl. We are unsure what to make of this last result, particularly since the benevolence toward men did not have a significant effect in Figure 8.
Overall, our interpretation of the results in Table 7 is that these results suggest that the respondent's gender and the gender of any children would color the way that they interpret the standard authoritarianism items. Unsurprisingly, the lived experiences with gender seem to be correlated with how the respondents view the authoritarianism items.
Beyond that, the partisan differences are substantively important. Republicans tend to have higher levels of authoritarianism. But these results suggest that they are more likely to impute the gender of the child in the question as a boy. Given the results from the experiments and in Table 7, this reading of “child” as “boy” may be partially responsible for the partisan difference in authoritarianism. Of course, the direction of causality for this may be in the opposite direction. Republicans are more likely to think of a boy and have higher levels of authoritarianism, creating a spurious difference in Table 7. The results from our three experiments provide some evidence that this is not the case, but we cannot rule this out for this study.
5. Conclusion
The standard measure of authoritarianism is a workhorse in the study of American political behavior, but there has received surprisingly little attention to the construction of the survey questions that serve as the dominant measure. In this paper, we explore how a key word in those measures, “child,” may mask heterogeneity in how people respond to those questions. We test if the gender of the child in the mind of the respondent changes how he or she answers the question and the performance of the resulting authoritarianism scale. Our results suggest that when a survey cues the respondent to think of a girl instead of a child, the items and the resulting measures are substantively different. Fortunately, these effects do not seem to change the empirical relationships between the authoritarianism measure and other politically relevant measures.
We find these results somewhat surprising. Gender stereotypes about children are pervasive and often quite powerful. We expected that when the mental image of the hypothetical child was a girl, respondents would appear to be more authoritarian if they were envisioning a girl instead of a boy. This is not what we found. Instead, respondents in the “girl” condition were significantly less authoritarian than those in the “control” or “boy” condition. Respondents were, for instance, more likely to prefer a girl to be independent (versus respectful of elders) and self-reliant (versus obedient). Again, these results are counter to the prevailing expectations about the gendered nature of child-rearing stereotypes.
We do not have a good explanation for why this is the pattern in the data. Our best explanation is that this may be the result of some type of desirability bias. When respondents are given the explicit cue to think about a girl, perhaps they perceive the question as having some expectation about what the answer “should” be and do not wish to appear to be sexist. Presumably, the more natural reporting of what gender they were thinking of may mitigate this social pressure and fail to produce the same result. Another possibility is that the cue changed how respondents thought about the question, making them less abstract and potentially making the respondent think about a specific child.
While there are clearly mean and measurement differences across our conditions, the effect on how authoritarianism appears to matter is much more muted. There were very few significant differences, and given the large number of tests we conducted, we are not overly confident in those results. That said, the measurement results themselves indicate that there are important differences across our treatment conditions. The standard measurement approach of using the gender-neutral “child” appears to be masking heterogeneity in how respondents process the questions. These differences may have limited effects on the correlations between authoritarianism and other politically meaningful variables, but these results clearly illustrate that more needs to be done to unpack how respondents are answering the standard survey items.
Supplementary material
The supplementary material for this article can be found at https://doi.org/10.1017/psrm.2024.49
To obtain replication material for this article, https://doi.org/10.7910/DVN/GIQJDD


 Open access

