


Introduction
Dundee Island (Fig. 1) is located in the northeast sector of the Antarctic Peninsula and is part of the island group that includes D'Urville, Joinville Archipelago, Bransfield and several smaller islets. The island has a rounded geometry, with a maximum extension of 27 km in the west-east direction and 20 km north-south. It covers an area of 450 km2, much of which is covered by outlet glaciers that reach the sea. The largest ice-free area is located in the western zone, where Petrel Base is situated (Fig. 1). This sector is called Cape Welchness, with a triangular morphology spanning 2.5 km2. It is relatively flat and divided into two stepped plains. The lower plain has elevations < 15 m above sea level (a.s.l.) and surrounds the higher central part, separated by a ravine that barely reaches 20 m a.s.l. The lower plain is sparsely eroded by small creeks that flow to the coast. The higher plain is less eroded, has very gentle slopes and forms small bodies of water of snowmelt origin. The most prominent topographical feature is the frontal moraine of the Rosamaría Glacier (Iksul Icefield), which marks the western boundary of the mentioned plains and reaches a maximum height of 66 m a.s.l.
Location map of the study area.

Although Petrel Base, located on Dundee Island, was built in the 1950s, there are no geological or geocryological studies of the area available in the literature. This lack of geological or geocryological studies significantly complicates any geotechnical or environmental study in the area. For example, it has been determined that the deposits of the Trinity Group indicate structural control between Dundee Island and Joinville Island. The identification of deposits from the Lower Cretaceous, in addition to their potential palaeontological value, demonstrates a stage at the edge of the Larsen Basin. Both the identification of deposits from the Lower Cretaceous and the indication of structural control are crucial when, for example, determining the best location for the local seismograph and subsequently interpreting its data. At Petrel Base, an aerodrome and logistics centre are planned to operate, and this type of information could be highly relevant in conditioning their design and location. On the other hand, the environmental impact studies required for the design of the facilities necessitate a thorough study of the Quaternary deposits upon which they will be situated and which the facilities may therefore impact. Furthermore, it must be borne in mind that the permafrost in much of the study area involves these recent units, and their characteristics and thermal dynamics are related to these deposits and are crucial for understanding them. Finally, strategic issues such as the search for sources of long-term potable water supply depend on the mentioned knowledge. It is within this framework that the present analysis of the geology and hydrogeology of Dundee Island is situated.
The main objective has been to analyse the geocryological aspects of the Quaternary deposits in the Cape Welchness area (Antarctic Peninsula). In this way, it is possible to propose correlations with events and similar deposits in other locations on the Antarctic Peninsula. This facilitates the geoenvironmental interpretation of Cape Welchness and proposes a cryohydrological conceptual model using a specific methodology for these regions.
Materials and methods
Fieldwork
The fieldwork tasks consisted of the identification and preliminary study of geological and geocryological units. A geological and geocryological survey of the area was conducted using both direct and indirect methods. Test pits and manual drillings were performed to assist in subsurface interpretations and to obtain parameters for the active layer and permafrost table. Direct data were obtained from outcrops, grain size samples of the clastic material, total soil water content (Wt), total ice content (Hs) and depth profiles of permafrost. The flow in permanent creeks was systematically measured, and surface and groundwater samples were collected to understand local hydrochemical processes. The flow of the creeks has been determined by carrying out hourly hydrograms of the discharge, along with daily monitoring of the same. The uncertainty of the measured discharge accumulates to ~0.1 m3/s, based on the sensor precision of 0.01 m/s for stream velocity (OTT, Kempten, Germany) and an assumed error of 0.01 m2 in the assessment of the stream's cross-section. In situ analysis was used to determine the active-layer depth, deep top permafrost and geocryogenic parameters based on soil and air temperatures or geoelectric response (Ormazabal & Silva Busso Reference Ormazabal and Silva Busso2022). Indirect methods involved conducting geoelectric soundings (i.e. vertical electrical sounding; VES), which differentiate the presence of fresh or salt water, ice or dry rock based on resistive signals.
During the summer of 2016–2017, meteorological data were collected by installing an Automatic Weather Station (Campbell Scientific, Logan, UT, USA) that measures temperature to an accuracy of 0.1°C. The station also includes an anemometer and barometer. Additionally, an alpine-type totalizing rain gauge was included. Data were recorded every 3 h between 29 December 2016 and 20 February 2017.
Table I summarizes the position of the discharge control points of the creeks. The discharge rates have been measured daily during the summers of 2016/2017, 2021/2022 and 2022/2023.
Gauging sites in Cape Welchness.

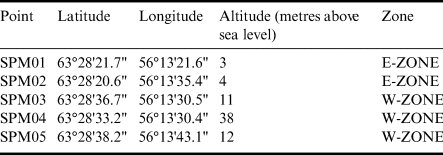
The VES locations were chosen in the most favourable areas based on the terrain's physiography. In total, eight VESs were analysed with an AB/2 (half-space thickness) ranging from 110 to 320 m, five VESs with an AB/2 of 60 m, two VESs with an AB/2 of 12 m and five electrical test pits with an AB/2 of 5 m. Figure 2 shows the placement of the VESs on the topographical map (Lusky et al. Reference Lusky, Del Valle and Izquierdo2005). Additionally, the locations of lithological sampling points, water samples, hydrological and hydrogeological measurements and geological observations are indicated. Table II shows the lithological sampling points in the low and high plains (SPM03, 04 and 05) in the west and the eastern fluvioglacial plains (SPM01 and 02).
Data points, sample points and vertical electrical soundings (VESs) in Cape Welchness. Note that CAL02 point was sampled during low tide.

Location of sampling wells.
Through these observations, various geological and geocryological units were identified and the suprapermafrost aquifer was recognized. Furthermore, the summer discharge regime of the area's creeks was established, lenticular systems were identified and the hydrochemical characteristics of the systems were characterized.
Geological framework
The Antarctic Peninsula constitutes an Andean-type mountain range, primarily with outcrops of Mesozoic and Cenozoic age rocks. The oldest known basement rocks outcrop in the south-eastern flank and are a set of Precambrian to early Palaeozoic-age igneous rocks. The oldest magmatism is from the Triassic period and reached its peak activity along the peninsula axis during the mid-Cretaceous. Volcanic rocks related to this magmatic episode are generically known as the Antarctic Peninsula Volcanic Group.
In the northern part of the Antarctic Peninsula and adjacent islands (South Orkney Islands and South Shetland Islands), the basement of the Mesozoic-Cenozoic magmatic arc consists of Permian-Triassic turbidite successions, regionally metamorphosed, which include the Trinity Peninsula Group. To the east of the Antarctic Peninsula, the Larsen Basin (del Valle et al. Reference Del Valle, Elliot and Macdonald1992) of Mesozoic-Cenozoic age developed. It formed during the early stages of the Gondwana breakup and is lithologically composed of a marine fill, best exposed in the region of James Ross Island, spanning from the Upper Jurassic to the Eocene (Hathway Reference Hathway2000).
In the northern Antarctic Peninsula and adjacent islands (South Orkney Islands and South Shetland Islands), the sediments of the Marambio Group (Rinaldi Reference Rinaldi and Craddock1982) unconformably overlie the plateau deposits and have a widespread distribution on James Ross, Vega, Humps, Snow Hill, Cockburn and Seymour islands. This group includes the Santa Marta Formation, Rabot Formation, Snow Hill Island Formation, Haslum Crags Formation, López de Bertodano Formation and Sobral Formation (Rinaldi et al. Reference Rinaldi, Massabie, Morelli, Rosenman and Del Valle1978), and it was deposited during the Santonian-Danian interval (Olivero Reference Olivero2012). The Neogene deposits are found in glaciomarine sediments with associated mollusc fauna, belonging to the Hobbs Glacier Formation of Miocene age (Pirrie et al. Reference Pirrie, Crame, Lomas and Riding1997).
The James Ross Volcanic Group (Nelson Reference Nelson1966) consists of complex eruptive rocks of Pleistocene age, which are highly conspicuous in the northern part of the peninsula. They often exhibit a lower unit of subaqueous volcanism and an upper unit of subaerial volcanism. Radiometric dating by Smellie et al. (Reference Smellie, McIntosh, Esser and Fretwell2006) assigns them ages ranging from the upper Miocene to Pleistocene. The Pleistocene of Dundee Island is represented by the volcanic rocks of Cape Purvis (Smellie et al. Reference Smellie, McIntosh, Esser and Fretwell2006), which have a composition similar to the tuffs of Paulet Island and are considered the youngest and northernmost expression of the James Ross Volcanic Group. The age of this formation is 132 ± 19 ka (Smellie et al. Reference Smellie, McIntosh, Esser and Fretwell2006). Overlying these levels, there are clastic deposits, generally of glacial origin.
In the exposed areas, lacustrine and beach marine sediments have accumulated, ranging in age from the Late Pleistocene to the present day. Various authors (Malagnino Reference Malagnino, Olivero, Rinaldi and Spikermann1978, Reference Malagnino, Olivero, Rinaldi and Spikermann1981, Rabasa Reference Rabasa1984, Reference Rabasa, Menzies and Rose1987) have studied the geology of Quaternary deposits, particularly on the islands of the Ross Archipelago, proposing a preliminary stratigraphy. Subsequently, studies by Fukuda et al. (Reference Fukuda, Strelin, Shimicawa, Takahashi, Sone, Trombotto, Yoshida, Kaminuma and Shiraishi1992), Ingólfsson et al. (Reference Ingólfsson, Hjort, Björck and Smith1992) and Hjort et al. (Reference Hjort, Ingólfsson, Möller and Lirio1997) have improved the stratigraphic correlation for these deposits. Hjort et al. (Reference Hjort, Ingólfsson, Bentley and Björck2003), based on geomorphology and stratigraphy, propose an analysis of glacial, marine and other climatically significant events in the Antarctic Peninsula region. Lirio et al. (Reference Lirio, Nuñez, Del Valle and Mazzini2009) propose a preliminary stratigraphy of Pleistocene-Holocene deposits in the James Ross Archipelago area, considering studies by various authors and summarizing glacial and climatic events in the Antarctic Peninsula region. Raised coastlines and erratic boulders indicate one or more glacial events during the Late Pleistocene, predating the Last Glacial Maximum, which ended c. 18 000 years ago (Lirio et al. Reference Lirio, Nuñez, Del Valle and Mazzini2009). In the Antarctic Peninsula and surrounding islands, the deposits of raised beaches postdate the Last Glacial Maximum. In the northern part of the Antarctic Peninsula, the postglacial marine limit is located at elevations between 15 and 20 m a.s.l., with the highest limit on James Ross Island reaching 30 m a.s.l. 7500 years ago (Hjort et al. Reference Hjort, Ingólfsson, Möller and Lirio1997). On James Ross Island (El Morro Peninsula), Ingólfsson et al. (Reference Ingólfsson, Hjort, Björck and Smith1992) and Hjort et al. (Reference Hjort, Ingólfsson, Möller and Lirio1997) identify the oldest unit in glaciomarine deposits with radiocarbon-corrected ages of 7300 years. In some locations, the till is covered by stratified silty sand or by tongues or lentils of diamictic sand with a radiocarbon-corrected age between 6700 and 6900 years. These authors conclude that deglaciation, at least in the Jame Ross Archipelago area, began no earlier than 7300 years ago.
The study and geological map of Esperanza Bay (Montes et al. Reference Montes, Nozal, Del Valle, Martín-Serrano, Heredia and Gallastegui2019) deserve special attention due to its proximity to Cape Welchness (~40 km away). While specific ages have not been determined, Montes et al. (Reference Montes, Nozal, Del Valle, Martín-Serrano, Heredia and Gallastegui2019) propose that the surface detrital deposits are mostly recent and primarily of glacial origin, resulting from glacier retreat since the Last Glacial Maximum. The remaining clastic deposits result from other periglacial and coastal processes but are limited and discontinuous. This observation is consistent with the proposal by Ingólfsson et al. (Reference Ingólfsson, Hjort, Björck and Smith1992) and Hjort et al. (Reference Hjort, Ingólfsson, Möller and Lirio1997) for the James Ross Archipelago, suggesting that the Quaternary glaciogenic and marine deposits in Esperanza Bay would be relatively contemporaneous. Montes et al. (Reference Montes, Nozal, Del Valle, Martín-Serrano, Heredia and Gallastegui2019) identified five geological units without formal names, designated with numbers 10–15 (Fig. 3) on the accompanying map. In summary, from the oldest to the most recent, we have: Unit 10, composed of angular blocks and pebbles with a sandy-silt matrix, attributed to a basal till and moraines. Overlying Unit 11, composed of angular blocks and pebbles, is observed in slopes and talus cones. The remaining units appear as relatively contemporaneous or lateral facies changes.
Quaternary stratigraphy of Hope Bay (Montes et al. Reference Montes, Nozal, Del Valle, Martín-Serrano, Heredia and Gallastegui2019).

Unit 12 consists of rounded clasts and sands, interpreted as marine deposits and terraces. Overlying it is Unit 13, composed of gravels, sands and silts that form small coastal deltas. Laterally, Unit 14 is described as silt, sand and gravel from the valley bottom of fluvioglacial origin. Finally, Unit 15 is composed of gravels, sands and silts but in small alluvial fan environments.
The combined interpretation of the VES data and surface geology allowed for the determination of the stratigraphic succession of local geological units and the overall morphology of the permafrost.
To achieve a better resistivity interpretation, the study area was divided into two parts to be interpreted using two different stratigraphic models. One was located to the east of the moraine (E-ZONE) on the fluvioglacial plain developed north-east of Cape Welchness, where VESs I, II and III were conducted. The second part was situated to the west of the moraine (W-ZONE) on the till plains, where VESs IV, V, VI, VII and VIII were conducted, along with VESs 26–32 and electrical test pits CA 1–5 on the coast and over the moraine. Seven resistive units have been interpreted from the VES data, which can be correlated with geological changes. As expected, the resistive response is influenced by the relative water or ice content; however, it is possible to distinguish them.

Results and discussion
Climatic aspects
In this sector of the Antarctic Peninsula, climatic variations are directly related to the variable anticyclonic conditions, as well as the moderating influence of the Weddell Sea. Meteorological data with the longest and most complete series (1967–1976) were obtained at Petrel Base (Argentine National Meteorological Service). The maximum temperature was recorded on 12 February 1972 (12.6°C), and the minimum temperature occurred on 8 August 1968 (-34.4°C), resulting in a temperature range of 46°C. The annual mean temperature for the entire data series is -6.8°C. The average winter temperature is -16°C, while the summer temperature averages -0.9°C.
The closure of the base in 1976 interrupted the records until the summer campaign of 2005 (between January and March), when a summer mean temperature of +0.4°C was recorded. Precipitation during the 1967–1976 period was more intense in spring, rarely exceeding 250 mm annually. The average value for the series is 208.7 mm/year. Liquid precipitation could exceed 30–40% during that time. The wind regime in the north-east sector of the Antarctic Peninsula typically responds to synoptic conditions, with the formation of cyclonic conditions in the Weddell Sea. This region is characterized by strong prevailing south-west winds, which can occasionally exceed 150 km/h, resulting in a significant wind chill factor. Most of the cloudiness is of the mid and low types, associated with synoptic-scale phenomena for this region, covering hundreds or thousands of kilometres. Based on this information, the climate would be classified as Subpolar Semiarid.
The average temperature during the 2016–2017 campaign was +0.6°C, with a maximum temperature of +2.5°C and a minimum temperature of -1.3°C. The prevailing winds during this period were from the south-south-west, with a maximum speed of 64.3 km/h and a minimum speed of 3.3 km/h from the north-east. Precipitation totalled 11 mm during the entire measurement period, with 80% being liquid and being 20% snow. These parameters are of similar magnitude to those observed in the 1967–1976 period and in the summer of 2005. There are only old, short and discontinuous data series available. To address this limitation, temperature data from Cape Welchness were correlated with those from Bahía Esperanza (Esperanza Meteorological Station), which cover the entire summer period. Bahía Esperanza is located 38 km from Cape Welchness and has a similar latitude and elevation above sea level, and both are located at the northern tip of the Antarctic Peninsula.
In Fig. 4, the accumulated temperature in Cape Welchness and Bahía Esperanza is compared during the period from 29 December 2016 to 20 February 2017. The curves show comparable trends and temperatures, indicating that it is possible to use the temperatures from Bahía Esperanza to complete the series of Cape Welchness. Figure 5 presents the reconstructed series with Bahía Esperanza data for Cape Welchness. On the other hand, according to Ermolin (Reference Ermolin and Silva2009), the onset of seasonal and permanent soil freezing begins at the end of February to early March, although it can vary depending on the specific meteorological conditions of the year.
Cumulative temperature correlation between Esperanza Bay and Cape Welchness.

Summer temperature correlation between Esperanza Bay and Cape Welchness.

According to this author, when the degree-day index (the ratio between days with positive air temperatures and days with negative air temperatures) exceeds 200°Cd- (degree-days negative), total freezing of the active layer occurs. This index takes a value of 303°C/day for the reconstructed recording period in Cape Welchness throughout the year and 197°C/day between 10 April 2020 and 23 October 2022 when the active layer would be fully frozen. This aligns with the data from Ermolin (Reference Ermolin and Silva2009), although, for this author, it begins slightly later, between mid-March and early April.
Geological aspects
During the Last Glacial Maximum, it is likely that the Cape Welchness area was covered by the Rosamaría Glacier from the Iksul Icefield (Montes et al. Reference Montes, Nozal, Del Valle, Martín-Serrano, Heredia and Gallastegui2019). In Cape Welchness, several Mesozoic outcrops are observed, specifically in the intertidal coastal zone (Trinity Group) to the west of the high plain and at the base of the eastern flank of the moraine (Gustav Group). Virtually the entire Cape Welchness area appears to be covered by a set of detrital deposits originating from morphogenetic processes related to glacial, fluvioglacial and marine activity. The dominant topographical feature is the moraine, which reaches a height of 66 m a.s.l., with a north-south orientation dividing the cape into two parts, east and west of it. The till deposits form two plains in the western zone are referred to as low and high. The first rises between ~2 and 10 m a.s.l., and the second rises between 14 and 20 m a.s.l., defined by a topographical feature or ravine ranging from 4–6 m, marking the boundary between them. This feature is related to the relative elevation of the substrate, the Gustav Group, due to its discordant relationship with the Trinity Group. However, even though it is a very distinctive feature of the local landscape, we understand that the depositional events of the till deposits exhibit a certain degree of continuity. The fluvioglacial deposits found in the west are more recent and are closely related to the dynamics and water discharge from the Rosamaría Glacier to the north and south of the moraine. Marine and deltaic deposits are observed along the coast. All modern deposits are discordant with the geology of previous ages. Using the mentioned information and the topographical base map from Lusky et al. (Reference Lusky, Del Valle and Izquierdo2005), the distribution of the outcropping units has been represented on a preliminary geological map (Fig. 6). The units defined on the map are sequentially described below, indicating subsurface interpretation. When possible, a correlation with similar units defined in Bahía Esperanza in the geomorphological and geological maps of Montes et al. (Reference Montes, Nozal, Del Valle, Martín-Serrano, Heredia and Gallastegui2019) has been proposed.
Simplified geological map of Cape Welchness (Dundee Island). A more detailed map is provided in the Supplemental Materials. K = Cretaceous; Pl = Pleistocene; Tr = Triassic (International Stratigraphic Code).

A summary of the resistive units is presented in Table IV.
Resistivity, thickness, depth and zone data for the resistive units.

Some resistive units are found beneath the subsurface of the entire region, such as resistive units V, VI (Gustav Group) and possibly VII (Trinity Group), although the electrode spacing (AB/2) did not reach the necessary depth to identify this. Other resistive units, being shallower, can only be found in one of the zones depicted in Fig. 6. For example, resistive units I and III are found in the E-ZONE, and resistive units II and IV are found in the W-ZONE. Locally, the similarity in resistive response between the layers of each VES significantly complicates interpretation. This means that a resistive unit may involve multiple resistive layers interpreted from a VES with a similar response. Additionally, there are no parametric drillings exceeding a depth of 2 m, and deeper interpretations are proposed based on the analysis of very spatially limited outcrops. On the other hand, it is not ruled out that geological units at depth may be present on the surface or subsurface. An example is the deposits of supposed Cretaceous age attributed to resistive unit VI; since their existence could not be verified on the surface, it is unknown whether they may correspond to any of the resistive responses in the subsurface. Electrical test pits, which allow measurements at specific depths, have been used to confirm or discard shallow or highly characteristic interpretive aspects. Therefore, they were used for direct resistivity measurements on the Trinity Group and on the moraine to qualitatively determine the ice content at shallow depths. Despite the mentioned limitations, we believe that the analysis is useful for gaining initial insights into the subsurface and the characteristics of the local permafrost. Figure 7 shows the main geological units.
Geologic units. a. Trinity Group; b. Gustav Group; c. fluvioglacial deposit (V-14); d. till deposit in high plain and lower plain (III-10); e. moraine deposit (IV-10) and slope deposit (V-11).

Trinity Group (Triassic)
The Trinity Group outcrops on the coast of Cape Welchness and is visible and accessible during low-tide periods. It consists of green-coloured, highly consolidated shale and/or siltstone formations, with its stratification having an average azimuthal direction of 80° and an average dip of 30° towards the south-south-east. Fissures within the group exhibit detrital fillings in the directions of 110° and 220°, occasionally showing fractures with white siliceous fillings at 50° azimuth. Glacial erosion striations are observed on coastal outcrops. Based on its lithology, it could be identified as the Hope Bay Formation, with a marine origin attributed to it (Hyden & Tanner Reference Hyden. and Tanner1981), as has also been observed in Bahía Esperanza by Montes et al. (Reference Montes, Nozal, Del Valle, Martín-Serrano, Heredia and Gallastegui2019). In the subsurface, this geological unit correlates with resistive unit VII and exhibits highly variable resistivity. The lowest resistive responses are found in the coastal area of the plain and the north-east zone. Resistivity values measured during low tide on outcrops of this unit range from 69.76 to 89.14 ohm m-1 in the top 2.5 m of depth, associated with the presence of salt water in cracks and fractures. However, towards the interior of the plain area, the resistivity of this unit significantly increases, reaching values between 453 and 879 ohm m-1 at depths ranging from 51 to 72 m. The base of this unit could not be reached, leaving its thickness undetermined. The changes in deep resistive response of this unit towards the east may be due to a decrease in water salinity as it moves away from the coastal and intertidal zone (where it outcrops) rather than lithological changes.
Gustav Group (Cretaceous)
These sedimentary deposits, which have relatively thin outcrops compared to other areas in the Larsen Basin, are discontinuously found on the east-south-east escarpment of the high plain (~10–15 m a.s.l.) and in the northern fluvioglacial plain in a palaeochannel at the base of the moraine (~4–6 m a.s.l.; Fig. 6). The outcrops on the high plain (referred to as Kr-I and Kr-II) consist of brown-grey to green-grey shale and mudstone formations with an azimuthal strike between 45° and 50° and a dip ranging from 6° to 8° in an average direction of 138°. They appear consolidated and highly fractured, with at least five different fracture orientations subparallel to the dip, measuring 195°, 228°, 248°, 284° and 325°. The fractures have little fine material (clay or silt) filling or are unfilled, appearing straight, with flat contacts, a vertical angle and low roughness. In the outcrop of the northern fluvioglacial plain (referred to as Kr-III), they have a green-grey colour, with beds striking at 48° azimuth and dipping between 5° and 10° in the direction of 140°. These beds are also highly fractured, with two different subparallel fracture orientations of 230° and 300°, similarly to the previous outcrop. The remaining characteristics are the same as those of outcrops Kr-I and Kr-II. In the subsurface, this geological unit correlates with resistive units V and VI, specifically recognized by their resistive contrast and depth. Resistive unit VI is the lower one, with resistivity values ranging from 93.1 to 97.3 ohm m-1, a thickness of 28–32 m and a contact depth between 51 and 72 m. This resistive unit may correlate with outcropping geological units, but the absence of drillings makes it difficult to identify. However, the resistive contrast indicates some form of lithological change in the Cretaceous sediments. Resistive unit V is above it, exhibiting a wider range of resistivity (234–439 ohm m-1), variable thickness ranging from 12 to 31 m and a shallower ceiling depth (18–33 m). Due to its shallower position, it is correlated with observations in outcrops (Kr-I, -II and -III; see Fig. 6). It appears that these sediments correlate with formations at the base of the Gustav Group or possibly the Nordenskjhold Formation, potentially with a discordant contact with the marine shales and mudstones of the underlying Trinity Group, although this has not been verified in the area.
Till deposits (Pleistocene?)
These deposits are observed along the coast during low tide and may also extend into the offshore depths. They consist of coarse gravel and large boulders. They appear to have a somewhat semi-parallel orientation to the coast, directly overlying the Trinity Group.
It was observed that some large erratic boulders may be present in the subsurface of the study area above either the Trinity Group and/or the Gustav Group. While some are observed in the coastal zone, there are no surface outcrops or drillings to confirm this. For the same reason, it cannot be assured that it constitutes a continuous deposit beneath the Holocene-age till deposits (III-10). Due to their particular intertidal location, they are interpreted as older till deposits than those exposed on the surface. A possible Pleistocene age is attributed to them, although with uncertainty due to the difficulty in dating these deposits and their limited presence.
Low-plain till deposits (III-10)
These deposits are characterized by coarse clastic fractions, gravels and blocks with low clay and silt contents, although they have intercalated facies of finer fractions. They extensively cover the region, forming an extensive plain between ~3 and 10 m a.s.l., and they are similar to the till deposit sequence (III-10) in the high plain. In the subsurface, they are included in resistive units II and IV, distributed throughout the western plain (W-ZONE). Resistive unit II exhibits a range of resistivity values between 1415 and 7291 ohm m-1, and as it is the first resistive and outcropping layer, the thickness and depth ranges (from 1.4 to 1.6 m) coincide. The dispersion in resistivity could be due to differences in saturation, the development of the seasonal free aquifer and the presence of ice at the base of the deposit. Below this unit is resistive unit IV, which shows a less dispersed range of resistivity values between 198 and 1049 ohm m-1, with a thickness ranging from 1.6 to 31.3 m and a depth of the base of between 3.0 and 32.8 m. This suggests that this unit contains more fine material at depth and perhaps less ice content, forming part of the permafrost. Below this resistive unit, resistive units V and VI are recognized, representing the response of the aforementioned Gustav Group sediments. Notably, the zone of greater thickness and depth recorded in the VESs coincides with the structural control of a possible contact zone between the Trinity Group and the Gustav Group. These deposits are considered correlatable with geomorphological stage III and geological unit 10 as defined by Montes et al. (Reference Montes, Nozal, Del Valle, Martín-Serrano, Heredia and Gallastegui2019) in Bahía Esperanza, and they are assigned a Holocene age. However, there is previous evidence of coastal marine reworking, probably related to the isostatic rebound of the coast, forming marine terraces at 5 m a.s.l. with a possible age of 4–3 ka (Ingólfsson Reference Ingólfsson, Ehlers and Gibbard2004). This is inferred from the cordiform disposition with little topographical expression of the mentioned deposits, observable up to ~5 m a.s.l. In a flat relief and with small changes in sea level or even isostatic adjustment, the plain can easily be inundated or emerge (Fig. 6). This unit is undergoing current fluvio-nival reworking.
High-plain till deposits (III-10)
The high-plain deposits are composed of coarse clastic fractions, gravels and blocks with slightly higher clay and silt contents in the matrix compared to the previous unit. There is a horizon of ~0.2–0.3 m at the base of these deposits. Situated between the moraine and the low plain, they are separated by a topographical rise. Between 15 and 20 m a.s.l., we find the high plain, with a terraced appearance and smaller extent where these deposits are located. In the flatter area, their thickness is relatively limited, ranging from 0.7 to 2.0 m, and they overlay the shales of the Gustav Group. As we approach the moraine, this material becomes covered by more recent slope deposits and cryoeluvium, increasing the clastic thickness by several metres. These deposits are included in resistive unit IV, similarly to the previous case, as they consist of unsaturated or water-saturated gravels at the base, albeit with more fine material. Although these deposits are similar to the previous ones, they are considered correlatable with geomorphological stage III and geological unit 10 as defined by Montes et al. (Reference Montes, Nozal, Del Valle, Martín-Serrano, Heredia and Gallastegui2019) in Bahía Esperanza, with a Holocene age assigned to them. Given their terraced morphology and elevation, it is probable that they have been reworked by the sea, suggesting a relationship with glacio-isostatic uplift, hanging as marine terraces between 10 and 15 m a.s.l., similarly to what Montes et al. (Reference Montes, Nozal, Del Valle, Martín-Serrano, Heredia and Gallastegui2019) propose in Bahía Esperanza.
Morainic deposit (IV-10)
In the area, there are the current morainic deposits from the Rosamaría Glacier. This is the most characteristic topographical feature, running almost in a north-south direction, with the base starting at ~10 m a.s.l. (in the northern and southern parts of the unit) and reaching a maximum height of 66 m a.s.l. (in the central area). Buried ice is observed at depths ranging from 0.3 to 0.9 m, covered by lithological layers of poorly sorted coarse gravels with erratic boulders. The northern end of the moraine presents sandy sediments without gravels, with a greenish-brown colour, and buried ice. This could be an older fluvioglacial level resulting from the reworking of the moraine itself or an emerged beach level. Experiments at three electrical test pits were conducted, which showed very high resistivity values between of 35 000 and 50 000 ohm m-1 in the first metres and even higher values at shallow depths, similarly to measurements obtained from other studies in the region (Ermolin et al. Reference Ermolin, Silva Busso, Marinsek and Seco2017). These are the highest resistivity values detected and are interpreted as gravel deposits with a greater ice content, forming part of an ice-rich lateral moraine. These deposits are correlatable (similarly to high-plain till deposits) with geomorphological stage IV and geological unit 10 as defined by Montes et al. (Reference Montes, Nozal, Del Valle, Martín-Serrano, Heredia and Gallastegui2019) in Bahía Esperanza, with a Holocene age assigned to them.
Slope or hillside deposits (V-11)
Weathering processes such as cryofracturing (thermoclasty), taking advantage of lithology or discontinuity planes, lead to the granular disintegration of the original rock. Locally, this is a very intense process that primarily affects the Cretaceous-age shales of the Gustav Group, resulting in unconsolidated, poorly coherent, heterometric clasts and angular blocks with varying proportions of finer matrix. The grain size of these deposits varies, although the most common clasts range between 4 and 20 mm. The dominant lithology is Cretaceous-age shales. These deposits are found at the base of the western slope of the moraine and accumulate as conical deposits, forming slopes and talus cones or fan-shaped accumulations, covering previous geological deposits. They are relatively easy to identify due to the change in slope between the slope of these deposits and the moraine slope, the latter having a steeper gradient. The slopes can be continuous, individual or multiple, spaced along the western flank of the moraine, and the fan-shaped accumulations are observed at the outlets of small-scale avalanche palaeochannels. There is no evidence of movement due to ice thawing; they exhibit a deeper active layer than is detectable in the other units (up to 2 m). The ice gradually increases in depth due to water infiltration and subsequent freezing, but there is no evidence of an ice core as observed in the moraine. Four VES measurements were conducted in these deposits (VESs 27, 28, 29 and 30), which show a gradual increase in resistivity with depth. A clear upper layer is distinguished at a depth and thickness of 1.28–1.52 m and a resistivity of 175–390 ohm m-1, attributed to the slightly deeper than average active layer locally. This is followed by a second layer with resistivity ranging between 630 and 1130 ohm m-1, with relatively little ice (< 20%) and a thickness of between 2.6 and 3.6 m. Below these layers, the resistivity of the third layer increases significantly between 14 200 and 28 300 ohm m-1 and is attributed to buried ice in the moraine underlying the deposit. Although the descriptions are not identical, it is considered that these deposits are correlatable with geomorphological stage V and geological unit 11 as defined by Montes et al. (Reference Montes, Nozal, Del Valle, Martín-Serrano, Heredia and Gallastegui2019) in Bahía Esperanza and are of current or very recent age.
Marine deposits (V-12)
Marine deposits consist of gravels and subordinate sands arranged in coastal ridges, where some recent marine megafauna fossils may be found. They encircle the periphery of Cape Welchness and are observed in the coastal area at the intertidal zone at the base of a topographical rise of ~1 m in height. This current gravel ridge often hinders proper drainage of the low plain, leading to the formation of lakes. The ridge, in a way, marks the boundary of current and past marine influences. In the restored aerial photograph shown in Fig. 6, previous coastal alignments or palaeocoastlines that support the interpretation of recent Holocene marine reworking of till deposits can be seen. This observation is of geomorphological significance and will require further detailed study. In the subsurface, this deposit is recognized as part of resistive unit I as a lateral resistivity change observed in VES 26, which was conducted along the coast where outcrops contain salt water. It has a resistivity value of 5 ohm m-1 and a thickness and depth of 1.25 m. These deposits are considered correlatable with geomorphological stage V and geological unit 12 as defined by Montes et al. (Reference Montes, Nozal, Del Valle, Martín-Serrano, Heredia and Gallastegui2019) in Bahía Esperanza. In Cape Welchness, these deposits are found > 2 m a.s.l. and are presumed to be more recent than the Holocene till deposits in the low-plain area, making them relatively current. However, the glacioeustatic dynamics in Cape Welchness should be further reviewed because there are indicators such as palaeocoastal alignments in the low-plain or sandy deposits at the northern end of the moraine that could allow for new or more complete interpretations.
Deltaic deposits (V-13)
The transport of fine sands, silts and clays by current fluvioglacial systems deposits them in the estuarine areas of the creeks when they reach the marine coast or lakes (Gabriela María stream to the north and Rosamaría stream to the south), where deltaic deposits of limited extent are visible during low tide. These deposits are considered correlatable with geomorphological stage V and geological unit 13 as defined by Montes et al. (Reference Montes, Nozal, Del Valle, Martín-Serrano, Heredia and Gallastegui2019) in Bahía Esperanza, and they are assigned a recent age.
Fluvioglacial deposits (V-14)
This lithological unit is observed to the north-west and south-east of Cape Welchness, between the moraine and the front of the Rosamaría Glacier. Its lithological composition is similar to till deposits and is primarily composed of medium and fine gravels with little sand and scarce fine material. Fluvioglacial deposits are assumed to overlay and develop on the underlying morainic deposits, and, in fact, they would be a reworking of these deposits by the current fluvioglacial systems (Gabriela María stream and Rosamaría stream), which are very active during the summer periods. In the subsurface, it is considered that fluvioglacial deposits are represented by resistive unit I, with resistivity values ranging from 474 to 513 ohm m-1, a thickness and depth ranging from 1.4 to 1.9 m and with greater depth closer to the coast. Below this, the response attributed to resistive unit III is observed, with resistivity values ranging from 1022 to 5267 ohm m-1, a thickness ranging from 3.1 to 15.5 m and depths ranging from 4.6 to 17.5 m. These values support the interpretation that morainic layers richer in ice underlie these fluvioglacial levels reworked by fluvial action. These deposits are considered correlatable with geomorphological stage V and geological unit 14 as defined by Montes et al. (Reference Montes, Nozal, Del Valle, Martín-Serrano, Heredia and Gallastegui2019) in Bahía Esperanza, and they are assigned a recent age.
Fluviolacustrine deposits (V-15)
Fluviolacustrine deposits are deposits of fine material, primarily composed of unconsolidated silt, clay and some very fine sand, with a brown colour. They are shallow and of very limited thickness, ranging from 0.2 to 0.5 m. These deposits are found on the high plain, approximately in the centre of it and at the base of the moraine. They are located in a relatively low position with respect to the surface of the high plain and are in contact with the Gustav Group, as it is situated at shallow depths. They are interpreted as fluviolacustrine deposits as they accumulate winter snow that melts in the summer, forming a very shallow and ephemeral body of water that is drained by small creeks, drying up by mid-summer. These deposits are considered correlatable with geomorphological stage V and geological unit 15 as defined by Montes et al. (Reference Montes, Nozal, Del Valle, Martín-Serrano, Heredia and Gallastegui2019) in Bahía Esperanza, and they are assigned a recent age.
Cryogeological aspects
The analysis of permafrost characteristics has been based on direct observations complemented with geoelectric methods. Permafrost is considered continuous in almost the entire study area because the mean annual temperatures of -6.5°C or lower, which are considered by Brown (Reference Brown1967) as the boundary between continuous and discontinuous permafrost, occupy 90% or more of the surface area, except in the coastal zone. This assertion is particularly valid in the moraine; however, thawed areas in the eastern fluvioglacial plains (taliks) are relatively extensive compared to the total area. In the fluvioglacial plains in the east and the high and low plains in the west, most of the thawing and development of the active layer occur in summer.
In the samples taken at the lithological control points, grain size and total moisture content (Wt) were determined. The distribution of permafrost in the Cape Welchness area, distinguishing between epigenetic, singenetic and cryopeg, is presented in the map shown in Fig. 8. The permafrost is of the dry type, with a moisture content of < 10% (Ermolin Reference Ermolin and Silva2009).
Simplified geocryological map of Cape Welchness (Dundee Island). A more detailed map is provided in the Supplemental Materials.

At the various sampling depths, an unsaturated zone is observed up to the permafrost table (SPM03 and 04). This condition changes at greater depths, even in those boreholes where the suprapermafrost-free aquifer is encountered (SPM01, 02 and 05). The thickness of the active layer remains relatively constant throughout the area, averaging 1.25 m and becoming slightly deeper towards the eastern fluvioglacial plains area, reaching up to 2 m due to the influence of glacial-water discharge in creeks and the sediments themselves. As the previous studies in this area have been conducted in the summer, there are high-quality data available on the suprapermafrost zone. However, the absence of deeper boreholes or Circumpolar Active Layer Monitoring (CALM) stations (Nelson et al. Reference Nelson, Brown, Lewkowicz, Taylor, Molau and Molgaard1996) limits the analysis of the permafrost. Nevertheless, the resistivity response from the VES allows for hypotheses to be proposed regarding the boundary between the permafrost and the infrapermafrost zone.
There is no observed drop in resistivity below resistive unit VII. The response of resistive unit VII is attributed to the Trinity Group, which is a hard rock that does not exhibit resistive contrast at depth due to changes in temperature from negative to positive. As there is no resistive contrast, it is difficult to determine the lower limit of the permafrost. Depths measured at other sites on the peninsula at similar latitudes, ranging from 120 to 130 m, can be used as a reference (Ermolin Reference Ermolin and Silva2009, Silva Busso Reference Silva Busso and Mazzini2009). Next, we will analyse the hydrological and hydrogeological aspects of the talik zones.
Epigenetic permafrost
The geological units attributable to epigenetic permafrost are the outcropping rocks of the Gustav Group, the till deposits of the upland plain, the fluviolacustrine deposits, fluvioglacial deposits and slope deposits (cryoeluvium). The rocks of the Gustav Group are hard rocks that outcrop on the high plain and are found at depths of several tens of metres below the 0°C isotherm. Any ice that is present is located in fractures, joints and shallower discontinuities resulting from the infiltration of snowmelt water during the summer. Ice percentages are estimated to be < 1%, so the resistive responses of resistive units VI and VII are minimally influenced by the ice content.
Drillings have shown that the till deposits of the upland plain have limited thickness (0.7–2.0 m) and may even disappear, exposing Gustav Group outcrops in areas of fluvial-nival erosion on the plain. Due to the lower fine material content, the Wt values are slightly higher, at ~8–10%. The measured thickness of the active layer is 1.2 m. The resistive response is not significantly different from that of the lower-plain till deposits, which are considered part of resistive unit IV. This contrasts with resistive unit VII attributed to the Gustav Group (see Table IV). The limited thickness and lack of evidence for buried ice suggest that the permafrost in this unit is epigenetic.
The fluviolacustrine deposits on the upland plain consist of fine material, are not very thick and have low permeability. Snowmelt inundates the low-lying areas in summer, and then, over the course of the summer, water either evaporates or drains away, leaving very little ice content that could not be identified using geoelectric methods. An extensive unit of this cryo-formation consists of fluvioglacial deposits to the east of the moraine and to the north and south of Cape Welchness. Because they are in direct contact with polythermal glaciers and receive water input from glacier ablation in this area, the permafrost is discontinuous with well-developed talik areas. Samples SPM01 and 02 taken in this unit show that in the surface layer between 0 and 0.2 m deep, the Wt value ranges from 4% to 8%. In the depth interval of 0.2–0.4 m, the variation is between 6% and 12%, and in the interval of 0.4–0.6 m, Wt ranges from 11% to 16%. It is interpreted that resistive unit I represents this cryo-formation, and thawing can reach depths of up to 3 m in talik areas where water probably circulates, possibly throughout the year, through the sediments. On the other hand, the retreat of the glacier front over the past 50 years has also expanded the surface of the cryo-unit. At depth, resistive unit III may represent increased ice due to infiltration and even buried ice inherited from the original moraine upon which the fluvioglacial plain developed.
Syngenetic permafrost
The syngenetic permafrost is the most extensive cryo-formation in Cape Welchness, encompassing the till deposits of the lowland plain in the western zone and the moraine. In the lowland plain, the permafrost within the till deposits develops an active layer ranging from 1.5 to 2.0 m in maximum depth. The Wt values measured at point SMP05 in the active layer, from the surface to its base, fluctuate between 4% and 8%, indicating a relatively low ice content. The permafrost roof showed underground ice from cementation or infiltration, although buried ice has not been detected, it is not ruled out in deeper layers. Resistive units II and IV are associated with this cryo-unit (see Table IV), and their resistive contrast could indicate a greater ice content at depth and even the presence of buried ice.
The lowland plain features gentle undulations with only a few metres of difference in elevation, especially at its outer edges bordering the sea. This is due to small creeks eroding it, particularly in the southern area. These creeks are temporary and of limited extent. Therefore, not all of them develop talik areas; this process has only been confirmed in Lobería and Verde creeks (Fig. 2). On the other hand, the moraine of the Rosamaría Glacier has a visible buried ice core on its eastern flank. The ice is covered by clastic sediments ranging from coarse gravel to sand, silt and clay. The high ice content of the moraine results in two geocryological characteristics: the first is observed on the western flank of the moraine with slopes of > 45° and a large accumulation of slope deposits (cryoeluvium) at its base due to erosion of the moraine. The second is observed on the eastern flank, which has less pronounced but still elevated slopes, and where lobes of gelifluction are identified in the south. Additionally, intense thermokarst and thermoerosion processes are observed simultaneously with fluvial erosion of proglacial creeks that expose the buried ice. This side of the moraine features a set of numerous small and shallow water bodies, varying greatly in size, resulting from thermokarst processes occurring at various elevations. The development of the active layer throughout the unit is notably less than in other areas, ranging between 0.6 and 0.8 m, and the permafrost roof is cemented by seasonal freeze ice. The sample from point SMP04 shows an increase in Wt compared to the SMP05 sample, ranging between 8% and 9% in the surface layer and up to 15% at depth.
Cryopeg permafrost
Given the characteristics of the area, coastal permafrost is expected to be present in the current marine reworking zone. To characterize the coastal permafrost, experiments involving microelectrical sounding and two electrical pits were conducted in coastal outcrop areas of the Trinity Group in the southern beacon area, practically at 0 m a.s.l. (Fig. 8). The electrical pits (Cal-01 and Cal-02) reached approximate penetration depths of 2.0–2.5 meters directly over the outcropping rocks of the Trinity Group during low tide, obtaining resistivity values of 69.76–89.14 ohm m-1.
The microelectrical sounding, designated as SEV 26, was carried out on the intertidal zone at the base of the cliff where the cryopeg is expected to be found. A first resistive horizon of 6.19 ohm m-1 and 1.3 m in thickness was identified, attributed to the cordiform gravel facies that form current beach levels containing salt water. A second layer presented a resistivity of 45.00 ohm m-1 and a thickness of 7.3 m, attributed to the wedging of bottom till deposits of the lowland plain, probably containing fresh water or brackish water. Below this layer, a change to a third layer with a resistivity of 11.00 ohm m-1 was detected, attributed to the Trinity Group, which may contain water in its fractures and infiltrated sea water due to geological contact with the Quaternary sediments. According to the experiments conducted involving microelectrical sounding and the electrical pits, the cryopeg is limited to the intertidal zone, exhibiting typical stratification of less saline waters from the suprapermafrost aquifer, the ingress of sea water and minimal ice.
Hydrological and hydrogeological aspects
To understand the hydrological systems in proglacial and periglacial areas, it is necessary to understand the dynamics of the ice bodies present in these systems. However, the dynamics of the Rosamaría Glacier have not yet been formally addressed. Existing mapping and campaigns conducted since 2001 have allowed for partial monitoring of the dynamics of the ice body front. The glacier front was delineated using GPS during the summers of 2004, 2017 and 2023. Additionally, photogrammetric mapping and aerial photography from 1970 were used to create the Base Petrel Hydrological Sheet (SHN 1970). The frontal slope was surveyed during the winters of 2016 and 2017. The transects are nearly coincident in direction, but unfortunately only the one from 2017 aligns with the glacier's edge. All of these boundaries and transects have been georeferenced and can be observed in Fig. 9, where the progressive retreat of the glacier body and the topographical descent of the surface can be seen.
The various front boundaries of the Rosamaría Glacier over the last 50 years.

In 1970, the glacier front was located on the current moraine, reaching an elevation of 50 m a.s.l., and the fluvioglacial plains practically did not exist. By 2023, the glacier front had retreated to the east, reaching a maximum elevation of ~30 m a.s.l., resulting in the development of the fluvioglacial plains. Based on this information, an annual retreat rate can be calculated. From 1970 until 2023, the glacier front retreated, depending on the measured area, by between 250 and 400 m to the east, resulting in a retreat rate ranging from 4.8 to 7.7 m/year. Year by year, the extents of the eastern flank of the moraine, the bottom till deposits and the surface of the fluvioglacial plains have been increasing. The period used for this calculation of 52 years is relatively short, and therefore the calculated rate should be considered as a valid estimate only for that period. Given the latitude and average temperature, it would be a polythermal glacier (French Reference French2007, Bennett & Glasser Reference Bennett and Glasser2009), similar to others in the northern part of the peninsula (Ermolin et al. Reference Ermolin, Silva Busso and Glazovskiy2015) that contribute significantly to groundwater (Falk & Silva Busso Reference Falk and Silva Busso2021), leading to extensive talik areas and feeding the channels and lakes on the fluvioglacial plains (Scravaglieri Reference Scravaglieri2021). Consequently, proglacial drainage networks are usually the densest and most extensive, hosting the largest lenticular systems and exhibiting the greatest hydrological discharges. On the other hand, creeks and discharge volumes depend on glacial dynamics, especially changes such as retreat, as in the case for the Rosamaría Glacier, which continually modifies drainage networks.
Hydrology
The study area has two types of water basin (Silva Busso Reference Silva Busso and Mazzini2009): those fed by glacier ablation and those fed by snowmelt. The ones fed by glacier ablation are located to the east of the Rosamaría Glacier moraine, where a highly dynamic geomorphological environment is observed.
Laguna Grande is located at the watershed, draining through the Rosamaría stream in a north-south direction. On the other hand, the Gabriela María stream flows in a south-north direction, almost from the same location as the former but not from the same lake (Figs 2 & 10).
Glacier creeks: a. Gabriela María Creek and b. Rosamaría Creek (east vertical electrical sounding zone).

During January, creek profile assessments were conducted and flow velocities were measured at temporary gauging stations in both creeks, yielding the results shown in Tables V & VI. Field observations indicate that these creeks are in discharge from early December to late March, practically throughout the summer. The basins fed by snowmelt are located to the west of the moraine, where the high and low plains are situated, and the most significant creeks are over these areas.
Mean, minimum and maximum discharged (in m3/day) of the main creeks of Cape Welchness. E-VES = east vertical electrical sounding zone; W-VES = west vertical electrical sounding zone.

Locations and characteristics of the main lakes in Cape Welchness.

Only three creeks have the size and magnitude to allow for discharge data collection: Verde Creek (VR00), Preguntón Creek (PR00) and Lobería Creek (LR00; Fig. 11). However, these data are indicative only and represent an order of magnitude, as they primarily depend on snowfall accumulated during the winter.
Snow/suprapermafrost creeks: a. Verde Creek and b. Lobería Creek (west vertical electrical sounding zone).

According to field observations, snowmelt begins in mid-December, with significant discharge occurring during the first 15 days, followed by much lower flow rates depending on summer temperatures and the availability of accumulated snow. These creeks maintain their flow even in summer when the snow has melted, and precipitation is minimal, as they drain the suprapermafrost aquifer that develops in the plains at the beginning of summer. To quantify the discharges, a hydrological station has been installed, which operates only in the summer.
The selection of measurement points took into account the creeks’ summer steady flow regime and their stability over time, choosing locations where the largest amount of water converges. Table V presents the mean, minimum and maximum discharges (in m3/day) of the main creeks of Cape Welchness.
The periglacial zone, which is not linked to glacial dynamics, is characterized by snowmelt or suprapermafrost water contributions during the summer. This results in low-flow, shallow and temporally intermittent creeks. The water bodies are small, shallow and often form closed taliks. Although there can be significant variations, the surface-water discharge in January has been estimated to be the most significant of the year. Thus, the Rosamaría and Gabriela María creeks, fed by the glacier, discharge 2.01 Hm3/month.
The snowmelt-fed creeks and, eventually, the active layer of permafrost discharged 0.04 Hm3/month in January. This means that 98% of the water discharge comes from the glacier-fed creeks in the E-VES zone, while only 2% of the water discharge is related to the snowmelt creeks in the W-VES zone.
Lentic systems
Lakes fed by snowfall are mostly located in the moraine. They are bodies of water with small surface areas, shallow depths and even are ephemeral, as their water can percolate during the summer. All of them are the result of intense thermokarst and thermoerosion processes in the moraine, as is shown in Fig. 12.
a. Thermoerosion (eastern slop moraine) and b. thermokarst (summit moraine).

The most persistent group identified between 2001 and 2023 consists of three lakes (Petrel, Yesica and Nélida) located in the central part of the moraine at various elevations. These lakes have a clear surface and underground connection. Slightly higher is Lake Camila, probably also connected underground. The underground connection appears to be through a closed talik common to all of these lakes and the surface channels that connect them, as evidenced by the presence of thermokarst depressions and thermoerosion processes clearly identifiable in the field.
The other lakes are linked to glacial discharge and are located in the fluvioglacial plains. Petunia Lake is located in the southern fluvioglacial plain, receiving surface runoff from Rosamaría Creek and underground contributions from the current glacier front. It is a perennial lake, and its existence has been known of since at least 2004. The second is Lake Grande, distinguishable since the summer of 2015, which has increased in surface area and volume with the retreat of the glacier front until 2023, forming one of the largest bodies of water in the area. It is located on the watershed between the fluvioglacial basins of Lake Rosamaría and Lake Gabriela María, and while it currently drains into the former, there palaeochannels indicate that it drained into the latter in previous years. The third was Lake Paso Doble, located between the fluvioglacial plain and the moraine. Originally, the lake bisected the moraine, forming a north-east to south-west-oriented gap or col.
Until the summer of 2017, the water was naturally dammed on the western side of the moraine, preventing drainage to the south-west. After the dam broke in 2018, it was observed that it consisted of a mixture of sediments with a high ice content and recrystallized snow. The hydrostatic pressure of the lake, during a summer of intense ablation, broke the closure, creating a small flow of mud. Since then, the body of water has become an ephemeral creek that crosses the gap in the moraine, draining from north-east to south-west. The natural dynamics of these environments make their precise and enduring characterization difficult, which is why the larger and relatively perennial lentic bodies, or at least those that have been so in the last 25 years, have been cited.
Based on the areas measured in the summers of 2017 and 2023, the total surface area of the mentioned water bodies is 24 118.51 m2: 2349 m2 (9%) in the moraine and 21 789.51 m2 (91%) in the fluvioglacial plains or linked to their dynamics. The remaining water bodies have very little surface area and are considered ephemeral. Similarly to that observed for runoff, this quantification is more valuable in a relative sense than in terms of absolute surface area, indicating that those lakes linked to glacial water discharge occupy a much larger area than the others. Figure 13 shows two typical examples of lakes linked to glacial discharge and snowmelt.
a. Lake Grande of glacier supply and b. Lake Petrel of snow supply (east vertical electrical sounding zone).

Hydrogeology of talik zones
The study area exhibits thawed sectors in the permafrost during the summer, which is due to the development of the active layer and the presence of closed and open taliks, some of which are perennial. The thawing of the active layer of permafrost reaches depths of between 0.65 and 0.85 m. This range depends on various factors, with lithology being the most significant, both in terms of rock type and particle size. Moisture content and consolidation degree, which are often approximated from the literature or other data, are also important due to their influence on heat capacity. Geoelectric methods are more useful for assessing thaw depth, although they were limited at the time of data collection. Using these methods across the entire study area, it has been observed that the active layer and suprapermafrost processes are represented within the response of resistive unit I. This holds regardless of the involved lithology, and it results in thaw depths of up to 1.25 m on the western plains, 0.8 m on the moraine and 1.5 m on the fluvioglacial plains in the east. There may be a prior relationship between the cryounit type and the interpreted active-layer thaw depth using VESs. Epigenetic cryoformation shows deeper thaws between 1.25 and 1.50 m and slightly deeper thaws on the fluvioglacial plains, reaching almost 2 m near the creeks. Singenetic cryoformation represented by the moraine reaches 0.8 m or even less. Cryopeg also has its own thawing characteristics; the first layer of VES 26 indicates a thaw depth of 1.25 m, but the lower layers have very low resistivities, which may indicate deeper thawed sectors, a typical aspect of this cryoformation. Suprapermafrost drilling data reach similar depths and allow for validation of interpretations based on VESs.
Figure 14 presents the suprapermafrost hydrogeological map and drainage network, the main lenticular systems in the study area, aquifer types, piezometry of the lowland suprapermafrost aquifer and the more developed talik zones. Figure 14 was created using the topography of Lusky et al. (Reference Lusky, Del Valle and Izquierdo2005) with the aid of aerial photographs from the 2001 aerial photogrammetric survey and corrected in the field during the summer of 2004–2005.
Simplified hydrogeologic map, drainage pattern and suprapermafrost map of Cape Welchness. A more detailed map is provided in the Supplemental Materials.

Due to the rapid dynamics of change that are common in these proglacial environments, the drainage network and lakes were reviewed and updated in subsequent summers (2016, 2017, 2022 and 2023). The groundwater discharge process in this type of environment has been studied by Falk & Silva Busso (Reference Falk and Silva Busso2021) in the South Shetland Islands; in this case, discharge occurs on the coast, but the necessary information to quantify it is not yet available. Notably, there are convex landforms with low relief (0.5 m in height), interpreted as frost mounds following the concept described by Trombotto Liaudat et al. (Reference Trombotto Liaudat, Wainstein and Arenson2014). These mounds are located in the lowland and near the creeks that flow through it (Fig. 14). They result from the freezing of the soil and the accumulation of injection ice resulting from groundwater movement, causing their convex shape. Several types of frost mound can be distinguished based on their structure, duration and the characteristics of the ice they contain. The so-called VES 32 was performed on the mound to improve the interpretation, detecting a resistive horizon of 8862 ohm m-1 at a depth of up to 1.20 m and a second layer with a thickness of 0.53 m showing a resistivity of 36 826 ohm m-1, reaching a depth of 1.73 m. These high resistivity values are related to increased ice content in the uppermost part of the landform. Below the described structure, a layer with a resistivity of 851 ohm m-1 is observed, a value comparable to resistive unit IV attributed to the till deposits of the lowland plain, precisely where these mounds are located. Because this landform represents evidence of suprapermafrost groundwater, it has been interpreted in two ways: as seasonal frost mounds with an ice core or as icing mounds, corresponding to the piezometric map in Fig. 14 with flows discharging into the area where the mounds are located (Fig. 15). Manual drillings reached depths ranging from 0.75 to 2.25 m, stopping based on the depth of the permafrost ceiling, which completely hindered further progress. The average depth is 1.20 m, with 0.75 m in the moraine and 2.25 m in the Lobería Creek area, the latter being due to the development of talik. All drillings encountered the free suprapermafrost aquifer with an average saturated thickness of 0.80 m of water column. The static water level reaches an average depth of 0.42 m, a maximum of 0.98 m and a minimum of 0.05 m. The most recognized talik zones are indicated on the map in Fig. 14.
a. Suprapermafrost aquifer area; b. frost mound in the lower plain; and c. static level in the suprapermafrost aquifer of the lower plain.

These are areas of anomalous thawing where the permafrost ceiling can be < 2 m in depth, typically near river channels and the coastal zone. Two of them develop in the glacially fed creeks of María Gabriela and Rosamaría and in the current glacier front zone. The other two, also with thaw depths > 2 m, are found at the mouth of the Lobería and Verde creeks, where frost mounds are also located. It is assumed that these taliks are open based on their arrival at the sea and the reduction in sediment thickness, although this has not been validated. The other talik zones surround the moraine lakes and show similar anomalous thawing but are related to thermokarst processes. They are localized and are considered closed taliks.
Hydrochemistry
The available literature extensively describes the functioning of hydrochemistry in the surface waters of the lakes and streams in the Antarctic Peninsula area, establishing classifications of dissolved sources based on their kinetics (Lecomte et al. Reference Lecomte, Vignoni, Cordoba, Chaparro, Chaparro and Kopalova2016) and explaining how weathering influences lake chemistry, along with sea spray, dilution and evaporation (Lecomte et al. Reference Lecomte, Vignoni, Echegoyen, Santolaya, Kopalová and Kohler2020). However, studies focused from a hydrogeological perspective are much scarcer. Some work is available at a very local scale, such as those carried out on the South Shetland Islands and Marambio (Seymour) Island (Silva Busso Reference Silva Busso and Mazzini2009) or at Lamb Cape (Vega Island; Moreno et al. Reference Moreno, Silva-Busso, López-Martínez, Durán-Valsero, Cuchi, Ermolin and Martíneznavarrete2012), which are areas sensitive to climatic variability and where water input comes from permafrost. In Table VII, we present details of the sampled points at Cape Welchness discussed in this study. In all models, the relationship between water bodies depends on the development of the active layer during the summer, so hydrochemistry shows a strong connection with the bedrock. This aspect is further expanded upon in Silva Busso et al. (Reference Silva Busso, Yermolin and Manograsso Czalbowski2013), also in Cape Lamb on Vega Island, where they analyse the impacts of pH, electrical conductivity, HCO3/Cl ratio, D/18O ratio and SO4/Cl ratio on the functioning of the suprapermafrost geocryological environment. These authors highlight the SO4/Cl ratio as a hydrochemical indicator of water input from the ablation of the active layer of permafrost. It is possible, according to French (Reference French2007), to discriminate between glacial meltwater that has been in contact with bedrock and meltwater that has not been in contact with bedrock. Hatton et al. (Reference Hatton, Hendry, Hirst, Opfergelt, Henkel and Silva-Busso2020), using dissolved silicon concentrations and its isotope, δ30Si, determined that glacier-fed creeks in Potter Peninsula, South Shetland Islands, behave very similarly to Arctic and subarctic glacier rivers.
Hydrochemical sample points in Cape Welchness.

Seco (Reference Seco2018), in Devil Bay, Vega Island, analysed the water input from lakes and the proglacial creek, classifying them as sodium chloride and/or sulphate waters. Additionally, there was an observed tendency for the lakes to exhibit sulphate-chloride facies, which may indicate that they are in closed talik zones and that, over time, this salinity could increase. It has also been highlighted that this might be due to the marine spray influence (Roman et al. Reference Roman, Nedbalova, Kohler, Lirio, Coria and Kopacek2019), given the proximity of all bodies of water to the coast, making it challenging to interpretate the water's hydrochemistry in Devil Bay (Seco Reference Seco2018, Scravaglieri Reference Scravaglieri2021). The hydrochemical classification of the waters of Hope Bay allows for distinguishing three complex hydrochemical facies: sodium-calcium bicarbonate facies, calcium and/or magnesium sulphate and/or chloride facies and sodium chloride and/or sulphate facies. The sodium-calcium bicarbonate facies are related to the main local water bodies (Laguna Boëckella and Buenos Aires), which are linked to glacier discharge and snowmelt ablation during the summer, receiving subglacial input with minimal water-rock contact. The calcium and/or magnesium sulphate and/or chloride facies are observed in creek samples, especially at their outlets. Given the magnitude of the penguin colony in Hope Bay, the influence of biological activity and leachates from excreta could be relevant. In these cases, sulphate could originate from organic matter decomposition. Finally, the sodium chloride and/or sulphate facies have been found in creeks that flow into Laguna Boëckella from the Buenos Aires Glacier and the lakes in the group known as Cinco Lagunas. In this area, greater hydrochemical diversity is identified, suggesting underground input with a greater lithological influence determined by longer water-rock contact and increased water circulation in the aquifer.
The following types of sample have been differentiated based on their origin: creeks, lakes, groundwater (taken as reference), snow and glacier ice ablation waters. There is significant variability in their salinity and temperature. Samples taken from creeks have an average salinity of 198 mg/l, ranging from 19 to 312 mg/l. The average temperature is 4.8°C, ranging from 1.4°C to 11.2°C. The pH has an average value of 8.95, ranging from 8.23 to 9.32. Finally, the mean Eh (oxidation-reduction potential) is 116 mv, ranging from 72 to 152 mv. Glacier-fed creeks are located in the E-VES zone and exhibit lower salinity, pH and temperature values due to the direct input of ice meltwater and the greater flow of the creeks. Creeks that receive water from snow or permafrost inputs, located in the W-VES zone, are shallow and have low depth and flow. The input of water from the active layer and its salinity increase with temperature. Their pH values are also higher and Eh values are lower, probably because they contain algae, moss, lichens and microorganisms that influence these parameters.
Samples taken from lakes have an average salinity of 190 mg/l, ranging from 79 to 311 mg/l. The average temperature is 2.3°C, ranging from 1.5°C to 4.8°C. The pH has an average value of 8.83, ranging from 8.26 to 9.17. Finally, the average Eh value is 150 mv, ranging from 106 to 181 mv. In this case, the dispersion of salinity and temperature is significant but slightly less than in the case of creeks. Like creeks, lake waters can also have inputs from glaciers, precipitation or permafrost. The lakes receiving glacial input are located in the E-VES zone and have lower salinity, pH and temperature values because they receive direct input from the melting of glacial ice as surface and/or groundwater. The Eh is oxidative and relatively high. An important factor is that many of them are open taliks and receive groundwater that circulates through them. Lakes located in the W-VES zone tend to be shallower and are related to closed taliks, with water input coming from the active layer or precipitation. These water bodies show higher temperature and salinity values. Their pH values are also higher and Eh values are lower, probably because they contain algae, moss, lichens and microorganisms that could influence these parameters. In 80% of them, the presence of macroorganisms is observed, indicating a closed talik. These results are similar to the groundwater sample taken in the lowland plain (W-VES). In the suprapermafrost aquifer, salinities of 223 mg/l, temperatures of 0.7°C, pH values of 8.26 and Eh values of 135 mv have been measured. Samples from snow and glacier ice have low salinities (8 mg/l for the former and 15 mg/l for the latter), probably acquired from marine spray. Table VIII presents the average results of the analysis of major ionic species (17 samples).
Average concentrations of ionic species in various water environments of Cape Welchness. All data are in mg/l, unless stated otherwise.

bdl = below detection limit.
It is interesting to note that the pH levels observed in the sampled waters are very high, sometimes exceeding 9 units. These pH levels seem to indicate the presence of hydroxides, ammonium or sodium carbonates. A study of hydrochemical speciation has not been conducted as it falls outside the scope of the present work, but it would be interesting to establish the origins and effects of these elevated pH levels.
The classic hydrochemical classification works better in more northern areas because in subpolar zones water circulates quickly and shallowly with very little contact with the rock (French Reference French2007, Silva Busso Reference Silva Busso and Mazzini2009). However, if representative samples from each water environment are obtained, the hydrochemical classification can be a useful approach (Silva Busso Reference Silva Busso and Mazzini2009). Figure 16 shows the hydrochemical classification of these waters.
Hydrochemical facies in the waters of Cape Welchness.

Precipitation water exhibits a sodium chloride-sulphate facies determined by marine spray (Roman et al. Reference Roman, Nedbalova, Kohler, Lirio, Coria and Kopacek2019), the island's geographical location, summer temperatures and winds. The combined effect of these factors loads precipitation waters with salts (Silva Busso Reference Silva Busso and Mazzini2009, Seco Reference Seco2018). As a result, there is a shift from the bicarbonate-calcium facies, which are more typical in meteoric waters, to chloride-sulphate facies. Glacial ice ablation waters are characterized by a calcium bicarbonate composition, with some tendency towards sodium, which is expected for this type of water (Silva Busso Reference Silva Busso and Mazzini2009, Scravaglieri Reference Scravaglieri2021). Creek and lake facies are closely related, mostly sodium chloride-sulphate, with some calcium chloride-sulphate. The influence of marine salts is also reflected in the greater dispersion of anions. However, larger lakes tend to have calcium chloride-sulphate facies, whereas smaller ones tend to be sodium-based.
This was previously described by Seco (Reference Seco2018) in Devil Bay (Vega Island) regarding smaller lakes in closed talik zones, which tend to increase in salinity (chlorides and sulphates). The facies of the Rosamaría and Gabriela María creeks are of calcium chloride-sulphate as their waters are almost exclusively the result of glacier ablation. The others creeks tend to be more sodium-based for the reasons mentioned earlier.
Table IX displays the values of selected ionic relationships and the ‘Base Exchange Index’ (Schöeller Reference Schöeller1962), which allow for the interpretation of water interaction with the solid matrix and cation-exchange processes. Waters from glaciers and snow exhibit negative values of BEI, whereas the rest are positive. This suggests that precipitation water undergoes a hardening process upon contact with the solid matrix. The Mg/Ca ratio values obtained in creeks, lakes and groundwater range between 2.33 and 4.40, corresponding to continental waters influenced by the alteration of lithic components of basaltic origin present in the sediments, widely distributed in the area's deposits. The K/Na ratio, falling within the range of 0.020–0.025, often indicates seawater influence; the observed values range between 0.03 and 0.07. Moreover, the Cl/HCO3 ratio varies between 0.1 and 5.0 for continental waters, whereas values between 20 and 70 indicate marine origin or mixing due to saline intrusion wedges. The obtained values range from 6.46 to 15.22. The SO4/Cl ratio tends to remain constant at low salinities when sulphide oxidation is absent. In the analysed samples, values between 0.14 and 0.60 are observed, ruling out sulphide oxidation; these values indicate a glacial input origin.
Average ionic relations in the various water environments of Cape Welchness.

bdl = below detection limit; BEI = Base Exchange Index: (rCl - (rNa + rK))/rCl).
Conclusions
The Cape Welchness area is geologically distinct from the ice-covered zone described by Smellie et al. (Reference Smellie, McIntosh, Esser and Fretwell2006). Cape Welchness features outcrops of the Trinity Group and the Gustav Group. The former is visible at low tide along the coast, whereas the latter is located at the foot of the current moraine on the high plain. Both groups are angularly unconformable with each other, occurring just a few tens of metres below the surface, covered by more recent Quaternary deposits, which are also unconformable.
Quaternary deposits cover almost the entire study area, consisting mainly of glacial deposits occasionally reworked by the sea, forming an extensive plain bounded to the west by the current glacial moraine (W-VES zone).
The glacier retreat, verifiable for at least the last 50 years, has occurred to the east at a rate between 4.8 and 7.7 m/year, leading to the development of bottom till deposits and fluvioglacial plains.
The cryounits recognized through geoelectric methods have been grouped into three categories: singenetic, epigenetic and cryopeg. The singenetic cryounit (58% of the area) primarily includes the low-plain till with lower ice contents at depth and probably buried ice, as well as the current moraine with a high ice content and shallowly buried ice. The epigenetic unit (26% of the area) includes the high plain, fluvioglacial plains, fluviolacustrine deposits, slope deposits and outcrop areas of the Gustav Group. In these areas, infiltration ice dominates, with concentrations ranging from 6% to 16%. The cryopeg unit (16% of the area) occupies coastal areas, primarily in recent marine deposits.
Stratification of less saline waters from the suprapermafrost aquifer and ingress of salt water from the sea interspersed with zones of interstitial ice has been detected. Closed taliks are limited to water bodies in the current moraine fed by local precipitation. Open talik zones are well developed in water bodies and creeks directly connected to the glacier along the Rosamaría and Gabriela María creeks. Verde and Lobería creeks in the low plain also have these taliks, but they are smaller in extent and depth. In the low plain, the suprapermafrost aquifer with fresh water, vertical recharge and underground flow that circulates towards the coast develop in the summer.
The presence of injection domes is a clear indicator of underground flow, including that which might come from a greater distance.
Hydrochemistry effectively distinguishes between the various environments, with glacial ablation dominating the water supply in the area between the moraine and the glacier (E-VES) and snowmelt feeding the high- and low-plain areas (W-VES).
The sea leaves its mark on local hydrochemistry, and the analysis of ionic relationships yields results comparable to those observed at other sites in the northern Antarctic Peninsula.
It is not irrelevant to this study that the new Petrel Base will be established in the area, which will allow for the consolidation of Argentine logistics in Antarctica. Therefore, this preliminary study, while not intended to be a baseline, establishes a starting point for understanding the environmental conditions in the area.
Acknowledgements
The authors appreciate the logistical support provided by the ‘Dirección Nacional del Antártico, Instituto Antártico Argentino’ and thank the CAV 04-05 and CAV 16-17 staff from Petrel Base for the support provided during the fieldwork. This work has also received support from the State Program PID2021-125778OB-IOO, project GEOCHEM. Additionally, they thank Aitor Ormazabal and Evgueny Ermolin for their contributions in the field and the laboratory. We also thank the referees for their meticulous review and comments, which have substantially improved the final manuscript. Finally, we express our gratitude to John Stewart for his detailed review of the text and figure formatting.
Competing interests
The authors declare none.
Author contributions
ASB has been in charge of fieldwork and the conceptual development of the geological, hydrogeological and geocryological models. LM-M has conducted a critical review of the models. Both authors have contributed equally to the writing and revision of the final work.


 Open access