


1. Introduction
The technological and related innovations in insurance research and industrial practice are commonly known as “InsurTech.” The word “InsurTech,” is derived from “insurance” and “technology,” and represents the insurance segment of the wider Fintech domain. While InsurTech may still be a new term in the insurance field, research on the intersection of technology and insurance did begin in the early 2000s, with the integration of computing power to improve efficiency in calculations and business operations (Yates, Reference Yates2005). However, comparing technological involvement in operational business for the insurance sector and other economic sectors, such as banking, it is clear that the developments in insurance lag behind other sectors (Che et al., Reference Che, Liebenberg and Xu2022). Catlin et al. (Reference Catlin, Ido and Holger2018) relate the delays in InsurTech development to an adherence to established conventional practices in insurance. This has contrasted with the more dynamic integration of technology in other sectors. The first significant wave of InsurTech most likely emerged soon after 2010 and began to reshape underwriting strategies, claims management methods, and, most importantly, interaction with customers (Nisenbaum, Reference Nisenbaum2022). Rapid growth in InsurTech has been observed over the past decade, attracting billions of dollars in investment in the field. Looking to research in 2023 by NTT, a large Japanese IT service and consulting company, InsurTech experienced six years of continuous growth up until 2022, when the first slowdown was identified. According to Bruno Abril, partner, Head of Insurance at NTT DATA EMEA & Latin America, this expansion in investment has demonstrated the profitability of the new models. A significant ongoing concern relates to sustainability and security issues, which could adversely impact medium- and long-term outcomes for practitioners.
Academic reviews of the evolution of InsurTech have been considerable. Eling and Lehmann (Reference Eling and Lehmann2018) review the academic literature to summarize the impact, at the time, of digitalization on the insurance value chain. A follow-up article, Eling et al. (Reference Eling, Nuessle and Staubli2022), explores a similar theme however, this time with a central focus on artificial intelligence (AI) and related machine learning methodology on insurance practice. More recently, and in the aftermath of the COVID pandemic, Gómez and Pineda (Reference Gómez and Pineda2023) review the effect of digital advances on insurance and the status of InsurTech. They propose a modern definition of InsurTech, which relates it to technology-driven innovation in the insurance sector, which enhances data-driven solutions and customer-focused operations in a digital environment. These four papers, referenced here, all have a focus that is exclusively on academic articles. They do not benefit from the perspectives of insurance practitioners. In addition, they all adopt a manual approach to the review of literature and are therefore more limited in scope compared to bibliometric analyses. We now turn to a brief review of those analyses.
Bibliometric analyses of the InsurTech academic literature have been conducted by Milanovic et al. (Reference Milanovic, Milosavljevic and Joksimovic2021), Sultana et al. (Reference Sultana, Lima and Ahmad2023), and, most recently, by John et al. (Reference John, Joseph, Joseph, Jacob, Rose and Thomas2024). The bibliometric approach adopted in these papers enables a wider net of papers to be reviewed. In the case of all three papers, the scope includes only academic articles. Milanovic et al. (Reference Milanovic, Milosavljevic and Joksimovic2021) take a broad-based approach, including keywords that span computing and mobile technologies, modern data science, as well as telematics and wearable devices. On the other hand, Sultana et al. (Reference Sultana, Lima and Ahmad2023) and John et al. (Reference John, Joseph, Joseph, Jacob, Rose and Thomas2024) focused on InsurTech and immediately related keywords. While the scope of literature included in the review net is more extensive here, there is a notable absence of reviews of practice-related articles. Reviews of industry literature are less common, and the most notable include Gómez and Pineda (Reference Sosa and Montes2022) and Kelley and Wang (Reference Kelley and Wang2021).
Having provided this background on the relevant literature, we now turn to the key contributions of this paper. This work reviews papers, in a single study, from both practitioner and academic research. Over 10,000 academic articles (from a range of academic databases) and almost 11,000 practitioner articles are in scope for the review put forward here. In addition, this paper puts forward a thematic analysis framework that carefully considers the differences in focus of academic and practitioner publications. The YAKE! algorithm, Campos et al. (Reference Campos, Mangaravite, Pasquali, Jorge, Nunes and Jatowt2020), an unsupervised keyword extraction method, is employed throughout. In summary, considerably more articles from both practitioner and academic research are reviewed using modern bibliometric methods not previously employed in the analysis of InsurTech research. A key benefit of the approach to research applied here is that we identify leading research foci of both practitioners and academics in the field of InsurTech. In turn, we bridge the gap between the theory and practice of InsurTech and are able to put forward potential future research directions in the field.
The approach put forward in this research, while ambitious in scope, has some limitations. Keyword extraction is based on a review of titles and abstracts or, in the case of practitioner papers, introductory sections. Quantitative analysis of keyword prevalence rather than detailed thematic analysis is therefore the approach used. We favor scale over depth in review to provide new insights into the current state of InsurTech research.
The rest of this article is organized as follows. Section 2 outlines our data generation and analytical methodology; Section 3 presents the main results and discussion; and Section 4 concludes with findings and insights to inspire future InsurTech-related research and practice.
2. Data generation
2.1 Academic research dataset
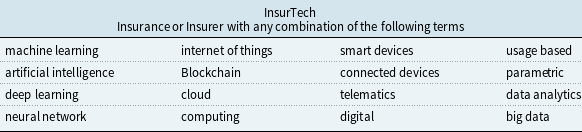
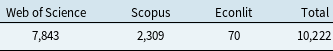
Our academic research dataset includes 10,222 journal articles published between January 1, 2000, and February 20, 2025, collected from the Scopus, EconLit, and Web of Science databases. Table 1 lists the query keys used to select these journal articles. In line with the review by Eling and Lehmann (Reference Eling and Lehmann2018) and Eling et al. (Reference Eling, Nuessle and Staubli2022), the selected query keys include emerging technologies such as blockchain, the Internet of Things (IoT) and AI, as well as their application modes such as smart devices, telematics, usage-based, and parametric insurance. The query function used is a combination of insurance-related terms and technological keywords. Figure 2 shows a sample of the query functions we applied in the EconLit and Web of Science databases when forming the academic dataset. In order for a paper to be chosen from the EconLit database, the selected keywords were required to appear in the abstract. For the Web of Science and Scopus databases, keywords were required to appear in the “topic” field, which includes the title, keywords, and abstract. To ensure accessibility, uniqueness, and relevance, we apply the Preferred Reporting Items for Systematic Reviews and Meta-Analyses (PRISMA) process to the content. We also require articles to be published in the top three quartiles of the SCImago journals, and that each article directly relates to insurance or the insurance business. The database from which the articles were sourced is given in Table 2.
Query keys

Table 1 Long description
A table titled Insurance or Insurer with any combination of the following terms. The table has 3 rows and 5 columns. Column headers are machine learning, artificial intelligence, deep learning, neural network, and cloud. Row labels are internet of things, Blockchain, smart devices, connected devices, usage based, cloud, telematics, digital, parametric, data analytics, big data. Row 1: machine learning, internet of things, smart devices, usage based. Row 2: artificial intelligence, Blockchain, connected devices, parametric. Row 3: deep learning, cloud, telematics, digital. Row 4: neural network, computing, data analytics, big data.
Academic dataset sources distribution

Table 2 Long description
A table with four rows and four columns. The columns are labeled 'Web of Science', 'Scopus', 'EconLit', and 'Total'. The rows are labeled with the number of articles from each source. Row 1: Web of Science, 7,843; Scopus, 2,309; EconLit, 70; Total, 10,222.
PRISMA diagram detailing the article collection process.

Practice articles source

Table 3 Long description
The table compares sources of practice articles across three categories: Magazines, Congress/Summit, and Consulting insights. It has three columns and five rows. The columns are labeled Magazines, Congress/Summit, and Consulting insights. The rows list different sources for practice articles. Row 1: Insurance Business Tech, Fintech InsurTech Summit, WTW, BCG. Row 2: InsurTech Insight, InsurTech Insight Asia, US EU, Bain & Company, Gallagher. Row 3: InsurTech News, InsurTech Connect, Marsh, Oliver Wayman. Row 4: InsurTech Magazine, HK Fintech Week, Aon, Capgemini. Row 5: Insurance Journal InsurTech, Congress of Actuaries EU, Global, EY, M&K.
Econlit & WoS query functions – Insurance.

Figure 2 Long description
The image displays a search interface for insurance technology topics. The search results show 11,806 results from the Web of Science Core Collection. The search query includes keywords such as insurance technology, insurtech, digital insurance, insurance machine learning, insurance internet of things, insurance smart devices, usage-based insurance, insurance blockchain, insurance connected devices, insurance deep learning, insurance cloud, and insurance big data. The search is refined by languages, document types, and publication years. The search interface allows adding keywords and creating alerts. The search is conducted in the EconLit database.
2.2 Practitioner research dataset
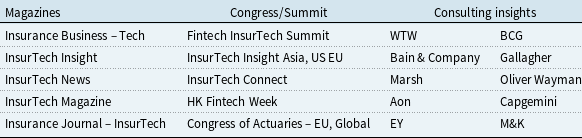
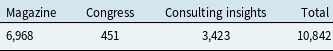
Our practice-based dataset is manually gathered from publicly accessible InsurTech magazines, conference materials, and industry insights published by leading consulting firms. Table 3 gives the selected sources for industrial articles. These were obtained by using the most relevant links from the first three pages of Google search results (search results for “InsurTech Magazine,” “Top InsurTech Consulting Firm,” and “ Insurance congress / symposium”). Magazines and congress materials are prioritized, as they provide direct discussions on InsurTech developments. To gain a comprehensive perspective on industrial views regarding InsurTech, we included insights from 10 consulting firms, mainly from their online accessible news and articles. For each collected article, we record its publication year, topic, source type, source title, and key content, if available. The PRISMA process is also applied to remove duplicates and exclude entries with insufficient information, ensuring the quality and relevance of the dataset for analysis. The final industrial dataset consists of 10,842 articles. The database from which these articles were sourced is given in Table 4.
Industry dataset source type distribution

Table 4 Long description
A table titled 'Table 3' showing the distribution of industry dataset sources. The table has four columns: Magazine, Congress, Consulting insights, and Total. The table contains the following data: Row 1: Magazine, 6,968; Congress, 451; Consulting insights, 3,423; Total, 10,842.
2.3 Keyword extraction
In forming the analysis for the collected text contents for both the academic and industrial datasets, our study employs a framework making use of the keyword extraction method to summarize the most relevant keys and phrases from a document. Keyword extraction can be completed using either a supervised or an unsupervised learning approach. Supervised learning approaches use pre-defined keywords for training the model and treat the extraction process as a classification task. The predictions of keywords in new texts, for which the keywords are not known in advance, are then made using a model developed from training data. Details of this approach can be found in Zhang et al. (Reference Zhang, Xu, Tang, Li, Yu, Kitsuregawa and Leong2006) (support vector machine [SVM]), Jiang et al. (Reference Jiang, Hu and Li2009) (Bayesian approach), and Krapivin et al. (Reference Krapivin, Autayeu, Marchese, Blanzieri, Segata, Chowdhury, Koo and Hunter2010) (random forest, Local SVM, Bayesian learning keyphrase extraction algorithm).
In our task of forming the thematic keyword banks for both the academic and industrial datasets, the key challenge is that most articles in our practitioner dataset do not include a list of keywords. One option would be to apply the trained model from the supervised learning approach derived from our set of academic articles to the practitioner dataset. The problem we identify with this approach is that there is unlikely to be a similar pattern in the determination of keywords for academic and practitioner articles. We are therefore not able to easily apply supervised learning to the task of keyword extraction for our practitioner dataset. We instead apply unsupervised learning methods, which rely on statistical patterns and linguistic structures, to the keyword extraction in the practitioner dataset.
We work with three different unsupervised learning methods for keyword extraction from our practitioner articles dataset. The three methods are the Term Frequency-Inverse Document Frequency (TFIDF) method, KeyBERT, and YAKE!. The TFIDF method is a simple and widely recognized unsupervised learning method, which identifies keywords based on their frequency in a document relative to their frequency of occurrence in a collection of documents (Salton & Buckley, Reference Salton and Buckley1988). Yet Another Keyword Extractor (YAKE!) is our second statistical approach to unsupervised learning. It provides keyword recommendations based on a single article rather than referring to the entire dataset like in the TFIDF approach. It extracts keywords based on a combined score determined from multiple intrinsic characteristics such as frequency of the term, where the term appears in the article (with greater weight given to terms occurring early in the article), and co-occurrence. It has shown good performance in different languages and domains (Campos et al., Reference Campos, Mangaravite, Pasquali, Jorge, Nunes and Jatowt2020). More recently, an embedding-based approach KeyBERT, uses a pre-trained large language model (BERT) to identify keywords that are semantically closest to the document content (Khan et al., Reference Khan, Shahid, Uddin, Roman, Alharbi, Alosaimi, Almalki and Alshahrani2022).
We first examine the performance of these three algorithms using a keyword similarity comparison based on a random sample containing 5000 academic papers. For each sampled academic paper, we compare the keywords, as specified by the author, with the keywords identified by each of the three algorithms using the Levenshtein similarity score (denoted as $S(text_1, text_2)$
in Equation (1)). This score is calculated as one minus the ratio of the Levenshtein distance (
$S(text_1, text_2)$
in Equation (1)). This score is calculated as one minus the ratio of the Levenshtein distance ( $D(text_1, text_2)$
: the minimum number of single-character edits, including insertions, deletions, or substitutions, required to change one keyword into the other) to the maximum length of the strings, i.e.,
$D(text_1, text_2)$
: the minimum number of single-character edits, including insertions, deletions, or substitutions, required to change one keyword into the other) to the maximum length of the strings, i.e.,
 \begin{equation} S(text_1, text_2) = 1 - \frac {D(text_1, text_2)}{\max (|text_1|, |text_2|)}. \end{equation}
This ensures that $S \in [0, 1]$
, where a score of 1 indicates identical text and a score closer to 0 indicates a maximum dissimilarity.
$S \in [0, 1]$
, where a score of 1 indicates identical text and a score closer to 0 indicates a maximum dissimilarity.
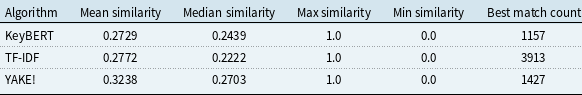
Table 5 summarizes the similarity scores and the number of best matches for the documents tested. In summary, YAKE! achieved the highest mean and median similarity scores and offers the best similarity metrics in the overall keyword ranking.
Levenshtein similarity scores for academic dataset keyword extraction methods

Table 5 Long description
A table comparing similarity scores for keyword extraction methods. The table has four rows and six columns. The columns are labeled Algorithm, Mean similarity, Median similarity, Max similarity, Min similarity, and Best match count. The row labels are KeyBERT, TF-IDF, and YAKE!. Row 1: KeyBERT, 0.2729, 0.2439, 1.0, 0.0, 1157. Row 2: TF-IDF, 0.2772, 0.2222, 1.0, 0.0, 3913. Row 3: YAKE!, 0.3238, 0.2703, 1.0, 0.0, 1427.
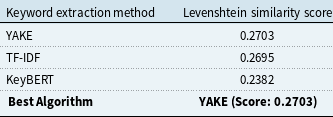
While this analysis used the academic papers, where keywords were identified, we also checked the results of the YAKE! method using the practitioner paper dataset. We compared the performance of three keyword extraction methods on the industry dataset by calculating how closely their extracted keyword bank (ordered in decreasing order of frequency) matches the academic keyword bank (ordered in decreasing order of frequency) using the Levenshtein similarity score. The result is shown in Table 6. While the differences are relatively small, YAKE! offers the highest similarity score in the summarized keyword lists. Therefore, based on the combined comparison results from both the academic and industrial datasets, as well as manual inspection of several randomly selected documents, we selected YAKE! as the keyword extraction method for our subsequent work.
Levenshtein similarity scores for practice dataset keyword extraction methods

Table 6 Long description
A table comparing Levenshtein similarity scores for different keyword extraction methods. The table has two columns: Keyword extraction method and Levenshtein similarity score. It contains four rows. Row 1: Keyword extraction method, YAKE; Levenshtein similarity score, 0.2703. Row 2: Keyword extraction method, TF-IDF; Levenshtein similarity score, 0.2695. Row 3: Keyword extraction method, KeyBERT; Levenshtein similarity score, 0.2382. Row 4: Keyword extraction method, Best Algorithm; Levenshtein similarity score, YAKE (Score: 0.2703).
Keywords study flow chart.

Keyword extraction methods typically introduce some irrelevant or randomly generated keywords, which are not helpful or representative of the underlying dataset. To reduce the impact of this, we go through a carefully monitored process, as shown in Figure 3. In the first step, we gather all available author keywords from the academic research papers. We filter out noisy terms to form an initial Author Keyword Bank. As an example of this process, keys such as “Neural Networks,” “Neural Network,” and “neural networks” will be recognized as “Neural Network.” Similarly, abbreviations such as “AI” or “ML” will be recognized as “Artificial Intelligence” and “Machine Learning.” In the second step, we apply our chosen unsupervised text mining method, YAKE!, to the academic dataset and extract exploratory keywords from the titles and abstracts of all academic research articles. From this fully unsupervised keyword extraction output, we separate the generated keys into two groups: the author keyword set and the group of keywords generated by the application of the YAKE! method. In the third step, for each academic article, we retain the top 15 keywords from the list containing both author keywords and YAKE! generated keywords. The collection of the keywords retained for every academic article forms our academic keywords bank, which will also be used as the starting point for our keyword extraction from the practitioner article dataset. In the fourth step, we apply the YAKE! keyword extraction method on the practitioner article dataset. The extracted keywords are then refined in the final step, following similar rules as for the academic dataset. That is, we choose the top 15 keywords based on the academic keyword list, and those keywords obtained by application of the YAKE! method to the practitioner article dataset. The combination of the refined lists of keywords for industrial articles forms our final industrial keywords bank.
2.4 Limitations and potential biases of the data
We note that we have sourced academic articles from multiple databases, including EconLit, Web of Science, and Scopus. Although these databases are expected to cover most of the leading journal articles in the InsurTech field, there will still be articles missing from our dataset, which could lead to coverage gaps and bias in our findings. Similarly, the practitioner articles are collected entirely by hand through web searches. This process may lead to the exclusion of certain key industry discussions. In addition, many industrial sources, particularly those from congresses and summits, generally retain only the most recent records rather than a complete historical archive. This may lead to some missing content.
Additionally, rather than analyzing the full text of the articles, the keywords and phrases are determined using selected information. For the academic dataset, we focus on the titles, abstracts, and author keywords of the articles. For the industrial dataset, where data accessibility is often limited, we focus on titles and one-line summaries. This approach is efficient and has enabled the analysis to move forward. However, it may mean that, by not assessing the entire content of each article, some key ideas may be missed.
These data collection constraints have important implications for interpreting our temporal analysis. The identification year for any keyword represents its first appearance in our collected InsurTech datasets (academic or industry), not its first appearance in the broader academic or industry literature. This may differ substantially from what would be captured through comprehensive industry surveillance or broader web-based searches. Due to these limitations, findings regarding the temporal gaps between academic and industry adoption of specific keywords (defined in Section 3.3) should be interpreted with caution, as the observed time lags may not reflect true differences in adoption timing.
3. Results and Discussion
3.1 Trend analysis: Publication growth
This section focuses on the analysis of publication growth patterns and discusses the robustness of the growth trend. Figure 4 shows the number of publications for both academic and industrial datasets during the observation period 2000 to 2025. The number of articles in the academic dataset (blue area) shows a steady increasing trend in the early 2000s. The growth accelerated after 2015. In contrast, constrained by available resources, the number of industry articles (red area) is much lower than the number of academic publications, between 2000 and 2010. Some growth in practitioner publications is observed between 2010 and 2015. It was only after 2015 that the number of papers in the dataset grew significantly. The growth rate for practitioner papers has exceeded the rate for academic articles, showing a much steeper trend since 2015. This increase in the practice publications after 2015 is partly driven by the increased adoption of IoT technology, including vehicle telematics and connected homes, health and fitness devices, and wearables technology, according to the survey conducted by Volin and Shuttlewood (Reference Volin and Shuttlewood2015).
Publication growth trend.

Around 2017, the number of articles published by practitioners in InsurTech first exceeded the corresponding number of academic articles. A slowdown is observed in the production of practitioner papers during the pandemic period (2019–2022). This slowdown seems to be temporary, with a rapid increase in practitioner papers from 2022. Despite the rapid increase in research volume supporting InsurTech work, we note that the sector is still in its early stages of development, with investment in the sector only really beginning to be significant in the past decade. From an investor’s point of view, the InsurTech sector has attracted more than $31.5 billion worldwide in the past decade. As shown in the Global InsurTech Report 2024 produced by Gallagher Re, the first large investment in InsurTech appeared in 2015. From 2016 onward, the InsurTech sector has experienced more than six consecutive years of increased investments. The first turning point appeared in 2021. The level of funding raised fell to the pre-pandemic level in 2024. This trend is caused by the deterioration in the funding of the Property and Casualty sector, which has experienced a 24% reduction. In contrast, the life and health insurance sectors have experienced a notable 53.6% increase in funding.
To provide further insight into the volume of practitioner-based research in InsurTech, we next examine the frequency of Google searches on the terms “InsurTech” and “Insurance Technology,” provided by Google Trends. These data reflect the general public’s interest in technological advancements in the insurance industry. Figure 5 shows the Google Trend Index, a normalized web search frequency index, scaled from 0 to 100, with the red line representing the “InsurTech” searches and the gray line representing the “Insurance” searches. In summary, the search frequency index for Insurance has shown a decreasing trend from the early 2000s to around 2011, suggesting a decrease in public interest and a potential loss of confidence in the traditional insurance market. This downward trend stabilized around 2012, coinciding with the early emergence of InsurTech in the market. In contrast, interest in InsurTech remained very low prior to 2015, followed by a period of rapid growth. Although a slight decline was observed during the COVID-19 pandemic (2020–2022), public interest in InsurTech recovered quickly in 2023 and nearly doubled in 2024. This agrees with our findings in the publication growth trend in industry publication datasets.
Google trends for web search.

Subject distribution for academic dataset before and after 2015.

In contrast to the underlying causes for increased practitioner research in InsurTech, which can often be explained by levels of investment in InsurTech and associated public attention, the drivers of academic research activity in InsurTech are less commonly discussed. To better understand the varying rates of publication in InsurTech by academics, we consider the subject distributions before and after 2015. These are shown in Figure 6. First, medicine has a dominant position in both periods. However, two of the leading fields before 2015, “economics, econometrics, and finance” (second place) and “business management and accounting” (third place), dropped to the third and sixth places during the post-2015 period. Their total contributions also show a significant decrease after 2015, from 20% down to 13.5%. In contrast, the computer science field has become the second largest contributor to InsurTech studies after 2015. The engineering field was in fifth position, overtaking the leading position of the business management and accounting sector.
In summary, we find that the advances in InsurTech were primarily driven by academic research before 2015, when investigating technological advances in insurance was dominated by business and economic researchers. With the gradually increasing attention to AI and the expansion of big data technologies post 2015, we witnessed strong growth in practitioner interest in InsurTech. The growth trends observed from the practice dataset are more vulnerable to disruptions from the market and environmental shocks, notably the COVID-19 pandemic, which significantly slowed the production of industrial articles. However, with confidence in technological fields, publications could recover quickly from the shock, and the boost in interest may even exceed the pre-shock level shown by the sharp increase in the final segment of Figure 4. Meanwhile, academic publications have a more steady growth trend in publication rates and seem to be less impacted by public shocks such as the pandemic.
It is worth noting that the main driving force of InsurTech-related academic research has shifted from the business and economics fields towards the computer science and engineering fields. The future persistence of these fields in InsurTech research remains uncertain. It may be time to reassess the driving forces behind InsurTech research and help define the future directions for the next decade of development in the field.
3.2 Topic analysis: Keyword clouds
Following the methodology outlined in Section 2.3, this section focuses on analyzing key topics and highly cited keywords from the academic and practitioner datasets. The primary objective of this analysis is to explore the thematic structure and interrelationships between the evolution of keywords in each dataset, to offer insights into leading research topics, practice interests, and temporal trends in the InsurTech field.
Keywords clouds for academic dataset.

Keywords clouds for industry dataset.

The keyword clouds shown in Figures 7 and 8 summarize the top 100 keywords in the academic (ACA) dataset and the industrial (IND) dataset. Font sizes are proportional to the relative frequency of keywords. From these keyword clouds, one can see a large proportion of intersecting keys between the academic and industry datasets, focusing mainly on AI-driven insurance and health applications. High-frequency keywords such as “Artificial Intelligence” and “Health” related keys appear in both the ACA and IND datasets. The ACA dataset has shown an extensive focus on methodological developments, policy implications, and ethical concerns, with key areas such as “Machine Learning,” “Big Data,” “Deep Learning,” and “Data Mining.” The IND dataset places greater emphasis on commercial applications and market trends, with highlighted keys including “Insurance Industry” and “Insurance Distribution.”
The practitioner-based keywords cloud includes “Competitive Advantage,” which shows the importance of profit-driven research by practitioners. In the IND dataset word cloud, other than the most widely explored “Artificial Intelligence,” the other keys are similar in size and cover a broader scope compared to the greater focus on a smaller number of topics in the ACA dataset. We see broad topics including “Usage-Based Insurance,” “Casualty Insurance,” and “Health Insurance” related to insurance business lines, and also “Digital Transformation,” “Decision Making,” and “Strategic Partnership” which are related to business operations. We also note that the IND dataset includes keywords related to the customer, such as “customer experience” and “customer service.” This demonstrates attempts by insurers to increase their focus on customers using modern technology. Climate change was also observed in both keyword clouds. This aligns with the increased focus on environmental risk in insurance.
Figure 9 compares the top 15 overlapping keywords of the ACA and IND keyword clouds. The different frequencies between the two datasets are most evident in topics like “AI,” “machine learning,” “big data,” “health economics,” “health insurance,” and “digital transformation.” These differences indicate that while academic research primarily concentrates on innovative methodological advancements, the practice side emphasizes more on the empirical steps necessary to facilitate a seamless transition in achieving the digitalization or automation objectives.
Top 15 most frequent co-occurrence keys between the academic dataset and industrial dataset.

Next, we explore keyword co-occurrence networks for the ACA (Figure 10) and IND (Figure 11) datasets. These have been generated using VOSviewer. In both plots, the size of the nodes represents the frequency of occurrence of the corresponding keywords in each dataset. Each node is associated with a color-coded cluster representing its corresponding thematic group. For example, in Figure 10, algorithmic techniques, such as machine learning, neural networks, and random forests, are grouped in yellow. Also, the nodes are connected by edges, with the thickness indicating the strength of co-occurrence relationships.
Keywords co-occurrence plot for academic keywords with at least 8 references.

Keywords co-occurrence plot for industry keywords with at least 8 time references.

Figure 11 Long description
A keyword co-occurrence plot for industry keywords with at least 8 time references. The plot features various keywords related to the insurance technology industry, with the size of each keyword indicating its frequency of occurrence. Keywords such as artificial intelligence, health economics, machine learning, and digital transformation are prominently displayed. The plot shows the interconnectedness of these keywords, illustrating their relationships and co-occurrences. Arrows and lines between keywords indicate the strength and direction of their associations. The plot is color-coded to differentiate between different clusters of related keywords.
The network shown in Figure 10 has a highly interconnected and well-clustered structure. “Machine learning,” “Artificial intelligence,” and “Insurance” form the central nodes inside this academic keyword network, reflecting the popularity of computational methods in the InsurTech research. The industry network shown in Figure 11 shows a more centralized structure with “artificial intelligence” in a dominant position. Although there are some elements, such as “professional liability,” “customer service,” and “small business,” that seem to be separate from the main clusters, they are still connected to the central node “artificial intelligence,” reflecting the widespread interest in AI across all sectors of the insurance value chain.
The structural differences between academic and industrial keyword networks highlight the distinct evolutionary trajectories of InsurTech research. While academic research tends to prioritize methodological advancements, as reflected in keyword clouds, the underlying network structure reveals that academic studies are more connected, contributing to well-conceptualized development in the covered topics, fostering in-depth development in the field. In contrast, industry developments appear to be stimulus-driven, with a strong emphasis on AI and discussions around this theme. However, this centralized structure of the industry network suggests limited cross-sectoral interaction and a lack of collaborative development. In Gallagher Re’s 2024 Global InsurTech Report, AI is the primary focus for practice development, contributing to USD 2.01 billion in funding in 2024. Companies demand expertise to address limitations in existing systems to achieve automation and efficiency in distribution, risk or claim management, and operational tasks. The unstructured evolution of InsurTech in the industrial sector implies a growing need for scholarly expertise to guide its development. Academics may be well placed to offer expert advice in guiding the transformation of digitalization. Therefore, despite the increasing emphasis on practical applications within InsurTech, academics remain a key force in sustainable advancements in this field. The key limitation of the current InsurTech academic research is its limited connection to real-world applications.
3.3 Topic analysis: Temporal dynamics
In the previous section, we provided an overview of aggregated keyword clouds and co-occurrence patterns for the academic and the industrial datasets. In this section, we examine the temporal distribution of keywords throughout the observation period, as well as the time lag between overlapping keywords in the academic and industry datasets. This analysis aims to explore the dynamics of topic development and the co-evolution of research themes between academic work and practitioner work.
The time series plot in Figure 12 shows the keyword development trends during the period from 2000 to 2024, with the red line representing the IND dataset and the blue line representing the ACA dataset. For both datasets, the number of identifiable keys in the refined dataset has shown a steadily increasing trend. Compared to the academic line, the industrial line has shown a more rapid growth in recent years, especially after 2015. Throughout the observation period, the number of identifiable keywords in the ACA dataset consistently exceeds that of the IND dataset, except for the year 2023.
Temporal trends in keyword development – Number of keywords.

Temporal trends in keyword development – Proportion of new keywords.

Figure 13 presents the annual proportion of new keywords in the ACA dataset (blue) and the IND dataset (red). The vertical axis measures the number of new keywords divided by the total number of keywords in a particular year. In the year 2000, we assume all keywords are new to the InsurTech field, so both datasets start with a 100% new keyword ratio. In the early 2000s, although the ACA dataset began with a much larger keyword bank, both the ACA and IND datasets had a similar proportion of new keywords. The academic keyword bank continued to grow steadily, but the annual proportion of new academic keywords gradually declined over time. In contrast, the industry keyword bank expanded at a consistent annual rate with new keyword additions eventually catching up with the academic dataset. Overall, both the ACA and IND datasets have shown a recent decline in the emergence of new keywords. However, this trend does not necessarily suggest that InsurTech research has reached maturity. Although the rate of innovation appears to have slowed down, the proportion of new keywords remains relatively high at around 65% for academic work and 75% for industry-produced work.
Following the analysis of the keyword clouds, we now examine the overlapping keywords in the ACA and IND datasets. Figures 14 and 15 present the distribution of the common topics for the ACA and IND datasets, respectively. The shaded area in each graph represents the proportion of keywords cross-referenced, with the corresponding ratio displayed on the secondary vertical axis on the right. This ratio represents the proportion of keywords that overlap between the academic and industrial keyword clouds relative to the cumulative size of the keyword clouds up to a given year. Equation (2) defines the ratio for the ACA dataset, and Equation (3) applies to the IND dataset. The green dotted lines (defined by Equation (4)) show the number of overlapping keywords identified within that specific year, while the orange lines (defined by Equation (5)) show the number of co-referenced keywords found in the cumulative topic banks from both sources up to that point in time.
 \begin{eqnarray} R_{aca}(t) &=& \frac {\left | \bigcup _{i=1}^{t} K_{\text{aca}}(i) \cap \bigcup _{i=1}^{t} K_{\text{ind}}(i) \right |} {\left | \bigcup _{i=1}^{t} K_{\text{aca}}(i) \right |}, \end{eqnarray}
 \begin{eqnarray} R_{ind}(t) &=& \frac {\left | \bigcup _{i=1}^{t} K_{\text{aca}}(i) \cap \bigcup _{i=1}^{t} K_{\text{ind}}(i) \right |} {\left | \bigcup _{i=1}^{t} K_{\text{ind}}(i) \right |}, \end{eqnarray}
 \begin{eqnarray} Green(t) &=& \left |K_{\text{aca}}(t) \cap K_{\text{ind}}(t)\right |, \end{eqnarray}
 \begin{eqnarray} Orange(t) &=& \left | K_{\text{aca}}(t) \cap \bigcup _{i=1}^{t} K_{\text{ind}}(i) \right |. \end{eqnarray}
Temporal trends in cross-dataset co-cited keywords development – Academic.

Figure 14 Long description
A line graph titled Academia Keywords Overlap with Industry Dataset Keywords Bank. The horizontal axis represents the year, ranging from 2000 to 2025. The left vertical axis represents the number of keywords, ranging from 0 to 4000. The right vertical axis represents the proportion covered, ranging from 0 to 0.12. The graph includes four lines: Total Academia Keywords in blue, Same Year Overlap in green, Total Overlap in orange, and Proportion of Covered Keywords in red. The blue line shows a significant increase in total academia keywords over time, peaking around 2025. The green and orange lines show relatively stable trends with minor fluctuations. The red line indicates an increasing proportion of covered keywords, peaking around 2025 before a sharp decline.
Temporal trends in cross-dataset co-cited keywords development – Industrial.

During the observation period, both Figures 14 and 15 show an increase in the absolute size of common keys between the ACA and the IND datasets. However, the overall proportion of shared keywords remains relatively low. In particular, after years of steady growth, the academic sector has around 12% common keys in 2025. This proportion is slightly higher in the IND dataset at around 20%. We find that the increase was largely evident in the last two years, rather than evenly distributed throughout the whole observation period. From the plot, one may not confidently conclude that academic work and practitioner work are interrelated. However, it may indicate thematic convergence in recent years.
To further study the overlap between the academic and industry keyword banks, we calculate the time lag for each keyword based on its year of first appearance in both datasets. Specifically, the lag shown in Figure 16 is defined as the difference between the year a keyword was first identified in the IND dataset and the year it was first observed in the ACA dataset. Formally, the time lag for a given keyword $k$
is defined as:
$k$
is defined as:
 \begin{equation} \text{Lag}(k) = \text{Year}_{\text{ind}}(k) - \text{Year}_{\text{aca}}(k), \end{equation}
where $ \text{Year}_{\text{ind}}(k)$
and
$ \text{Year}_{\text{ind}}(k)$
and $ \text{Year}_{\text{aca}}(k)$
denote the first year of occurrence of the keyword
$ \text{Year}_{\text{aca}}(k)$
denote the first year of occurrence of the keyword $ k$
in the respective datasets. The sign of
$ k$
in the respective datasets. The sign of $\text{Lag}(k)$
means that:
$\text{Lag}(k)$
means that:
-
• $\text{Lag}(k)\gt 0$
: the keyword was identified in the ACA dataset before the IND dataset;
$\text{Lag}(k)\gt 0$
: the keyword was identified in the ACA dataset before the IND dataset; -
•
$\text{Lag}(k)\lt 0$
: the keyword was identified in industry publications before appearing in the academic literature.


Time lags distribution: Histogram.

Time lags distribution: Boxplots in absolute values academic (left), industry (Right).

The histogram shown in Figure 16 shows the distribution of time lags, where their values range from −22 to + 24 years, as a positively skewed distribution with 61.94% of the time lags having positive values. This demonstrates that more intersecting keywords first appeared in the InsurTech academic literature than in the industry literature. From the box plots shown in Figure 17, one can see that both the academic first time lag and the industry first time lag have a minimum time lag of 0. However, the academic first and industry first keyword lags have shown differences in both magnitude and variability. The distribution of the industry first lags (red boxplot) is highly concentrated between 0 and 5 years, with a median lag of around 3 years. This demonstrates that when the industry leads on certain topics, academic research tends to follow reasonably quickly, potentially due to visible market needs or investment trends that prompt scholarly validations or further exploration. In contrast, academic first lags, shown in the blue boxplot, exhibit a much wider spread, with a median closer to 7 years and an inter-quartile range of approximately 10 years.
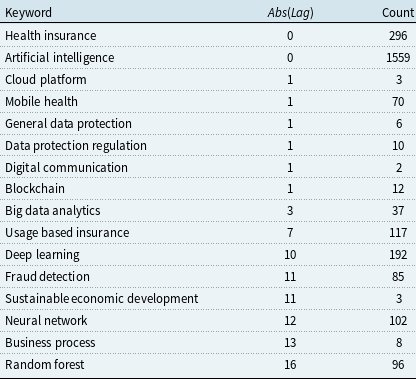
Table 7 summarizes common keywords with time lags ranging from 0 to 16 years. Several widely discussed topics, such as “Artificial Intelligence” and “Health Insurance,” appear simultaneously in both academic and industry publications (0-year lag). These terms appear to represent foundational concepts that are universally recognized and readily adopted across both domains. In contrast, specialized terms show substantially longer lags. Algorithmic terms such as “Random Forest” (16 years), “Neural Network” (12 years), and “Deep Learning” (10 years) require strong statistical expertise, while operational strategic terms such as “Business Process” (13 years) and “Sustainable Economic Development” (11 years) require a comprehensive understanding of industry dynamics. Both types demand specialized knowledge that may not be immediately accessible to industry practitioners, potentially explaining their delayed adoption.
Industry vs. Academia first year comparison with lag and count

Table 7 Long description
The table presents a comparison of various keywords with their associated time lags and counts. It includes three columns: Keyword, Abs(Log), and Count. The table has 16 rows, each representing a different keyword. Row 1: Health insurance, 0, 296. Row 2: Artificial intelligence, 0, 1559. Row 3: Cloud platform, 1, 3. Row 4: Mobile health, 1, 70. Row 5: General data protection, 1, 6. Row 6: Data protection regulation, 1, 10. Row 7: Digital communication, 1, 2. Row 8: Blockchain, 1, 12. Row 9: Big data analytics, 3, 37. Row 10: Usage based insurance, 7, 117. Row 11: Deep learning, 10, 192. Row 12: Fraud detection, 11, 85. Row 13: Sustainable economic development, 11, 3. Row 14: Neural network, 12, 102. Row 15: Business process, 13, 8. Row 16: Random forest, 16, 96.
Table 7 also demonstrates that more recently emerging terms may be adopted faster by the industry. For example, “Digital Communication,” “Blockchain,” and “Data Protection Regulation” first appeared in our collected academic and industry datasets between 2019 and 2020 and showed simultaneous discussion in both domains, with a negligible lag of one year. In contrast, terms such as “Business Process” and “Random Forest,” which appeared in early 2000s sources, have shown much longer adoption lags of 13–16 years, supported by the long-tailed histogram plot of the lag distribution in Figure 16. This means that the gap between academic innovation and industry implementation may be narrowing over time. However, we need more longitudinal analysis to confirm this trend.
In this section, we examine the temporal dynamics of keyword development within and across academic and industrial datasets in the InsurTech field. Our analysis draws from the ACA and IND datasets. The temporal analysis relies on the first identification year of each keyword within these datasets and is therefore constrained by the dataset limitations discussed in earlier sections. These findings are primarily exploratory in nature, intended to inspire future research in this area.
Our exploratory analysis suggests that while academic research traditionally led InsurTech development through the provision of theoretical insights and foundational knowledge, our descriptive data indicates evolving dynamics. The temporal patterns suggest that academic research may face increasing challenges in identifying novel research directions as the field matures. Conversely, industry discourse appears to demonstrate greater dynamism, potentially driven by emerging business opportunities and market demands. Though those observations are preliminary and require further validation, they suggest that future InsurTech academic research may increasingly benefit from closer engagement with industry-led initiatives. However, we emphasize that these patterns are descriptive rather than causal, and may reflect dataset characteristics rather than actual innovation dynamics.
Looking ahead, InsurTech’s continued development faces several constraints, particularly regulatory uncertainty and concerns about investment returns. Academic research typically explores innovations beyond current regulatory frameworks, often in areas where regulations have not yet been established. This regulatory gap creates uncertainty and increases investment risk, as innovations may subsequently face restrictions or prohibitions. Since the insurance industry operates under heavily regulated frameworks, risk-averse insurers often choose to defer this kind of adoption to avoid potential losses. Additional challenges include skill shortages, high implementation costs, and the lack of short-term profitability for many innovations, which can further deter investment. As the field matures, improved regulatory clarity and increased opportunities in academic-industry collaboration may help address these challenges, creating feedback loops where industry experience informs academic research priorities and academic innovations become more readily adoptable, thereby fostering greater innovation diffusion across the academic-industry boundary.
3.4 Market and research gap guide: Regional development
After analyzing publication growth, keyword development, and temporal dynamics across the ACA and IND datasets, this section explores the regional distribution of academic publications and leading InsurTech firms to identify key patterns, research priorities, and business interests across different sectors. For the ACA dataset, we systematically assigned documents to countries according to a predefined hierarchy: first author affiliation information, last author affiliation information, other author affiliation information, title, keywords, and abstract. The first country available in this sequence is used for classification. With this hierarchical assignment, we successfully extracted regional information from 90.3% of the articles from 127 countries worldwide. Unfortunately, the articles in the industry dataset do not generally provide direct regional information. We therefore use information from the World’s Top 150 InsurTech Companies: 2024, a joint report by Statista and CNBC. The included companies cover the self-nominated companies in CNBC, as well as those identified through independent analysis by Statista.
Regional distribution: Academia (Left) vs industry (Right).

Figure 18 summarizes the regional distribution of academic publications and top InsurTech firms. The United States (USA) leads both the academic (46. 2%) and industry (46%) contributions, highlighting its central role in InsurTech research and business development.
China ranks second in academic research with a share of 10.7%; however, Chinese InsurTech firms account for only 3.33% of the top global InsurTech firms. There are well-known online InsurTech Firms such as ZhongAn and Taikang, but only a few other companies are recognizable in the top ranking. The dominant players in the Chinese market leave limited opportunities for new start-ups to achieve profitability. In addition, the insurance sector in the Chinese market operates under highly restrictive regulatory constraints, making it even more difficult for new entrants to establish their businesses. Due to the highly regulated environment, innovative products are rarely seen in practice. For example, usage-based insurance, which began pilot implementations in the United States as early as the early 2010’s, has not yet seen any real application in China.
India (5.46% in academia, 7.33% in industry) and France (2.89% in academia, 3.33% in industry) have shown significant development in both research and business. They even have a greater share in industry representation, highlighting the successful transition of digital tools into commercial applications and a healthy evolution process. Meanwhile, Germany (5.78% in academia, 4% in industry) and Canada (3.83% in academia, 2.67% in industry) have a slightly lower proportion of industry share compared to their academic contributions, indicating the potential of their future market development.
The United Kingdom (4.27% in academia, 13.3% in industry) and Singapore stand out as two of the most successful countries in their InsurTech implementation. Although Singapore academic publications may not be comparable to those of the other eight leading economies, Singapore accounts for 4% of the world’s top InsurTech companies, equivalent to Germany’s share, shown by the light purple region in the industry pie chart on the right side of Figure 18. This success in InsurTech empirical development can be attributed to proactive government policies, investment incentives, and a highly integrated financial and technological ecosystem. The nation’s strategic initiatives have created a healthy ecosystem, attracting more than 80 InsurTech startups registered with the Singapore FinTech Association (Bogardi, Reference Bogardi2020). Examples of successful InsurTech firms in Singapore, such as Bolttech (an embedded insurance platform for advanced marketing and distribution), have achieved a valuation of $2.1 billion following a Series C funding round in December 2024. By taking advantage of the robust technological infrastructure and supportive regulatory environment, Singapore has quickly emerged as the InsurTech development center in Asia.
3.5 Market and research guide: Line of business
In this section, we discuss the evolution of business lines in the InsurTech context, using both the academic and industrial datasets, identify key innovations in each area, uncover gaps or opportunities in current developments, and highlight areas of possible future development.
Our analysis successfully classified 83.7% of journal articles and 37.8% of industry publications into their respective business lines. Figure 19 shows the distribution of InsurTech publications by line of business: Health, Life, and Property & Casualty (P&C) for academia (left panel) and industry (right panel) from 2016 to 2025. From the plot, the academic dataset has shown a balanced focus across the short-term (P&C) and long-term insurance practice (health and life), with health insurance consistently representing the largest share, ranging from approximately 47% to 55% of publications. P&C-related research has gradually increased over time, narrowing the gap with health, while life insurance remains a small but consistent component.
Annualized business line distribution.

Figure 19 Long description
Two vertical bar graphs compare the proportion of papers in different lines of business over time for academia and industry. Panel A: The left bar graph is titled Academia: Line of Business Split. The horizontal axis represents the years from 2016 to 2024, and the vertical axis represents the proportion of papers. The graph shows three categories: Health, Life, and Property and Casualty (P&C). Health is represented in blue, Life in green, and P&C in red. The proportion of papers in the Health category remains relatively constant over the years, while the Life category shows a slight increase. The P&C category dominates the proportion of papers throughout the period. Panel B: The right bar graph is titled Industry: Line of Business Split. The horizontal axis represents the years from 2016 to 2024, and the vertical axis represents the proportion of papers. The graph shows the same three categories: Health, Life, and P&C. Health is represented in blue, Life in green, and P&C in red. The proportion of papers in the Health and Life categories remains relatively low and constant over the years, while the P&C category dominates the proportion of papers throughout the period.
In contrast, industry publications are highly concentrated in the P&C sector, accounting for between 80% and 90% of the output in most years. This skewness reflects the greater profitability and shorter development cycles that are typical for P&C products, such as auto or property insurance, which are more adaptable to rapid digitization and innovations. From 2022 onward, the industry has shown an increase in the proportion of publications in the health and life insurance domains. This trend may be explained by the growing influence of digital health technologies and post-pandemic awareness of health-related longevity risk, areas where academia has long maintained an interest.
Overall, the publishing domains in InsurTech have shown disparate interest from both academic research and industry publications. Academia tends to take a broader and more exploratory approach, while industry remains focused on immediate commercial returns. However, the recent industry shift toward the health and life insurance domains signals early signs of convergence, presenting opportunities for stronger collaboration and better alignment between research and practice.
In the remainder of this section, we highlight some innovative topics within the ACA dataset. First, Van Nostrand and Nevius (Reference Van Nostrand and Nevius2011) introduced parametric insurance, which provides automatic coverage for weather-related events based on predefined parameters. This concept, also known as Indexed Insurance (Weather), was further explored by Collier et al. (Reference Collier, Skees and Barnett2009). Clarke (Reference Clarke2016) provided a detailed discussion on how indexed insurance deviates from conventional business models. In addition, Mitra et al. (Reference Mitra, Singhal, Mohanty, Kougianos and Ray2022) studied the integration of digital technologies in agricultural insurance. Relating to the Internet of Agro Things (a branch of the IoT), Mitra et al. (Reference Mitra, Singhal, Mohanty, Kougianos and Ray2022) proposed a proof of concept for crop damage estimation and detection using a model based on the Convolutional Siamese Neural Network (CSNN). Furthermore, Schwarze and Sushchenko (Reference Schwarze and Sushchenko2022) explored the application of Distributed Ledger Technologies (DLT) and indexed insurance to improve risk management within the European Common Agricultural Policy (CAP).
In the motor insurance sector, Tselentis et al. (Reference Tselentis, Yannis and Vlahogianni2017) reviewed innovative practices such as “pay as you drive” and “pay how you drive” systems. Arumugam and Bhargavi (Reference Arumugam and Bhargavi2019) discussed the use of data analytics to assess driving risks by incorporating behavioral and emotional information, allowing further personalization of automobile insurance products. Baecke and Bocca (Reference Baecke and Bocca2017) demonstrated that the telematics variables derived from in-vehicle diagnostics significantly improve risk predictability. Although in-vehicle telematics sensors provide consistent inputs for modeling, their implementation requires substantial cost and time. Handel et al. (Reference Handel, Skog, Wahlstrom, Bonawiede, Welch, Ohlsson and Ohlsson2014) examined smartphone-based insurance telematics, which captures driving behavior and trip characteristics, offering solutions for risk classification based on smartphone data. Expanding on this, Arumugam and Bhargavi (Reference Arumugam and Bhargavi2019) explored the transition from simple risk modeling to risk prevention, also known as “manage how you drive.”
Health insurance has a long history of integrating technological advances. Blockchain technology, as a tool to secure data transformation, has been studied by Agbo et al. (Reference Agbo, Mahmoud and Eklund2019) and Attaran (Reference Attaran2022) in the context of the health sector. Another widely cited area is digital health applications, including health apps and mobile health systems, as examined by Goetz et al. (Reference Goetz, Jeindl, Panteli, Busse and Wild2023) with a focus on developments in Australia. Alami et al. (Reference Alami, Rivard, de Oliveira, Lehoux, Cadeddu, Savoldelli, Ag Ahmed and Fortin2020) highlighted the success of digitalized health insurance and introduced the concept of “Pay as You Live,” which supports clients in managing their health proactively.
3.6 Artificial intelligence and future directions
In academic work in InsurTech, “AI” includes both methodological and evaluative work. As shown by the well-clustered and highly connected network plot in Figure 10, academic AI research is tied to multiple tasks: machine learning and deep learning applications for pricing and risk analysis (Richman, Reference Richman2021), interpretable claim severity models using SHAP/feature attribution (Owens et al., Reference Owens, Sheehan, Mullins, Cunneen, Ressel and Castignani2022), fraud detection, and telematics-driven underwriting and portfolio management models. Eling et al. (Reference Eling, Nuessle and Staubli2022); Bhattacharya et al. (Reference Bhattacharya, Castignani, Masello and Sheehan2025) offer a comprehensive review of AI in the insurance field across the value chain and multiple business lines.
On the practice side, AI is highly cited in its original form (artificial intelligence) without a detailed specification of methods or applications in each subsector. Generative AI (GenAI), an emerging topic, suggests growing interest due to the operational efficiency in business processes such as claims management, fraud detection, drive operational efficiency, and interactive engagement with the policyholder (Vegas, 2024). Emerging areas of application extend beyond core insurance operations into construction risk management (Marsh, 2024) and HR compensation practices (WTW, 2024), which drives the shift from the compensation scheme to a predictive and de-risk system (Wyman & Marsh, Reference Wyman2023). Though this topic has attracted over 82% of the insurance leaders’ attention, the scaled deployment lags. Many initiatives remain in testing or pilot phases, which demand sustained investment (Automation, 2025; Analyst, 2025).
A practical bridge is to translate academic findings into business-applicable solutions. For example, fairness metrics (e.g., demographic parity gaps or equalized odds from Owens et al. (Reference Owens, Sheehan, Mullins, Cunneen, Ressel and Castignani2022)) can inform underwriting fairness dashboards and pre-issuance bias checks; model calibration and drift tests from Richman (Reference Richman2021) can support back-end model monitoring; and telematics risk modeling can inform practices for innovative development and portfolio stability reviews. After more than 10 years of development, the next critical factor for AI is regulatory structure and deployment. How companies can leverage the benefits of intelligent tools and ensure rigorous protections for consumers and different stakeholders in the insurance value chain is a critical area for the next stage of InsurTech development.
4. Conclusion and future directions
This paper provides a comprehensive statistical analysis of academic publications and practitioner articles in the area of InsurTech. Academic publications are sourced from multiple databases, including Econlit, Scopus, and Web of Science. Practical articles, derived from magazines, congress topics, and consulting insights, are collected manually from online sources. By analyzing the data relating to the key messages from these publications, we review the evolution of InsurTech research and practice, study their interrelationships, identify the issues in current academic development, and highlight future possible advances in InsurTech.
This paper suggests a keyword extraction framework to systematically review text information from academic papers and practitioner articles related to InsurTech. Statistical analysis of the keywords from these two sources of InsurTech research is conducted to find both common ground between the two research domains and areas of difference in approach and emphasis. Our study of publication volume showed that academics published considerably more than practitioners up until 2015. After that time, growth in practitioner output was considerable, fueled by growth in AI, digital technologies, and opportunities for exploiting big data in insurance analytics. The year 2015 also saw another switch in the nature of InsurTech research output. Computer science, engineering, and environmental science began to exceed more traditional insurance economics as the main focus of InsurTech research papers. The COVID-19 pandemic saw a period of reduced activity, particularly for practitioners, but research into InsurTech resumed apace in 2022. The increased interest in complex methodological algorithm-based research, particularly from academics after 2015, while supporting higher levels of InsurTech research, did mean a greater divide between practitioners and academics, with a slower adoption of academic research in practice. An academic focus on model and risk assessment became more esoteric and of less immediate relevance to practitioners, where the focus is more often on profitability, market trends, and business assessment. It may be that time is needed for the algorithmic developments to have widespread impacts on InsurTech practice. Network analysis shows that academic keywords form well-connected structures, in contrast to the more condensed, stimulus-driven networks observed in the industry domain. As the InsurTech sector continues to evolve, it is increasingly evident that structured support and guidance from the academic community will be essential.
As a guideline for academic researchers, bridging the gap between academia and industry begins with establishing research goals that are closely aligned with real-world needs. This alignment can be facilitated through collaborative industry–academia projects (removing the resource and data barriers), interdisciplinary training programs (promoting the knowledge transfer), and government-supported incentives (creating the environment for the pilot of innovative products and services) that strengthen the feedback loop between academic research and practical application. In parallel, addressing regulatory barriers is equally important. Leveraging tools such as FinTech sandboxes, which provide controlled environments to test innovative technologies, can accelerate sector-wide transformation.
Countries including the United Kingdom (through the Financial Conduct Authority sandbox), Singapore (through the Monetary Authority of Singapore’s Fintech sandbox), the European Union (under the Digital Operational Resilience Act framework), Australia (through the ASIC’s regulatory sandbox), and the UAE (through the RegLab of Abu Dhabi Global Market) have implemented such frameworks. These sandboxes allow organizations to test emerging technologies, such as AI-driven fraud detection or autonomous insurance models, in risk-mitigated settings by providing structured spaces for experimentation, ensuring compliance while fostering innovation. The future direction for InsurTech may be shaped by an iterative learning ecosystem, where the industry identifies pressing challenges, academia systematically researches solutions, and practitioners integrate validated insights into practical applications, ensuring seamless translation of academic research into actionable insights, driving mutual advancement for both academia and industry. Singapore serves as a strong guide in leading the well-developed InsurTech ecosystem, supported by proactive regulatory frameworks, and a vibrant startup environment that fosters collaboration between the global business, as well as in between the academia and practice.
We acknowledge that our findings are constrained by the nature of the academic and industrial publications datasets. The temporal analysis based on the identification year of the keyword from our data sources may be different from the actual introduction time at which the keyword was introduced to academia and industry. However, our analysis is based on the aggregated patterns from the broader scope; therefore, the patterns we identified, such as the gradual convergence in publication topics and also the patterns in profit-driven adoption for industrial practice and the analytical and methodological advancements for academic research, should reflect the actual patterns in the InsurTech field. As a next step, the detailed thematic analysis of the key terms identified in this study, such as “Artificial Intelligence” and the emerging topic “Cyber Risk,” provides a more in-depth understanding of key InsurTech terminology and how these concepts are applied across academic and industry domains.
In conclusion, InsurTech is still in its early stages of development. Its successful development requires the cooperation between both practitioners and academics. We hope this research inspires studies in this field. In this paper, we put forward research that explores the development of InsurTech and the potential for collaboration between academics and insurance industry practitioners.
Acknowledgments
We highlight that practice articles are collected via authors’ efforts, and literature articles are generated through the advanced search output from the literature search engines Scopus, Web of Science, and Econlit.
The authors gratefully acknowledge the reviewers for their valuable comments and suggestions, which have led to substantial improvements from the initial version of the manuscript.
Data availability statement
Replication materials are available on request from the authors. Data and code supporting the findings of this study are available from the corresponding author [Xueyuan Wu] upon reasonable request.
Funding statement
Miss Xindi Fang is supported by an Australian Government Research Training Program (RTP) Scholarship.
Competing interests
The authors declare none.


 Open access