

Introduction
Pertussis or whooping cough is an acute infectious respiratory disease that can affect individuals of any age [Reference Paisley, Blaylock and Hartzell1–Reference Bamberger and Srugo3]. However, infants with <1 year old and particularly those younger than 6 months bear the largest disease burden. Severe morbidity and death are most common in infants [4–Reference Donoso6]. In the last two decades, the incidence of the disease has increased in many countries; with around 16 million cases occurring per year associated with approximately 200 000 deaths [7]. Most of those cases have been reported in developing countries; although in recent years large outbreaks have also been detected in developed countries, even in those with high vaccination rates [7–Reference Clark9]. This epidemiological situation has caused concern, forcing the healthcare systems to reinforce and/or implement strategies that, over the short term, improve the control of the disease – at least in that most vulnerable population. In this sense, different countries including Argentina added new boosters in the vaccination schedules following the recommendations of international entities [Reference Kuehn10–Reference Munoz18]. Vaccinating women during pregnancy with an acellular vaccine (aP) is the most recent strategy recommended (2011) by the Advisory Committee on Immunization Practices from USA (ACIP) in an effort to reduce the burden of pertussis in newborns and infants [11]. When countries decided to implement maternal immunisation (MI), information on the safety of this strategy in the mother and the fetus or its real impact on the epidemiology of pertussis, were scarce. The safety of pertussis vaccination during pregnancy was first studied in the UK [Reference Donegan, King and Bryan15], but more recently in Mexico [Reference Villarreal Perez16]. In these and other studies, the safety of aP in pregnant women was confirmed. That aP induces high concentrations of antibodies during pregnancy that are transferred via the placenta to the fetus is now also known [Reference Donegan, King and Bryan15, Reference Keller-Stanislawski17, Reference Munoz18]. The effectiveness of MI in preventing infant pertussis was recently evaluated in England (2016), the USA (California, 2017) and Argentina (2016) [Reference Amirthalingam19–Reference Baxter21]. The finding from England was that in the 3 years following the introduction of an MI programme, vaccine effectiveness against confirmed pertussis had been sustained over 90% [Reference Amirthalingam19]. In California, the estimated MI effectiveness in protecting against pertussis was 91.4% during the first 2 m in neonates [Reference Baxter21]. In Argentina, a pronounced decrease in the mortality rates was detected 2 years after the introduction of the aP booster during pregnancy [Reference Vizzotti22]. All these data are highly encouraging regarding the use of this vaccination strategy to diminish the risk of pertussis in the most vulnerable population. These findings, however, should be interpreted with care since the data were obtained under different epidemiological situations. In England and Argentina, the data were obtained after outbreaks, when a decline in pertussis cases would be expected. The California data were obtained during a period that included two outbreaks (https://www.cdph.ca.gov/Programs/CID/DCDC/CDPH%20Document%20Library/Immunization/2017Jan23PertussisReport.pdf) in which parameters such as pertussis risk and/or maternal coverage, are not the same during an outbreak as when the outbreak is over.
In order to more completely understand the impact of MI in countries that introduced maternal vaccination immediately after an outbreak, in this study, new data on infant-pertussis epidemiology from Argentina including comparisons between two similar epidemiological situations were presented. These two epidemiological situations refer to two outbreaks that occurred before and after the introduction of maternal vaccination. All these epidemiological situations were simulated using the mathematical model of transmission of pertussis previously designed by us [Reference Fabricius23]. From comparisons between the estimated infant incidences during outbreaks occurring before and after the introduction of MI with epidemiological data, emerged new information on the potential benefits of maternal vaccination.
Materials and methods
Population studied
In this work, we describe the pertussis pattern in Argentina as a whole and in the most populated region of the country, the Buenos Aires province. In Argentina, the vaccination schedule includes three primary doses at 2, 4 and 6 m and two boosters at 18 m and school-entry (5–6 years) with whole-cell vaccine. aP boosters for adolescents, healthcare workers in contact with infants under 12 m, household contacts of very low birthweight infants and during pregnancies are also included.
In Argentina, MI was implemented in 2012 for a single pregnancy after the 20th week of pregnancy. From 2016, MI is mandatory for all pregnancies.
In cases of incomplete schemes, if there are no contraindications, catch-up vaccination schedule is applied following the recommendations of the National Ministry of Health.
The official data on immunisation coverage included in this work are from the National Ministry of Health.
Pertussis epidemiological surveillance
The pertussis epidemiological data used here were extracted both from the National Health Surveillance System of Argentina (SNVS), which entity receives complaints of diseases involving a compulsory notification, including pertussis and from the Pertussis Reference Laboratory (PRL) in La Plata. The SNVS information comprises gender, age, duration of symptoms without the specification of the symptom, vaccination status (vaccination schedule complete or incomplete depending on the patient's age and the number of doses received) and the laboratory results. The PRL data include more detailed information extracted from patients attended in hospitals or healthcare centers in Buenos Aires.
Pertussis-case definitions
The clinical case definition used in Argentina is based on the clinical criteria of the United States Centers for Disease Control and Prevention (CDC) and the WHO (http://www.cdc.gov/ncphi/disss/nndss/casedef/pertussis_current.htm, www.who.int/entity/immunization_monitoring/diseases/pertussis_surveillance/en/index.html), but that information was stratified according to age (http://www.msal.gob.ar/images/stories/pdf/coqueluche-recomendaciones-definiciones.pdf). Suspected pertussis in infants younger than age 6 months included those with acute respiratory illness and at least one of the following signs: apnea, cyanosis, stridor, vomiting after coughing or paroxysmal cough. In patients between 6 months and 11 years, suspected pertussis required a persistent cough for 14 days or more accompanied by one or more of the following symptoms: a paroxysmal cough, inspiratory whoop or vomiting after coughing without other apparent cause. Suspected pertussis in patients older than 11 years of age required a persistent cough for 14 or more days without other accompanying symptoms.
A diagnosis of pertussis was confirmed in patients with suspected illness by Bordetella pertussis isolation in culture, amplification of B. pertussis-specific DNA by the polymerase-chain reaction and/or serology by anti(pertussis-toxin IgG) and in patients with pathognomonic symptoms who were epidemiologically linked to a laboratory-confirmed case.
Mathematical model
An age-structured compartmental deterministic model previously developed by us was used in the present analysis [Reference Fabricius23, Reference Pesco24]. A detailed description of the model, the differential equations that describe the dynamics of the disease, and the parameters used for the calculations are presented in the supplementary material. In Figure 1, we briefly described how MI was considered. The susceptible individuals that get in contact with infectious individuals can acquire a full symptomatic infection, while individuals with an increasing level of immunity acquire a less severe infection or eventually do not become infected if they receive at least three effective vaccine doses. Incidences of severe (s) and mild (m) pertussis in age group i are computed in the model through the equations:
 $${\rm In}{\rm c}_{s,i} = {\rm \lambda} _i{\rm S}_i,\; \; \; \; {\rm In}{\rm c}_{m,i} = {\rm \lambda} _{i{\rm}} {\rm P}_{{\rm Al} i}^1 $$
where Si and  ${\rm P}_{{\rm Al} i}^1 $ are the fractions of the population in age group i that are susceptible and with the primary immune response against pertussis, respectively, and λ i is the force of infection (the rate at which S or PAI individuals become infected). Computation of λ i involves an accounting of the contacts of infants in age-group i with infected individuals of all age groups. Then, λ i is a dynamic variable of the model that depends on the nature of the transmission of the disease among the different age groups.
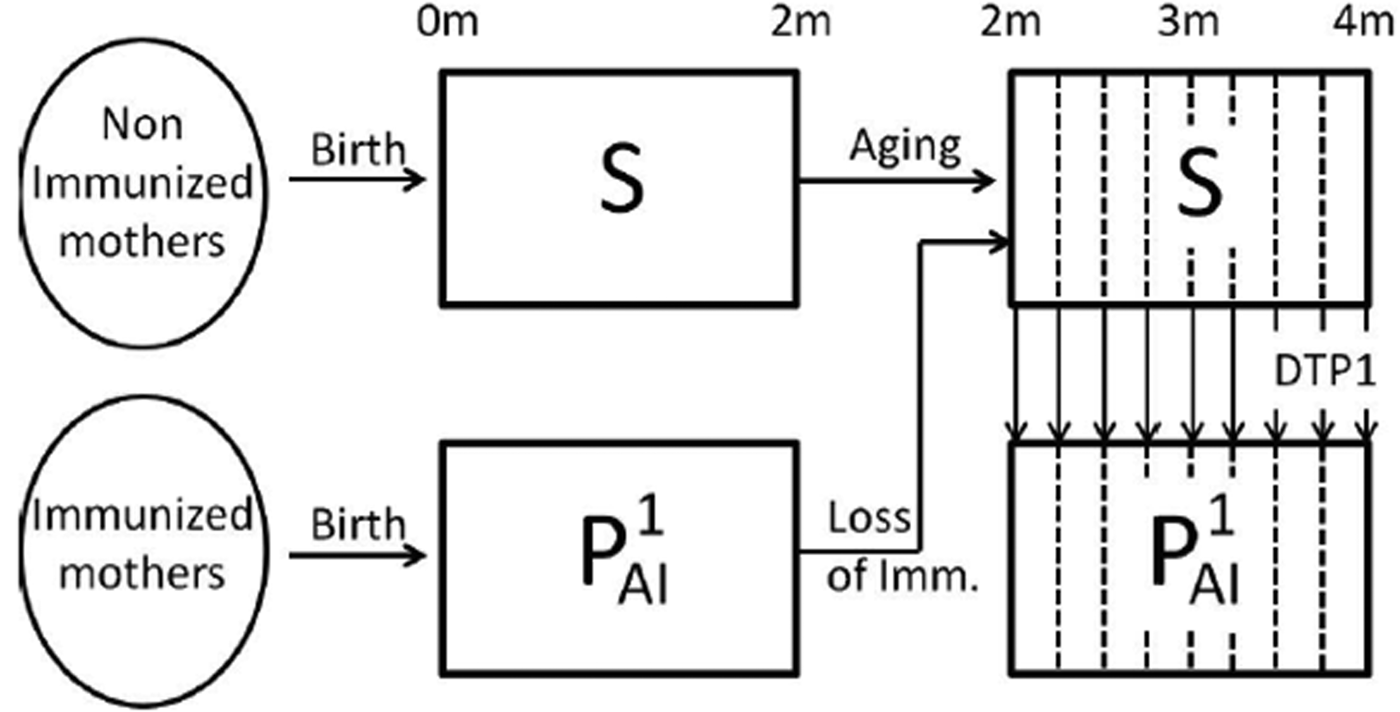
Schematic representation of the immune status of individuals during the first 4 months of life. In the first 4 months of life, individuals that have not become infected may be in the susceptible class, S (fully susceptible to infection) or in the  ${\rm P}_{{\rm Al}}^1 $ class (partial-acquired-immunity class with the first degree of immunity). Individuals born from non-immunised mothers are in the susceptible class but may increase their immunity through the administration of an effective dose of the DTP1 vaccine. The vertical dashed lines in the figure indicate that age groups are weekly discretised into 2–4-month cohorts. A fraction of the individuals is transferred to the ${\rm P}_{{\rm Al}}^1 $ class at each week according to the vaccine efficacy and vaccine coverage per week taken from epidemiological data. Individuals born from immunised mothers are in the ${\rm P}_{{\rm Al}}^1 $ class until they are 2 months old; then, they lose their immunity and enter the S class, unless they recover the first degree of immunity through the administration of an effective DTP1 dose. Individuals in the S and ${\rm P}_{{\rm Al}}^1 $ classes may both become infected when coming into contact with the pathogen; but individuals in the S class are assumed to be susceptible to contracting a full symptomatic (severe) disease, while individuals in ${\rm P}_{{\rm Al}}^1 $ class would acquire a mild symptomatic (less severe) disease. We assume that both infections (I1 and I2, respectively) could be detected by the healthcare system, but that only the severe disease may cause death.
To evaluate the impact of MI on the pertussis dynamics, we started in the stationary state of our model without including MI and introduced a perturbation of the system by transferring 20% of the individuals from the Susceptible to the Recovered classes to mimic the typical periodicity of pertussis outbreaks. This approach is a common practice when using deterministic models [Reference Pesco24, Reference Rohani, Keeling and Grenfell25] to obtain the oscillations that other considerations (such as stochasticity, for example) would introduce. After the disturbance, the system is left to evolve; and, at a chosen moment in the dynamics, MI is introduced.
Results
Pertussis epidemiology patterns in Argentina before and after the introduction of maternal vaccination in 2012
In most parts of Argentina, the DTP3 coverage during recent years ranged between 91% and 95%. We need to note that the coverage estimation is not homogenous throughout the country, as some of the cities have coverage below 80% [Reference Gentile26]. The official data available on the MI coverage is 50.9%, 67.1% and 70.9% for the respective years 2012, 2013 and 2014; but for 2015 and 2016 the figures are somewhat lower at 61.7% and 65.6%.
According to the Comprehensive Bulletin of Surveillance of the Ministry of Health, from 2008 to 2010 a decline in the incidence of pertussis cases was observed (http://www.msal.gob.ar/index.php/home/boletin-integrado-de-vigilancia), but a major outbreak was detected in 2011 with an incidence of confirmed pertussis cases of 6.9 per 100 000 inhabitants and a case fatality ratio of 2.6%. From 2012 to 2014 a sustained decline in the incidence from 4.7 to 1.4 per 100 000 was registered. This decline was accompanied by a decrease in the case fatality ratio to 1.7% in 2012, 0.9% in 2013 and 1.1% in 2014. In 2015 and in 2016 increases in the incidence were detected at 2.2 in 2015 and 3.9 in 2016 (Fig. S1). Fortunately, these rises in the incidences were not accompanied by case fatality ratios: at 1.0% and 0.6% for 2015 and 2016, respectively. All these data would indicate that the MI effects a reduction in the case fatality ratio – that is, the strategy reduces the severity of those pertussis cases that would otherwise be fatal. Another significant effect of the MI was detected in the 2016 outbreak, one that had been expected because of the cyclicity of the disease. That the maximum incidence for each outbreak was different – 6.9 for the 2011 outbreak detected before the introduction of the MI and 3.9 for the 2016 episode evidenced after the introduction of MI – is noteworthy. The MI would, therefore, appear to reduce the magnitude of the outbreaks as well, though not affecting the occurrence.
In terms of the distribution of confirmed cases with respect to patient age during this 2010–2016 period, of the total confirmed cases each year, 25–29% corresponded to infants of less than 2 m of age and 62–89% to infants of less than 6 m. The majority of the notified pertussis cases between 2010 and 2016 corresponded to the more populated provinces such as Buenos Aires, Córdoba, Santa Fe and Mendoza [Reference Vizzotti20].
The next section will focus on the description of the epidemiological data of Buenos Aires since more detailed information is available. This epidemiological information was extracted from the data collected by the RPL and the online laboratory softward named SIVILA (Sistema de Vigilancia laboratorial).
Pertussis epidemiology of Buenos Aires
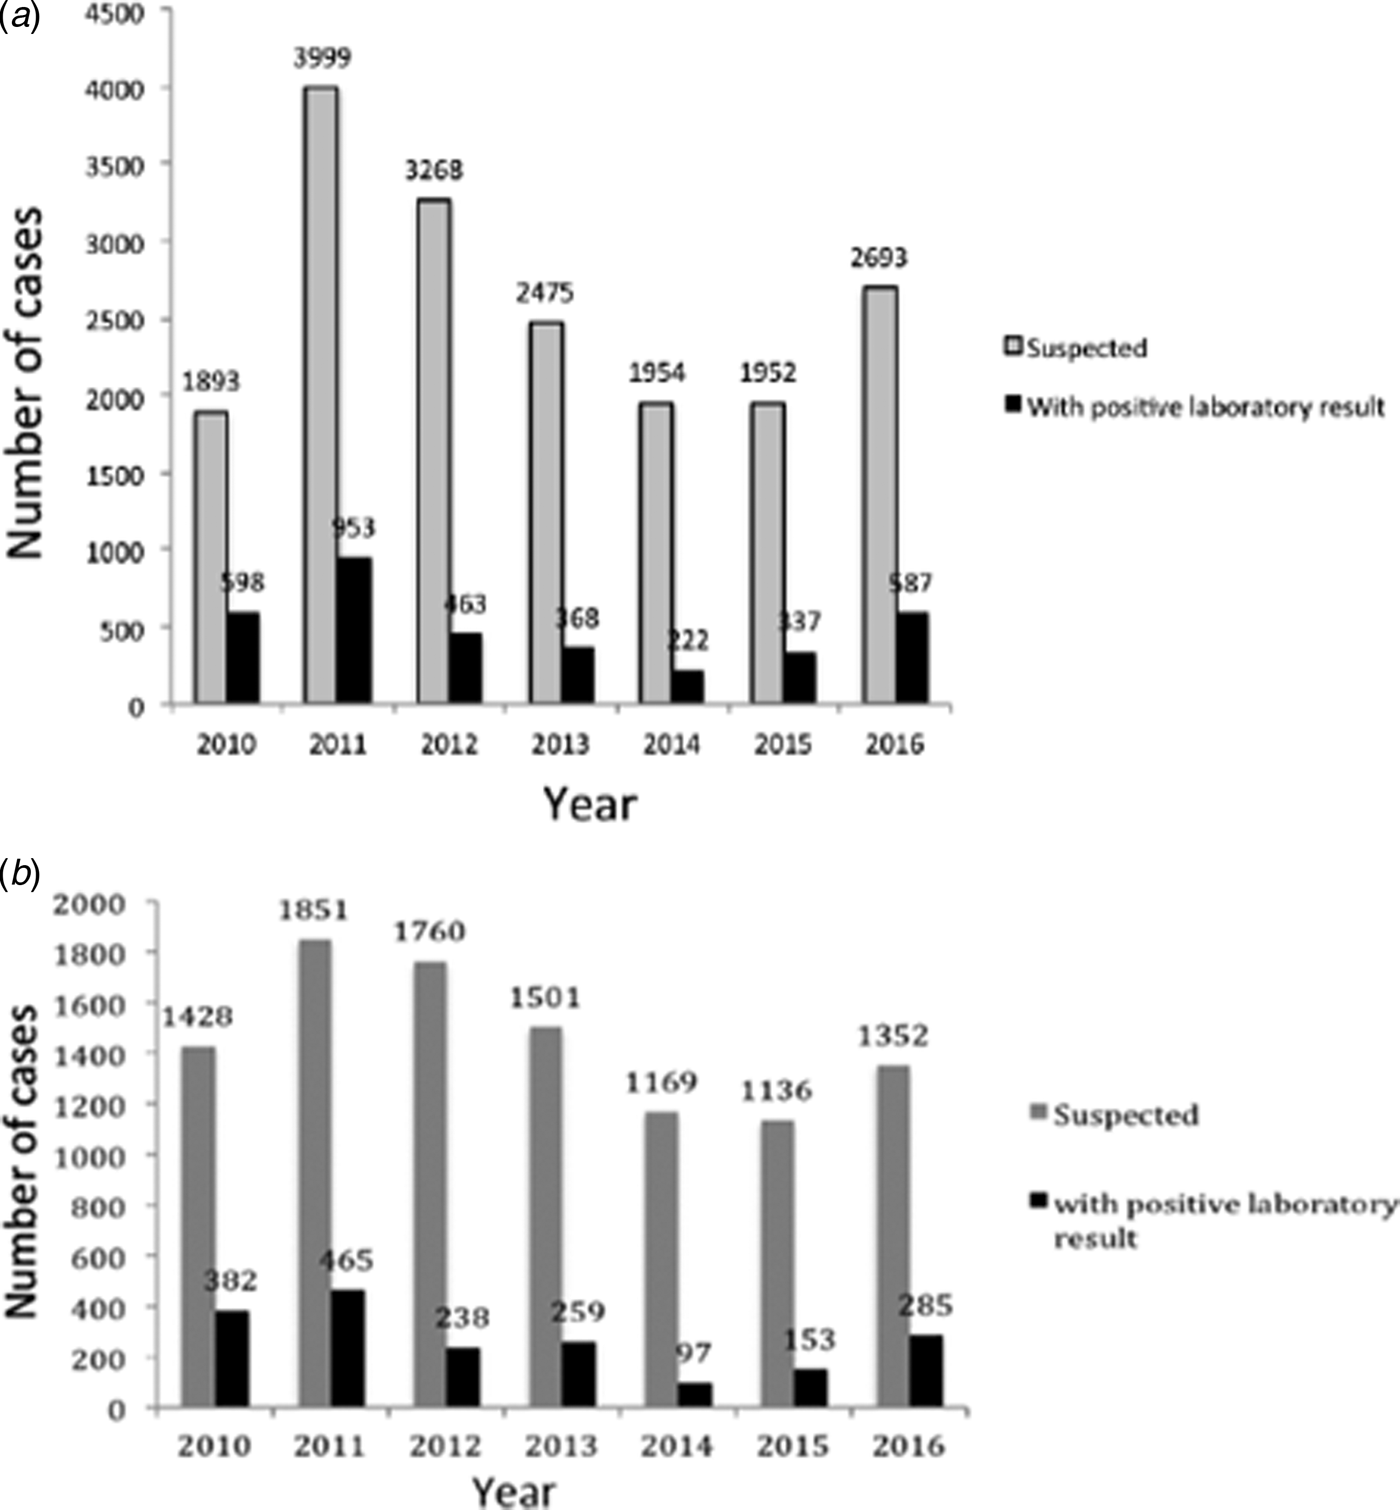
During 2010–2016 in Buenos Aires, a total of 18 234 clinical samples from pertussis-suspected cases were notified at SIVILA, from which group 3519 (19.3%) were laboratory-confirmed. Figure 2A summarises the distribution of the number of pertussis cases per year. As occurred throughout the whole country, in the Buenos Aires province two outbreaks were detected, one in 2011 and a second in 2016. This province also experienced a sustained decline in the number of cases during 2012–2014 followed by an increase in 2015 and 2016. From the 18 234 clinical samples of pertussis-suspected cases obtained during the period of 2010–2016, 10 197 samples (55.9% of the total) were received by the PRL. Of this latter total, 1897 (18.6%) gave a positive laboratory result. The distribution of cases analysed at the PRL per year (Fig. 2B) exhibited a pattern similar to that of the cases notified at SIVILA (Fig. 2A).
(A) Distribution of a number of pertussis cases notified at the SIVILA network per year during 2010–2016 in the Buenos Aires province. (B) Distribution of a number of pertussis cases notified by the Reference Lab per year during 2010–2016 in the Buenos Aires province. In both panels, the total number of cases per year is plotted on the ordinate for each year indicated on the abscissa. The numbers above the bars denote the precise ordinate values. Grey bars, clinically suspected cases; black bars, laboratory-confirmed cases.
Since the PRL received a representative number of clinical samples from patients whose epidemiology followed the same pattern as the one detected at the national level, the following analyses were carried out from the information collected by the PRL. In particular, we compared the epidemiological data registered during the two outbreaks detected, the first occurring before (2011) and the second after (2016), when MI was introduced in the healthcare calendar. First, we analysed the distribution of pertussis cases according to patient age during those two outbreaks (Fig. 3). In each year of the period analysed, most of the cases were detected in the groups of infants 0–2 and 2–4 m of age. We were interested in noting that although during both outbreaks the proportions of suspected cases in the 0–2 m-old group were similar, the proportion of cases with positive laboratory results diminished in 2016 (31.0%) relative to those detected in 2011 (34.5%). This decrease was also notable in the 2–4 m group (34.5% in 2011 vs. 27.0% in 2016). Since we expected that the greatest impact of the introduction of MI would be in the infants with fewer than 2 m of age, we analysed whether the number of cases with a high number of symptoms as well as the most severe symptoms of the disease – i.e. paroxysm, apnea, cyanosis and vomiting – diminished in this group during the outbreak occurring after the introduction of MI. As shown in Figure 3C and D, the proportion of pertussis cases with a high number of symptoms decreased during the 2016 outbreak. In 2016, the proportion of cases with laboratory-positive results involving a high number of symptoms (59.1% of the total cases) diminished in comparison with data from the 2011 outbreak in the absence of MI (71.9%), representing a decrease of about 18%.
Panel A: Proportions of suspected pertussis cases according to age during 2011 and 2016 outbreaks. Panel B: Proportions of pertussis cases with positive laboratory results according to age during 2011 and 2016 outbreaks. Panel C: Proportion of suspected pertussis cases in the 0–2-month-old group according to the number of symptoms in 2011 and 2016 outbreaks. Panel D: Proportion of cases in 0- to 2-month-old group with positive laboratory results according to the number of symptoms in 2011 and 2016 outbreaks. Panel E: Proportion of suspected pertussis cases in 0- to 2-month-old group according to the type of symptoms during the 2011 and 2016 outbreaks. Panel F. Proportion of cases in 0- to 2-month-old group with positive laboratory results according to the type of symptoms during the 2011 and 2016 outbreaks. In the six panels, the percentage of suspected (panels A, C and E) or laboratory-confirmed (B, D and F) cases of pertussis is plotted on the ordinates for the four infant-age cohorts between ages 0 and 12 months (m; A and B), the number of symptoms recorded within each peer group (C and D), or the type of symptoms experienced in each (E and F) on the abscissas. Black bars, 2011 outbreak; grey bars, 2016 outbreak.

Figure 3E and F illustrate how all the analysed symptoms diminished during the outbreak detected after the introduction of MI. The greatest decrease was observed in the proportion of paroxysms and vomits. All the data analysed here during the two similar epidemic situations (outbreaks) demonstrated the beneficial effect of MI – not only with respect to the number of cases but also in terms of the severity of the disease in the most vulnerable group – but of even greater significance was the result that immunisation during pregnancy reduced the case fatality ratio.
Estimations of the effect of MI by means of a mathematical model of pertussis transmission
Here, we analysed the effect of MI through the use of our previously designed pertussis-transmission model [Reference Fabricius23, Reference Pesco, Bergero, Fabricius and Hozbor27]. The patterns in the incidences of severe pertussis in the 0–2 m-old cohort is plotted in the top left graph of Figure 4A. These incidences were calculated assuming that MI began immediately after the outbreak, as transpired in Argentina in 2012 and with the high DTP3-coverage scenario. For the 2016 peak, the model predicted that the number of severe cases would be 36% of that occurring without the introduction of MI.
(A): Dynamic evolution of severe-pertussis incidence in the 0–2-month (m) age group predicted by the model after the introduction of the aP booster to pregnant women. Each panel plots the incidence pattern in cases per year per 100 000 on the ordinate for introduction of the booster at a different stages in the dynamic cycle (solid line) of the disease within the years from 2010 to 2020 indicated on the abscissa compared with the expected pattern in the absence of the booster (dashed line). The upper-left graph corresponds to the actual introduction of the booster (in 2012, after the 2011 incidence peak). The upper-right, lower-left and lower-right panels depict the hypothetical situations in which the booster was introduced before the first peak, exactly at the peak, or at the first minimum after the peak, respectively. The calculations were performed on the basis of a high DTP3-coverage scenario (95%). (B) The same as A but for the incidence in the 0–12-month age group. (C) The same as (B), but for a low DTP3-coverage scenario (80%).

Although the impact of MI on the incidence peak in the 0–12 m age group in 2016 was lower than that observed for the 0–2 m cohort (Fig. 4B), the overall profile of the incidences in both groups were similar. In 2016, the incidence in the 0–12 m cohort was predicted to reach 71.5% of the calculated value in the absence of MI. In addition, the effect of MI on the 0–12 m group under a low DTP3-coverage scenario would be lower (Fig. 4C): in 2016 the incidence was predicted to reach 80% of the calculated value in the absence of MI instead of the 71.5% calculated for the higher DTP3-coverage scenario (Fig. 4B). The most striking feature that emerges comparing Figure 4B and C is the higher absolute values in the incidences in Figure 4C resulting from the low coverage considered for the primary series.
We also analysed the effect of introducing the MI at a different stage in the dynamic cycle of the disease: both before and during an outbreak. That the beginning of MI would directly affect the incidence immediately after vaccine introduction was both striking and significant. If MI had been introduced in 2010, for example, the 2011 peak for the incidence of 0–2 m olds would hardly have occurred (Fig. 4A, upper right graph). In contrast, the decrease in the calculated incidences at the 2016 peak appeared to be independent of the time when MI began in relation to the initial outbreak (upper right and both lower graphs of Fig. 4A–C).
Comparisons between the reported data and the predictions obtained with the model
We next sought to perform comparisons between the results obtained with the model and the epidemiological data. To that end, we had to compensate the known difference between the epidemiological data and the calculations because of the underreporting of the epidemiological data. We defined a reporting factor for different population groups as follows:
 $$f_{\rm g}^{\rm R} = \displaystyle{{{\rm Inc}_{\rm g}^{\rm R}} \over {{\rm Inc}_{\rm g}^{\rm A}}} $$
Where  ${\rm Inc}_{\rm g}^{\rm R} $ is the incidence computed from cases reported in group ‘g’ and ${\rm Inc}_{\rm g}^{\rm A} $ is the actual incidence in the same group.
We differentiated the 0–2 m old from 2–12 m old group and severe disease from mild disease and evaluated the relative reported incidence for the 0–1y age group in 2016 with respect to 2011:
 $$\eqalign{A = & \displaystyle{{{\rm Inc}_{0 - 12{\rm m}}^{\rm R} (2016)} \over {{\rm Inc}_{0 - 12{\rm m}}^{\rm R} (2011)}} \cr = & \displaystyle{{{\rm Inc}_{s,0 - 2}^{\rm C} (2016) + f_{{\rm symp}}{\rm Inc}_{m,0 - 2}^{\rm C} (2016) + f_{{\rm age}}{\rm Inc}_{s,2 - 12}^{\rm C} (2016) + f^{\prime}_{{\rm symp}}f_{{\rm age}}{\rm Inc}_{m,2 - 12}^{\rm C} (2016)} \over {{\rm Inc}_{s{\rm, 0} - {\rm 2}}^{\rm R} (2011) + f_{{\rm symp}}{\rm Inc}_{m,0 - 2}^{\rm C} (2011) + f_{{\rm age}}{\rm Inc}_{s,2 - 12}^{\rm C} (2011) + f^{\prime}_{{\rm symp}}f_{{\rm age}}{\rm Inc}_{m,2 - 12}^{\rm C} (2011)}}}$$
 where  ${\rm Inc}_{\rm g}^{\rm A} $ was replaced by the incidences obtained from the model calculations, ${\rm Inc}_{\rm g}^{\rm C} $. under the assumption that the model predicted the values of the actual incidences. We also introduced the relative reporting factors
 $$f_{{\rm age}} = \displaystyle{{\,f_{s,2 - 12}^{\rm R}} \over {\,f_{s,0 - 2}^{\rm R}}}, $$
 $$f_{{\rm symp}} = \displaystyle{{\,f_{m,0 - 2}^{\rm R}} \over {\,f_{s,0 - 2}^{\rm R}}} $$
and
 $$f_{{\rm symp}}^{\prime} = \displaystyle{{\,f_{m,2 - 12}^{\rm R}} \over {\,f_{s,2 - 12}^{\rm R}}}. $$
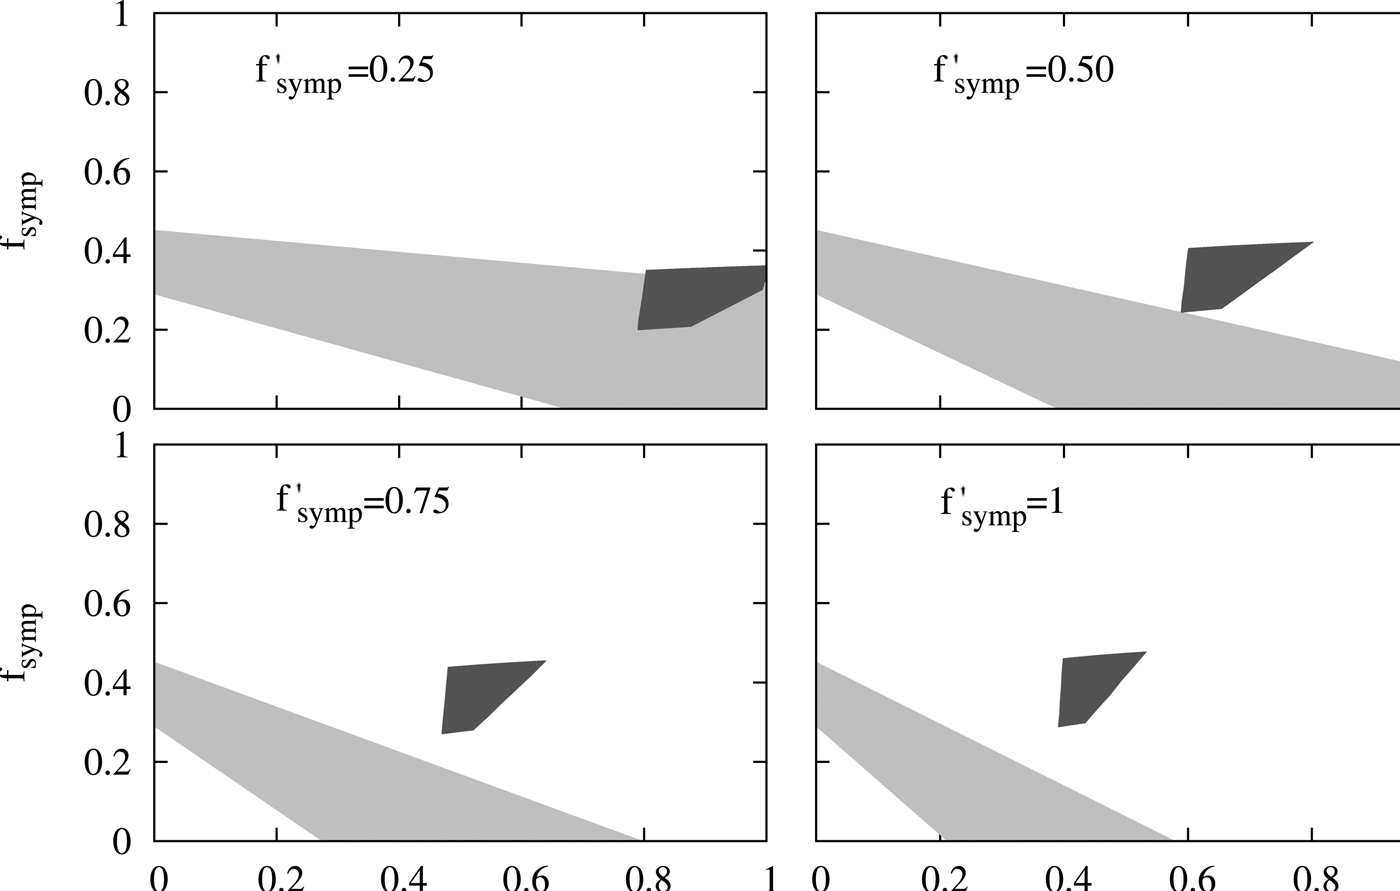
These factors are the variables of our study and would account for the relative reporting of severe cases between 2 and 12 m with respect to those between 0 and 2 m (f age), the relative reporting of moderate cases with respect to the severe cases in the 0–2 m group (f symp) and the relative reporting of moderate cases with respect to the severe cases in the 2–12 m group (f ′ symp). Assuming that these factors are numbers between 0 and 1, the right side of Equation (1), can be considered a function A(f age, f symp, f ′ symp) with the objective of determining the set of possible numbers assigned to f age, f symp, f ′ symp that give a value of A that is compatible with the epidemiological observations presented in this work. These observations indicate that the incidence in the 0–12-month group in Argentina decreased to 56% in 2016 compared with 2011, similar to that observed for Buenos Aires (61%). For those calculations we considered A to be in the range: 0.55 <A < 0.65.
In Figure 5, we have shaded with light grey the set of values of (f age, f symp) which give values of A between 0.55 and 0.65 for different values of f ′ symp where the calculated incidences  ${\rm Inc}_{\rm g}^{\rm C} $ used in Equation (1) correspond to a high-coverage scenario and introduction of aP in 2012 (upper left graphs of Fig. 4A and B). In our analysis we also incorporated the quotient, B(t), between the cases reported in the 0–2 m group and in 0–12 m group for a given ‘t’ year:
 $$\eqalign{& B(t) = \displaystyle{{{\rm Inc}_{0 - 2{\rm m}}^R (t)} \over {{\rm Inc}_{0 - 12{\rm m}}^R (t)}} \cr & = \displaystyle{{{\rm Inc}_{s,0 - 2}^C (t) + f_{{\rm symp}}{\rm Inc}_{m,0 - 2}^C (t)} \over {{\rm Inc}_{s,0 - 2}^C (t) + f_{{\rm symp}}{\rm Inc}_{m,0 - 2}^C (t) + f_{{\rm age}}{\rm Inc}_{s,2 - 12}^C (t) + f_{_{{\rm symp}}} ^{\prime} f_{{\rm age}}{\rm Inc}_{m,2 - 12}^C \!(t)}}} $$
Evaluation of the compatibility of the results from the model with the reported epidemiological data. Each of the panels of the figure refers to a fixed value of f ′ symp. The shaded areas correspond to the set of points (f age, f symp) that verify that 0.55 < A < 0.65 (light grey) and to the set of points (f age, f symp) that verify simultaneously 0.3 < B(2015) <0.4, 0.3 < B(2016) <0.4 and 0.8 < B(2016)/B(2015) <0.9 (dark grey). A and B as functions of f age, f symp and f ′ symp are derived from equations (1) and (2) containing the results obtained with the model. The inequalities imposed on the functions A and B, which ranges generate the respective light- and dark-grey-shaded areas, arise from the epidemiological observations and the range of variation assigned to them (see text). In each of the graphs, the parameter f symp is plotted on the ordinate as a function of f age on the abscissa.

This magnitude remains approximately constant ranging between 0.3 and 0.4 between 2011 and 2016 when computed from the epidemiological reports obtained in PRL. Between 2011 (0.35) and 2016 (0.30), a reduction of 15% occurred. In Figure 5 we have shaded with dark grey the values of (f age, f symp) for different fixed values of f ′ symp that are compatible with a reduction of between 10 and 20% of B(t) in Equation (2) when using the incidences obtained by the model for the years 2011 and 2016. We also considered only the values of f age, f symp, f ’ symp for which B(t) was maintained between 0.3 and 0.4.
The figure indicates that in order to satisfy inequalities on B a considerable report of the cases with moderate symptomatology (f symp > 0.4) and older than 2 m (f age > 0.4) becomes necessary while the contrary holds for inequalities on A. This analysis demonstrates that no f age, f symp, f ′ symp is compatible with the two sets of epidemiological observations mentioned above. Therefore the results predicted by our model are not compatible with these epidemiological reports. In the supplementary material, we carried out a sensitivity analysis that shows that these results are robust for different possible values of some of the parameters included in the model. This conclusion led us to revise the assumptions made in our model, particularly the one regarding the duration of maternal immunity in infants. This assumption was based on reports on the duration of maternal antibodies in infants born to immunised mothers [Reference Villarreal Perez16, Reference Munoz18]. However, it was recently reported that MI has additional protection effect for infants with more than 2 m who have received the first doses of pertussis vaccine [Reference Baxter21]. Though the impact on infants incidence of this effect will be subject of a future work when more solid epidemiological information will be collected, here we analysed whether this additional effect of MI could approximate the data predicted by the model to the epidemiological data. To include this aspect we performed some modifications to the model that were described in the supplementary material (SM). Basically, we considered that effectiveness of DTP1 in infants born to vaccinated mother was 80% higher than that of infants born to non-vaccinated mothers. We could observe that by increasing the effectiveness of the DTP1, the incidence of severe cases in 0–12 m group is reduced by 50% in the 2016 peak with respect to the 2011 peak, whereas when this increase in the DTP1 was not considered, this reduction was only 28.5%. With these data, we obtained the Figure 6 in which interestingly a region of values of the relative reporting factors (f′symp ≈ f symp ≈ 0.25, f age ≈ 0.8) that makes possible the compatibility between calculation and epidemiological data could be observed.
Evaluation of the compatibility of the results from a modified model with the reported epidemiological data. The same comparison performed in Fig. 5 is here presented, but the calculations were carried out with a modified model that considers that MI also affects infants older than 2 months. In particular, we considered that the effectiveness of DTP1 in infants born to vaccinated mother was 80% higher than that of infants born to non-vaccinated mothers. Details were included in the SM.
Discussion
To shed light on the effects of MI, in the work reported here, we have provided not only data from the Argentine pertussis-surveillance system but also information arising from comparisons between two similar epidemiological situations (outbreaks) in which the sole evident variable was the use of the vaccination of pregnant women. In particular, we compared the data collected during two outbreaks: one in which the pregnant women were not aP-vaccinated (2011) and the other occurring in 2016 after the introduction of MI (2012). In 2012, the maternal pertussis-vaccination coverage was relatively high (50.9%) since that year was the one in which the policy was introduced in the country. The improvement in maternal-vaccination coverage in the following years was accompanied by a decrease in the case fatality ratio (0.6% in 2016).
After 2011, the incidence rate likewise exhibited a clear decrease in the confirmed cases throughout the whole country that continued until 2014. After that period, as expected from the cyclicity of the disease, an increase in the number of cases was observed and in 2016 another outbreak was detected. The 2016 incidence peak, however, was lower than that detected in the 2011 outbreak. In Buenos Aires, the epidemiologic pattern was similar to that detected in the whole country. For this province in 2016, a reduction in the number of cases in 0–2 m-old infants presenting paroxysms and/or vomiting was detected.
Calculations performed with our pertussis-transmission model enabled us to analyse whether the MI had a genuine impact on the reduction of pertussis cases beyond the fall in cases that would be expected to occur after an outbreak. Our model predicts for a high DTP3 coverage scenario a 64% reduction of the incidence of severe cases in the 0–2 m-old group in 2016 peak with respect to 2011 peak, and 28.5% reduction of the incidence in severe cases of 0–12 m-old group. We observed that the predicted reduction in the number of cases occurred independently of the time when MI was started. What was noteworthy, however, was that the greatest effect was realised in the hypothetical case in which MI is performed before the outbreak.
When we attempt a comparison of the epidemiological data with those calculated with the model, we found that no values for the considered underreporting factors rendered the calculations compatible with the data. This discrepancy could result because the calculations were performed assuming that MI had an effect on infants only up to 2 m of age. This assumption based on the duration of maternal antibodies in infants would appear to be incorrect in that MI probably has an effect lasting beyond the first 2 m of life. In agreement with this hypothesis, Baxter et al. reported a retrospective cohort study of infants born in California from 2010 to 2015 [Reference Baxter21] where they observed that MI was highly protective against pertussis, especially in the first 2 m of life, but also up to the first year. The authors also found that MI provides additional protection for infants who received the first dose of vaccine (DTP1). Interesting, when we considered this effect of MI in the model by increasing the effectiveness of the DTP1, the incidence of severe cases in 0–12 m is reduced by 50% in the 2016 peak with respect to the 2011 peak which would allow a better approximation between the calculation and the data reported.
Our results support the relevance of MI in the reduction of cases in the most vulnerable population, in particular, in infants between 0–2 m old, who are not yet old enough to receive the first dose of pertussis vaccine. Our hope is that this evidence could also be used in the community and public campaigns aimed at improving the overall vaccination rates both during pregnancy and in the primary series.
Supplementary material
The supplementary material for this article can be found at https://doi.org/10.1017/S0950268818000808
Acknowledgements
Dr Donald F. Haggerty, a retired academic career investigator and native English speaker, edited the final version of the manuscript. This work was supported by ANCPyT (PICT 2014-3617, PICT 2012- 2719), CONICET and CICBA (Argentina) grants to DFH. DFH, GF, PB and DB, are members of the Scientific Career of CONICET. MG is a professional assistant from CONICET. PMA is a fellow from ANPCyT.
Declaration of Interest
The authors declare that the research was conducted in the absence of any commercial or financial relationships that could be construed as a potential conflict of interest.


