


Introduction
Although surging glaciers represent a small percentage of the world’s glacier population, they are of great importance in the investigation of glacier processes, flow instabilities and fast glacier flow (Reference ClarkeClarke, 1987; Reference JiskootJiskoot, 1999). Usually defined as quasi-periodic advances or increases in flow speeds unrelated to external triggers (Reference Meier and PostMeier and Post, 1969; Reference SharpSharp, 1988), glacier surges are widely agreed to occur in response to internally driven oscillations in basal conditions. However, surging glaciers exhibit a very wide range of observed characteristics and behaviors, encompassing land-terminating and tidewater glaciers, cirque glaciers, valley glaciers and ice streams, as well as both temperate and polythermal regimes (Reference MurrayMurray, 2003).
The length of the surge cycle is commonly almost constant for a single glacier (Reference Meier and PostMeier and Post, 1969), and tends to be proportional to the length of the surge phase (Reference Dowdeswell, Hamilton and HagenDowdeswell and others, 1991). For instance, the well-documented surge history of Variegated Glacier, Alaska, USA, is characterized by a short surge cycle (repeating itself every 13–18 years) and short active phases (1–1.5 years) with high flow velocities reaching 40–60 m d−1 (Reference KambKamb and others, 1985; Reference Eisen, Harrison and RaymondEisen and others, 2001); in colder regions such as Svalbard, the surge cycles tend to be relatively longer (50–500 years), with longer active phases (3–10 years) (Reference Dowdeswell, Hamilton and HagenDowdeswell and others, 1991).
In response to this diversity, a wide variety of potential surge mechanisms has been proposed, focusing on basal processes, including cycling of thermal or hydrological conditions (Reference KambKamb and others, 1985; Reference Clarke, Schmok, Ommanney and CollinsClarke and others, 1986; Reference FowlerFowler, 1987; Reference Fowler, Murray and NgFowler and others, 2001; Reference Van Pelt and OerlemansVan Pelt and Oerlemans, 2012), or instabilities in a deforming bed (Reference Clarke, Collins and ThompsonClarke and others, 1984; Reference Truffer, Harrison and EchelmeyerTruffer and others, 2000).
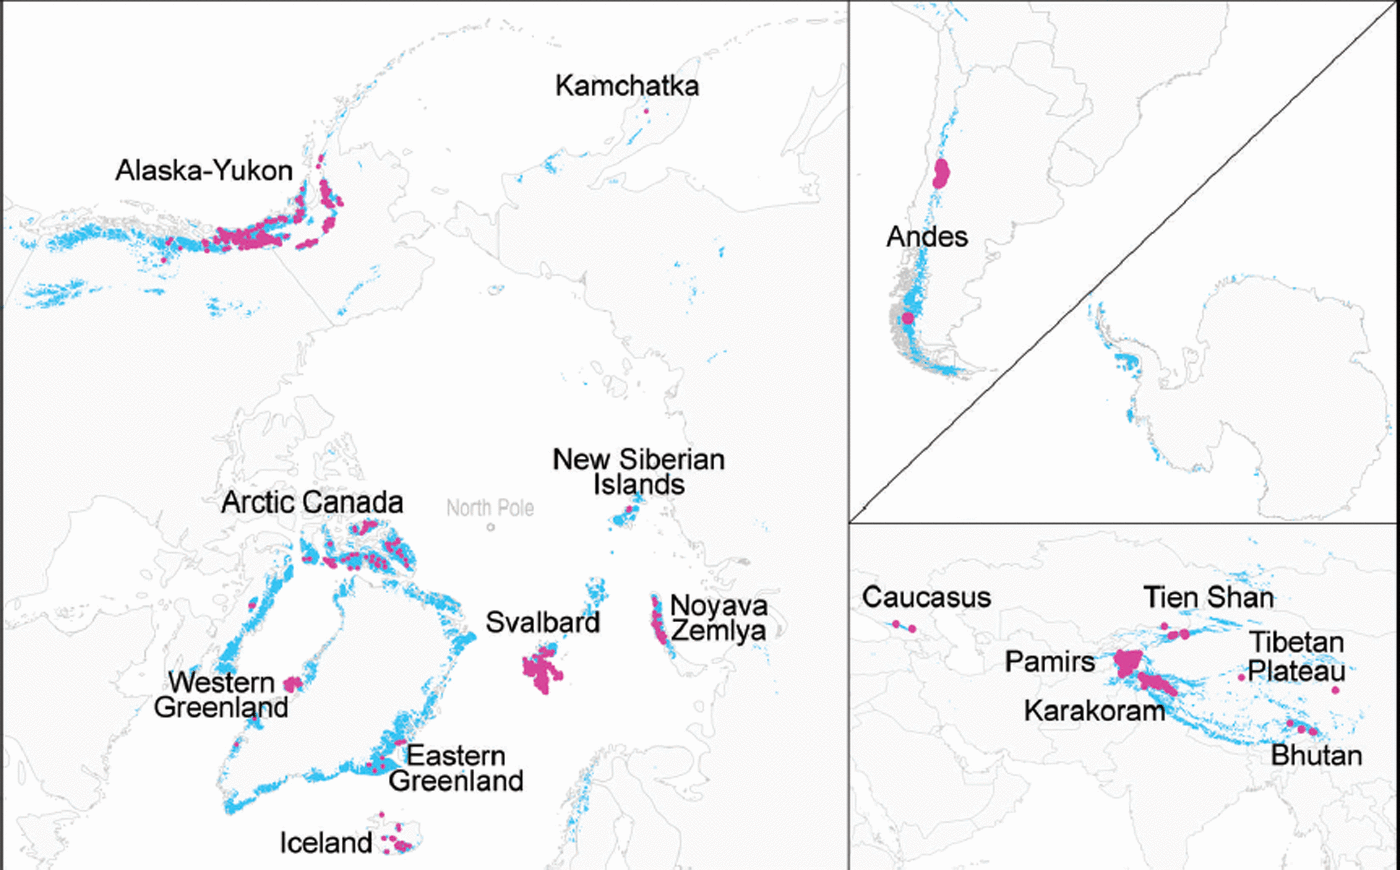
One of the most striking facts about surge-type glaciers is their tendency to cluster within particular regions (Fig. 1). Major clusters occur in Alaska–Yukon, Arctic Canada, parts of West Greenland (Disko Island, Nuusuaq Peninsula) and parts of East Greenland (Blosseville Kyst and Stauning Alper), Iceland, Svalbard and Novaya Zemlya (Reference PostPost, 1969; Reference Jiskoot, Luckman and MurrayJiskoot and others, 2002, Reference Jiskoot, Murray and Luckman2003; Reference Copland, Sharp and DowdeswellCopland and others, 2003; Reference Fischer, Rott and BjörnssonFischer and others, 2003; Reference Yde and KnudsenYde and Knudsen, 2007; Reference Citterio, Paul, Ahlstrom, Jepsen and WeidickCitterio and others, 2009; Reference Grant, Stokes and EvansGrant and others, 2009) and a number of mountain ranges in central Asia, including the Karakoram, Pamirs and western Tien Shan (Reference HewittHewitt, 1969, Reference Hewitt1998; Reference Osipova, Tchetinnikov and RudakOsipova and others, 1998; Reference Kotlyakov, Osipova, Tsvetkov and JackaKotlyakov and others, 2008; Reference CoplandCopland and others, 2009, Reference Copland2011). Outside these major clusters, surge-type glaciers are rare or absent, although small clusters or isolated examples also occur in the Caucasus Mountains, the Andes, New Siberian Islands, Kamchatka and Tibet (Reference Dolgoushin and OsipovaDolgoushin and Osipova, 1975; Reference EspizúaEspizúa, 1986; Reference ZhangZhang, 1992; Reference KotlyakovKotlyakov, 1996; Reference Dowdeswell and WilliamsDowdeswell and Williams, 1997; Reference Casassa, Espizúa, Francou, Ribstein, Ames, Alean, Haeberli, Hoelzle and SoterCasassa and others, 1998; Reference Kotlyakov, Rototaeva and NosenkoKotlyakov and others, 2004; Reference Yafeng, Desheng, Tandong, Quinzhu, Chaohai, Williams and FerrignoYafeng and others, 2010).
Global distribution of surge-type glaciers (pink dots) based on our geodatabase. Normal glaciers are represented in blue. Glacier outlines for the normal glaciers are from the Randolph Glacier Inventory (RGI) version 3.2.
Several statistical studies have been undertaken to compare surge-type and non-surge-type glaciers within individual clusters, aiming to identify possible topographic and geological controls on surging behavior (Reference PostPost, 1969; Reference Clarke, Schmok, Ommanney and CollinsClarke and others, 1986; Reference WilburWilbur, 1988; Reference ClarkeClarke, 1991; Reference Hamilton and DowdeswellHamilton and Dowdeswell, 1996; Reference Jiskoot, Boyle and MurrayJiskoot and others, 1998, Reference Jiskoot, Murray and Boyle2000, Reference Jiskoot, Murray and Luckman2003; Reference Björnsson, Pálsson, Sigurðsson, Flowers, Raymond and Van der VeenBjörnsson and others, 2003; Reference Barrand and MurrayBarrand and Murray, 2006; Reference Grant, Stokes and EvansGrant and others, 2009). Such studies have identified a number of statistically significant correlations within clusters, indicating that some particular models of surging are more appropriate in some regions. For example, work by Reference Jiskoot, Murray and BoyleJiskoot and others (2000) suggests that a thermal switch model is more appropriate for the surges in Svalbard, while a hydrologic switch model appears to operate in central East Greenland (Reference Jiskoot, Murray and LuckmanJiskoot and others, 2003). Interestingly, in this latter region both Svalbard-type and Alaskan-type surges were observed (Reference Jiskoot and JuhlinJiskoot and Juhlin, 2009). Nonetheless, these studies have not provided definitive answers as to why glaciers in some regions are prone to surging whereas others are not.
In this paper, we take a new approach to the problem of glacier surging, and employ a global geodatabase of all known surge-type glaciers to investigate climatic and geometric controls on surge phenomena on global and regional scales. Although it has long been recognized that the distribution of surge-type glaciers is non-uniform (Reference PostPost, 1969; Reference RaymondRaymond, 1987), climate has never been statistically investigated as a possible underlying control on this distribution (Reference Meier and PostMeier and Post, 1969; Reference PostPost, 1969). Climate has only been connected to surging as a control on the thermal and mass-balance regimes of surging glaciers (Reference Jiskoot, Murray and BoyleJiskoot and others, 2000; Reference Copland, Sharp and DowdeswellCopland and others, 2003; Reference Harrison and PostHarrison and Post, 2003), and the periodicity of surge cycles (Reference Eisen, Harrison, Raymond, Echelmeyer, Bender and GordaEisen and others, 2005; Reference StribergerStriberger and others, 2011), and climate change has been invoked as a possible reason for the disappearance of surging glaciers from regions (Reference HoinkesHoinkes, 1969) or a reduction in their number (Reference Dowdeswell, Hodgkins, Nuttall, Hagen and HamiltonDowdeswell and others, 1995). In this paper, we investigate the role of climate in the present-day global distribution of surge-type glaciers using ERA-Interim (ERA-I) reanalysis data, and consider the role of glacier geometry as a secondary, local-scale control.
The paper begins with an introduction to the geodatabase on surge-type glaciers, and a description of the methods employed in the analysis. We then demonstrate that surge-type glaciers occupy well-defined subsets of the total climatic range of the world’s glaciers, defined in terms of mean precipitation and temperature variables, and also exhibit strong geometric biases. We go on to model the global distribution of surge-type glaciers using Maxent, a species distribution model widely used in the biological sciences. Finally, we discuss the significance of our results using the concept of glacier enthalpy balance, and argue that oscillatory or unstable flow regimes reflect a mismatch between rates of heat production (balance velocity) and dissipation (conduction and runoff), both of which have strong climatic and geometric controls.
Datasets and Methods
Geodatabase of surge-type glaciers
We compiled a global inventory of surge-type glaciers based on 305 peer-reviewed publications and historical reports, consisting of either direct observations of a surge or identification of a glacier as being surge-type from glaciological or geomorphological evidence. The oldest observations date from 1861 and extend until 2013. No new observations were made in this study. By compiling such a large number of references, we faced a patchwork of interpretations of what a surge is, combined with a wide spectrum of glacier behaviors interpreted by researchers as a ‘surge’. For inclusion in the geodatabase, every identification of a surge-type glacier had to conform to the criteria listed in Table 1. The criteria are consistent with those adopted in existing inventories (e.g. Reference Copland, Sharp and DowdeswellCopland and others, 2003, Reference Copland2011; Reference Grant, Stokes and EvansGrant and others 2009). For glaciers for which a surge phase was not directly observed, the glacier and/or its proglacial environment had to display a sufficient combination of geomorphological/glacial geomorphological features to confirm surging (Reference Clarke, Schmok, Ommanney and CollinsClarke and others, 1986; Reference Copland, Sharp and DowdeswellCopland and others, 2003; Reference Barrand and MurrayBarrand and Murray, 2006; Reference Grant, Stokes and EvansGrant and others, 2009).
List of criteria used for inclusion of a glacier in the geodatabase

Many existing inventories included in our database assign a study-specific ‘surge index’ to every glacier listed (Reference OmmanneyOmmanney, 1980; Reference Clarke, Schmok, Ommanney and CollinsClarke and others, 1986; Reference Hamilton and DowdeswellHamilton and Dowdeswell, 1996; Reference Jiskoot, Murray and BoyleJiskoot and others, 2000; Reference Copland, Sharp and DowdeswellCopland and others, 2003). These indices attempt to quantify the likelihood of a particular glacier being of surge type. In the published literature, a total of 75% of the glaciers of the geodatabase have been ranked using 11 different surge indices. While single observations were first filtered through the criteria written in Table 1, we decided to homogenize and qualitatively reassess every observation by applying our own harmonized surge index. This ranks every glacier on a scale from 1 to 3, 3 being a confirmed surge-type glacier, 2 a very probable surge-type glacier and 1 a possible surge-type glacier. The details of each of these classes and their equivalence to other study-specific surge indices are presented in Tables 1 and 2 and Appendix A (Tables 4 and 5).
Number of surge-type glaciers included in the geodatabase, split between regions and surge index categories

The geodatabase incorporates a total of 2317 glaciers and tributaries, of which 1148 are directly observed and dated surges, and 186 glaciers have more than one surge referenced (see Table 2 for numbers of surge-type glaciers for each region and for categories 1–3). Each glacier is georeferenced by the latitude/longitude of its center point, and data on its geometry are provided. Tributaries are added as separate entries if their behavior differs from that of the main trunk. To allow comparison of surge-type glaciers with the total global population of glaciers, the geodatabase was combined with the Randolph Glacier Inventory (RGI) version 3.2, released in September 2013 and downloaded from http://www.glims.org/RGI/ (Reference ArendtArendt and others, 2012). Combining the geodatabase with the RGI resulted in ∼1430 individual surge-type glaciers, as the tributaries are merged with their main trunk.
Climate data
To investigate possible climatic controls on the distribution of surge-type glaciers we used ERA-I reanalysis datasets produced and distributed by the European Centre for Medium-Range Weather Forecasts (ECMWF), downloaded from http://data-portal.ecmwf.int/data/d/interim_mnth/. Spatial resolution (horizontal and vertical) is 0.75° × 0.75° × 60 levels (approximately 83 km × 28 km in the horizontal at 70° N and S, 83 km × 53 km at 50°, and 83 km × 72 km at 30°, and 80 km in the vertical) (Reference DeeDee and others, 2011; Fig. 2).
Examples of ERA-Interim cells cropped over two glaciated regions: Alaska–Yukon (left) and central Asia (right). The dimensions of the ERA-I cells vary across the world. Cells with surge-type glaciers are colored based to the number of surge-type glaciers present in each cell.

In this study we use the Synoptic Monthly Means Forecast surface dataset from January 2000 to December 2009. We focused our interest on two glaciologically significant variables: 2 m temperature (parameter 167) and total precipitation (parameter 228). The ERA-I dataset takes into account the mean topography of each cell. The grids were then processed in ArcGIS 10.1 to compute annual, seasonal and decadal averages of the monthly means for the whole world.
Climatic data were spatially extracted for all glaciers in the RGI based on the location of their center point, whether they are surge-type or normal glaciers. In total, the 203 975 glaciers composing the RGI v3.2 were assigned temperature and precipitation data averaged over the decade January 2000–December 2009, over the ERA-I gridcells. We then split the total glacier population into surge-type and non-surge-type datasets for analysis.
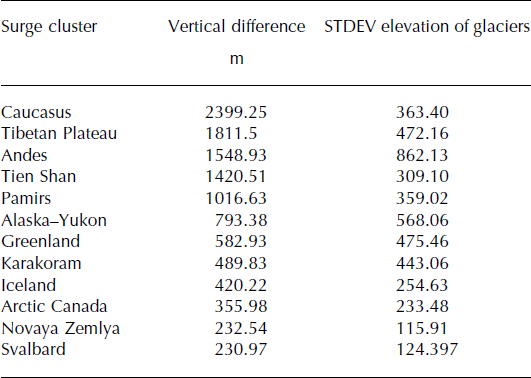
The mismatch between the time window of the surge observations (1861–2013) and the ERA-I data (2000–09) is a potential source of error, because early 21st-century climate data may not be representative of conditions when a particular surge took place. However, we do not believe that this is a serious problem for the initial global-scale analysis presented here. The ERA-I data represent only an approximate climatology for individual glaciers, and may be unrepresentative in cells with very high vertical relief. To assess which regions could suffer the most from these vertical differences, we calculated the difference between the mean elevation of the glaciers’ center point and the mean elevation of the corresponding ERA-I cell. The surge clusters most affected are the Caucasus (difference of 2400 m), followed by the Tibetan Plateau (1800 m) and the Andes (1550 m). Therefore the glaciers found in these regions are likely to experience colder conditions than indicated by the ERA-I data. A detailed list of the vertical differences for each surge cluster is provided in Table 3. However, we believe that errors introduced by large ERA-I cell size are offset by the advantages of a homogeneous global climatic dataset.
Difference between the elevation of the glaciers’ center point and the mean elevation of the ERA-I cell they belong to, for all the main surge clusters. The regions are ranked from the largest to the smallest difference. The rightmost column indicates the standard deviation of the mean elevation of the glaciers belonging to each region
Glacier geometry variables
In addition to climatic data, we investigated differences in geometry between surge-type and normal glaciers across all the glacierized regions. Glacier area was measured for all the glaciers of the RGI using the outlines of the same dataset. Combining the glacier outlines with the 3 arcsec horizontal resolution dataset from the ASTER GDEM V2 allowed us to extract further information on glacier elevation (minimum, maximum and range) for the same glaciers. The ASTER GDEM V2 was downloaded from http://gdem.ersdac.jspacesystems.or.jp/ (ASTER GDEM is a product of the Ministry of Economy, Trade and Industry, Japan (METI) and NASA). The absolute vertical accuracy of the GDEM V2 has been tested against 18 000 geodetic ground control points from the US National Geodetic Survey. Calculations have revealed a root-mean-square error of 8.68 m, with a mean vertical offset from sea level of −0.20 m (Reference Gesch, Oimoen, Zhang, Meyer and DanielsonGesch and others, 2012). This dataset has been shown to be suitable for the compilation of topographic glacier inventory parameters (Reference Frey and PaulFrey and Paul, 2012) and was chosen for its consistency over all glacierized regions. Other geometrical attributes (e.g. glacier length, average slope and aspect) were derived for all the glaciers of the RGI using a global dataset of glacier center lines from Reference Machguth and HussMachguth and Huss (2014). We discovered that in some regions, glacier outlines in the RGI are erroneously reported as ellipses. Consequently, geometry data had to be discarded for the following regions: Kamchatka, parts of Altai, Ural, Gary Byranga, Verkhoyansk and Kolyma mountain ranges (see Fig. 3).
Left: regions where glacier outlines are erroneous are marked in red. Right: example over the Kamchatka region of erroneous outlines in the shape of ellipses.

We used an additional set of glacier center lines for Alaska. This region is home to one of the densest populations of surge-type glaciers, with a very well-defined distribution. Surge-type glaciers are notably absent from the Brooks Range in the north, and gradually disappear southwards in the southeastern ranges of the Coast Mountains. Alaska is therefore a particularly interesting region to investigate climatic and geometric differences between normal and surge-type glaciers. Reference Kienholz, Rich, Arendt and HockKienholz and others (2014) have developed an extensive dataset on the geometry of the Alaskan glaciers, automatically extracting glacier center lines and a suite of metrics including number of branches and length of the longest center lines. Here we employ one of their metrics, glacier ‘branchiness’ measuring the number of branches composing each glacier.
Maxent: methods
Statistical analysis of the distribution of surge-type glaciers with respect to climatic and glacier geometry variables was performed using the species distribution model Maxent (Reference Phillips, Anderson and SchapirePhillips and others, 2006). Species distribution models (SDMs), also referred to as environmental or ecological niche models, are widely used by biologists to predict the distribution of a species by correlating known occurrence localities to a set of environmental variables (Reference Elith and GrahamElith and Graham, 2009). SDMs are traditionally used to estimate the fundamental niche of a species (i.e. the set of all conditions that allow for its long-term survival), to define habitat characteristics and estimate habitat suitability, and to explain patterns of species distribution (e.g. Reference Corsi, de Leeuw, Skidmore, Boitani and FullerCorsi and others, 2000; Reference Peterson and ShawPeterson and Shaw, 2003). In this study we challenge an SDM to reproduce the global distribution of the ‘species’ of surge-type glaciers based on the geodatabase of surge-type glaciers and the climatic and glacier geometry information described above.
Maxent is one of the most popular and widely used methods for environmental niche modelling (Reference Merow, Smith and SilanderMerow and others, 2013), and is one of the best-performing techniques for dealing with presence-only data (Reference ElithElith and others, 2006; Reference Hernandez, Graham, Master and AlbertHernandez and others, 2006; Reference WilliamsWilliams and others, 2009; Reference Mateo, Croat, Felicísimo and MuñozMateo and others, 2010). The popularity of Maxent rides on the growing interest in presence-only datasets, composed solely of an inventory of the occurrence locations of a species without any additional information on where the species is truly absent. It is appropriate to define the geodatabase on surge-type glaciers as a presence-only dataset due to the episodic nature of surging and the non-systematic monitoring of glacier velocity changes. A lack of observations of surging behavior does not imply that the glacier has never surged, or will not do so in future.
Maxent computes the probability distribution of a species’ occurrence, constrained by environmental variables that represent incomplete information about the original unknown distribution, and assuming that the true distribution exhibits maximum entropy (i.e. the distribution closest to uniform) (Reference Phillips, Anderson and SchapirePhillips and others, 2006). In this case, entropy can be understood as a measure of uncertainty or ignorance. In order to estimate the true distribution of surge-type glaciers, Maxent uses only what we know (i.e. where some surge-type glaciers are found and in which conditions), without going beyond these prior stated data. For our study, we utilize Maxent version 3.3.3k freely available at http://www.cs.princeton.edu/∼schapire/maxent/. Reference Phillips and DudíkPhillips and Dudík (2008) provide a full description of Maxent’s algorithms.
Maxent can only process ASCII grids, which we cropped to the glacierized regions, meaning that Maxent’s predictions will not cover other land surfaces. Because all climate data are gridded, we average the glacier geometry values of all glaciers present in every cell of the canvas. We use as a canvas the ERA-I grids for the climatic data; the cell size is therefore 0.75° × 0.75°. For runs that included geometry data, we adopted smaller cells of 0.05° × 0.05° in order to prevent extreme skewing of averaged values (e.g. the presence of one large glacier surrounded by a thousand small ones would result in a very low average glacier area for the cell).
The discriminatory ability of the model output was quantified using the AUC metric (area under the receiver operating characteristic curve) (Reference Hanley and McNeilHanley and McNeil, 1982). AUC scales from 0 to 1, where 0.5 is no better than random and 1 denotes perfect discrimination; AUC > 0.9 is considered an excellent fit (Reference Elith and GrahamElith and Graham, 2009). We performed two types of run of the model, (1) single runs using 75% of the data as a training set and 25% for validation and (2) series with replicates to evaluate the results with k-fold cross-validation. The replicate technique performs a series of random splits of the presence data into training and test sets, and therefore systematically uses all the data for validation. At each replication, the model is tested on different training/testing partitions called ‘folds’. Given the number of occurrence points, we performed ten replicates, hence testing 10% of the data at each repetition. K-fold cross-validation can suffer from spatial correlation between the training and the testing datasets, which can yield overestimates of the model performance and underestimates of the errors in predictions (Reference Radosavljevic and AndersonRadosavljevic and Anderson, 2014), and we tested for this by comparing the results of the single and multiple-fold runs. Finally, a jackknife test was used to assess and rank variable importance (Reference WuWu, 1986).
Results
Climatic envelopes
The distribution of surge-type and normal glaciers with respect to ERA-I mean annual temperature (MAT) and mean annual precipitation (MAP) is shown in Figure 4a. Surge-type glaciers are clustered in a well-defined climatic envelope within which both normal and surge-type glaciers coexist, whereas outside the envelope only normal glaciers are found. The climatic envelope for surge-type glaciers can be divided into two subzones. In the coldest and driest environments are the surge-type glaciers of Arctic Canada. Surge-type glaciers are rare in this subzone, accounting for only 54 of the 11 757 glaciers in the RGI (0.46%). The second and larger segment of the climatic envelope covers a broader range of climate, with ERA-I MAT ranging from −12°C to +8°C, and MAP from 165 to 2155 mm a−1. Surge-type glaciers in this part of the envelope occur within two superclusters: (1) a broad band extending through the Arctic and sub-Arctic from Alaska to Novaya Zemlya (the ‘Arctic Ring’), excluding Arctic Canada, and (2) High Mountain Asia (Fig. 4a(i)).
Climatic distribution of the populations of normal and surge-type glaciers. (a(i)) Mean annual precipitation against mean annual temperature; (a(ii)) completes the same plot with additional information on the number of glaciers present in every ERA-I cell. (b(i)) Mean winter precipitation against mean winter temperature; (b(ii)) completes the same plot with additional information on the number of glaciers present in every ERA-I cell. (c(i)) Mean summer precipitation against mean summer temperature; (c(ii)) completes the same plot with additional information on the number of glaciers present in every ERA-I cell. Note that all horizontal axes are in log scale, and that the size of the ellipses representing number of glaciers per cell differs between surge-type and normal glaciers.

Despite their geographical separation, the climatic parameters of the two superclusters almost completely overlap. The majority of surge-type glaciers in the Arctic Ring and High Mountain Asia are found below a threshold in MAT, which rises from −10°C at MAP = 165 mm a−1 to 0°C at MAP = 402 mm a−1. Above this threshold, surge-type glaciers are rare, and apart from a few outliers are absent where MAT exceeds +8°C.
The only exceptions to this pattern are a few surge-type glaciers in the central Andes, which occur within ERA-I cells with much higher MAT than any other surge-type glaciers. This anomaly can be explained by the large difference between the elevation of these Andean glaciers and the mean elevation of the ERA-I cells in which they belong (see Table 3). Therefore the temperature and precipitation figures are unrepresentative of the true local climate surrounding these steep, high-elevation glaciers. More detailed analyses are required to investigate this issue, and in the present paper we focus on the general global patterns.
Figure 4a(ii) shows the number of glaciers per ERA-I cell, and highlights the optimal climatic envelope for surge-type glaciers. While cells containing high densities of normal glaciers are scattered throughout a wide range of climatic conditions, high densities of surge-type glaciers are clearly grouped in a band located in the central part of the surge-type climatic envelope, with MAT of -10°C to 0°C, and MAP from 30 to 2250mm a−1. Surge-type glaciers are uncommon in colder, drier environments (i.e. Arctic Canada), and become increasingly rare when MAT exceeds 0°C.
Seasonal climatic data highlight further patterns in glacier distributions (Fig. 4b and c). Surge-type glaciers occur over a very wide range of mean winter (October–April for the Northern Hemisphere, June–September for the Southern Hemisphere) temperatures (MWT) and precipitation (MWP), although they are absent from warm, wet regions. The thresholds delineating the climatic envelope for surge-type glaciers can be described by a linear relation between temperature and precipitation. In this case, surge-type glaciers occur very seldom in regions where MWT > 0.007 MWP − 4.7 (MWT in °C, MWP in mm a−1). However, the majority of surge-type glaciers occupy a much tighter winter climatic envelope (Fig. 4b(ii)), with MWT = −16°C to −6°C, and MWP= 200–1130 mm a−1. Surge-type glaciers are strongly restricted by an upper limit in mean summer (May–September for the Northern Hemisphere, October–May for the Southern Hemisphere) temperature (MST), and almost entirely absent where MST = 0.0025MSP + 6.5 (MST in °C; MSP: mean summer precipitation in mm a−1). Only four cells with surge-type glaciers in the Caucasus Mountains and four cells with surge-type glaciers in the Andes occur above this threshold. Again, we expected these regions to be affected by the unrepresentativeness of ERA-I climatic averages in steep, isolated mountain massifs. Surge-type glaciers are also uncommon above a summer precipitation threshold, with only a few in the Pamirs and the Tibetan Plateau occurring where MSP > 1100 mm a−1.
Thresholds bounding the optimal surge zone appear even clearer when plotting MST against MWP (Fig. 5). Surge-type glaciers are absent above MST = 0.001MWP + 8.4, and below MST = 0.0014MWP − 0.97. A clear threshold in precipitation provides the lower boundary for the optimal surge envelope with MST = 0.015MWP − 28.23.
Climatic distribution of the populations of normal and surge-type glaciers, in a combination of mean winter precipitation against mean summer temperature. Regions so far not known among the clusters of surge-type glaciers but overlapping the optimal surge zone are delineated. Note that the horizontal axis is in log scale.

Delineation of these climatic envelopes allows identification of other potentially suitable regions where surge-type glaciers may occur, but which have not been reported. These regions belong to the same climatic envelope as the Arctic Ring and High Mountain Asia superclusters, and include the glaciers of Siberia and Franz Josef Land. Interestingly, the entire Antarctic Peninsula falls within the optimal surge climatic envelope (see Fig. 5).
Glacier geometry
Previous analyses have identified a number of glacier geometry variables that show statistically significant correlations with surging behavior, including glacier length, width and surface slope (Reference Clarke, Schmok, Ommanney and CollinsClarke and others, 1986; Reference ClarkeClarke, 1991; Reference Hamilton and DowdeswellHamilton and Dowdeswell, 1996; Reference Jiskoot, Boyle and MurrayJiskoot and others, 1998, Reference Jiskoot, Murray and Boyle2000, Reference Jiskoot, Murray and Luckman2003; Reference Björnsson, Pálsson, Sigurðsson, Flowers, Raymond and Van der VeenBjörnsson and others, 2003; Reference Barrand and MurrayBarrand and Murray, 2006; Grant and others, 2006). Until now, only four regions have been covered by these investigations: Alaska–Yukon, Iceland, Karakoram and Svalbard. Using the outlines of the RGI combined with the global dataset of center lines from Reference Machguth and HussMachguth and Huss (2014), we investigated differences in area, length, range, slope and aspect between surge-type and normal glaciers both on global and regional scales. In addition, and similarly to Reference Clarke, Schmok, Ommanney and CollinsClarke and others (1986), Reference Hamilton and DowdeswellHamilton and Dowdeswell (1996), Reference Jiskoot, Murray and LuckmanJiskoot and others (2003) and Reference Grant, Stokes and EvansGrant and others (2009), we explored the importance of glacier complexity and number of tributaries composing a glacier system by using the branchiness index of Reference Kienholz, Rich, Arendt and HockKienholz and others (2014) in Alaska.
Figure 6 shows the results for every geometry attribute for the main surge clusters. New Siberian Islands and Kamchatka were excluded from the analysis for having respectively three and two surge-type glaciers, according to our geodatabase. In every cluster where both surge-type and normal glaciers coexist, the former are larger. A t test denoted statistically significant differences between the means of both populations for all clusters. The largest surge-type glaciers are found in Arctic Canada, with an average area of 627 km2, compared with 9.5 km2 for normal glaciers. This region also displays the largest difference in size between the two populations in the world. Most of these glaciers are outlets from ice caps. Very large differences between the areas of surge-type and normal glaciers are also found in Iceland and Novaya Zemlya. The smallest differences in size between surge-type and normal glaciers are found in the Caucasus and High Mountain Asia. There, surge-type glaciers are still larger than normal glaciers but the average difference in size between the two is <14 km2.
Difference in glacier geometry between normal and surge-type glaciers across the main surge clusters. Surge-type glaciers are represented in pink, with normal glaciers in gray. ‘Area’ denotes glacier area, ‘Range’ stands for elevation range, ‘Length’ is the length of the center line, ‘Aspect’ is measured clockwise from the true north, and ‘Slope’ is averaged along the glacier’s center line. Note that the vertical axes for area and length are in log scale. Significant statistical differences between the two groups are noted with a * (p = 0.05), while comparisons between groups containing <30 samples are shaded in gray. In each box, the central line represents the median, and the lower and upper edges of the box are the 25th and 75th percentiles. Whiskers extend from the most extreme values (continuous line) to the outliers (dashed line).

Glacier length and slope appear as the two next most important variables in differentiating surge-type from normal glaciers across the main surge clusters. Since glacier length and glacier area are not independent, it is unsurprising that length follows a similar pattern. Surge-type glaciers are significantly longer than normal glaciers, with the largest difference being in Arctic Canada. Slope also significantly differs between the two populations, but this time with an inverse relationship where surge-type glaciers have shallower slopes than normal glaciers, as already observed in Reference Jiskoot, Murray and BoyleJiskoot and others (2000). The largest differences occur in Greenland and Iceland. Glacier elevation range shows some difference between the two populations, although this is likely to be the result of a correlation between elevation range and glacier length. Arctic Canada and Alaska display the largest differences between the two populations. On the other hand, aspect does not appear to be significantly different between surge-type and normal glaciers across our studied clusters. If anything, surge-type glaciers cover a slightly narrower span of orientations.
Differences in geometry between surge-type and normal glaciers exhibit a clear climatic bias, as shown in Figure 7. Whereas normal glaciers display little systematic variation in area on the MAT–MAP plot, surge-type glaciers show much greater variation in area with climate. In the optimal climatic envelope for surge-type glaciers (where there are high numbers of surge-type glaciers per ERA-I cell; Fig. 4a(ii)), surge-type and normal glaciers are relatively similar in area. In contrast, at the ‘cold-dry’ extreme of the distribution (Arctic Canada and Tibetan Plateau) surge-type glaciers have much larger areas and greater lengths than normal glaciers in the majority of cells. At the ‘warm-humid’ end of the distribution, surge-type and normal glaciers tend to be similar in area and length, except for a few cells where the former are much larger. These anomalies appear to reflect random effects of glacier sampling in ERA-I cells, rather than a systematic size distribution. Both slope and range vary greatly across the whole climatic spectrum without following a distinctive pattern. At most, a narrow core of smaller elevation ranges can be seen for the population of surge-type glaciers in a small part of the optimal surge zone.
‘Normal glaciers’ column: climatic distribution of normal glaciers plotted in mean annual temperature against mean annual precipitation. The size of the ellipses represents the average geometry of all glaciers present in every cell. ‘Surge-type glaciers’ column: climatic distribution of surge-type glaciers plotted in mean annual temperature against mean annual precipitation. The size of the ellipses represents the average geometry of all glaciers present in every cell. ‘Difference’ column: absolute difference in geometry between surgetype and normal glaciers, averaged per gridcell, across the climatic spectrum. The size and color of the ellipses represent the average value for surge-type glaciers ‘minus’ the average value for normal glaciers. Please note that only cells containing both surge-type and normal glaciers are represented in the three columns. Horizontal axes are in log scale.

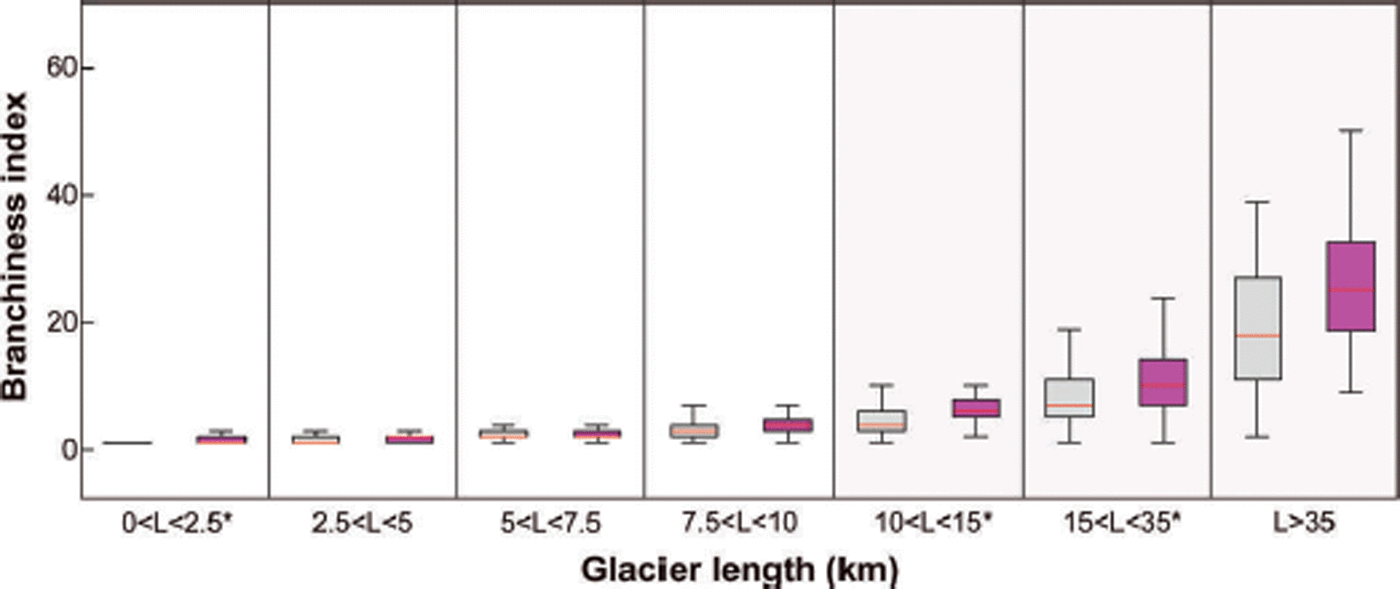
To test whether the complexity of glacier systems shows any correlation with surging behavior (cf. Reference Clarke, Schmok, Ommanney and CollinsClarke and others, 1986; Reference Hamilton and DowdeswellHamilton and Dowdeswell, 1996; Reference Jiskoot, Murray and LuckmanJiskoot and others, 2003; Reference Barrand and MurrayBarrand and Murray, 2006; Reference Grant, Stokes and EvansGrant and others, 2009), we compared the ‘branchiness’ of glaciers in the Alaskan cluster, for which high-quality geometry data are available. The branchiness index is defined as the number of branches required to reach 85% of the total glacier length (Reference Kienholz, Rich, Herreid, Arendt and HockKienholz and others, 2013). It is therefore not the total number of tributaries forming the glacier system, but an index of glacier complexity ignoring tributaries of negligible size (e.g. minor embayments or niches). Surge-type glaciers are, on average, branchier than normal glaciers (on average, five branches against one for normal glaciers across all length classes; Fig. 8).
Comparison of the average number of branches between surge-type glaciers (in pink) and normal glaciers (in gray) across the Alaska Range, over different classes of glacier length. Significant statistical differences between the two groups are noted with a *, while comparisons between groups containing <30 samples are shaded in gray. On each box, the central line represents the median; the lower and upper edges of the box are the 25th and 75th percentiles. Whiskers extend to the most extreme values.
Maxent: results
We ran Maxent with a wide range of climatic and glacier geometry variables, including mean annual temperature, mean summer temperature, mean winter temperature, mean annual precipitation, mean summer precipitation, mean winter precipitation, glacier area, length of the center line, elevation range, slope and aspect. To test for collinearity, we calculated correlation coefficients between variables at the individual glacier level (for geometry variables) and ERA-I cells (for climate variables). The results (Tables 6–8, Appendix B) show that glacier length has a strong positive correlation with area and elevation range. Initial runs demonstrated that glacier aspect made an insignificant contribution to the model. Regarding the climate variables, mean annual precipitation is strongly correlated with mean winter and summer precipitation, while mean annual temperature is strongly correlated with mean winter and summer temperature. Based on these results, we conducted Maxent runs with a limited set of climatic and glacier geometry variables. Mean annual precipitation and mean annual temperature were chosen as the fundamental climatic variables, while length and slope were adopted as the two most significant glacier geometry variables.
When run with all the glaciers of the geodatabase and the limited set of climatic and glacier geometry variables, the output of Maxent reproduces with great accuracy the known distribution of surge-type glaciers across the glacierized regions (Fig. 9). Excellent model performance is indicated by training AUC = 0.919 and testing AUC = 0.902 (Reference Elith and GrahamElith and Graham, 2009). The model converged after 1600 iterations. The results of the cross-correlation replications are perfectly spatially correlated with single run (correlation matrix >0.99). Regions with missing data are excluded from Maxent’s final map output (cf. Fig. 3).
Maxent’s final logistic output, displaying the probabilities of presence of the population of surge-type glaciers across all glaciated regions. The model was trained with 75% of the population of surge-type glaciers and tested with the remaining 25%. Four variables were used for this model: MAT, MAP, length and slope.

Major clusters such as Alaska–Yukon, East and West Greenland, Svalbard, Novaya Zemlya and High Mountain Asia clearly stand out as highly suitable areas for surge-type glaciers. The northern, western and eastern boundaries of the Alaskan–Yukon cluster are accurately depicted by the model, which shows low probabilities for the Brooks Range (short glaciers, low MAT and limited MAP) and the Coast Mountains (short glaciers, high MAT). In Iceland, only the interior of the island shows high probabilities of presence due to climatic factors and long glaciers. In contrast, cells in the north and west of the island, where glaciers are smaller, display lower probabilities. The model represents Svalbard as one of the strongest potential clusters, and Novaya Zemlya is equally accurately depicted as a highly suitable region, with lower probabilities towards the north and east of the island, where glaciers are shorter, and MAT and MAP are lower.
Maxent accurately predicts high probabilities of occurrence of surge-type glaciers in the Pamirs, the Karakoram and the central Tien Shan. Outside these optimal regions, probabilities decline sharply in all directions, largely for climatic reasons (e.g. rising temperature or decreasing precipitation). The Tibetan Plateau, mostly characterized by short glaciers and low MAP, is clearly represented with low probabilities of surge-type glacier presence. In the eastern Himalaya, where precipitation is higher, the model again accurately predicts higher probabilities of presence. However, Maxent apparently over-predicts the occurrence of surging glaciers in Nepal, Bhutan and neighboring areas of China. Both main surge clusters of Greenland stand out with low probabilities of presence north of these regions. Relatively high probabilities are also predicted for southern Baffin Island, where no surges have been reported. Elsewhere in Arctic Canada, however, the model under-predicts the occurrence of surge-type glaciers.
Low probabilities of occurrence are accurately predicted in many regions with high mean annual temperature, including mainland Scandinavia, the European Alps, Pyrenees and New Zealand. Low probabilities are also predicted for areas of low mean annual precipitation and very low mean annual temperature, such as the New Siberian Islands. The model seems to under-predict the small clusters of the Andes, but further analysis shows that the number of small cells (0.05° × 0.05°) with high probability of presence was too small compared to the number of small cells with low probability of presence. Averaging the results over the larger ERA-I cells (0.75° × 0.75°) generated large cells with low probabilities of presence. The same bias also occurs with the Antarctic Peninsula and in the Caucasus.
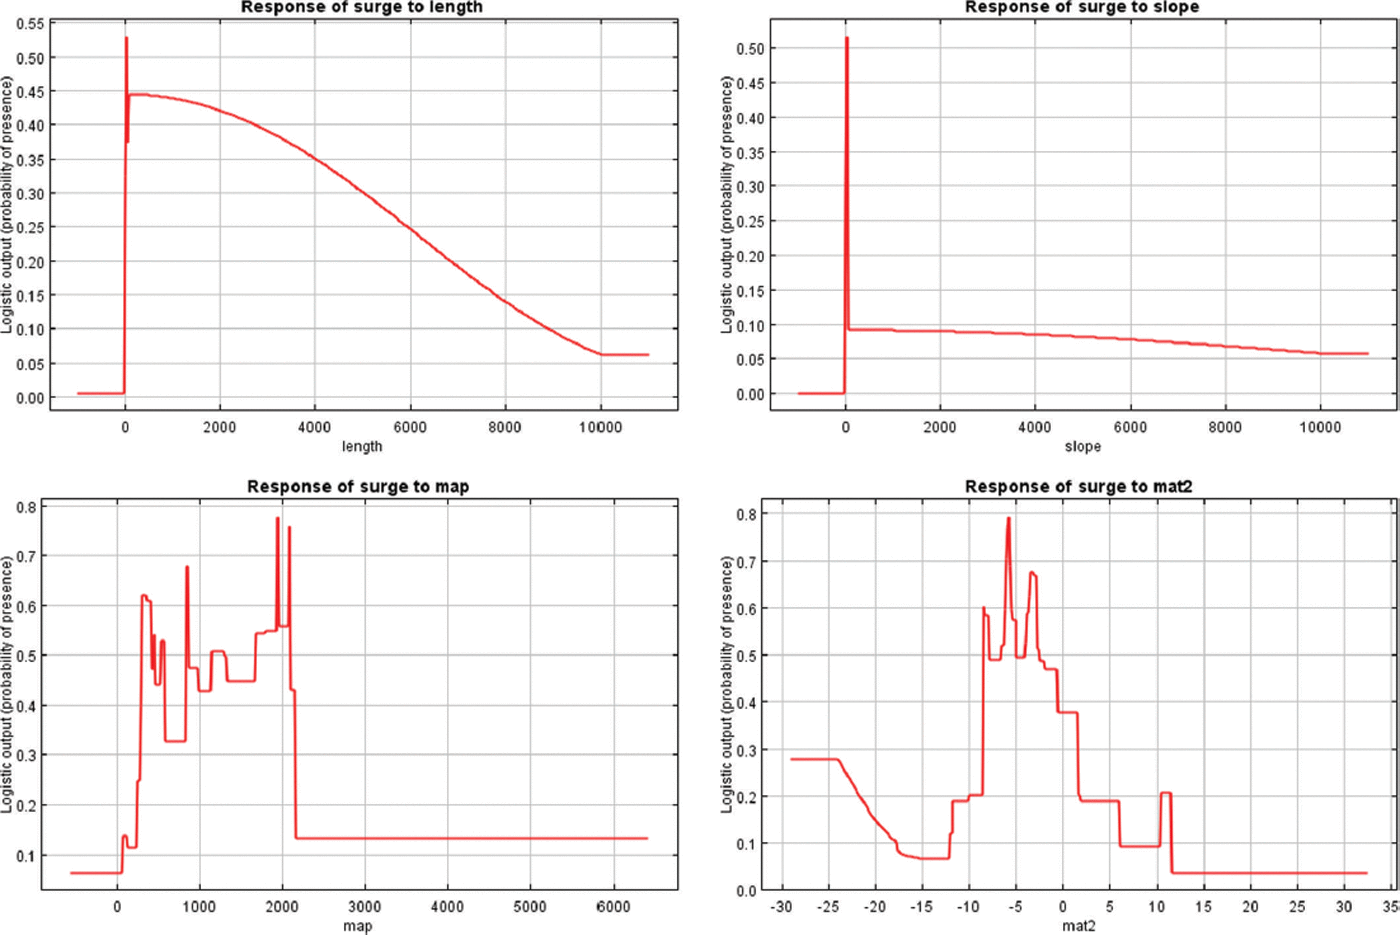
Maxent’s outputs also include detailed response curves, which show how each climate and glacier geometry variable influences the predictions (see Fig. 11, Appendix B). Predicted suitability is positively correlated with glacier length and slope, but the response for the climatic variables is more complex, reflecting the upper and lower thresholds in precipitation and temperature that bound the optimal surge zone.
Mean annual precipitation generates the highest probabilities of presence between 340 and 2140 mm a−1, and rapidly decreases above this threshold. Mean annual temperature generates high probabilities of presence between −8°C and −0.5°C.
A jackknife test allows us to rank the variables by importance. The permutation importance is determined by randomly permutating the values of a variable among the training locations, and measuring the decrease in training AUC. Mean annual precipitation is the most important variable in building the model (by 30.9%), followed by slope (24.6%), which is almost as important as length (23.2%). Finally, mean annual temperature contributes 21.3% to the model. In total, the cumulative permutation importance of the climatic layers is higher than that of the glacier geometry variables (respectively 52.2% and 47.8%). Based on these results, we hypothesize that climatic variables exert the primary control on the location of the main surge clusters, while glacier geometry variables influence which glaciers within clusters are prone to surging.
To test this idea we performed additional runs using different sets of variables, and different surge categories. On the one hand these analyses would allow us to investigate the importance of the variables in contributing to Maxent’s predictions, and on the other hand we could assess the representativeness of the three categories of the surge index. We focus our results on the North Atlantic region (Fig. 10). The figure is divided into rows (for the different sets of variables), while columns indicate the different surge index categories. The runs including ‘all variables’ (MAT, MAP, length and slope) show that the model performs increasingly well as we move from category 1 to category 3. When trained with glaciers from category 3 only, the large surge clusters such as Alaska–Yukon, East and West Greenland, Iceland and Svalbard are well delineated. Under-predictions are noticeable in Arctic Canada. The middle row displays the results of runs performed with climatic layers only (MAT and MAP). Interestingly, results are very similar (or improved in the case of category 1). Contrasts between surge cluster and non-surge cluster regions are clear, and their distribution mirrors the results from the top row. Finally, predictions made using glacier geometry variables only are presented in the bottom row. Evidently, the model picks out all cells where the average glacier length or slope is important: most of Alaska, the majority of Arctic Canada, the periphery of Greenland and cells in Svalbard and mainland Norway. To assess the performance of the three surge categories, we evaluate the results by averaging the probabilities of presence using the results from the top row (all variables) over the entire population of cells with surge-type glaciers. Category 3 (‘confirmed surge-type’) yields the highest average probability of presence for all surge-type glaciers, 0.54, followed by category 2 with 0.51, and category 1 with 0.46.
Maxent’s predictions based on different sets of training points (columns) represented by glaciers from the three surge index categories, and on different sets of variables (rows). Models from top row, ‘All variables’, are based on MAT, MAP, length and slope. Models from middle row, ‘Climate’, are based on MAT and MAP only. Models from bottom row, ‘Geometry’, are based on glacier length and slope only.

These results allow three important conclusions to be made. First, data on mean annual precipitation and mean annual temperature are enough to delineate the main surge clusters, confirming that climate is the primary control on the distribution of surge-type glaciers on a global scale. Second, although glacier length clearly influences the tendency of glaciers to surge, geometry variables alone cannot predict the location of clusters. Finally, glaciers from category 3 are the most representative for the whole population of surge-type glaciers.
Discussion
Our results show that the global distribution of surge-type glaciers can be predicted with a high degree of confidence from a limited set of climatic and glacier geometry variables. This fact strongly suggests that some hitherto unrecognized principle may underlie all surging behavior, irrespective of thermal regime or other local factors. So why should certain climatic and geometric conditions encourage surging? To address this issue, we begin by inverting the question and ask, ‘why are some conditions not conducive to surging?’ Expressed more fully, we ask: what conditions must be satisfied for a glacier to maintain a dynamic equilibrium or steady state, and flow at speeds closely matching its balance velocity? It is then meaningful to ask, in which circumstances do these conditions break down, producing unsteady or oscillatory behavior? Therefore, we bypass the particular details and quirks of individual surges, and seek explanations for the patterns emerging from our analysis in the general principles of glacier dynamics.
To maintain a steady state (i.e. to have constant geometry, and velocity and temperature distributions in equilibrium with a hypothetical static climate), a glacier must simultaneously meet two conditions. First, mass flux through the system must be in equilibrium with surface mass balance. That is, on annual and longer timescales, ice discharge through any cross section must evacuate exactly the net mass gains up-glacier (this steady-state discharge divided by cross-sectional area is the balance velocity (Reference ClarkeClarke, 1987). Second, energy fluxes into and out of the system must balance to maintain constant enthalpy. In a glaciological context, enthalpy is defined as the internal energy of the glacier system, a function of ice temperature and water content (Reference Aschwanden, Bueler, Khroulev and BlatterAschwanden and others, 2012). Changes in enthalpy result from (1) energy exchanges at the glacier surface (radiative and turbulent fluxes, runoff) and the bed (geothermal heat flux, runoff); and (2) frictional heating associated with ice flow. As the glacier flows downslope, gravitational potential energy is converted into sensible or latent heat, warming and melting ice, respectively. If equilibrium is to be maintained, these enthalpy gains must be dissipated from the glacier by heat conduction through the ice to the surface, heat advection with flowing ice, and/or runoff of meltwater. At the bed of a temperate glacier, the heat conduction and advection terms are zero, and enthalpy dissipation from the bed can only occur by the evacuation of basal meltwater.
The mass- and enthalpy-balance problems are tightly coupled, because flow speeds are dependent on both ice temperature and water storage, and vice versa. If the glacier is to remain close to steady state, there must be a broad equality between rates of build-up of gravitational potential energy (snow accumulation), conversion of potential energy into enthalpy by ice flow, and loss of enthalpy by the dissipation of heat and meltwater. If strain heating near the bed increases ice temperature and/or creates basal meltwater faster than enthalpy can be dissipated from the glacier, positive feedbacks between ice flow processes (creep and sliding) and warming/melting will cause the glacier to accelerate above the balance velocity, evacuating mass faster than it can be replaced. Conversely, if heat is lost more rapidly than generated by ice flow and geothermal heating, the glacier will decelerate and ice will accumulate within the system. Thus, if simultaneous solutions to the mass- and enthalpy-balance problems cannot be found, the glacier will deviate from steady state, introducing the possibility of oscillatory or other unstable behavior. These concepts echo and build upon ideas proposed by Reference PostPost (1969), Reference BuddBudd (1975), Reference Dolgoushin and OsipovaDolgoushin and Osipova (1975) and Reference Van Pelt and OerlemansVan Pelt and Oerlemans (2012). We now apply these concepts to the interpretation of our results, and outline the implications for a general, unified theory of glacier surging.
The scarcity of surge-type glaciers at the cold, dry end of the climatic spectrum (Fig. 4) can be explained by low basal enthalpy production and efficient heat losses by conduction. For small glaciers in cold, arid environments, balance fluxes and frictional heating are low, increasing the likelihood that enthalpy production can be balanced by conductive losses. In contrast, longer and larger glaciers, especially those where flow is focused from multiple tributaries into narrow outlets, will have higher balance velocities and therefore higher steady-state basal enthalpy production. Larger glaciers will also tend to be thicker, reducing conductive heat losses to the atmosphere. Therefore, in cold, dry environments larger glaciers (e.g. the surge-type glaciers of Arctic Canada) are less likely to find a balance between enthalpy production and dissipation than small glaciers.
Surge-type glaciers are also essentially absent at the warm end of the climatic spectrum (Fig. 4). In this zone, glaciers are likely entirely temperate due to high summer air temperatures, warming of the snowpack by melting and refreezing, and high mass turnover. Conductive losses are zero in the temperate case, so enthalpy dissipation can only occur via runoff of meltwater. We hypothesize that high runoff will be encouraged by (1) high basal melt rates maintaining efficient drainage systems and (2) seasonal development of efficient basal drainage systems in response to high surface melt and rainfall, and surface-to-bed drainage via crevasses and moulins. Therefore, although enthalpy production is high in high-turnover glaciers, it may be easy for glaciers within the warm–temperate zone to evacuate excess energy by high water discharge.
Most surge-type glaciers occupy a climatic envelope between the cold-dry and warm–temperate extremes, the highest densities occurring in the ‘optimal surge zone’ (Fig. 4). We suggest that glaciers in this climatic environment are prone to surging because neither heat conduction nor subglacial drainage systems are efficient enough to evacuate the enthalpy gains associated with their balance velocities, creating the possibility of heating–velocity feedbacks at the bed. In temperate glaciers, this may manifest as increasing storage of basally produced water in inefficient, distributed drainage systems, and in polythermal glaciers as warming of cold basal ice to the pressure-melting point, followed by increasing water storage. Failing to find an equilibrium solution to the enthalpy budget, the system is forced to oscillate between fast and slow states to evacuate excess energy.
Glacier geometry variables exert a second-order control on glacier enthalpy balance. First, glaciers that are long, branchy and with high areas (i.e. probably both long and branchy) will have higher balance velocities than small, simple glaciers, and therefore will have greater enthalpy production at the bed. Second, glacier length and branchiness will influence subglacial water balance. Where rates of basal meltwater production are low, it may be possible to evacuate all meltwater from small glaciers via inefficient, distributed drainage systems (e.g. pore-water flow in till, water films or linked cavities). On larger glaciers, however, such systems may be unable to evacuate the cumulative discharge, leading to increased water storage and velocity–strain heating feedbacks. Thus, at the cold-dry end of the climatic spectrum, long, branchy glaciers may be more susceptible to dynamic instabilities as a result of inefficient basal drainage. Third, large glaciers will also tend to be thick, leading to inefficient heat conduction from the bed to the surface. Geological factors (not examined in this study) could also affect basal water balance, and tendency to surging in some regions (e.g. Reference Hamilton and DowdeswellHamilton and Dowdeswell, 1996; Reference Jiskoot, Murray and BoyleJiskoot and others, 2000, Reference Jiskoot, Murray and Luckman2003).
Maxent’s results further highlight the importance of climatic and glacier geometry attributes in modelling the global distribution of surge-type glaciers, although the model might suffer from collinearity between variables. When run with climatic layers only, the model accurately delineates the main surge clusters, which is not the case when run with glacier geometry variables only. We conclude that, of our two categories of potential controls, climate is the first-order global control on the distribution of the surge clusters, while glacier geometry is a second-order regional control.
The great diversity of surging glaciers suggests that many processes are involved, which may differ substantially from glacier to glacier depending on thermal regime, bed materials, drainage system type and other factors. However, we believe that the enthalpy cycle model provides a powerful new unifying concept, with which all surging behaviors (and ‘normal’ glaciers) can be understood within a single framework. In this study, we have taken a very ‘broad brush’ approach to analyzing the relationship between glaciers and their environments. Now that the global patterns have been established, more detailed regional studies are needed to further explore and refine our conclusions. The enthalpy cycle concept can generate testable hypotheses, and inspire future field and remote-sensing observation programs. Experiments with energy-conserving enthalpy models (Reference Aschwanden, Bueler, Khroulev and BlatterAschwanden and others, 2012) could potentially identify the precise combinations of balance velocity, surface climatology and basal boundary conditions that give rise to oscillatory behavior. To date, most model studies of oscillatory behavior have focused on basal conditions (e.g. Reference Van Pelt and OerlemansVan Pelt and Oerlemans, 2012). Interestingly, however, Reference CalovCalov and others (2010), using a range of thermomechanically coupled models of the Laurentide ice sheet, found that oscillations were encouraged by low surface temperatures and low snowfall, and did not occur for high surface temperatures and accumulation rates. It might be expected that the influence of climate is much stronger in simulations of thinner, smaller ice masses, representative of the valley glaciers and ice-cap outlets making up our geodatabase.
It is also interesting to speculate on the effect that climate change may have on the distribution of surge-type glaciers. The existence of climatic envelopes conducive to surging implies that glaciers may change from ‘normal’ to surge-type and vice versa under cooling or warming climates. Indeed, there are some indications that this has occurred over the Little Ice Age climatic cycle of the last millennium (e.g. Reference HoinkesHoinkes, 1969; Reference Benn and EvansBenn and Evans, 2010; Reference StribergerStriberger and others, 2011). Identification of palaeosurges in the geomorphological record will allow further testing of this intriguing possibility.
Summary and Conclusions
A geodatabase of surge-type glaciers compiled from 305 publications and combined with the RGI has enabled investigation of the spatial distribution of surge-type glaciers at a global, regional and individual glacier level.
Analysis of ERA-I data indicates that surge-type glaciers occur within a well-defined climatic envelope, which can be divided into two subzones. The highest densities of surge-type glaciers occur within an optimal climatic envelope bounded both by temperature and precipitation. Surge-type glaciers are absent above a threshold MST = 0.001MWP + 8.4 (MST: mean summer temperature in °C; MWP: mean winter precipitation in mm a−1), and below MST = 0.0014MWP − 0.97. A clear threshold in precipitation provides the lower boundary for the optimal surge envelope with MST = 0.015MWP − 28.4. Surge-type glaciers in this zone belong to two superclusters: (1) the Arctic Ring, extending from Alaska–Yukon to Novaya Zemlya (but excluding Arctic Canada) and (2) High Mountain Asia, particularly the Pamirs, Karakoram and Tien Shan. Much lower densities of surge-type glaciers are found in the colder, drier climates of Arctic Canada.
In all clusters, surge-type glaciers have larger areas and are longer than normal glaciers, and a more detailed study of the Alaska–Yukon cluster shows that surge-type glaciers are more complex (more branches) over all size classes. These results agree with the findings of Reference Clarke, Schmok, Ommanney and CollinsClarke and others (1986), Reference Hamilton and DowdeswellHamilton and Dowdeswell (1996), Reference Jiskoot, Murray and BoyleJiskoot and others (2000) and Reference Barrand and MurrayBarrand and Murray (2006). The size and length differential is greatest at the cold and dry end of the climatic spectrum, while less pronounced but still significant throughout the optimal surge zone. A tendency for surge-type glaciers to have lower slopes appears to be a by-product of the inverse relationship between slope and glacier length, as argued by Reference ClarkeClarke (1991). The same applies to glacier elevation range: the longer the glacier, the larger the range. Multivariate tools are more performant when it comes to disentangling correlations between variables (see Reference Atkinson, Jiskoot, Massari and MurrayAtkinson and others, 1998; Reference Jiskoot, Murray and BoyleJiskoot and others, 2000, Reference Jiskoot, Murray and Luckman2003). Glacier aspect did not contribute in distinguishing normal from surge-type glaciers.
The species distribution model Maxent was used to model the distribution of surge-type glaciers based on geometry (length and slope) and climatic variables (mean annual temperature and mean annual precipitation). The model was able to accurately reproduce the distribution of surge-type glaciers in many regions. It performed best for the major clusters (e.g. Alaska–Yukon, Iceland and Svalbard), but performed less well in marginal regions (e.g. Arctic Canada, the Andes and the Caucasus).
Our analysis highlighted a number of regions where surge-type glaciers have not been reported, but are predicted by the Maxent model, including parts of the Antarctic Peninsula, the Russian Arctic and parts of Siberia. These are all regions where observations of glacier dynamics are sparse, and focused studies of these regions may expand the known population of surge-type glaciers.
We interpret our results in terms of a new conceptual framework, the enthalpy cycle model. According to this model, steady-state conditions can only occur if the enthalpy gains (sensible and latent heating) generated by the glacier flux can be dissipated by heat conduction and meltwater discharge. This condition can be most easily satisfied in cold, dry environments (thin, low-flux glaciers, efficient conductive heat losses) and warm, humid environments (high mass flux and meltwater discharges). Intermediate conditions correspond to the optimal surge zone, where neither heat conduction nor runoff can effectively discharge heat gains for many glaciers. Glacier size and branchiness affect susceptibility to surging through their influence on balance velocity, thermal insulation of the bed, and subglacial water balance.
In summary, the climatic and topographic environment of a glacier imposes constraints on its dynamic behavior. Surges are not anomalous phenomena requiring special explanation, but arise naturally as a consequence of the ways in which all glaciers interact with their environments.
Acknowledgements
We gratefully acknowledge Horst Machguth and Matthias Huss for providing the global dataset of glacier center lines, and Christian Kienholz for the center lines of the Alaskan glaciers. We thank Hester Jiskoot and Nick Hulton for valuable discussions throughout this research. A special thank you is extended to the contributors to the geodatabase for their valuable observations and time: Shad O’Neel, William D. Harrison, Sam Herreid, Garry Clarke, Jacob C. Yde, Gordon Hamilton, Luke Copland, Sveinn Brynjólfsson, Skafti Brynjólfsson, Twila Moon, Wanqin Guo, Gabriel Alberto Cabrera, Kay Helfricht, Michael Kuhn, Torborg Heid, Nicolai Osokin, Takatoshi Yasuda, Evan Burgess, Ólafur Ingólfsson, Andrey Glazovsky, Wesley van Wychen, Robert McNabb, Melanie Rankl. We also thank Ruth Mottram and Fredrik Boberg from the Danish Meteorological Institute for patiently answering questions regarding climatic data processing. Finally we thank Luke Copland and Hester Jiskoot for constructive comments and the scientific editor, Ralf Greve, for handling the paper. Financial support was provided by the ConocoPhillips Lundin Northern Area Program project CRIOS.
Appendix A
Harmonized surge index used in the geodatabase

Equivalence to other surge indices

(Continued)

Appendix B
Maxent’s logistic response curves corresponding to the run displayed in Figure 9.
Correlation matrix among the glacier geometry variables for three glacier populations: ‘all glaciers’ for all the glaciers in the world, ‘normal glaciers’ for non-surge-type and surge-type glaciers

Correlation matrix among the climatic variables

Correlations between glacier geometry and climatic variables



