


Introduction
Gram-negative pathogens such as Acinetobacter baumannii (A. baumannii) are often associated with nosocomial outbreaks. Reference Choi, Kim and Jeon1–Reference Koeleman3 The ability of Acinetobacter to survive on healthcare surfaces for a prolonged period Reference Chapartegui-González, Lázaro-Díez, Bravo, Navas, Icardo and Ramos-Vivas4 provides an opportunity for these pathogens to be transmitted to another patient if proper infection prevention and control measures are not followed. Moreover, Acinetobacter can quickly acquire resistance genes to multiple antibiotics thereby making it increasingly difficult to treat infections with currently available antibiotics. Reference Scoffone, Trespidi, Barbieri, Arshad, Israyilova and Buroni5 With the advent of microbial whole genome sequencing (WGS) with high discriminatory power, decreasing cost, and shorter turnaround time, real-time surveillance with the potential for early identification and curtailing larger outbreaks are possible. Reference Quainoo, Coolen and Van Hijum6–Reference Bogaerts, Winand and Van Braekel9
Healthcare-associated infections (HAIs) due to Acinetobacter are known to cause significant morbidity and mortality in patients and poses a major public health threat. Reference Koeleman3 According to the Centers for Disease Control and Prevention, 1 in 31 hospitalized patients and 1 in 43 nursing home residents acquire HAIs. The Centers for Disease Control and Prevention also reported that progress had been achieved in reducing device-related HAI until 2019; however, challenges associated with the COVID-19 pandemic reversed these advancements resulting in an increase in the incidence of several HAI-associated antimicrobial resistant pathogens. Several outbreaks involving Acinetobacter have been previously reported. Reference Osman, Halimeh and Rafei10–Reference Young-Sharma, Lane and James12 WGS has previously facilitated accurate bacterial identification, Reference Meehan, Goig and Kohl13 mapped genetic relatedness of bacterial isolates, Reference Joensen, Scheutz and Lund14 enabled intrahospital outbreak studies, Reference Choi, Kim and Jeon1 and established possible transmission routes. Reference Ong, Rao and Khong15 However, routine surveillance using WGS has not been widely implemented in healthcare facilities. Genomic sequencing has been used successfully for strain/lineage characterization of SARS-CoV-2 to provide information relevant to an immediate public health threat including severity of disease or transmission events. Reference Jinadatha, Jones and Hailes16,Reference Esser, Schulte and Graf17 Likewise, epidemiological changes in HAI-causing bacteria captured by WGS surveillance and related monitoring programs can provide clues not only for any gaps in prevention and control strategies but also to aid in shaping antibiotic stewardship programs, even spurring development of new antibiotics.
In this study, we attempt to address several unanswered questions: (1) What type of Acinetobacter strain sequence types (STs) are prevalent in the southeast Michigan area and is there genomic diversity among circulating strains in two separate hospitals in the same region? (2) Can we identify any intrahospital transmission clusters within units? To determine molecular epidemiology of circulating hospital Acinetobacter strains in southeast Michigan, we performed WGS and whole genome multilocus sequence typing (wgMLST) analysis to characterize genomic diversity and transmission patterns.
Methods
Study setting and approval
All patients who are admitted to two separate, geographically distinct tertiary care hospitals in southeast Michigan between 2017 and 2021 were included in this study. Hospital 1 (H1) is a 383-bed hospital, and hospital 2 (H2) is a 248-bed hospital. The isolates were derived from unique patients and collected from fifteen inpatient units comprising of two medical intensive care units (ICUs), two surgical ICUs, one trauma unit, and remaining from non-ICU medical-surgical units. All patients admitted only to these fifteen study units during the study period were included. Reference Dhar, Jinadatha and Kilgore18 Infections were categorized as HAIs according to Dhar et al. Reference Dhar, Jinadatha and Kilgore18 This study was approved by the IRB Committees at the Central Texas Veterans Health Care System and Wayne State University.
Strain typing
A total of 162 A. baumannii isolates that were collected as part of routine clinical care were shipped to the Central Texas Veterans Health Care System from the hospital microbiology laboratories for further analysis. For this study, five isolates were excluded due to lack of available hospital or unit information. No environmental isolates were part of this study. The clinical isolates were first confirmed with Matrix-Assisted Laser Desorption Ionization Time of Flight Mass Spectrometry (BioMérieux, Marcy-l’Étoile, France) prior to sequencing. Any clinical isolates belonging to other members of the Acinetobacter calcoaceticus–baumannii complex (twenty-three), including Acinetobacter pittii, Acinetobacter nosocomialis, and Acinetobacter calcoaceticus were excluded from the study.
Whole genome sequencing
The clinical isolates were obtained and subjected to DNA extraction using the QIAamp DNA Micro Kit (Qiagen, Hilden, Germany). The quality of DNA was measured by Nanodrop (ThermoFisher, Waltham, MA, USA) and Qubit (Life Technologies, Carlsbad, CA, USA). DNA libraries were prepared using the Nextera DNA Flex Library Prep Kit (Illumina, San Diego, CA, USA) according to manufacturer’s protocol. The whole genome libraries were sequenced using the Illumina NextSeq platform (Illumina, San Diego, CA, USA). A minimum Q score of 30 × for assembled genomes, with a coverage depth of greater than 60 × were included.
Bioinformatic analysis
De novo assembly was performed using the SPAdes version 3.7.1 assembler on the BioNumerics platform (Applied Maths NV, Sint-Martens-Latem, Belgium) using the Bowtie2 mapping algorithm. WgMLST (assembly-free and assembly-based calls) was performed using the calculation engine on the BioNumerics version 7.6 platform.
Assembled isolates were assigned to multilocus sequence typing (MLST) Pasteur or Oxford ST schemes. The A. baumannii MLST Pasteur scheme uses seven housekeeping genes: cpn60 (60-KDa chaperonin), fusA (elongation factor EF-G), gltA (citrate synthase), pyrG (CTP synthase), recA (homologous recombination factor), rplB (50S ribosomal protein L2), and rpoB (RNA polymerase subunit B). Reference Diancourt, Passet, Nemec, Dijkshoorn and Brisse19 While the MLST Oxford scheme uses seven housekeeping genes including gltA (citrate synthase), gyrB (DNA gyrase), gdhB (glutamate dehydrogenase), recA (homologous recombination factor), cpn60 (60-KDa chaperonin), gpi (glucose phosphate isomerase), and rpoD (RNA polymerase subunit D). Reference Bartual, Seifert, Hippler, Luzon, Wisplinghoff and Rodríguez-Valera20 A minimum spanning tree (MST) was created with STs to demonstrate the clusters in each hospital (H1, H2), each unit (U1-U15), and each year of infection (2017–2021). The MST Figures were generated using BioNumerics version 8.1 (bioMérieux/Belgium). Whole genome single nucleotide polymorphism (SNP) analysis was also conducted using BioNumerics version 7.6 platform (Applied Maths NV, Sint-Martens-Latem, Belgium).
The most common, genetically related STs in each hospital (H1 or H2) were subsequently compared by location (hospital units U1-U15) and time (2017–2021) to identify potential transmission events (clusters). A dendrogram representing the genetic relatedness of isolates subjected to WGS was created using Unweighted Pair Group Method with Arithmetic Mean (UPGMA) with BioNumerics version 7.6 software platform. Potential clonal transmission was determined to occur where SNP threshold is set at ≤ 10 Reference Mangioni, Fox and Chatenoud21 and isolates were determined to be closely related with SNP cut off at ≤ 2. Reference Coll, Raven and Knight22 A. baumannii strain K09-14 with NCBI Reference Sequence # NZ_CP043953.1 was used as a reference. Putatively related isolates are grouped into clusters based on SNP threshold described above and shown in dotted rectangles in the figures. The number at each branch point indicates the SNP distance between the isolates.
Results
Distribution of ST types across the hospitals (H1 and H2), units (U1-U15), and years (2017–2021)
WgMLST analysis was performed on a total of 134 unique A. baumannii patient isolates, 72 of which were from H1 and 62 were from H2. A total of 13 and 15 different STs from H1 and H2, respectively, were identified with 5 STs being in common between the two hospitals. Other unique STs for H1 and H2 were also observed (Tables 1 and 2). ST2 was the predominant ST for both hospitals (H1:47.2%, 34/72; H2:59.7%, 37/62). Using an Oxford scheme, a substantial genetic heterogeneity within the ST2Pas (ST195Oxf, ST208Oxf, ST281Oxf, ST1701Oxf, ST2420Oxf, ST1599Oxf) was observed. In addition to ST2, ST406 (11.1%, 8/72) and ST15 (9.7%, 7/72) were more prevalent in H1 while ST406 (8%, 5/62) and ST427 (4.8%, 3/62) were prevalent in H2. ST406Pas heterogeneity (ST2768Oxf and ST310Oxf) was also observed. Of the total 134 isolates, several isolates (Tables 1 and 2) were not assigned a ST type by either one or both MLST schemes.
Hospital 1


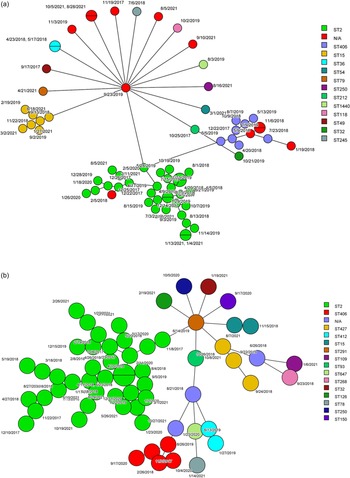
Three units in H1 (H1U1, H1U2, and H1U3) had the highest number and most diverse STs. H1U2 had ten different STs, followed by H1U1 with six STs. Similarly, for H2 two units, H2U4 (43.5%, 27/62) and H2U5 (30.6%,19/62), had the highest number and diverse STs. H2U5 with seven different STs was the most diverse unit. Other units in H2 (H2U6, and H2U8) had four different ST types (Figure 1a,b). A common theme emerged from both hospitals where most of the isolates were found to be in a few units. For H1 and H2, most isolates were predominantly clustered in the ICU setting, while non-ICU units had both fewer number and less diversity of STs. The highest number of isolates collected for H1 were in the year 2019 at 36% (26/72) followed by 2018 at 25% (18/72) that of H2 were in 2018 at 33.9% (21/62) followed by 2021 at 24.2% (15/62). For the year 2018, both H1 and H2 had high rates of A. baumannii infection (Figure 2a,b).
(a, b) Minimum spanning tree of A. baumannii clinical isolates in hospitals (H1: Figure a and H2: Figure b) and different wards (U1-U15). For identical strains circles are marked with dividing lines. Each ST is marked on the side bar with different colors.

(a, b) Minimum spanning tree of A. baumannii clinical isolates in hospitals (H1: Figure a and H2: Figure b) and different years (2017–2021). For identical strains circles are marked with dividing lines. Each ST is marked on the side bar with different colors.

Transmission clusters in two hospitals, H1 and H2
To determine the sequence relatedness among A. baumannii isolates with the highest possible resolution, SNPs were utilized. Based on SNPs, there were three transmission clusters for ST2Pas in H1. Two small clusters (Cluster 1 and Cluster 3) were comprised of three isolates (separated by 2–6 SNPs). Cluster 2 was the largest cluster with eleven isolates having three identical pairs (zero SNP difference), and mostly separated by one SNP. Patients may have shared the same units (H1U1, H1U2, H1U3) or different units (H1U7) in proximity. While these clusters were mostly reported in 2019, few were observed in 2017 and 2018 (Figure 3a). For H2, two large clusters were noted along with three smaller putative transmission clusters based on SNP cut off (Figure 3b). These were largely in 2017 and 2018 unlike 2019 reported for H1. The units mostly affected include H2U4 and H2U5. However, some patients from other units such as H2U6, H2U8, and H2U10 also acquired these isolates. For H1, sporadic transmission of ST15 Pas occurred between patients in unit H1U3 in 2018 and units H1U2 in 2021 (Figure 4). No isolates were recovered from H2 belonging to ST15 Pas. A small sporadic event involving three isolates (9 and 10 SNPs apart) of ST406 Pas in H1 was noted but none in H2 (Figure 5a,b). The isolates were spread between 2017 and 2018 in three different wards U1, U2, and U12.
(a, b) Dendrogram demonstrating the SNP differences between ST2Pas sequences of A. baumannii clinical isolates in hospitals (H1: Figure a and H2: Figure b) that were related (≤2 SNP differences) or putatively related (≤10 SNP differences) and transmission clusters are marked in dotted rectangles. Each unit is marked on the side bar with different colors.

Dendrogram demonstrating the SNP differences between ST15Pas A. baumannii clinical isolates in hospitals (H1) that were related (≤2 SNP differences) or putatively related (≤10 SNP differences) and transmission clusters are marked in dotted rectangles. Each unit is marked on the side bar with different colors.

(a, b) Dendrogram demonstrating the SNP differences between ST406Pas A. baumannii clinical isolates in hospitals (H1: Figure a and H2: Figure b) that were related (≤2 SNP differences) or putatively related (≤10 SNP differences) and transmission clusters are marked in dotted rectangles. Each unit is marked on the side bar with different colors.

Several identical STs were 0 SNPs apart, belonging to ST2Pas (five pairs identical in H1 and two pairs identical in H2) (Figure 3a,b), and ST36 Pas (two identical in H1) were also observed from different patients in both hospitals (Figure 1a,b).
Discussion
WGS and epidemiological data combined can trace transmission routes and facilitate rapid intervention by infection prevention and control teams. Reference Rader, Srinivasa and Griffith23,Reference Pacchiarini, McKerr, Morgan, Connor and Williams24 In silico MLST analysis efforts from WGS data have provided better resolution of STs and highlight ST variation among isolates. Reference Tomaschek, Higgins, Stefanik, Wisplinghoff and Seifert25 Our data suggests considerable heterogeneity of different STs in the southeast Michigan areas, however, ST2 Pas is the predominant ST circulating in both the hospitals and is mostly endemic to the ICU. We detected ST2Pas/ST195Oxf, which has previously been reported only in Asia Reference Kim, Choi and Kim26,Reference Qu, Du, Yu and Lü27 but recently was reported within the USA. Reference McKay, Vlachos and Daniels28 In the present study, we did not identify any ST2Pas/122Oxf reported earlier from the Midwest but did find ST2Pas/ST208Oxf isolates at the study site. Our data also suggest presence of ST2Pas/281Oxf confirming previous reports from Cleveland and Pittsburgh. ST2Pas/208Oxf may have shifted toward ST2Pas/281Oxf. Reference Iovleva, Mustapha and Griffith29 A PubMLST search (search date until Dec 2024) did find sporadic reports of ST2Pas/ST1701Oxf and ST2Pas/ST2420Oxf but did not retrieve any ST2Pas/ST1599 Oxf within the USA (two isolates were reported earlier from South Korea and Russia). ST2 Pas has been known to be extensively drug resistant and reported to be the cause of several outbreaks. Reference Fonseca, Morgado and Freitas11,Reference Young-Sharma, Lane and James12 ST15 Pas was reported mostly from Brazil and several European countries and a few from the USA. ST406 Pas was reported to be circulating within the USA from 2008.
In H1, while several STs were reported from the USA earlier according to PubMLST, Reference Jolley, Bray and Maiden30 some STs (ST36Pas, ST245Pas, ST212Pas, ST1440Pas, ST49Pas, ST118Pas) were reported to be circulating in other countries such as Czech Republic, China, Japan, Korea, Jordan, and Haiti. In H2, only two STs (ST291Pas, ST268Pas) were not reported earlier from the USA but were from countries like Lebanon, Spain, and China. Continuous nationwide surveillance data were not captured making it difficult to distinguish between the absence versus lack of circulating above-mentioned STs within the USA.
Our data indicates that multiple sporadic unit level intrahospital transmission occurred during the 5-year span of the study in both hospitals. Although episodes of transmission were found mostly in the ICU settings, other units with high-risk patients or non-ICU units were also affected. Interestingly, the cluster and SNP analysis indicated that the A. baumannii isolates may be endemic in such settings leading to acquisition of the infection by a subsequent patient admitted in the same unit and increase the risk of acquisition in other units. Based on our data, infection prevention and control efforts should be mostly geared toward ICUs, but careful consideration should be given to prevent transmission to other high-risk patients such as in neurotrauma unit and non-ICU settings. The in-hospital spread of Acinetobacter STs from one patient to the other, raises concerns about infection control practices, the role of environment, transfer of patient between wards or other human factors in the spread of these infections. The two hospitals are separate with differing patients and different staff with no patient overlap or transfers between them. Therefore, inter-hospital transmission was not considered in our study. Surveillance studies using WGS can detect these endemic strains within the hospital and possible transmission routes. This may be crucial in preventing HAIs in the future.
Current limitations of the study include that due to stringent quality requirements of our clinical isolates with the bioinformatic software used, we may have excluded some putative transmission events. The present study was designed only to collect isolates from patients with HAIs. Whether these patients were colonized prior to admission which may have inaccurately contributed to acquisition of HAIs and followed by transmission is unknown. There are currently no commonly utilized prevention bundles that prescreens patients admitted to the hospitals with A. baumannii colonization or isolation procedures followed prior to detection of infection. The study was not designed for outbreak tracking in real-time using WGS for infection control practices in the facilities. Standard infection control measures were implemented in each hospital including following contact precautions when an Acinetobacter infection is determined.
Our study was not designed to provide a direct comparison between patient-derived isolates with the environmental isolates in and around the patient room simultaneously that may provide clues to the source of transmission leading to infection.
Future studies on identifying the source of these infections are important, including the role of environment (sinks, shared portable equipment, invasive medical devices) or healthcare worker hands. Another interesting area of future study would be to delineate antibiotic resistance patterns of these isolates, if they harbor same types of mutations in the resistance genes and/or carry similar plasmids with new antibiotic resistance genes. In addition, finding factors that allowed these isolates to persist in a hospital setting and promote transmission is crucial. These findings taken together may allow us to develop effective infection control measures to curb and prevent the spread of A. baumannii.
In conclusion, we report several circulating ST types, with ST2Pas as the most predominant strain type within the ICU of both hospitals. Environmental hygiene practices as well as infection prevention and control practices geared toward preventing transmission using WGS is possible.
Financial support
This manuscript is the result of work supported with AHRQ Grant # R03HS027667 to PC, partly supported by AHRQ Grant # R01HS024709 to KK and the Office of Research and Development as part of funding for VASeqCURE (grant number N/A) which in turn received funding from the American Rescue Plan Act funds to CJ. Additional support and resources including use of facilities was provided from the Central Texas Veterans Health Care System, Temple, TX. The study sponsor did not have a role in the study design, data collection, analysis, interpretation, or writing of this manuscript. The opinions expressed here are those of the authors and do not represent the views of the National Institute of Health or the Department of Veterans Affairs or of the Central Texas Veterans Health Care System, Temple, TX.
Competing interests
Dr. Keith S. Kaye serves as consultant for Merck, Abbvie, Shiognogi, Carb-X, GSK, Biomeme and Spero and serve as the data safety monitoring board member of Meijii, all other authors declare no competing interests relevant to this article.




 Open access

