


Introduction
The greatest determinants of grain filling, seed longevity and vigour of germination are considered to be hormone signalling (Zhang et al., Reference Wobus, Sreenivasulu, Borisjuk, Rolletschek, Panitz, Gubatz and Weschke2016) and redistribution of carbon from reserve sinks (Schnyder, Reference Ruban and Murchie1993) accumulated during leaf photosynthesis. We know, however, that functional chloroplasts also develop in seeds from several plant species and perform a form of photosynthesis which seems to be significantly different from that occurring in leaves (Smolikova and Medvedev, Reference Shimakawa and Miyake2016). Since photosynthetic activity is a source of many metabolites involved not only in biomass production but also in redox homeostasis, reactive oxygen species (ROS) signalling and stress responses (Foyer, Reference Foyer2018; Martin et al., Reference Kramer, Rodriguez-Heredia, Saccon, Mosebach, Twachtmann, Krieger-Liszkay, Duffy, RJ, Finazzi and Hanke2022), it is worthwhile to investigate the impact of this on seed development and germination (Frey-Wyssling and Buttrose, Reference Frey-Wyssling and Buttrose1959). Indeed, golden-like 2 mutants of barley, with functional leaf and awn chloroplasts, but no chlorophyll in the developing seed and lemma, produce mature seeds that are significantly smaller (Taketa et al., Reference Sreenivasulu, Usadel, Winter, Radchuk, Scholz, Stein, Weschke, Strickert, Close, Stitt and Graner2021). Despite this important role, seed photosynthesis has been largely ignored and few of the techniques developed to study leaf photosynthesis have been applied. This is partly due to the technical limitations impeding effective measurement of photosynthetic electron transport in non-foliar tissues, such as green developing seeds, that have unconventional shapes and few stomata.
Arguably the most powerful and frequently used tool in the study of leaf photosynthesis is spectroscopic monitoring of fluorescence emitted by excited state chlorophyll during its relaxation to a ground energy state. This technique provides useful information about photosystem II activity and specialist hardware is routinely used to perform this measurement on flat leaves (Maxwell and Johnson, Reference Mathiot and Alric2000).
To gain greater insight into the electron transport reactions occurring during light energy conversion, in equipment designed for foliar tissues, this technology has been paired with absorption measurements of the special chlorophyll pair of photosystem I reaction centre (P700) enabling simultaneous analysis of the activity of both photosystems using a pulse amplitude modulation (PAM) type device. In comparison to leaves, green seeds tend to have lower concentrations of chlorophyll, diverse thicknesses, sizes and shapes, as well as an uneven distribution of photosynthetic cells throughout their tissue. They also often contain components such as the endosperm which severely affect the optical properties of the sample. All these factors decrease the signal quality of chlorophyll spectroscopy measurements, especially P700 absorption determination which requires penetration of measuring light through the sample.
Despite this difficulty, Allorent et al. (Reference Allorent, Osorio, Ly Vu, Falconet, Jouhet, Kuntz, Fernie, Lerbs‐Mache, Macherel, Courtois and Finazzi2015) and Sela et al. (Reference Schreiber and Klughammer2020) have spectroscopically measured PSII and electron transport in embryos of the model plant Arabidopsis thaliana, which contain chlorophyll throughout the seed. Cereal crops seeds are still more challenging: they are much bigger than Arabidopsis seeds and their photosynthetically active tissue is restricted to a three cell thick layer surrounding the endosperm called the chlorenchyma. Alternative, camera-based (fluorescence imaging systems) methods have been applied to developing cereal green seeds (Tschiersch et al., Reference Thiel2011), giving a tantalizing glimpse of seed photosynthesis, but these methods lack the accuracy and resolution of the equipment designed to measure leaves and can only measure PSII activity.
Gas exchange between the environment and the chlorenchyma is prevented by a relatively gas impermeable cuticle (Duffus and Rosie, Reference Duffus and Rosie1973), whereas soluble compound exchange with the endosperm is limited by the aleurone and must take place via phloem transport back to the specific maternal transfer cells at the rachis (Thiel, Reference Taketa, Hattori, Takami, Himi and Sakamoto2014). The current dogma dictates that the primary function of developing cereal chlorenchyma photosynthesis is production of oxygen by the chlorenchyma, which diffuses into the endosperm and feeds respiration to support storage compound synthesis (Rolletschek et al., Reference Rodriguez-Heredia, Saccon, Wilson, Finazzi, Ruban and Hanke2004). In exchange, CO2 released from this respiration can be then re-fixed in the chlorenchyma and transferred to the endosperm via the phloem of maternal tissue. Interestingly, chlorenchyma photosynthesis occurs before and during embryo maturation and seed dormancy induction (Briggs and Briggs, Reference Briggs and Briggs1978) and remains a largely unexplored topic, despite its importance for cereal grain development. We therefore customized tools and techniques to measure not only PSII activity but also PSI and the electrochromic band shift (ECS) in dissected barley chlorenchymas, allowing us to accurately measure the activities of both photosystems in parallel, as well as electron transport.
Materials and methods
Chlorophyll a and P700 spectroscopy
After dark adaptation, the Calvin–Benson–Basham cycle is downregulated, and the only possible means of chlorophyll a de-excitation is fluorescence emission. The application of low intensity measuring light establishes the fluorescence minimum (Fo), and application of a saturating light pulse measures the maximum fluorescence (Fm), yielding maximum PSII activity (YII). As the sample is transferred to light, steady state chlorophyll a fluorescence occurs (Ft) due to the lack of acceptors, as adaptation progresses, and application of further saturating pulses reveal steady state fluorescence maxima (Fm′), giving information on the proportion of PSII engaged in photochemical electron transport, recognized as those with available acceptors (qP). An additional process, non-photochemical quenching (NPQ), competes with fluorescence and photochemistry, preventing excitation reaching the reaction centres to prevent damage in the absence of acceptors, and therefore lowering Fm′ (Ruban and Murchie, Reference Ruban2012), Fo, Fm, F′ and Fm′ are therefore used to follow photochemistry during light as follows.
 \begin{equation*}qP{\text{ }} = {\text{ }}\left( {Fm\prime {\text{ }} - {\text{ }}Ft} \right)\!/\!\left( {Fm\prime {\text{ }} - {\text{ }}Fo\prime} \right)\end{equation*}
Y(II) (also termed ΦPSII) is a useful parameter that measures the efficiency of photosystem II photochemistry (Genty et al., Reference Genty, Briantais and Baker1989). This is calculated as:
 \begin{equation*}Y\left( {II} \right){\text{ }} = {\text{ }}\left( {Fm\prime {\text{ }} - {\text{ }}Ft} \right)/Fm\prime \end{equation*}
Y(II) measures the proportion of light absorbed by PSII that induces charge separation and promotes photosynthetic electron transport.
The NPQ of fluorescence is calculated by measuring the ratio of change in Fm relative to the Fm′ values measured upon illumination (Bilger and Bjorkman, Reference Bilger and Bjorkman1990):
 \begin{equation*}NPQ{\text{ }} = {\text{ }}\left( {Fm{\text{ }} - {\text{ }}Fm\prime} \right)\!/Fm\prime \end{equation*}
Activity of PSI can be accurately and simultaneously measured with chlorophyll fluorescence as the P700 redox state, by deconvoluting the absorption signals of four wavelength pairs of measuring light as described in Schreiber and Klughammer (Reference Schnyder2016). The computer software uses differential model spectra to deconvolute contributions from ferredoxin (Fd), P700 and plastocyanin (PC) redox levels from raw absorption signals. Differential models are obtained using predefined routine scripts of illumination applied to sample material according to Schreiber and Klughammer (Reference Schnyder2016). The value for maximal P700 oxidation (Pm) is obtained following dark adaptation, following the same principle as Fm for fluorescence. Transient P700 oxidation (P), maximal P700 oxidation after light acclimation (Pm′) and baseline P700 oxidation (Po) levels Po are then used to calculate PSI acceptor limitation (Y(NA)), donor side limitation (Y(ND)) and activity (Y(I)) as in Klughammer and Schreiber (Reference Haehnel1994, Reference Klughammer and Schreiber2008).
 \begin{equation*}Y\!\left({NA} \right){\text{ }} = {\text{ }}\left( {Pm{\text{ }} - {\text{ }}Pm\prime } \right)/Pm\end{equation*}
 \begin{equation*}Y\left( {ND} \right){\text{ }} = {\text{ }}\left( {P{\text{ }} - {\text{ }}Po}\!\right)/Pm\end{equation*}
 \begin{equation*}Y\left( I \right){\text{ }} = {\text{ }}1{\text{ }} - {\text{ }}Y\!\left( {NA} \right){\text{ }} - {\text{ }}Y\!\left( {ND} \right)\end{equation*}
Y(NA) is primarily affected by the availability of PSI electron carriers at the end of the photosynthetic electron chain and rate of NADP+ regeneration. Y(ND) reflects the limitation due to the time taken for electrons to arrive at PSI from PC. Finally, Y(I) provides an estimate of the effective quantum yield of PSI.
ECS measurements
Electron transport rates of leaves and chlorenchyma were measured by following the relaxation kinetics of the carotenoid ECS at 520 nm (corrected for the signal at 546 nm) using a Joliot type spectrometer (JTS-10) spectrophotometer (Biologic, France) as in Kramer et al., Reference Klughammer and Schreiber2021 and Rodriguez-Heredia et al., Reference Roberty, Bailleul, Berne, Franck and Cardol2022. Under steady state continuous illumination, the ECS signal stems from transmembrane potential generation by PSII, the cytochrome b6f complex and PSI, and is decreased by transmembrane potential dissipation by the ATP synthase CF0-CF1. When light is switched off, reaction centre activity stops immediately, while ATP synthase and the cytochrome b6f complex activity remains (transiently) unchanged. Therefore, the initial rate of ECS decay is proportional to the rate of PSI and PSII photochemistry. The rate of total electron flow is calculated as the coefficient of the ECS decay rate (expressed as −∆I/I per unit of time) on a 10 s pulse of actinic light (λ = 640 ± 20 nm FWHM) at 700 μmol photons m−2 s−1 and the amplitude of the ECS signal (again expressed as −∆I/I) induced by the transfer of one charge across the membrane (e.g. one PSI turnover) with a saturating single turnover laser beam (5 ns laser pulse).
Plant material and experimental procedures
Fresh barley chlorenchymas (Golden Promise cultivar) were collected 10 days after flowering (DAF). Chlorenchymas from 10 to 25 days also provide optimal chlorophyll signal for spectroscopical measurements, while chlorophyll levels decrease dramatically after 30 DAF due to seed maturation processes. However, the endosperm of seeds of 25–30 DAF is particularly difficult to remove from the chlorenchyma, which make this late developmental stage unsuitable for photosynthesis analysis. Chlorenchyma dissection was performed with a scalpel by separating longitudinally the ventral and dorsal part. Endosperm was carefully detached, and dorsal sections were rinsed with reaction buffer (D-Sorbitol 0.5 M, HEPES 20 mM, MES 20 mM, Na-citrate 20 mM, EDTA 10 mM, NaHCO3 10 mM, MgCl2 15 mM and BSA 0.1%), placed on the glass slide with a drop of reaction buffer and with a cover slip gently placed on top of the sample. Only three dorsal sections are necessary to fully cover the light pathway of the KLAS-NIR-DUAL-PAM (Walz, Effeltrich, Germany) optic poly(methyl methacrylate) guides. The dorsal sections were placed with the pericarp side facing the DUAL-KLAS-NIR detector to improve signal quality (Fig. 1). Pm determinations required pre-illumination with far-red at 54 μmol photons m−2 s−1 and saturating pulses at 7392 μmol photons m−2 s−1 of 300 ms. Experimentally, PSI and PSII were simultaneously measured in dark adapted chlorenchyma sections illuminated over a 6 min period with constant actinic light. Measurements with IMAGING PAM (Walz, Effeltrich, Germany) were performed at the approximate equivalent light intensity of 113 μmol photons m−2 s−1 with saturating pulses of 1280 μmol photons m−2 s−1. Saturating pulses are used to calculate photosynthetic parameters according to the procedure described above.
Diagram of chlorenchyma isolation and spectroscopy set-up. (A) Side view indicating with a dotted line excision of dorsal sections. (B) Bottom view of an isolated dorsal section before endosperm removal. (C) Bottom and (D) top view of dorsal section after endosperm removal. (F) Transversal cross-section of barley seed. (E) Placement of dissected chlorenchymas in-between glass slides and (G) the emitter and detector from the KLAS-NIR spectro-fluorimeter. The top of dorsal sections was placed facing the KLAS-NIR emission module with measuring light (ML) pulses as depicted in the panel (G). Red built-in LEDs in both emission and detection modules are used to apply actinic light to analysed samples.

Results
Spectral signatures from chlorenchyma photosynthesis
Measurements of PSI and PSII in leaves are typically performed with PAM spectrophotometry. To validate our protocol, we compared barley leaf and chlorenchyma samples with a set-up consisting of pulsed non actinic light emission paired with fluorimetry and absorption detectors. Emission/detection electronics in the DUAL-KLAS-NIR-PAM are tuned for measuring at wavelengths that specifically relate to chlorophyll excitation-emission and absorption of electron transport components such as plastocyanin and ferredoxin. Protocols traditionally involve strong intensity pulses that, when applied on dark adapted photosynthetic tissues, induce full oxidation of photosystem reaction centres. In both leaves and chlorenchymas, the transient closure of reaction centres through oxidation ensures maximal emission of fluorescence (Fm, Fig. 2A, B). Although the chlorophyll fluorescence signal in chlorenchymas was always significantly lower than that observed in leaves, the rapid kinetics of saturating pulses for Fm determinations showed a similar fast kinetics in both type of tissues, validating the method. Baseline fluorescence (Fo, fluorescence emitted by open PSII complexes) in chlorenchymas and leaves was determined in dark tissues as observed in first ms of traces from Figure 2A, B. During saturating pulse application, a rapid increase in signal can be recorded which is gradually quenched after saturating light flash.
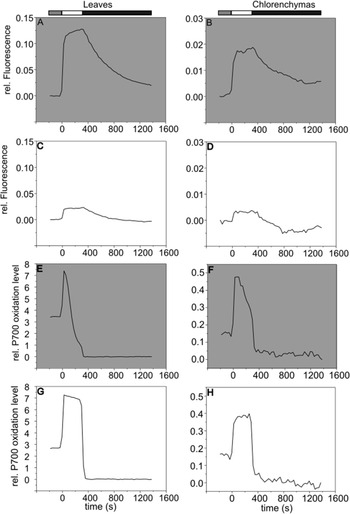
Saturating pulse kinetics of P700 oxidation and chlorophyll a fluorescence in chlorenchyma and leaves of barley. Representative traces of saturating pulses applied to leaves (A, C, E & G) and chlorenchymas (B, D, F & H) of barley. White bar indicates a 300 ms width saturating pulse. Maximum fluorescence (A & B) and maximum P700 oxidation (E & F) were determined in dark adapted samples. Grey bar represents illumination (30 s) with far-red light to ensure maximum P700 oxidation in panels (E) and (F). Measurements were taken after adaptation in total darkness (grey background panels) for 30 min (A, B, E & F) or 5 min of 535 μmol photons m−2 s−1 (C, D, G & H). Traces shown are representative of at least 10 traces.

Pm determination included an initial pre-illumination with far-red light to ensure a maximal P700 oxidation (Pm) which can be observed at the beginning of traces from Figure 2E, F. After a rapid increase upon saturating light application, P700 absorption signals showed the characteristic bi-phasic re-reduction related to a full oxidation of P700 (Haehnel, Reference Haehnel1976) in both tissues (Fig. 2E, F). When pulses were applied over the course of illumination in chlorenchymas and leaves, both chlorophyll fluorescence (Fm′, Fig. 2C, D) and P700 oxidation (Pm′, Fig. 2G, H) traces do not reach maximum levels because photochemistry, dark reactions and photoprotective mechanisms are activated and dissipate energy from both photosystems. The transient levels of fluorescence (Ft) and P700 oxidation level were detected a few ms before saturating light application. Baseline P700 oxidation signal (Po) was detected during the dark break following the saturating pulse enabling full re-reduction of P700 to occur, as observed in both tissues. All the values detected through saturating pulses on dark and light adapted tissues can then be used to calculate several photosynthetic parameters such as Fv/Fm and effective yield of photosystems.
After validating the saturating pulses in chlorenchymas, we proceeded to measure and compare the chlorophyll fluorescence and P700 absorption traces in chlorenchymas relative to leaves. Figure 3A shows the typical emission of fluorescence in leaves which showed a rapid signal increase with the onset of light that was then slowly quenched by photochemistry and NPQ. The same trend was replicated in chlorenchyma fluorescence traces (Fig. 3B). P700 oxidation traces in leaves under illumination (Fig. 3C) gradually increase until reaching a steady state after approximately 300 s. Characteristic P700 traces from chlorenchymas (Fig. 3D) were particularly noisy and the signal baseline tended to drift randomly over time. Traces are interrupted with saturating pulse applications followed by brief dark pauses which allow oxidation followed by full reduction of P700 to ensure accurate Pm′ and Po estimation, despite the drift. Despite the lower quality of the chlorenchyma traces, due to lower quality signal, the pulse kinetic analysis indicated similar responses to those in leaves and allowed the reproducible calculation of all photosynthetic parameters as reported in Figure 4.
Chlorophyll a fluorescence induction in barley chlorenchymas and leaves. Following dark adaptation, the third leaf pair (A & C) of 3 weeks old barley and dorsal sections (B & D) of seeds collected 15 days after flowering were illuminated at 535 μmol photons m−2 s−1 and saturating pulses were applied at 0, 10, 20, 30, 60, 120, 180, 240, 300 and 340 s of illumination time to test the reliability of chlorophyll fluorescence (A & C) and P700 oxidation (B & D) signals. Traces shown are representative. Upward facing and downward facing arrows, respectively, represent the onset and offset of far-red illumination for Pm determination, black bars indicate darkness, white bars indicate actinic light illumination.

Evaluation of PSI and PSII activity in chlorenchymas and leaves from barley upon moderate light intensity (115 μmol photons m−2 s−1). (A) Y(II), (B) qP and (C) NPQ were calculated from chlorophyll a fluorescence measurement. (D) Y(I), (E) Y(NA) and (F) Y(ND) were calculated from P700 absorption measurements. Data shown are means ± S.D. (n = 3–6 individuals per tissue).

PSI and PSII parameters measurement in barley green chlorenchymas
From the beginning of illumination, the yield of both PSII and PSI dropped rapidly and readjusted to values ranging from around 0.4 to 0.6 in the leaves and remained below 0.2 in the case of the chlorenchymas (Fig. 4A, D), consistent with the response expected on moving dark adapted material to a relatively mild light intensity treatment. After the initial drop, leaves were capable of regaining qP values of around 0.9 within the first 50 s of illumination (Fig. 4B). Chlorenchymas showed a more dramatic decrease and were unable to recover to dark values of qP. The leaves presented a gradual increase of NPQ reaching a plateau level at around 0.9 (Fig. 4C), whereas the chlorenchymas barely induced this photoprotective mechanism which never rose above 0.2. The predominant limitation to photochemistry at PSI was availability of electrons at the acceptor side in chlorenchymas as reflected by their higher Y(NA) (Fig. 4E), whereas leaves predominantly showed a higher limitation at the donor side as observed in Figure 4F.
Previous approaches for measuring photosynthesis in cereal seeds utilized chlorophyll a fluorescence as measured with an IMAGING PAM. This technique is well adapted for phenotyping multiple samples on a defined area through a single spectral image. Therefore, we also tested IMAGING PAM of intact developing seeds and leaves of barley, to compare with our NIR-KLAS data on dissected chlorenchymas.
Although the IMAGING PAM enabled measurement of several seeds at the same time and required less sample preparation, it was limited to chlorophyll fluorescence analysis. There was significant variation, both in the steady state values and the kinetics of chlorophyll a fluorescence parameter (Fig. 5), between the NIR-KLAS and imaging PAM. In particular, chlorenchymas values of Fo were significantly overestimated by the imaging PAM compared to the more accurate NIR-KLAS set-up. The Fv/Fm values determined with the IMAGING PAM on chlorenchymas were also on average 17% higher than those measured with the DUAL-KLAS-NIR-PAM (Table 1). The Fv/Fm values detected in the leaves were, in contrast, significantly higher when determined with the DUAL-KLAS-NIR-PAM compared to those obtained through the IMAGING PAM. Differences between tissues could only be distinguished with the DUAL-KLAS-NIR, which showed baseline levels of fluorescence in leaves three times higher than those observed in chlorenchymas.
Evaluation of PSII of chlorenchymas and leaves from barley using the IMAGING PAM. Following dark adaptation, illumination was supplied at moderate light intensity (113 μmol photons m−2 s−1). Y(II), qP and NPQ were measured from chlorophyll a fluorescence measurements. Data shown are means ± S.D. (n = 3–6 individuals per tissue).

Comparison of fundamental chlorophyll fluorescence parameters in seeds and leaves. Made between the IMAGING PAM used in former experiments and the DUAL-KLAS-NIR-PAM, which is combined with dissection in the case of measurements on seeds

Notes: n = 4, S.D. in parentheses.
t-test p-values in superscript are for comparing instrumentation.
t-test p-values in subscript are for tissue type comparisons.
*** p < 0.0001.
Measuring electron transport rate in barley green chlorenchymas through electrochromic shift
An alternative spectroscopic method to chlorophyll a fluorescence and P700 absorption is measurement of the electrochromic shift of thylakoid carotenoids when a proton gradient is generated in the chloroplast lumen. This is usually achieved by using a dual-wavelength measurement system (e.g. measuring at 520 nm for the ECS signal and at an isosbestic point 546 nm as a reference) that isolates the true ECS signal from non-specific background changes, ensuring the measurements accurately reflect the kinetics and magnitude of the transmembrane electric field (Witt, Reference Tschiersch, Borisjuk, Rutten and Rolletschek1979; Mathiot and Alric, Reference Martin, Postiglione and Muday2021). Since the spectroscopic properties of chlorenchyma samples could differ considerably from those of leaves we first verified the absorbance spectrum of dissected chlorenchymas (Supp. Figure 1). Although chlorenchyma and leaf spectra presented minor differences such as a relatively small peak at 750 nm in chlorenchymas, both samples had a similar pattern of the wavelength band associated to the ECS phenomenon. We, therefore, determined that the 520 nm and 546 nm were also a valid wavelength pair for ECS measurements on barley chlorenchymas.
We measured ECS spectra upon a 10 s pulse of light to generate traces whose post-illumination kinetics can be used for electron transport rate calculation (Fig. 6). Although the intensity of leave absorption change signal was higher, the quality of chlorenchyma traces was equivalent to that of the leaves (Fig. 6A, B). This was also the case with the laser pulse induced traces (Fig. 6C, D) whose maximal values are required to normalize the slope of ECS decay at the end of the actinic light pulses. This normalized decay correlates with the electrons per photosystem per second flowing through the photosynthetic electron transport chain (Bailleul et al., Reference Bailleul, Cardol, Breyton and Finazzi2010; Mathiot and Alric, Reference Martin, Postiglione and Muday2021). After calculation, the electron transport rate values from leaves range from 50 to 60 e− PS−1 s−1 whereas chlorenchyma values range from 10 to 20 e− PS−1 s−1.
Electrochromic shift absorption change of leaves and chlorenchyma samples measured at 520 nm and corrected with measurements at 546 nm. Arrows represent onset and offset of pulses of 10 s of actinic light at 700 μmol photons m−2 s−1 (A & B) or application 5 ns single turnover laser pulses (C & D). Traces are average of five repeats.

Discussion
Early characterization of ear photosynthesis in barley consisted of preventing light reactions by shading ear organs and measuring the weight of grains (Frey-Wyssling and Buttrose, Reference Frey-Wyssling and Buttrose1959). Any mobilization of nutrients from leaf blades to compensate the loss of ear photosynthesis contribution to grain filling was prevented by defoliation. Photosynthesis occurring in ear parts was found to contribute to grain filling and presumed to provide grains with a local source of fixed carbon. It has been suggested that carbon assimilate for grain filling is principally supplied by neighbouring awns (Ziegler-Jans, Reference Zhang, Cao, Zhou, Chen, Xu, Gu, Liu, Wang, Yang and Zhang1989; Bort et al., Reference Bort1994). Chlorenchymas from developing seeds in barley have also been reported to contain chloroplasts with the enzymes for carbon fixation (Duffus and Rosie, Reference Duffus and Rosie1973) and it has been suggested that the wheat pericarp can account for up to 34% of carbon fixation of ear photosynthesis (Evans and Rawson, Reference Evans and Rawson1970). Nevertheless, detailed characterization of photosynthesis in cereal pericarps has so far been limited to oxygen concentration analysis and chlorophyll fluorescence measurement techniques at a microscopic level or with IMAGING PAM equipment (Tschiersch et al., Reference Thiel2011). To our knowledge, no equivalent to the optimized methodology we report here has previously been used to reliably measure chlorophyll a fluorescence in barley chlorenchymas alongside P700 oxidation by absorption spectroscopy.
The main limitations for spectroscopy on developing seeds are their limited size and, in the case of cereals, the presence of a dense light-scattering endosperm which particularly affects any absorption measurement. In contrast to the typical model plant Arabidopsis, seeds from barley are easier to manipulate without assistance of an optic microscope/magnifying glass and developmental phases are visually recognizable while seeds grow in the spikes. We bypassed the light scattering effect of the endosperm and cuticle on P700 signal acquisition by dissecting the chlorenchymas longitudinally and utilizing the dorsal side of the grain for measurements. This sample preparation ensures a light pathway through a relatively uniform layer of pericarp.
The developmental stage of green seeds has an impact on chlorenchyma photosynthesis measurements because chlorophyll content gradually increases over development and is abruptly degraded during seed maturation. In our work, we found 10 DAF to be an appropriate time point for assessing chlorenchyma photosynthesis as major photosynthetic genes are rapidly expressed within 8 DAF (Wobus et al., Reference Witt2005). We could not measure accurately at significantly older or younger stages, but the snapshot provided at this time point is likely to reflect the process throughout development because genes for the different photosynthetic complex components show similar induction and repression (Sreenivasulu et al., Reference Smolikova and Medvedev2008), indicating that the relative activity of different pathways stays proportional to total photosynthetic capacity.
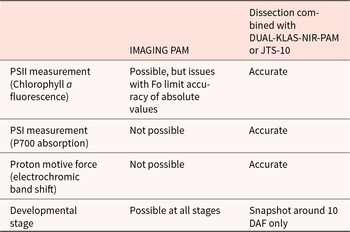
Utilizing typical spectral signatures as a reference for PSI redox level kinetics, we validated our P700 absorption measurements on chlorenchymas by assessing the fast kinetics of maximum signal induction during saturating pulses. This was a critical requirement to ensure reliable measurement of P700 redox changes, as consistent full P700 oxidation in dark adapted tissues is necessary for the calculation of parameters upon illumination. More importantly, the initial pulses for Pm determination in chlorenchymas showed similar kinetics to that in leaves, as did the fast kinetics after light adaptation (Fig. 3). This similarity correlates with typical P700 trace signatures indicating different steps of electron transport through PSI (Shimakawa and Miyake, Reference Sela, Megies, Mène-Saffrané, Finazzi and Lopez-Molina2018). In contrast to the IMAGING PAM, the DUAL-KLAS-NIR-PAM allowed high resolution measurement of absolute fluorescence and P700 absorption traces and pulses from an area of leaf or extended chlorenchyma (Figures 1, 2). Previous analysis with IMAGING PAM on barley developing seeds was performed on transversal cross-sections using fixed regions of interests (ventral invagination) for chlorophyll a fluorescence derived parameters (Tschiersch et al., Reference Thiel2011). Using a dorsal longitudinal cross-section involves not only greater detectable signal but also a representative measurement of the total photosynthesis performed by the chlorenchyma and facilitates infiltration with inhibitors that are typically used for studying specific aspects of photosynthesis such as cyclic electron transport (Bailleul et al., Reference Bailleul, Cardol, Breyton and Finazzi2010; Roberty et al., Reference Maxwell and Johnson2014; Allorent et al., Reference Allorent, Osorio, Ly Vu, Falconet, Jouhet, Kuntz, Fernie, Lerbs‐Mache, Macherel, Courtois and Finazzi2015). The IMAGING PAM methods previously used are compared to those we have developed in Table 2. The IMAGING PAM is a simpler and less destructive technique, capable of measuring seeds at multiple developmental stages. However, our dissection and measurement technique allowed PSI and ECS measurement and was more reliable for PSII analysis. In particular, large differences in chlorophyll a Fo were seen. Discrepancies in Fo are problematic as accurate Fo values are key to correctly calculating photochemical activity and NPQ (Ruban, Reference Rolletschek, Weschke, Weber, Wobus and Borisjuk2016). In general, the IMAGING PAM might be less reliable due to a lower sensitivity of the camera photosensor, less efficient saturation by LED arrangement and calculations typically based on a small sample area.
Summary of methods for use in measuring photosynthetic electron transport in developing seeds. Comparative advantages of IMAGING PAM versus dissection combined with DUAL-KLAS-NIR-PAM or ECS on JTS-10

Lastly but not less important, we have adapted ECS measurements, proving that it is possible to evaluate the photosynthetic electron transport rate of barley chlorenchymas. This is a prerequisite for further studies to analyse transport through different pathways in the electron transport chain, as performed previously in Arabidopsis seeds (Allorent et al., Reference Allorent, Osorio, Ly Vu, Falconet, Jouhet, Kuntz, Fernie, Lerbs‐Mache, Macherel, Courtois and Finazzi2015). Our initial data indicate that these pathways operate in a very different way from those measured in barley leaves. For example, even at moderate light intensity, photosystem II activity in the developing seed is very low (Figure 4A), with limited availability of acceptors (Figure 4C). In a leaf, such a situation would lead to induction of quenching mechanisms, but the chlorenchymas are not capable of this, showing very low NPQ (Figure 4C). Moreover, the kinetics around PSI are also highly divergent from those in leaves, with very high acceptor limitation (Figure 4D) and low donor limitation (Figure 4F). This indicates that further, detailed investigation using the methods here could yield important insight. Given the potential importance of developing seed photosynthesis to seed size (Taketa et al., Reference Sreenivasulu, Usadel, Winter, Radchuk, Scholz, Stein, Weschke, Strickert, Close, Stitt and Graner2021), our work can form a springboard for further studies to understand this important pathway and resolve its connection to seed development.
Supplementary material
The supplementary material for this article can be found at https://doi.org/10.1017/S0960258526100105.
Acknowledgements
We would like to acknowledge the contribution of Giovanni Finnazzi and Dimitri Tolleter to this work.
Funding statement
This work was supported by funding from the BBSRC (BB/R004838/1) to G.T.H. and CONACYT to M.R.H.
Competing interests
The authors have no competing interests to declare that are relevant to the content of this article.


 Open access