

Introduction
Procellariiforme seabirds (albatrosses, petrels and shearwaters) are becoming threatened at a faster rate globally than any other bird order (BirdLife International 2008, Croxall et al. Reference Croxall, Butchart, Lascelles, Stattersfield, Sullivan, Symes and Taylor2012), with 45% of extant taxa currently threatened (IUCN 2010). The primary drivers of this decline are twofold: the impacts of invasive alien species at nesting sites, and the operation of commercial longline fisheries within seabird foraging areas (Butchart et al. Reference Butchart, Stattersfield, Bennun, Shutes, Akcakaya, Baillie, Stuart, Hilton–Taylor and Mace2004). Governments and non-governmental organisations around the globe are attempting to redress this situation. A number of national and international threat abatement plans have been developed and are currently being implemented along with various species recovery plans. Despite these efforts many threatened seabirds continue to decline, with few species having increased in abundance. The Bermuda Petrel (or Cahow) Pterodroma cahow, endemic to the islands of Bermuda (32°20’N, 64°45’W; 53 km2) in the western North Atlantic Ocean, is an ‘Endangered’ species (IUCN 2010) whose population has increased greatly in number in response to recovery actions.
Subfossil evidence suggests that when the Bermuda archipelago was first discovered, early in the 16th century, the Bermuda Petrel was widespread and abundant (Shufeldt Reference Shufeldt1916). Spanish mariners introduced pigs to Bermuda around 1560 (Lefroy Reference Lefroy1877), and by the time the first settlers arrived in 1609, pigs had already decimated seabird populations on the main islands (Strachy Reference Strachy and Purchase1625). Petrel populations that survived on satellite islets where there were no pigs were heavily harvested for food, with adults, nestlings and eggs taken (Butler Reference Butler and Lefroy1619). The colonists also brought with them other exotic species, including rats, cats and dogs (Lefroy Reference Lefroy1877). These new predators, together with extensive burning and deforestation during the first two decades of settlement, further reduced the remnant populations of Bermuda Petrel (Verrill Reference Verrill1902). By 1621 the Bermuda Petrel could no longer be located (Smith Reference Smith1627) and for the next three centuries it was thought to be extinct (Verrill Reference Verrill1902, Murphy and Mowbray Reference Murphy and Mowbray1951).
The first modern record of the species dates from February 1906 when a live specimen was collected on Gurnet Rock, Bermuda (Bradlee Reference Bradlee1906). Initially, this specimen was erroneously identified as a Mottled Petrel Pterodroma inexpectata (Bradlee Reference Bradlee1906). It was not until 1916 that the specimen was compared with subfossil remains and identified correctly (Nichols and Mowbray Reference Nichols and Mowbray1916). Further evidence that the species still existed came from freshly dead individuals found around Castle Harbour in June 1935 (Beebe Reference Beebe1935), June 1941 and March 1945 (Murphy and Mowbray Reference Murphy and Mowbray1951). Finally, in 1951, 13–14 pairs were discovered breeding in rock burrows on three small islets on the eastern fringe of Castle Harbour (Murphy and Mowbray Reference Murphy and Mowbray1951). A subsequent survey, in 1961, located a total of 18 occupied burrows (Wurster and Wingate Reference Wurster and Wingate1968) dispersed among five small islets (Madeiros Reference Madeiros2005). A recovery programme was initiated shortly thereafter (Wingate Reference Wingate and Moors1985).
Key threats were identified and, where possible, mitigated (Wingate Reference Wingate and Temple1978, Wingate Reference Wingate1995, Madeiros Reference Madeiros2005). The main issue—a shortage of suitable nesting sites—has been exacerbated by competition from the White-tailed Tropicbird Phaethon lepturus and destruction of nest sites by storms. Other key threats have included: predation by brown rats Rattus norvegicus, black rats R. rattus and various migratory raptors; and occupation of burrows by swarms of feral European honeybee Apis mellifera. Action taken to address these threats, including the provision of artificial nest sites (concrete burrows) and the control of rats on the breeding islands, has resulted in a steady increase in the petrel population (Milne and Milne Reference Milne and Milne1968, Zimmerman Reference Zimmerman1975, Wingate Reference Wingate1995, Madeiros Reference Madeiros2005). By 2000, the breeding population had grown to 56 pairs (Carlile et al. Reference Carlile, Priddel, Zino, Hodges and Wingate2003). Despite this increase, the population remains extremely small and the species is classified as ‘Endangered’ (BirdLife International 2010) under current IUCN criteria (IUCN 2001).
Although the Bermuda Petrel has been the subject of one of the longest continuous recovery programmes of any procellariiform (1961–2011), there are many aspects of the ecology of the species that have not been adequately studied or reported. Knowledge of breeding phenology, for example, is fundamental to the design of any monitoring programme and essential for optimising the efficiency of each visit to the colonies. This study investigated breeding phenology, productivity and population size of the Bermuda Petrel between 2000/1 and 2007/8. Results are reported along with past population trends and recovery actions, and the conservation implications of the findings are discussed in relation to current threats and future management actions.
Methods
Study area
Bermuda Petrels nest on four of the numerous small rocky islets that fringe the eastern side of Castle Harbour, Bermuda: Horn Rock, Green Island, Inner Pear Rock and Long Rock (Figure 1). They also nested on Outer Pear Rock (Figure 1), but brown rats extirpated this small colony (two pairs) in 1967 (Madeiros Reference Madeiros2005). The four islets with extant colonies have a combined area of 1.4 ha, are of low elevation (< 10 m) and prone to being overwashed during hurricanes and storms. They are composed of soft limestone and are readily eroded. Soil occurs only in isolated pockets and vegetation is sparse, with low-growing, salt-resistant coastal species such as seaside oxeye Borrichia arborescens, sea purslane Sesuvium portulacastrum, coast spurge Chamaesyce mesembrianthemifolia and sea lavender Argusia gnaphalodes dominating. Plant taxonomy follows the PLANTS database (USDA 2010).
Location of Castle Harbour, Bermuda, showing the four islets (shaded) on which the Bermuda Petrel bred during this study (2000/1–2007/8). Up until 1967 a small colony also bred on Outer Pear Rock. The inset shows the location of the study area within the islands of Bermuda.

Monitoring of nest sites and calculation of breeding phenology
The entire breeding population of Bermuda Petrel was monitored over eight breeding seasons (2000/1–2007/8). Each year, the four nesting islets were visited from when adults first arrived (mid-October) until all nestlings had fledged (late June). Visits before mid-November were sporadic and cursory; the only data collected were whether or not birds were present at the colony. From mid-November visits were every 1–4 days until the commencement of fledging (mid-May), and 1–2 days thereafter. During these visits, each nest site was inspected and the contents recorded. Early in the season (before and just after hatching), all known burrows (natural and artificial) were inspected, along with other potential nesting sites within each colony and on other islets nearby. Later in the season, only occupied nests were inspected.
Where a natural burrow was so deep that it was not possible to reach the nest chamber, the presence of an adult, nest, egg or nestling was recorded visually. Nests that were unreachable and unobservable were monitored for signs of activity throughout the nesting period using the presence of tracks left in sand placed at the burrow entrance.
A previous management decision not to handle any petrel was overturned in mid-2001. Thereafter, all birds were fitted with a metal leg-band inscribed with a unique number, enabling individual recognition. On inspection of a nest site, any adult present was removed, checked for the presence of a band and weighed to the nearest gram using a spring balance. The band number was recorded, and any non-banded bird was fitted with a band. When both individuals of the pair had been identified, subsequent handling during that breeding season was minimised. Where accessible, all nestlings were also banded, late in the breeding season.
For inaccessible nests, adults were intercepted as they moved to or from their burrow, and fledglings were captured and banded when they emerged from their burrow during the nights immediately preceding their departure to sea.
Dates of the following events were recorded: arrival, exodus, return, and last day ashore of adults; egg laying; hatching; and fledging. Because sampling was less than daily, not all data were obtained for all nests or individuals. Where data were available, the following parameters were calculated: duration of pre-laying exodus; incubation period; and fledging period (hatching to fledging). As birds were not banded in 2000/1, data on breeding phenology were not collected in this year. Data are presented as means ± one standard deviation.
Breeding productivity
The following three productivity parameters were calculated annually (2000/1–2007/8): hatching success, the number of fledglings produced, and breeding success. Estimates of hatching success (the proportion of eggs that hatched) and breeding success (the proportion of eggs that produced fledglings) were derived only from accessible nests.
Population size
Two demographic parameters, the number of occupied burrows and the number of confirmed breeding pairs, were calculated annually. Occupied burrows included all accessible burrows that contained freshly lined nests, plus those inaccessible burrows where either: (i) a pair of birds were detected and identified; (ii) activity was recorded repeatedly and a fledgling had been produced in a previous year; or (iii) activity was present beyond April (non-breeding birds generally depart the breeding grounds by mid- April). The number of confirmed breeding pairs was the sum of accessible nests that contained eggs plus inaccessible nests that produced fledglings.
Population trends were examined by combining the population estimates obtained in this study (2000/1–2007/8) with earlier data (1960/1–1999/2000) collected by David Wingate (Wurster and Wingate Reference Wurster and Wingate1968; Wingate Reference Wingate and Temple1978, Reference Wingate and Moors1985 and 1995; Carlile et al. Reference Carlile, Priddel, Zino, Hodges and Wingate2003; unpublished records). Due to a significant number of inaccessible nests, and for comparison with earlier studies, the size of the breeding population was based on the number of occupied burrows rather than the number of confirmed breeding pairs. The mean observed exponential rate of increase (r) of the population (the instantaneous growth rate) was calculated as:
after Caughley (Reference Caughley1977); where N is the natural log of the number of occupied burrows, t is the year (beginning with 1 in 1960/1), and n is the number of years of observations. The doubling rate of the population was calculated as 0.6931/r. The mean annual growth rate (λ), was calculated as λ = er.
Results
Breeding phenology
There was little year-to-year variation (2001/2–2007/8) in the timing of breeding events (Table 1). Breeding occurred during the northern winter, with the first adults appearing at the nesting grounds in mid-October and most having arrived by mid-November. Pairs selected a burrow (a natural rock cavity or an artificial concrete burrow) and constructed a shallow nest lined with dry vegetation within a terminal nest chamber. Between 19 November and 14 December adults departed on a pre-breeding exodus lasting 32–56 days (Table 1). Birds returned between 31 December and 31 January to lay a single egg (mean 58.9 ± 3.7 g, range 50–64, n = 14) that was incubated for 53 ± 2 days and which hatched between 16 February and 26 March. Nestlings fledged between 15 May and 25 June after a period of 91 ± 5 days in the nest (Table 1). Mean adult weight was 349.0 ± 38.9 g (range 257–455 g, n = 137). Breeding adults were seldom recorded at the nesting colony after mid-June.
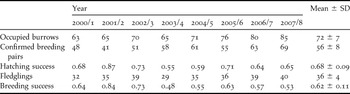
Breeding parameters of the Bermuda Petrel between 2001/2 and 2007/8. SD is in days.
A total of 105 adults and 198 fledglings were banded during the study. Breeding birds were highly philopatric, with established breeding pairs rarely changing nest sites. Based on a sample (n = 50) of banded birds breeding in accessible nests, at least 98% of birds known to be alive returned each year to breed (n = 258 bird years). Two of the four occasions that birds were not detected during the breeding season were associated with the apparent death of a partner.
Breeding productivity
Fledgling production between 2000/1 and 2007/8 ranged from 29 to 40 individuals annually (Table 2). Breeding success varied between 0.48 and 0.84. The difference between hatching success and breeding success was minor (mean 0.06, Table 2), indicating that few nestlings died. The highest rate of nestling mortality occurred in 2007/8 when a black rat reached Long Rock and killed five individuals. The lowest breeding success (0.48) and the least number of fledglings (29) were recorded during 2003/4.
Population size and trend
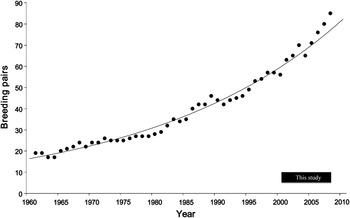
The number of occupied burrows recorded annually between 2000/1 and 2007/8 ranged from 63 to 85 (Table 2). The number of confirmed breeding pairs ranged from 41 to 69. Population size since 1961 increased exponentially (y = 16.422 e0.0322x, P < 0.001, R 2 = 0.981; Figure 2). The mean annual growth rate (λ) was 1.033, with a doubling time of 21.5 years.
Population size and breeding productivity of the Bermuda Petrel between 2000/1 and 2007/8. The number of occupied burrows includes all accessible burrows that contained newly constructed nests, plus those inaccessible burrows where either (1) a pair of birds had been recorded on the same night, (2) activity was recorded repeatedly and a fledgling had been produced in a previous year, or (3) activity was present beyond April. The number of confirmed breeding pairs is the sum of accessible nests that contained eggs plus inaccessible nests that produced fledglings. Hatching and breeding success are derived only from accessible nests that contained eggs.
Breeding population of the Bermuda Petrel 1960/1–2007/8. Line indicates exponential curve fitted to data (y = 16.422 e0.0322x, R 2 = 0.9808). Data for 1960/1–1999/2000 was extracted from the records of David Wingate, much of which is published in: Wurster and Wingate Reference Wurster and Wingate1968; Wingate Reference Wingate and Temple1978, Reference Wingate and Moors1985 and 1995; and Carlile et al. Reference Carlile, Priddel, Zino, Hodges and Wingate2003. Data for 2000/1–2007/8 are from this study.
Discussion
Breeding biology
The breeding biology of the Bermuda Petrel is similar to that of other Pterodroma species, with a pre-laying exodus from the nesting grounds, a single egg laid each year, long incubation bouts by both members of the pair, and a long fledging period (Warham Reference Warham1990, Gardner Reference Gardner1999, Priddel et al. Reference Priddel, Hutton, Carlile and Bester2003, Imber et al. Reference Imber, West and Cooper2003, Cruz-Delgado et al. Reference Cruz-Delgado, González and Wiedenfeld2010).
Annual breeding success of the Bermuda Petrel between 2001/2 and 2007/8 (mean 0.62, range 0.48–0.84) was greater than previous published estimates for this species (range 0.29–0.67; Wurster and Wingate Reference Wurster and Wingate1968) and towards the high end of figures reported for other Procellariiformes (see Warham Reference Warham1990, Gardner Reference Gardner1999, Priddel et al. Reference Priddel, Hutton, Carlile and Bester2003, Imber et al. Reference Imber, West and Cooper2003, Cruz-Delgado et al. Reference Cruz-Delgado, González and Wiedenfeld2010). Apart from the loss of five nestlings to rats in 2007/8, there were no identified land-based threats on land to account for the year-to-year variation in breeding success (2000/1–2007/8). The lowest breeding success (0.48) and the least number of fledglings (29) were recorded during 2003/4. Poor hatching success was the cause of such poor productivity, but the reason why so many eggs failed is not known. As nothing is known about the foraging behaviour of the Bermuda Petrel or the marine resources they exploit, it is not possible to identify the particular marine environmental parameters that are most likely to influence breeding success. Research utilising geo-locational data loggers to examine the at-sea movements of Bermuda Petrel should be undertaken to address this knowledge gap.
Although the Bermuda Petrel has been the subject of a recovery programme spanning 50 years, many aspects of the ecology of the species remain unknown. A previous long-standing precaution to not handle or band individuals has meant that opportunities to gather information on philopatry, mate fidelity, age of first return, age of first breeding, longevity, survival, mortality, diet and foraging ecology have been forgone. Having demonstrated in this study that careful handling is not detrimental to the Bermuda Petrel, additional studies to investigate many of these aspects are now underway.
Recovery actions
Recovery of the Bermuda Petrel has been achieved through a suite of management actions, some of which have been undertaken since 1961. Intensive monitoring of population size and breeding success has been essential to assess the efficacy of these actions, providing feedback into the recovery process. Monitoring has also helped to identify the full suite of threats operating. As each threat has been identified, appropriate mitigation measures have been developed and implemented.
The islets on which the Bermuda Petrel nests are now fully protected as nature reserves under the Bermuda National Parks Act 1986. In addition, both the Bermuda Petrel and its breeding habitat are protected under the United States Endangered Species Act of 1973 and the Bermuda Protected Species Act 2003. For the most part, rats and feral bees have been eliminated or controlled using anticoagulant rodenticide and insecticide respectively (Madeiros Reference Madeiros2005). The occasional vagrant avian predator has been either persuaded to leave or killed.
The major issue—competition for nest sites from tropicbirds—has been reduced by installing artificial dome nests for tropicbirds along cliffs and other areas not used by petrels, and by fitting wooden baffles over the entrances of petrel burrows (Wingate Reference Wingate and Temple1978). These baffles allow petrels to pass through but prevent entry of the larger tropicbirds. Also, the small number of natural burrows on the four nesting islets (perhaps now as few as 20) has been augmented by the ongoing construction of scores of concrete burrows. These artificial structures have been provided in sufficient numbers to ensure a constant oversupply of approximately 10–15 burrows (Madeiros Reference Madeiros2005). The petrel population has long exceeded the natural carrying capacity of the four islets, with approximately 80% of birds now nesting in artificial burrows.
Constructing and maintaining concrete burrows on the current nesting islets is a challenging and labour-intensive process. The high rate of increase of the Bermuda Petrel population, together with the increased incidence of storm damage, is making it progressively more impracticable to have enough structures to accommodate all breeding pairs. Recent successes in establishing new colonies of other burrow-nesting Procellariiformes by translocation of nestlings (e.g. Miskelly and Taylor Reference Miskelly and Taylor2004, Bell et al. Reference Bell, Bell and Bell2005, Priddel et al. Reference Priddel, Carlile and Wheeler2006, Miskelly et al. Reference Miskelly, Taylor, Gummer and Williams2009) have led to recent action to establish a new colony of Bermuda Petrel at a more secure and manageable location, well above the height of the most severe storm surge (Reference Carlile, Priddel and MadeirosCarlile et al. 2012). Between 2004 and 2008, 104 near-fledged young were taken from the four islets where the species naturally breeds and translocated to Nonsuch Island, where they were hand-fed until they fledged (Reference Carlile, Priddel and MadeirosCarlile et al. 2012).
Population trends
Since 1961, the breeding population of Bermuda Petrel has increased exponentially, doubling approximately every 22 years. The annual rate of increase for Bermuda Petrel (1.033) is similar to that of Gould’s Petrel Pterodroma leucoptera on Cabbage Tree Island, Australia (1.036 between 1993 and 2009; Priddel unpubl. data) following the removal of all land-based threats (Priddel and Carlile Reference Priddel and Carlile1997). This similarity in the observed rate of increase of two intensively managed species suggests that this may be the maximum rate of population growth attainable for these petrels, and perhaps for others with similar life histories.
Banding recoveries of Bermuda Petrel have shown that individuals first breed when 3–7 years of age (Reference Carlile, Priddel and MadeirosCarlile et al. 2012), so many of the young produced in recent years have yet to return. Recruitment of young birds into the breeding population over the next seven years is likely to sustain the current rate of population growth, at least in the short term.
Hurricane damage to nesting sites of the Bermuda Petrel, along with the loss of a single colony to rat predation in 1967 (Madeiros Reference Madeiros2005) and the loss of five nestlings to a single rat in 2008 have been the only significant setbacks in the ongoing management of the species. Using the current IUCN criteria (IUCN 2001), the Bermuda Petrel would have qualified as ‘Critically Endangered’ (< 50 mature individuals) in 1961 when recovery efforts first commenced. Today, because the population numbers between 50 and 250 mature individuals, it qualifies as ‘Endangered’. If the rate of increase observed over the last 50 years continues, the population is predicted to exceed 250 breeding individuals in 2023, when the species will qualify for a change in conservation status to ‘Vulnerable’. Recovery of the Bermuda Petrel from Critically Endangered to Vulnerable would have taken 62 years, demonstrating the long timeframe for recovery programmes involving Procellariiformes and other species with similar life histories (long-lived and low fecundity).
Conservation and management implications
Although the population of Bermuda Petrel has increased substantially over the past 50 years, the species remains highly threatened due to the vulnerability of the current nesting sites to storm damage. This vulnerability was graphically illustrated when hurricane Fabian struck Bermuda on 5 September 2003. Violent seas caused extensive damage to each of the islets where nesting occurred. At least 15 burrows were completely destroyed, and many others damaged or inundated. In addition, large areas of rock face, some containing burrows, were undermined placing them in danger of further collapse. Substantial changes to the topography of some islets made it impossible to reconstruct many of the nest sites that were lost.
Future projections, based on climate modelling, indicate that greenhouse warming will cause the average intensity of tropical storms to strengthen, with intensity increases of 2–11% by 2100 (Knutson et al. Reference Knutson, McBride, Chan, Emanuel, Holland, Landsea, Held, Kossin, Srivastava and Sugi2010). Despite a projected decrease in the overall frequency of tropical storms, models predict a near doubling of the frequency of category four and five events by the end of the 21st century (Bender et al. Reference Bender, Knutson, Tuleya, Sirutis, Vecchi, Garner and Held2010). The largest increase is projected to occur in the Western Atlantic, north of 20°N, in the region where Bermuda is located. Accelerating storm damage causing erosion of nesting sites is now the most serious threat to the long-term survival of the Bermuda Petrel at its current nesting sites and has provided the impetus to establish a more secure breeding site elsewhere (Carlile et al. 2012).
Acknowledgements
The efforts and support of the following people have contributed to the recent successes of the recovery programme: Jack Ward, Jennifer Gray, Leila Madeiros, Annie Glasspool, Patrick Talbot, Joseph Furbert, Peter Drew and David Wingate. Over the last decade or so the Bermuda Terrestrial Conservation Work Crew consisting of Barry Smith, Hillgrove Iris, Kiwon Furbert and Marvin Jones have constructed concrete nesting burrows on each of the nesting islets. The Bermuda Audubon Society provided funding for equipment. Robert Wheeler and Matt Rayner provided useful comments on an earlier draft of this manuscript.


