


1. Introduction
Decarbonizing the world economy necessitates unprecedented amounts of money. Despite the increasing capitalization of the low-carbon sector, the International Energy Agency in its 2023 World Energy Outlook estimates that investments in clean energy need to triple to about US$4.3 trillion annually until 2030 to keep net zero emissions by 2050 within reach (IEA, 2023). Ambitious climate targets require greater investments in green assets and, at the same time, substantial capital reallocation away from fossil fuels. With markets as the primary conduit for steering capital allocation, concerns about financial investors’ short time horizons dampen the prospect of a market-led energy transition. Existing research, therefore, highlights the politicization of public policy for speeding up the transition (Aklin and Urpelainen, Reference Aklin and Urpelainen2018; Mildenberger, Reference Mildenberger2020; Stokes, Reference Stokes2020; Colgan et al., Reference Colgan, Green and Hale2021; Nahm, Reference Nahm2021; Gazmararian and Tingley, Reference Gazmararian and Tingley2023; Bolet et al., Reference Bolet, Green and González-Eguino2024; Voeten, Reference Voeten2024).
In the spirit of this work, this paper studies the response of stock markets to energy transition policy signals in moments of high salience, where “windows of opportunity” for increased policy ambition arise from high levels of uncertainty in capital markets. Specifically, we examine if and under what conditions political reassurances about the future profitability of green industries can boost capital allocation toward low-carbon assets at the onset of the Russian invasion of Ukraine. We motivate the choice of this case with the observation that—despite initial commentary to the contrary—the war did not have much of a catalyzing effect for the energy transition because it did not hit fossil fuel producers with full force.Footnote 1 Consistent with the argument that we develop in this paper, we attribute this turn of events to a lack of sustained top-level political commitments by the European Union (EU) leadership to long-term green renewal.
Our study hones in on an important point, namely the conditions of credible communication of future energy policy between policymakers and markets to spur a robust energy transition. In the context of the EU's response to the Russian invasion of Ukraine, we study the effect of European Commission announcements throughout 2022. Doubling down on a similarly interventionist approach as seen in the “directionist coordination” during the Covid-19 pandemic (European Council, 2022), the Commission combined sanction packages against Moscow with announcements about speeding up the clean energy transition to reduce dependence on Russian oil and gas. These state-led policies hoped to address economic risks and stagnation while seeking to overcome the impasse of ambitious climate action, which requires targeted political strategies (Meckling et al., Reference Meckling, Kelsey, Biber and Zysman2015; Bayer and Urpelainen, Reference Bayer and Urpelainen2016; Breetz et al., Reference Breetz, Mildenberger and Stokes2018; Gaikwad et al., Reference Gaikwad, Genovese and Tingley2022; Green et al., Reference Green, Hadden, Hale and Mahdavi2022). But while the effect of these types of (green) industrial policy is being increasingly researched (Allan et al., Reference Allan, Lewis and Oatley2021; Allan and Nahm, Reference Allan and Nahm2024; Juhàsz and Lane, Reference Juhàsz and Lane2024), direct market responses to greater interventionism and the conditions under which markets are prepared to adjust to swiftly emerging political visions laid out by such policies remain largely understudied.Footnote 2
Our argument focuses on how markets perceive the credibility of policy signals by the EU as the most important policy actor at that point in time. While some scholars tend to be skeptical about the EU’s ability to communicate credibly (Majone, Reference Majone2000; Meunier and Nicolaidis, Reference Meunier and Nicolaidis2019; Zeitlin et al., Reference Zeitlin, Nicoli and Laffan2019), concerns about diluted communication due to the EU’s complex, multi-level governance should be muted in times of crisis. When macroeconomic uncertainty is large and market volatility is high, as was the case in Europe at the beginning of the war in Ukraine, markets value political steer to protect profits and minimize transition risks. We argue that, in such moments, financial investors understand political reassurances about the future profitability of low-carbon investments as EU commitments to a sustained energy transition. This logic translates into the expectation of observable market responses in the form of increased returns for green companies and divestment from fossil fuel assets. We also claim that these distributional effects of credible policy signals will be stronger for directly climate-relevant announcements relative to indirect ones.
While such effects may only matter for brief periods right after an EU announcement, short-term capital reallocation is an important necessary condition to sustain the energy transition in the long run. Therefore, we empirically test our central expectations by studying short-term stock market returns of European fossil fuel and renewable energy companies at the start of the Ukraine war.Footnote 3 Our event-study of a sample of 115 EU-based energy companies shows that fossil fuel (66 companies) and renewable energy firms alike (49 companies) experienced stock returns that were significantly above market expectations and comparable across both groups, when the European Commission announced sanction packages that targeted Russian assets and severed ties to Russian oil and gas firms.
We also find that initial announcements that directly shaped the EU’s climate and decarbonization strategy—primarily through the €300 billion REPowerEU clean energy investment package—had even larger positive effects on the returns of EU-based energy firms and were stronger for green companies. Following the announcement of REPowerEU, European renewable energy companies saw returns that were 5.1% higher than market expectations, while their fossil fuel counterparts’ returns were not significantly above market expectations. However, all of these effects dissipate quickly. Furthermore, once the EU’s broader policy vision in response to the war had been communicated through sanctions and energy policy announcements, markets internalized this information, and market responses became more muted.
Our findings contribute to existing comparative political economy research in two ways. First, they speak to broader debates about the relationship between politics and markets (Przeworski, Reference Przeworski2003; McNamara and Newman, Reference McNamara and Newman2020). We provide an argument about the types of policy announcements and the conditions under which markets respond to such announcements in ways that are consistent with the policy vision that is conveyed in them. In line with other work, we show that the ability of interventionist policy announcements to steer markets—i.e., by reallocating capital from fossil fuels to renewables—depends on the perceived credibility of the announcements and sustained efforts to direct markets. In the absence of repeated and unambiguous signals about strong political commitments to the clean energy transition, market support falters (Gard-Murray et al., Reference Gard-Murray, Hinthorn and Colgan2023) and well-studied institutional barriers for long-term policymaking prevail (Finnegan, Reference Finnegan2022a; Reference Finnegan2022b).
Second, our findings have implications for the growing firm-level literature in climate politics (Kennard, Reference Kennard2020; Cory et al., Reference Cory, Lerner and Osgood2021; Genovese, Reference Genovese2021; Bayer, Reference Bayer2023) and the literature on government-firm interactions more generally (Wellhausen, Reference Wellhausen2014; Baccini et al., Reference Baccini, Pinto and Weymouth2017; Kim, Reference Kim2017; Malesky and Mosley, Reference Malesky and Mosley2018; Kim and Osgood, Reference Kim and Osgood2019; Juhàsz and Lane, Reference Juhàsz and Lane2024; Hansen and Mitchell, Reference Hansen and Mitchell2000; Rickard and Kono, Reference Rickard and Kono2013; Malesky et al., Reference Malesky, Gueorguiev and Jensen2015). Here, we add new evidence that markets can effectively differentiate between distributionally relevant policy announcements even within the same sector. In the case of the clean energy transition, understanding the interaction of territorial institutions and credible political communication has proven essential to avoid forgoing opportunities for systematic change toward a more sustainable future.
2. The return of market interventions in EU energy policy
Much of the making of the EU since the 1950s happened through the expansion of markets and was centered on neoliberal fundamentals of competition and openness (Meunier and Nicolaidis, Reference Meunier and Nicolaidis2019; McNamara, Reference McNamara2023). In the area of EU environmental and energy policy, this tradition took over in the late 1990s when market principles found their way into the Union’s main governance frameworks. The turn away from command-and-control regulation toward market-based instruments was on prominent display in international climate negotiations when the EU gave up its initial opposition to the flexible mechanisms in the Kyoto Protocol. As a result, the European Union Emissions Trading System (EU ETS), still the largest carbon market worldwide bar China’s, started operating in 2005 and was praised by the Commission as the “EU’s key tool for cutting greenhouse gas emissions.” It remains a central instrument in the bloc’s climate strategy 20 years on. Notwithstanding its importance, the EU ETS was not the exception in the Commission’s new regulatory paradigm. Policies on renewable energy production and energy efficiency that flanked the introduction of the carbon market as part of the “20-20-20” package were equally guided by market principles in an increasingly liberalized Internal Energy Market.
Despite their central role in EU climate and energy policy, there is increasing evidence that the success of market-based approaches is mixed (Green, Reference Green2021; Perino et al., Reference Perino, Ritz and van Benthem2022). Some find that carbon pricing across Europe helped reduce CO2 emissions (Bayer and Aklin, Reference Bayer and Aklin2020; Colmer et al., Reference Colmer, Martin, Muuls and Wagner2025) while stimulating investments in innovation (Calel and Dechezlepretre, Reference Calel and Dechezlepretre2016). Others warn of political risks and distorted economic incentives. Just like studies have shown that market competition shapes firms’ preferences for climate policy (Green, Reference Green2013; Genovese, Reference Genovese2019; Kennard, Reference Kennard2020), research also finds that firms were able to shape policy provisions to their benefit (Ellerman et al., Reference Ellerman, Buchner and Carraro2007; Genovese and Tvinnereim, Reference Genovese and Tvinnereim2019; Bayer, Reference Bayer2023).
More recently, a significant change in approach to climate policymaking has occurred, with state intervention making a comeback both in Europe and globally. In the case of the EU, the return to more active market interference is rooted in lessons from the 2009 European financial crisis and momentum from the EU’s response to the Covid-19 pandemic. Large-scale EU investment programs “NextGenerationEU” (€800bn investments for post-Covid recovery) and “REPowerEU” (€300bn investments in affordable, secure, and sustainable energy for Europe) are emblematic of this “interventionist turn” underpinned by a broad shift in policy vision. This new approach ranges from massive Green New Deal infrastructure investments to regulatory reform, such as the introduction of a carbon border tax (Bayer and Schaffer, Reference Bayer and Schaffer2024; Shum, Reference Shum2024).
The revival of interventionist policymaking has two important drivers that have implications for the (re)allocation of capital for the purposes of the energy transition. The first driver is the desire among policymakers for a 21st-century industrial policy as a strategic lever to protect national economic interests (Allan et al., Reference Allan, Lewis and Oatley2021; Allan and Nahm, Reference Allan and Nahm2024; Juhàsz and Lane, Reference Juhàsz and Lane2024). Indeed, institutional scholars have shown that state-led industrial policy can create buy-in from investors, especially if these policies come in the form of subsidies (Rickard, Reference Rickard2012; Colgan and Hinthorn, Reference Colgan and Hinthorn2023). Green industrial policy can also induce new global competition, but the extent to which this happens depends on the domestic political economy and the country context (Nahm, Reference Nahm2021; Kupzok and Nahm, Reference Kupzok and Nahm2024). This literature suggests that green industrial policy can create the initial conditions for a successful green renewal, but markets are needed to sustain and scale up demand.
The second driver for a re-orientation of regulatory paradigms is often a crisis that serves as a critical juncture. Just like the oil crisis in the 1970s became a catalyst for the reform of global energy markets (Meckling et al., Reference Meckling, Lipscy, Finnegan and Metz2022), so did the post-pandemic polycrisis invite a strong policy response. Geopolitical considerations have become paramount for future-proofing supply chains, and supply security was a core motivation for speeding up the clean energy transition in the United States and China (Colgan and Hinthorn, Reference Colgan and Hinthorn2023). In times of crisis, when uncertainty is large, institutional responses by policymakers can stabilize markets. They can do so by shaping market expectations and by creating business opportunities, two effects that materialize when policy announcements and underlying political institutions are seen as credible (Meckling and Nahm, Reference Meckling and Nahm2022).
Treating the Russian invasion of Ukraine in February 2022 both as such a crisis moment and an exogenous shock to Europe’s energy security, we study the effect of public policy announcements by the European Commission on market responses. Our key inferential goal is to parse whether the EU’s move toward greater interventionism, operationalized through announcements of sanction packages and clean energy investment promises, triggers observable responses in stock market returns—and if so, under what conditions. We first discuss possible market effects of EU interventionist announcements to underpin our theoretical priors and then describe the research design that allows us to test our expectations.
3. Market responses to EU public policy announcements in times of crisis
We start our argument about the observable market effects of EU interventionist announcements from the vantage point of a large political economy literature that characterizes when and how political communication moves expectations of financial markets. Accordingly, announcements by sovereign political authorities will have reverberating effects in domestic markets as long as they have legitimacy and credibility.
EU announcements may be perceived differently from announcements by domestic political elites for two reasons. First, the multi-level governance and long delegation chains in EU decision-making can dilute messages from Brussels, breaking the link between announcements and the material implications for businesses.Footnote 4 The empirical evidence about market responses to EU announcements is indeed mixed: some find that decisions taken at EU summits move financial markets (Gray, Reference Gray2009; Bechtel and Schneider, Reference Bechtel and Schneider2010), yet others point to a lack of clarity in EU communication (Majone, Reference Majone2000; Zeitlin et al., Reference Zeitlin, Nicoli and Laffan2019). Second, even if markets were receptive to EU announcements, content matters. As such, markets might understand interventionist public policy announcements as protectionism, depressing profit expectations.Footnote 5
Following these considerations, the EU may have a more significant role to play in market responses in times of crisis.Footnote 6 While financial investors may find it cumbersome to decipher the material consequences of EU public policy announcements for their portfolios during normal times, EU announcements carry special weight when political and economic uncertainty are high and markets are volatile. This is both a function of the size of the EU Single Market—with 450 million people and an output of US$16 trillion—and its institutional stability. Multi-level governance is a boon during crises as interlocked decision-making institutions create the very credibility that markets seek. Financially intensive political commitments cannot simply be undone at the whim of a single member-state government, so they are likelier to stand the test of time. It is hence not by accident that the “credibility premium” of EU institutions tends to be highest in turbulent times (Jones et al., Reference Jones, Kelemen and Meunier2016; Schimmelfennig, Reference Schimmelfennig2018).
This logic holds for any crisis, but becomes more important the more existential a crisis is. The European financial crisis, the Covid-19 pandemic, and the 2022 Russian invasion of Ukraine all serve as good examples. The protective umbrella of the EU as a bloc of 27 member states is most valuable for outsized crises that threaten to overwhelm the crisis-management capacity of individual states. EU intervention quelled market speculation about Greek liquidity during the country’s debt crisis. Coordinated procurement and rollout of Covid-19 vaccines had a similar effect for charting a way out of lockdowns toward economic recovery. We therefore expect that announcements by the European Commission in response to the Russian invasion of Ukraine, as the latest crisis in a string of geopolitical challenges to Europe’s peace and security, are likely to invite clear market reactions.
Focusing on a crisis episode is, therefore, most helpful for our argument. By design, crises are synonymous with high levels of market uncertainty. This makes it more difficult for market participants to rely on standard decision-making heuristics and prompts them to turn to policymakers for guidance and reassurance. For actors, such as the European Commission, this creates opportunities to fill the informational vacuum that crisis moments create and tame market uncertainty. As long as these policy announcements are perceived as credible signals, markets will follow the political direction laid out by such announcements. While credible communication should also be possible outside of crisis moments, both the demand from markets for political steer and the supply of such announcements by political actors to stabilize markets is higher when crises hit. Our focus on times of crisis, hence, aids our theorizing insofar as these moments create important preconditions for effective information transmission in the form of political communication through policy announcements.
Taking this basic claim to the case of the EU energy transition, we argue that how and for whom interventionist EU announcements matter depends on both the type of announcement (i.e., whether it directly concerns the energy transition or not) and the type of affected assets (i.e., whether the announcement targets green or fossil fuel firms). In developing our expectations about the distributional effects of public policy announcements—and how they translate into market responses—we therefore concentrate on these two key dimensions.
3.1. Expectations
Confronted with the Russian attack on Ukraine, the European Commission responded with two types of announcements that had implications for energy markets: some announcements were targeted sanctions against Russia’s exports; others were commitments to the EU’s clean energy transition as a way to reduce European import dependence on (Russian) oil and gas. While both types of announcements matter for energy markets and the respective actors involved in them, we argue that distributionally relevant differences in the announcements’ contents exist.Footnote 7 The sanction packages were varied in whom they targeted and were broader than just hitting energy markets and associated oil and gas infrastructure. Sanctions importantly demonstrated the EU’s resolve against the Russian aggression in spite of unavoidable price spikes in energy costs for European businesses and households. By contrast, clean energy transition announcements focused on the renewables portion of the energy market, in particular, and served as tailored reassurances of the EU’s long-term commitment to a green renewal.
The difference in relative focus of these two types of announcements translates into different growth and profit expectations for fossil fuel-intensive and renewable energy companies. Credible policy announcements that promise to create business opportunities for some firms should see their stocks rise, while stocks for companies with grim prospects should drop (McNamara and Newman, Reference McNamara and Newman2020).
Since sanction packages restricted cheap energy supply to Europe from one day to the next, we expect that European Commission sanctions announcements would increase stock market returns of energy producers of all types (Hypothesis 1). The war in Ukraine reminded Europeans of the geopolitical importance and strategic value of secure energy access (Meunier and Nicolaidis, Reference Meunier and Nicolaidis2019). This endowed energy companies with considerable political leverage. Even though the EU and many of its member states champion the idea of climate leadership and net-zero targets, they scrambled to quickly diversify their energy imports after the war had started. To keep the lights on, policymakers searched for alternatives—not necessarily green ones, as the German rush toward building liquefied natural gas (LNG) terminals in breakneck speed showed.Footnote 8 Sanction package announcements, therefore, should be promising news for the energy sector as a whole.
We believe this contrasts with announcements that emphasize the need for an increased pace of economy-wide decarbonization. Political commitments by Brussels to a sustained clean energy transition create justified growth expectations among financial investors for the renewables sector within the energy market. As a result, we hypothesize that European Commission announcements in support of the clean energy transition would increase stock market returns only for renewable energy companies (Hypothesis 2). The wedge in market responses to announcements about green renewal is similar to findings in the literature on green industrial policies that often simultaneously squeeze the market share of fossil fuel producers and open markets to non-incumbent firms (Meckling et al., Reference Meckling, Kelsey, Biber and Zysman2015; Bayer and Urpelainen, Reference Bayer and Urpelainen2016). Compared to sanction package announcements, which largely lack the capacity to differentiate between brown and green firms, we expect to see separation between brown and green firms from distributionally relevant announcements that are direct affirmations of the clean energy transition as an overriding policy vision.
4. Case study: Russia’s invasion of Ukraine
The European Commission’s commitment to transition EU economies away from fossil fuels predates the Russian invasion of Ukraine by several years. The European Green Deal, launched by the Commission president von der Leyen in 2019, set out the vision of carbon neutrality by 2050. This long-term target was translated into the goal to reduce greenhouse gas emissions by 55% by 2030 in the “Fit for 55” package. These broader contours help contextualize the threat the war in Ukraine has been posing to the EU’s immediate decarbonization efforts as well as to its longer-term climate ambition.
At the beginning of the 2022 invasion of Ukraine, several EU countries were highly dependent on Russian oil and gas, including Central and Eastern European member states like Czechia, Hungary, and Poland, as well as the EU’s economic powerhouses of Germany, France, and Italy (Noël, Reference Noël2022). Since Russian natural gas figured prominently in the EU’s decarbonization strategy as a “transition fuel” away from more carbon intensive oil, some observers quickly pointed to the difficulties the war would create for the EU’s net zero plans.Footnote 9 Others, including the International Energy Agency (IEA, 2022), wanted the war to be harnessed as an opportunity to reduce reliance on Russian energy imports and, at the same time, increase domestic renewable production. Just days before the invasion, Kadri Simson, EU Commissioner for Energy, tweeted:
Just had a phone call w/ French minister @barbarapompili, to discuss #EU preparedness & to coordinate action on #energy security. We have to reduce dependency on Russian gas, diversify our suppliers & invest in #renewables. #EU is strong, united & stands in solidarity with #Ukraine.
Financial actors were largely sympathetic to EU preparedness. While investors expected the EU to diversify gas supply to alternative sources outside Russia in the short term, they adopted an upbeat stance on investment in renewables and greater domestic production in the longer run. Notable private consultancy groups came to a similar conclusion when they found that the Russian invasion could be “a turning point in seizing the opportunity to address the globe’s unfolding climate crisis” (McKinsey & Company, 2022).
For our analysis, we draw on six key announcements by the European Commission in response to the Russian invasion of Ukraine on 24 February 2022, as shown in Figure 1. These events were identified through a review of the EU timeline events in 2022, as well as a content analysis of the packages themselves to establish their energy market relevance. In light of these decisions, we focus on announcements of sanction packages 2-4 (the first package was already adopted on 23 February 2022, i.e., the day before the invasion), shown in blue, and three energy transition policy announcements as part of the REPowerEU plan, marked in green.Footnote 10
European Commission announcements by event type. The figure marks announcement dates for sanction packages 2 $-$4 in blue and REPowerEU policy measures in green. The red dot indicates the invasion of Ukraine.

On the first day after the attack (25 February, package 2), the EU announced an immediate ban on trade in Russian goods and services, including technologies for fuel refining. Three days later (28 February, package 3), in an effort to damage fuel exports, transactions with the Russian Central Bank were prohibited for all individuals and companies based in the EU. The next package of sanctions followed after another two weeks (15 March, package 4). It restricted new investments in the Russian energy sector, banned imports of Russian technology and energy services, and imposed trade restrictions on iron, steel, and luxury goods. Altogether, we expect these packages to provide meaningful information to energy market participants for short-run market transactions.
The announcements of sanctions were flanked by announcements about the then-new REPowerEU policy—a plan to speed up the clean energy transition and to improve EU member states’ energy security. This policy was initially proposed on 8 March 2022 (European Commission, 2022c). Afterwards, a more complete version of the plan, built on energy saving measures, increased renewables capacity, and reduced energy import dependence, was presented on 18 May 2022 (European Commission, 2022b). As part of wider policy adjustments under the REPowerEU umbrella, the European Commission eventually announced the enactment of emergency regulation on 18 October 2022 (European Commission, 2022a) to cap fossil fuel producers’ revenues, which was intended to limit excess profits and ease budgetary pressures for energy customers. Important for our assumption that the announcements provide new information to markets, we found no evidence that the timing or contents of Commission announcements were leaked to the media or news stations prior to their official release.
Our analysis leverages the occurrence of these six events, which we expect to shape market responses during times of geopolitical and macroeconomic instability in 2022, peaking in February 2022, right after the invasion.
5. Research design
We use a stock market event study design to test our expectations about the effects of European Commission announcements on energy markets. Our empirical analysis examines stock market returns for EU energy firms on the day of each of the six announcements identified above. We first present the sample and data, to then discuss the estimation approach and results.
5.1. Sample and stock market returns data
We collect data on stock market returns for 66 fossil fuel and 49 renewable energy producers, which are either headquartered in Europe or primarily traded at a European stock exchange. We list these firms, their headquarters country, primary exchange, and industry in appendix tables A.1–A.4. Companies are classified as fossil fuel or renewable energy firms based on six-digit North American Industry Classification System (NAICS) codes. We code a company as a fossil fuel energy producer when its core activities are fossil fuel electric power generation; petroleum refining; natural gas or crude petroleum extraction; natural gas distribution; or underground, surface, bituminous coal, or lignite mining. Companies that operate as electric power generators from biomass, geothermal, hydroelectric, solar, wind, or other renewable sources are classified as renewable energy producers. Our assignment process correctly identifies the largest European and non-European publicly traded fossil fuel companies—such as Aramco, BP, Chevron, Eni, Equinor, ExxonMobil, Marathon Petroleum, Phillips 66, Shell PLC, TotalEnergies, and Valero—as fossil fuel producers, while major renewables firms—e.g., NextEra, Jinko, and Brookfield Renewable—are correctly classified as well.
Categorizing firms based on industry codes might misclassify fossil fuel producers that have started diversifying their assets towards renewables, partly because of climate policies, partly for fear of stranded assets. Even though such diversification has been slow, at least for major fossil fuel producers (Green et al., Reference Green, Hadden, Hale and Mahdavi2022), we check our classification against other work that uses Carbon Underground 200 and Clean 200 company lists to group energy firms into fossil fuel and renewable producers (Voeten, Reference Voeten2024), without a change in results.Footnote 11
Another potential threat to our classification arises from a relatively large number of renewable energy firms belonging to the “residual” NAICS code of “Other electric power generation.” These firms are not primarily fossil fuel, nuclear, hydroelectric, wind, solar, or geothermal operators. Examples of firms in this category include tidal power generators or firms holding a diversified set of renewable assets. Both types of firms would be affected by industrial policy announcements that increase investor confidence in renewables.
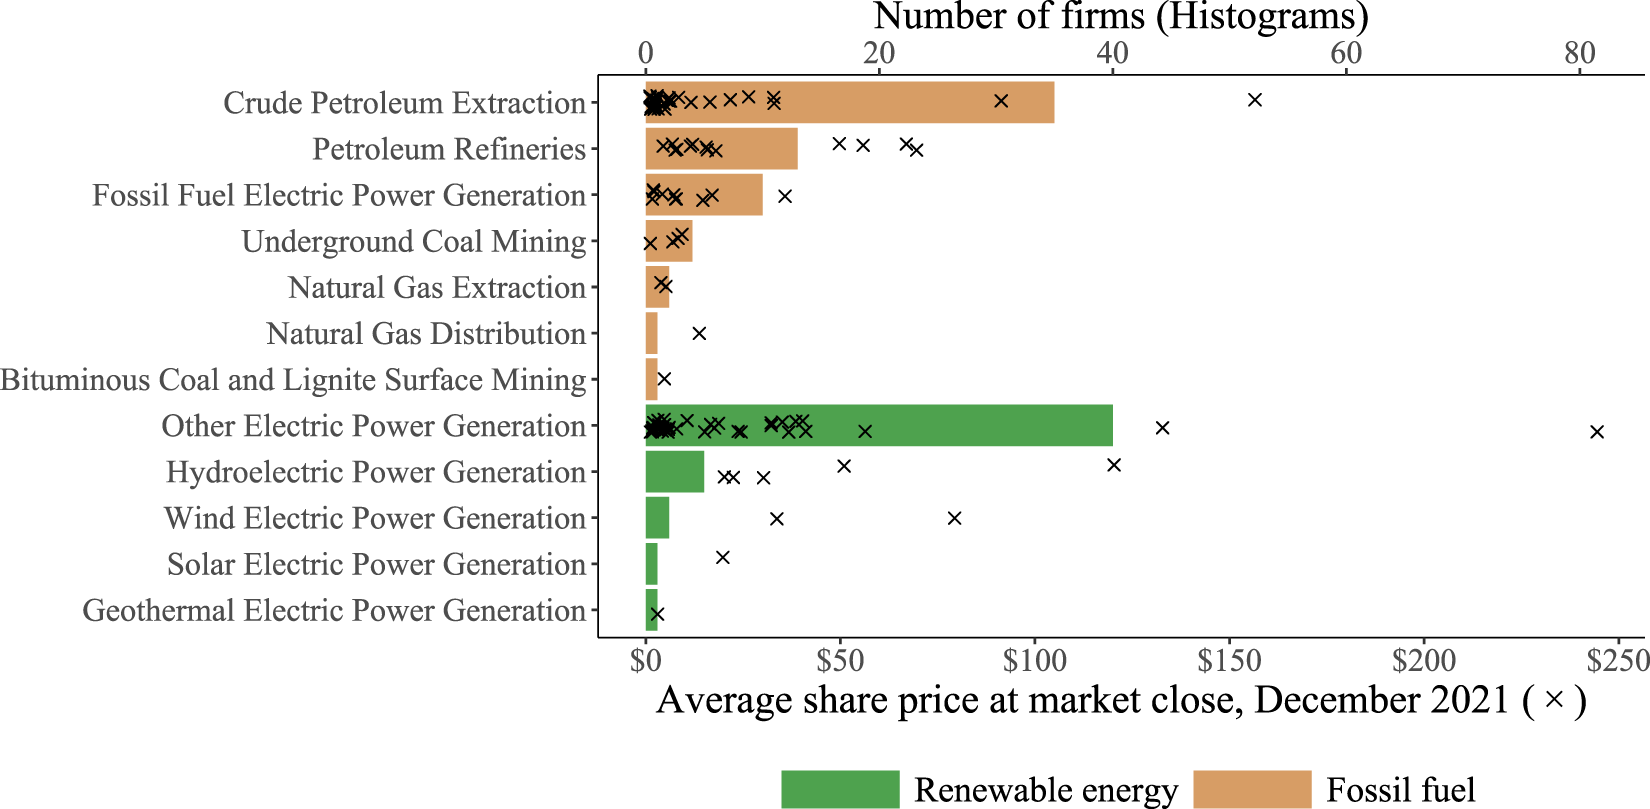
Figure 2 provides a breakdown of European firms in our data by sector. Histograms show the number of companies in each sector and crosses indicate companies’ average monthly share price in December 2021. Across fossil fuel (brown) and renewable (green) producers, the two groups are rather well balanced in terms of the total number of firms and the share price distribution.
Descriptive information for European fossil fuel and renewable energy firms in our sample. Histograms report the number of firms by NAICS sector code (top  $x$-axis) and crosses show the average firm market price in December 2021 (bottom $x$-axis).

For each company, we measure stock returns: the percentage change in stock market closing prices between two consecutive trading days. Since, for any level of supply, increases in returns are driven by greater demand, positive returns correspond to higher profitability of holding these stocks, and vice versa. Changes in market valuations, therefore, capture the distributional effects of political announcements in the form of companies’ stock market performance.
5.2. Event study design
We use an event study design (MacKinlay, Reference MacKinlay1997) to estimate the effect of EU announcements on profit expectations for fossil fuel and renewable energy stocks. According to the market efficiency hypothesis, market prices perfectly reflect all the information that is available to investors at any point in time. New price-relevant information, hence, leads investors to update expectations about the profitability of the stocks they hold, causing prices (and returns) to rise or fall. We follow recent political science research (Pelc, Reference Pelc2013; Kucik and Pelc, Reference Kucik and Pelc2016; Wilf, Reference Wilf2016; Aklin, Reference Aklin2018; Genovese, Reference Genovese2019) and use the methodology to assess the distributional effects of public statements by the European Commission in times of crisis on stock market returns.
At its core, an event study design aims at retrieving a firm-level counterfactual measure of returns. Each firm’s observed end-of-day stock market return on an announcement day is compared to such a counterfactual. This daily firm-level difference, which is called abnormal returns, is our dependent variable. For each firm, it captures whether realized market returns over- or underperformed those returns that could be expected in the absence of the announcement.
A key challenge for any event study design is how to estimate counterfactual stock market returns on the announcement day for each “target firm” of interest, whose market performance is presumably affected by new information. The simplest approach to address this problem is to use linear regression to model the relationship between stock market returns of the target firm as a function of a market-wide index of large firms over a predefined set of days before the announcement. Depending on the length of the estimation window, this approach uses co-variation over time between the daily, pre-announcement returns (most commonly for periods of 30-60 days) of a target firm and the market index to predict a target firm’s counterfactual return on the announcement day.
The quality of this out-of-sample prediction is, however, often poor because the market index averages returns over hundreds of companies and therefore, by design, cannot fit the market performance of each individual target firm well. Following Wilf (Reference Wilf2016), we use a variable selection Lasso estimator to “custom build” a counterfactual for each target firm. Unlike the standard approach using the aggregate market index as a single main regressor, the Lasso models the returns of a target firm from the full set of all individual firms listed in the market index. This allows estimating counterfactuals more flexibly so as to ensure better model fit and more precise out-of-sample predictions.Footnote 12
We favor using (US-traded) S&P 500 firms as the “donor pool” for modeling counterfactual estimates over European companies because, in globally integrated markets, US-traded firms are subject to broader economic trends and simultaneous events in the same way as European firms are, but they are less directly impacted by EU policies. As our inferential target is to estimate the distributional effects of EU policy announcements, S&P 500 firms provide us with a cleaner baseline to construct counterfactuals.Footnote 13
We estimate average abnormal returns for European fossil fuel and renewable energy firms as the difference between observed market returns and S&P 500 Lasso-weighted counterfactual returns for each individual target firm, averaged over the respective group of fossil fuel and renewable energy producers. We calculate this quantity for each of the six announcement dates mentioned above and use simple  $t$-tests to assess whether Commission announcements had statistically significant effects on market performance (Hypothesis 1). Difference-in-means tests help us evaluate the distributional nature of the announcements by producer type (Hypothesis 2).
Because counterfactuals for each announcement are obtained from a moving window of 60 days immediately preceding the announcement, estimates represent the marginal effect that new information contained in the sanctions and REPowerEU packages has on market returns. Since the announcements happened in quick succession, estimates for later events are, by design, net of effects that earlier events had on market expectations.
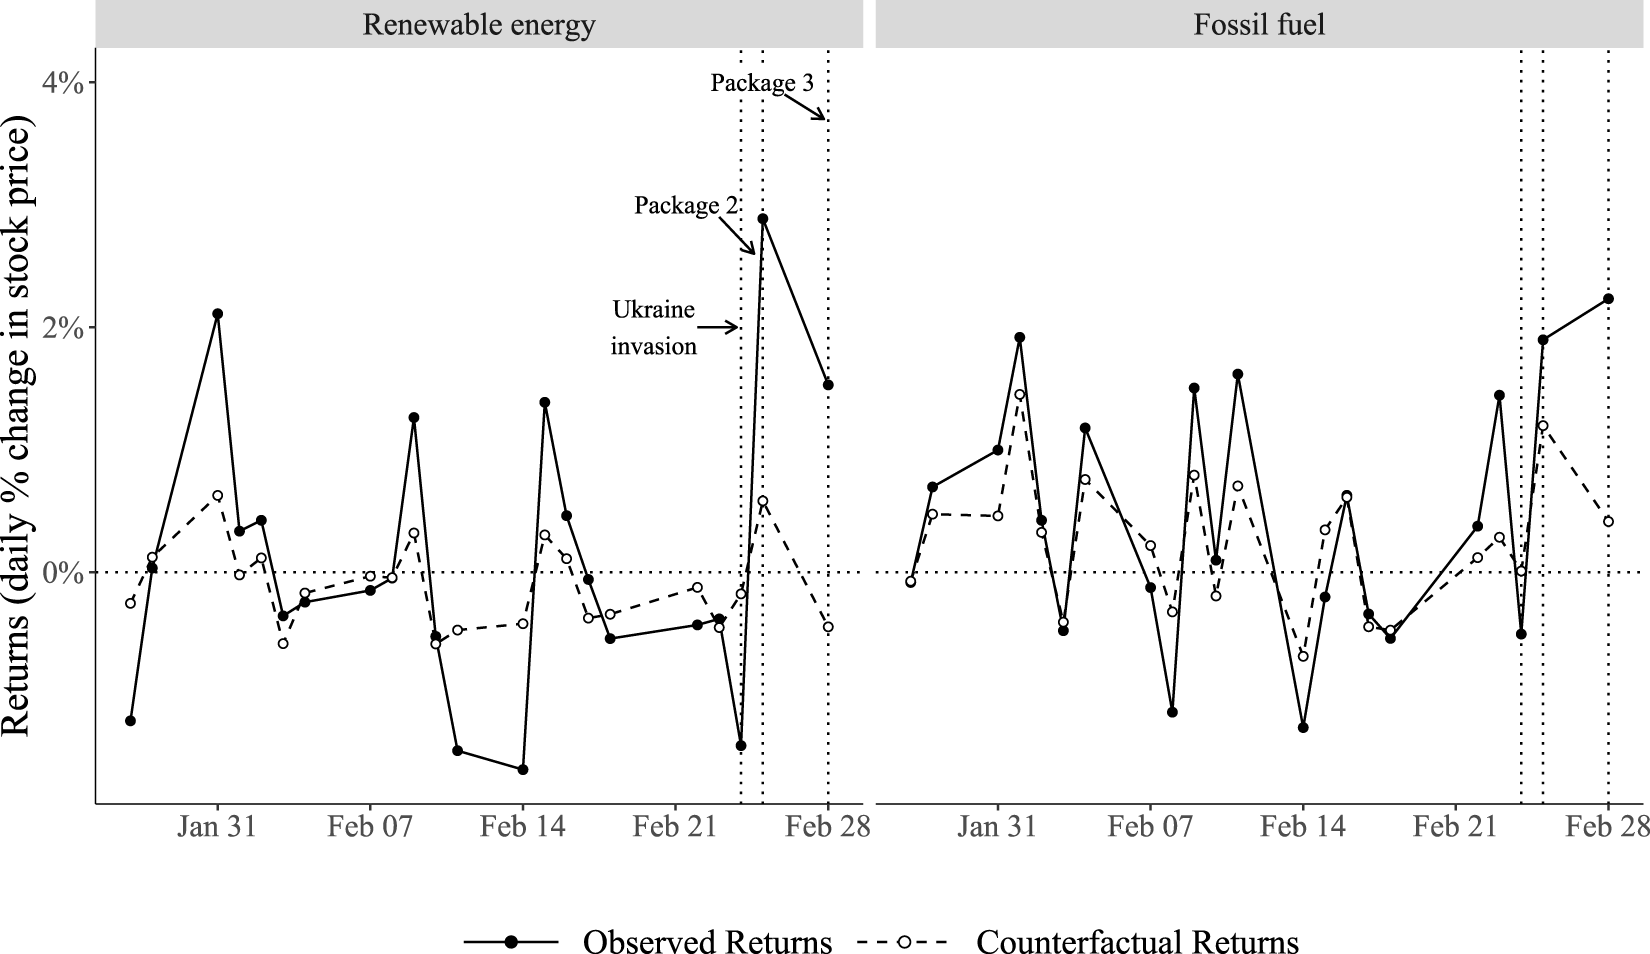
Figure 3 exemplifies this logic by showing average observed and counterfactual returns for sanction packages 2 and 3, which shortly followed the invasion of Ukraine in February 2022. When estimating average abnormal returns for sanction package 3, which was announced on 28 February 2022, our estimation window includes the 60 days before and right up to 27 February 2022, as the day before the announcement, so it includes the announcement date of sanction package 2. This ensures that any market-relevant information related to package 2 gets built into the counterfactual estimate. The estimate of package 3, therefore, captures effects on market returns due to any additional information that this package provides to markets over and above all information from any prior announcements, such as sanction package 2, and the invasion of Ukraine as the primary event itself. For the same reason, estimates for package 2 are obtained net of the effect of the outbreak of the Ukraine invasion; they isolate the effect of the European Commission’s policy response on markets from the effects of the war.
Average observed and counterfactual returns for fossil fuel and renewable energy firms during the week after the start of the war in Ukraine. The figure shows the average observed and counterfactual returns estimated by Lasso market models for energy companies based or traded in Europe on the days immediately preceding and following the Ukraine invasion and sanction packages 2 and 3, separately for renewable energy (left) and fossil fuel producers (right).

6. Results
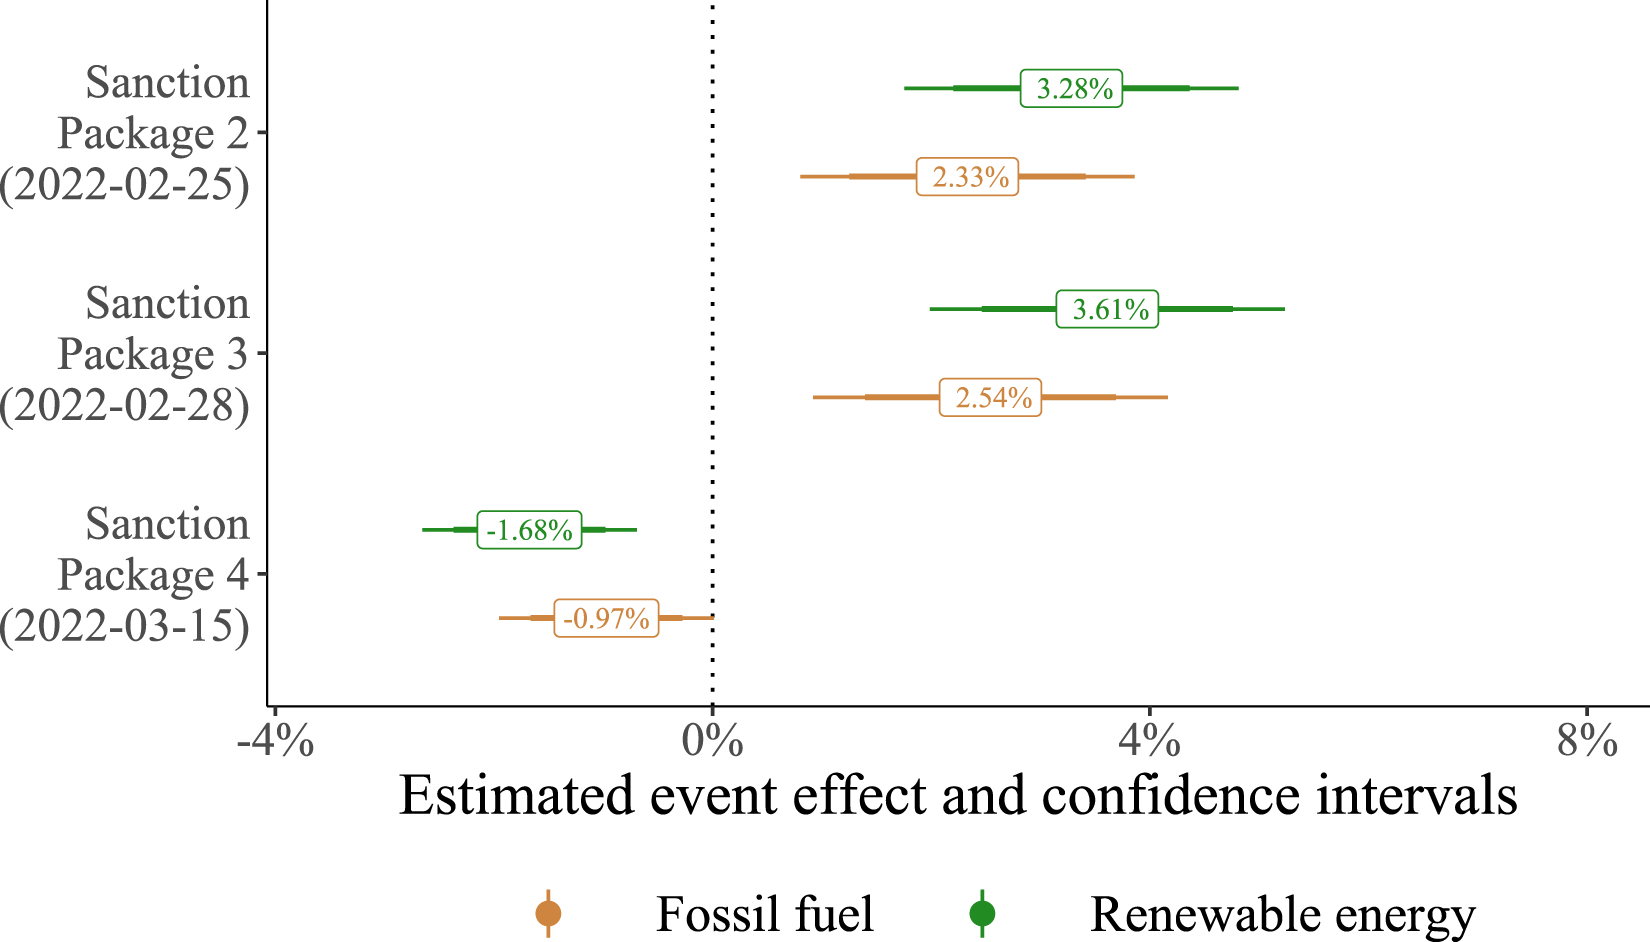
We first present the results for the announcements of European Commission sanction packages. In Figure 4, we show the estimated average abnormal returns for European energy companies, distinguishing fossil fuel producers (brown) and renewable energy producers (green) for each of the relevant events, organized along the  $y$-axis. We display 95% confidence intervals for adjudicating whether point estimates are statistically distinguishable from zero at a 0.05 level of significance (Hypothesis 1). For testing whether point estimates for brown and green firms are statistically distinguishable from each other at the 0.05 level of significance (Hypothesis 2), we also report 83.4% confidence intervals.
Average abnormal returns for European fossil fuel and renewable energy firms for sanction packages. The figure shows the estimated average abnormal returns for energy companies based or traded in Europe on the day that a given sanction package was announced, separately for fossil fuel (brown) and renewable energy producers (green). Horizontal bars denote 95% and 83.4% confidence intervals: the former shows the difference between a point estimate and the 0 value, while the latter tests whether the point estimates for brown and green energy producers are statistically significantly different from each other at a 0.05 level of significance.

Consistent with our first set of expectations, the early sanction package announcements by the European Commission (second and third packages) moved market prices of European energy firms significantly and positively, but to a similar degree across brown and green producers. EU sanctions against Russia, which targeted Russian energy links with the EU but did not directly reward decarbonization, increased investors’ confidence in all energy producers indistinctly without any indication of distributional effects. Point estimates across brown and green firms are remarkably comparable and statistically indistinguishable, as evidenced by the overlap of the 83.4% confidence intervals.
The second and third sanction packages, which followed within a week of the invasion, triggered positive responses among fossil fuel energy investors, generating returns to these firms that were 2.33%–2.54% above market expectations. Likewise, renewable energy firms experienced returns that were 3.28%–3.61% above those from their market baselines on these days. Effects are negative for both fossil fuel and renewable energy firms for the fourth package. The negative sign is possibly related to the fact that this package hit technology and energy services, hurting primarily the supply side of energy markets. In combination, we find that, while investors clearly reacted to the announcements of the sanctions by taking interventions as relevant and credible signals in the short term, this evaluation did not discriminate between fossil fuel and green assets, hence not contributing to a green transition scenario where fossil fuel-intensive energy production is punished at the expense of clean energy.
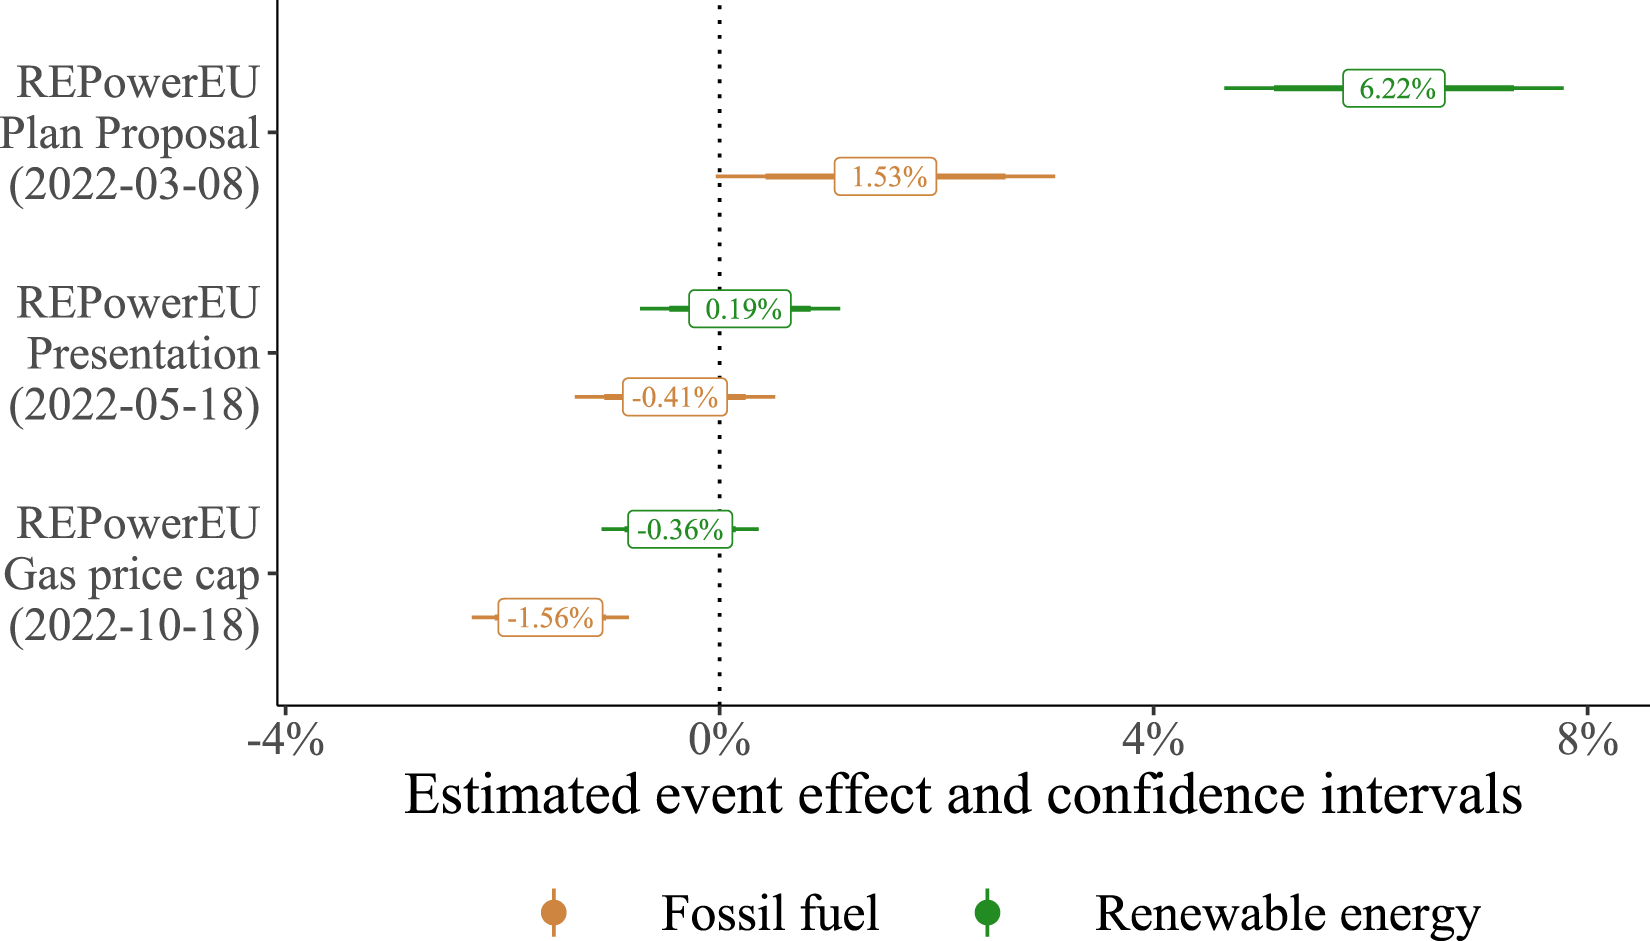
We now move to the distributional part of our expectations, which focuses on the more unambiguously green policy announcements after the Russian attack. Here, we perform the same analysis as above with respect to REPowerEU milestones. The main results are displayed in Figure 5. We find that the REPowerEU Proposal in early March generated a significantly positive response among investors. Consistent with our argument, we observe the distributional nature of EU interventionist announcements that set up a path toward energy transition that was uncharted by previous information. The plan proposal, indeed, strongly (and statistically significantly) separates “winning,” green companies from “losing,” brown companies based on the expectation that carbon-intensive business models are incompatible with ambitious climate action. For the Plan Presentation in May 2022, the estimated effects are much smaller, and we do not find statistically significant results. This is the case because the Plan Presentation was largely a confirmation of the March proposal and therefore did not provide markets with new information that had not already been internalized. The substantively much smaller, yet statistically significant effects for the announcement of the REPowerEU gas price cap are consistent with the same logic. New and somewhat unexpected information—relative to what markets already knew from previous REPowerEU announcements—that affected fossil fuel producers in a uniquely differential way translated into downward pressure on market prices for this producer type.
Average abnormal returns for European fossil fuel and renewable energy firms for RePowerEU milestones. The figure shows the estimated average abnormal returns for energy companies based or traded in Europe on the day that a given REPowerEU milestone was announced, separately for fossil fuel (brown) and renewable energy producers (green). Horizontal bars denote 95% and 83.4% confidence intervals: the former shows the difference between a point estimate and the 0 value, while the latter tests whether the point estimates for brown and green energy producers are statistically significantly different from each other at a 0.05 level of significance.

Among all events we consider, the REPowerEU plan proposal in March 2022 is the one with the largest effect on energy producers’ returns. The effect size is remarkable: the Plan significantly boosted investors’ profit expectations for European renewable energy producers, resulting in average returns of more than 6% above market expectations. European fossil fuel producers, on the other hand, saw market returns increase much less (about 1.5%). We attribute this positive, albeit smaller, effect in response to a pointedly green policy proposal to the realization that fossil fuel energy production will undoubtedly be needed to satisfy European consumers’ demand in the absence of Russian supply, even if only in the short term and as a “transition fuel.” In an effort to delineate the scope conditions of our distributional logic, in other results in Appendix D.2 we show that, despite strong effects for European producers, the same announcement had much smaller effects for companies outside Europe. This offers compelling evidence that market participants reliably separate between the material consequences of Commission announcements for European and non-European firms. Given the focus of the REPowerEU program on infrastructure investment and green industrial policy in EU member states, most of the policy benefits will accrue to European-based companies or those linked to the bloc’s Internal Energy Market.
It is noteworthy that announcements that were made five to six weeks after the invasion had overall much weaker effects, no matter the type. Neither the fourth sanction package nor the formal presentation of the REPowerEU policy moved European energy stock markets much. The Gas Price Cap restricted windfall profits for fossil fuel producers by limiting maximum chargeable prices to gas customers, putting downward pressure on market valuations for fossil fuel producers in particular. These weaker effects can be explained by recalling the implication of the market efficiency hypothesis: estimates represent the marginal effect of price-relevant information supplied by an announcement, net of the information markets had already gathered and absorbed into a stock price. Null effects for later events imply these announcements did not provide sufficiently new, price-relevant information on the EU’s net zero strategy beyond what was already known. In other words, markets had no reason to update stock prices.
Altogether, this evidence suggests that the European Commission’s timely and unambiguous promises to intervene in the economy in 2022 moved financial capital in energy markets. However, for the purposes of the energy transition, the only signals that gave momentum to green markets and created distributional effects were Green Deal announcements. Instead, more indirect, yet still energy-relevant signals did not have the same consequences. Furthermore, the results indicate that the Commission, moving at the peak of historical uncertainty, i.e., right after the Russian attack, maximized the impact of these announcements.
6.1. Additional results and robustness
Our main results capture abnormal returns on the day of the announcement itself. In the Appendix (Figure B.1), we show how abnormal returns accumulate over a symmetric time window of ten days before and after each event for European companies.Footnote 14 For sanction packages, we find strong effects across the board, yet cumulative abnormal returns are largest for fossil fuel producers. As with the main analysis, REPowerEU-related announcements separate brown and green energy companies strongly, yet only for the initial announcement. The evidence from cumulative abnormal returns thus suggests that, rather than an opportunity to fast-track the energy transition, investors understood sanction packages more as opportunities for fossil fuel energy producers to cash in on massive windfall profits from making up the shortfall of Russian supply contraction. Instead, when communication was directly targeted at credibly raising the bloc’s decarbonization ambition through the REPowerEU package, this did result in considerable capital reallocation toward renewables. Commission announcements can hence credibly steer investment flows away from fossil fuels, but practically only in the short term and for companies that can directly benefit from green investments.
Other extensive robustness tests are presented in Appendix D. First, we show that we obtain similar results when using a sample of major European publicly traded firms as a baseline to generate counterfactual returns for European energy companies. Next, we probe our procedure for defining an energy firm as a European producer. We show that we find similar effects when we look exclusively at firms that are European-based, European-traded, or otherwise just based or traded in an EU member state. Then, we change our classification of green/brown firms by discarding four firms that are coded as having fossil fuel assets by Voeten (Reference Voeten2024) from our renewable energy sample. We continue by querying the validity of our market counterfactuals. We find similar or stronger results when considering only firms whose counterfactual is estimated with sufficient precision—that is, with R $^2$ values above 0.10, 0.30, and 0.50. Results are robust to using standard ordinary least squares (OLS) regressions instead of Lasso, shorter (30 days) or longer estimation windows (180 days), or using raw returns.Footnote 15
7. Conclusion
This paper studies the pressing political economy question of when and how stock markets respond to policy announcements in the context of the new European turn toward greater financial market interventionism. This is an important area of research because volatile geopolitical conditions are increasingly incentivizing economic institutions to intervene in domestic markets. Furthermore, studying the behavior of markets in this new era is important given the financial sector’s critical role in moving capital for important macroeconomic projects such as the energy transition.
The paper claims that, especially in times when markets seek stability the most, institutional interventions can serve as credible signals to shape capital (re)allocation decisions in stock markets. We investigate such conditions by zooming in on interventions by the European Commission into energy markets wrestling with the climate transition. We argue that EU Commission announcements at the beginning of the Russo-Ukrainian war triggered distributional effects from aligning market incentives with the decarbonization challenge. In the immediate aftermath of the Russian attack, when European markets faced heightened policy uncertainty, we expect that Commission announcements should have made stocks move, and climate-targeted announcements in particular should have rewarded green energy stocks. At the same time, we maintain that sustaining credible interventionist signals in the long run requires consistent political effort to provide qualitatively new information to markets that the Commission may not realistically be able to supply. We thus expect announcement effects to be short-lived.
Focusing on a series of EU announcements in 2022 following the Russian aggression against Ukraine, we find that announced policy interventions that directly articulated the EU’s decarbonization ambition substantially increased green but not brown European energy assets' valuation. More generic energy-related sanction packages, on the other hand, boosted market valuations across the board without separation between fossil fuel and renewable energy producers. We take this as evidence that the EU sanctions were perceived as fuzzier signals that are only partially linked to the energy transition. Accordingly, sanctions that are not directly tied to the inherently distributional politics of the energy transition cannot quite sustain the efforts of weaning Europe off energy generation from fossil fuels.
In sum, we find that, while some of the EU announcements initially changed market expectations, this trend was short-lived and reverted quickly once policy details were more comprehensively absorbed by market actors. At the same time, the efficacy of the announcements in the short run indicates that, at least under some conditions, ambitious EU climate actions were successfully recognized as key elements of the green transition trajectory. We believe it was the inability of EU policy announcements to provide markets, over an extended period of time, with reliably high levels of new information, which limited the announcements’ original policy momentum to largely spring 2022.
Our findings raise important questions for scholarship on the politics of climate change and political economy research on government-firm interaction in times of crisis. Time-inconsistent preferences resulting from the temporal mismatch between election cycles and investment horizons for energy infrastructure are a major challenge for the global energy transition. Political announcements of long-term decarbonization goals as part of larger green industrial policy programs, such as the Inflation Reduction Act in the United States or the Green New Deal in the EU, help quell uncertainty and signpost the overall “direction of travel.” If these signals were taken on board by markets, slow and incremental divestment away from fossil fuel producers to greener competitors would follow, helping break down opposition by the incumbent carbon-intensive industry. Our paper builds on this intuition and finds empirical evidence in support of it, but currently remains silent on the exact mechanisms that map out how different types of political announcements translate into investors’ beliefs and investment decisions as a function of the announcements’ expected distributional effects on different types of firms.
Furthermore, the findings are relevant to the credibility of EU policies in a polycrisis world. In light of far-reaching debates about the effectiveness of institutions in the European politics literature, our findings suggest that EU pillars can generate important waves in financial markets if they leverage their interventionist power at the right time. As climate action remains a fundamental driver of EU internal and foreign policy, our paper suggests that leveraging opportunities to pass resolutions and pick winners and losers of the energy transition is fundamentally important for responding to the climate emergency.
Supplementary material
The supplementary material for this article can be found at https://doi.org/10.1017/psrm.2025.10054 Replication materials are available through Harvard Dataverse: https://doi.org/10.7910/DVN/GJSW9U.
Acknowledgements
Previous versions of this paper were presented at the APSA 2023 meeting, the 2023 Hertie Political Economy Lunch Seminar, a University of Bergen workshop, the 2024 Nuffield PPRNet meeting, a St Antony’s European Studies Center seminar, a Bocconi-EIEE workshop, and EPSA 2024. We thank Elin Boasson, Jane Gingrich, Tom Hale, Mark Hallerberg, Kathryn Harrison, Jens van’t Klooster, Matto Mildenberger, Michael Ross, Lucas Schramm, Christina Toenshoff, and Egon Tripodi for useful feedback.
Competing interests
The authors declare none.
Funding declaration
The author did not receive grant funding, either external or internal, for this project.






 Open access

