


1. Introduction
Against the backdrop of tariff impositionsFootnote 1 enacted in June 2018 by the Trump administration targeting Chinese imports, China responded with a series of retaliatory measures affecting a broad spectrum of US exports. These included tariffs ranging from 2.5% to 25% and marked the onset of an escalating trade dispute. Rooted in concerns over the ballooning trade deficit with China and the erosion of manufacturing jobs, the United States pursued a strategy of trade protectionism via unilateral tariff impositions to fortify its domestic economy. Given China’s sizable role as one of the largest markets for United States agricultural exports and the largest market for US soybeans, commodities such as soybeans and pork bore significant retaliatory impacts from these retaliatory tariffs (Adjemian et al., Reference Adjemian, Smith and He2021). Moreover, other nations responded to US tariffs on steel and aluminum imports by imposing reciprocal policies, collectively targeting approximately $450 billion worth of trade (Fajgelbaum et al., Reference Fajgelbaum, Goldberg, Kennedy, Khandelwal and Taglioni2024), with soybean exports notably taking a severe hit.
A study by Grant et al. (Reference Grant, Arita, Emlinger, Johansson and Xie2021) offers insights into the 2018/2019 trade conflict dynamics. The research studies bilateral trade relationships of agricultural products. Estimating a gravity model with monthly panel data spanning from January 2016 to December 2019 and honing in on the repercussions of retaliatory measures on US agricultural exports, the study incorporates specific fixed effects to account for variations in trade values. Findings underscore significant trade losses, primarily attributed to retaliatory actions by China, culminating in annualized direct losses ranging from $12.6 to $17.2 billion for US agriculture in Chinese markets (Grant et al., Reference Grant, Arita, Emlinger, Johansson and Xie2021). Notably, sectors like soybeans and pork products experienced more pronounced contractions, with soybean exports facing losses of approximately $10.7 billion per year and pork products suffering losses of around $777 million per year (Grant et al., Reference Grant, Arita, Emlinger, Johansson and Xie2021). In response to projected losses, the US Department of Agriculture, under the Market Facilitation Program, instituted payments in total of $8.5 billion to soybean producers in an attempt to compensate for expected losses incurred due to trade restrictions (Adjemian et al., Reference Adjemian, Smith and He2021). These findings underscore the challenges posed by retaliatory tariffs and highlight the pressing need for strategic policies to mitigate adverse effects on US agricultural exports.
A related comprehensive assessment conducted by the US Department of Agriculture (Morgan et al., Reference Morgan, Arita, Beckman, Ahsan, Russell, Jarrel and Kenner2022), following a similar gravity model econometric framework to Grant et al. (Reference Grant, Arita, Emlinger, Johansson and Xie2021), emphasized the significant toll inflicted by retaliatory tariffs and found higher estimated losses. Building upon the approach of Grant et al. (Reference Grant, Arita, Emlinger, Johansson and Xie2021), Morgan et al. (Reference Morgan, Arita, Beckman, Ahsan, Russell, Jarrel and Kenner2022) expanded the analysis by measuring the impact of export losses at the state level to ascertain any disproportionately large effects. The study unveiled a sizeable $27 billion reduction in US agricultural exports from mid-2018 to the end of 2019. Soybeans bore the brunt of the impact, accounting for approximately 71% of the decline, which amounted to $9.4 billion in annual losses. The disproportionate effect on soybeans resonated across states heavily reliant on soybean exports, such as Iowa, Illinois, and Kansas, where gross domestic product losses totaled $3.8 billion annually. Overall, the United States incurred a trade loss of nearly $27 billion with countries that imposed retaliatory tariffs due to these tariffs, highlighting the widespread yet commodity-concentrated nature of export losses.
In this study, we reassess the impact of China’s retaliatory tariffs, concentrating on soybean exports and applying machine learning (ML) methods. ML approaches are favorable for international trade studies since they are able to outperform traditional forecasting methods when the underlying time series may be heteroskedastic or have complex processes such as trend and seasonality, both frequently present in agricultural export data. The selection of soybean exports as our focal point is motivated by the proportionally large annual trade volume, associated value, and significant damage incurred. Acknowledging that the reduction in soybean exports to China had spillover effects with trade to other countries (Adjemian et al., Reference Adjemian, Smith and He2021), we also consider changes in soybean exports to the rest of the world. Further, to capture not only the change in trade volumes, we also explore changes to the value of soybean exports to capture price effects.
This research makes two significant contributions to the existing body of literature. First, this work provides monthly estimates of the impact of retaliatory tariffs on soybean trade in terms of volume and value. While recent pertinent research conducted by Grant et al. (Reference Grant, Arita, Emlinger, Johansson and Xie2021) and Morgan et al. (Reference Morgan, Arita, Beckman, Ahsan, Russell, Jarrel and Kenner2022) has delved into the response of US agricultural exports, including soybeans, to retaliatory tariffs, these studies have applied gravity models and suffer from their associated limitations. In effect, Grant et al. (Reference Grant, Arita, Emlinger, Johansson and Xie2021) and Morgan et al. (Reference Morgan, Arita, Beckman, Ahsan, Russell, Jarrel and Kenner2022) employ a gravity model with dummy variables to capture the post-retaliation period. While these dummy variables are valuable for gauging the impact and estimating changes in soybean exports affected by retaliatory tariffs, they do not directly capture trends and complex seasonal patterns within the data. As such, they may not fully account for underlying large seasonal fluctuations present in addition to marked changes in the overall yearly trends in the data. Notably, coefficient estimates from gravity models fail to provide consistent coefficient estimates in the face of heteroskedasticity (Kareem and Kareem, Reference Kareem and Kareem2014). Thus, it is plausible that the estimates produced might be underestimated, given the increasing trend observed in soybean exports to China. Others, such as Adjemian et al. (Reference Adjemian, Smith and He2021) and Sabala and Devadoss (Reference Sabala and Devadoss2019), offer different applied methodologies and loss estimates, as shown below; however, a notable gap persists as ranges for loss estimates remain substantially large and lack an enhanced approach that can address trend and seasonality. We utilize forecast models with ML techniques to address this limitation and provide improved estimates.
A second related contribution of this study is the utilization of ML techniques to address research questions in the arena of trade. Few studies exist on this topic, yet recent contributions highlight the growing interest and benefits of utilizing ML techniques given the nature of trade data (Gopinath et al., Reference Gopinath, Batarseh, Beckman, Kulkarni and Jeong2021; Sei et al., Reference Sei, Gopinath, Kulkarni and Batarseh2024). Critiques of ML approaches include concerns about the lack of large sample properties of estimators and the challenge of comparing results under multiple ML models or approaches (Athey and Imbens, Reference Athey and Imbens2019). Furthermore, shortcomings of ML methods might be overfitting, validation, and out-of-sample estimation compared to traditional econometric models used for forecasting (Athey and Imbens, Reference Athey and Imbens2019). Despite these challenges, ML methods are increasingly appealing to address research questions in agricultural trade (Gopinath et al., Reference Gopinath, Batarseh and Beckman2020). Compared to general equilibrium models or traditional econometric approaches, ML approaches may offer more comprehensive forecasts of trade volumes and values under various policies and scenarios, such as tariffs (Gopinath et al., Reference Gopinath, Batarseh, Beckman, Kulkarni and Jeong2021).
2. Related studies
2.1. Soybean trade and market background
Since 2001, with the introduction of the World Trade Organization, global soybean markets have experienced pronounced changes to traded volume as well as the rise of global export actors, including Brazil, Argentina, and the United States (Gale et al., 2019). Moreover, demand from China and other Asian countries gradually expanded with approximately 66% of all soybean trade in 2016/1027 marketing year being from Brazil and the United States to China (Gale et al., 2019). For the United States, top export markets during this time included countries in East Asia, Southeast Asia, and the European Union (Gale et al., 2019).
During the years preceding the 2018 trade conflict, many factors were at play that determined soybean supply, demand, and prices. In particular, US soybean production and acreage steadily grew until 2018, the same year as the trade conflict, with production levels reaching 4.43 billion bushels and 89.2 million planted acres (Bukowski and Swearingen, Reference Bukowski and Swearingen2023, Reference Bukowski and Swearingen2025). From 2013 through 2018, while production gradually increased, exports as a percentage of production have ranged from 44% to 50% (Bukowski and Ates, Reference Bukowski and Ates2023). Moreover, prices fluctuated considerably, with farm prices in 2012 and 2013 garnering prices of over $13.00/bushel but falling to $8.95/bushel in subsequent years. Before the trade war, while producers had experienced wide price swings, exports as a percentage of production remained relatively stable. Conversely, with only moderate gains in domestic use, ending stocks increased from 191 million bushels in 2014 to 438 million bushels in 2017 to 909 million bushels in 2018, the year when the trade conflict began (Kansas State University, 2024).
2.2. Impact of retaliatory tariffs
In 2018, the United States imposed a series of tariffs on steel and aluminum imports from key trading partners, including China, Canada, the European Union, India, Mexico, and Turkey, under Section 232 tariffs, and imposed additional tariffs on Chinese imports under Section 301 tariffs (Morgan et al., Reference Morgan, Arita, Beckman, Ahsan, Russell, Jarrel and Kenner2022; Sukar and Ahmed, Reference Sukar and Ahmed2019; York, Reference York2023). In response, these countries retaliated with import tariffs on US goods, escalating tariffs on globally traded goods (Morgan et al., Reference Morgan, Arita, Beckman, Ahsan, Russell, Jarrel and Kenner2022; Sukar and Ahmed, Reference Sukar and Ahmed2019; York, Reference York2023). Numerous studies have since examined the impacts of the trade conflict on various sectors, regions, and commodities.
Williams and Hammand (Reference Williams and Hammand2020) argued that the trade conflict and ensuing tariffs could negatively affect the US economy by increasing economic uncertainty, decreasing business investment, and hindering economic development. Williams and Hammand (Reference Williams and Hammand2020) also predicted that escalating US tariffs would lower both US and global gross domestic product. Retaliatory tariffs further exacerbated the potentially adverse effects on the US economy and specific sectors, including agriculture. In an early study, Flaaen and Pierce (2019) analyzed the domestic impacts of the trade war on US manufacturing, finding that the positive effects of tariffs were offset by higher costs from retaliatory tariffs, thereby leading to no net increase in manufacturing employment or output. Additionally, tariffs did not effectively protect US manufacturing in the short run, and domestic manufacturers may have lost competitiveness due to retaliatory tariffs.
The agricultural sector also faced significant challenges due to import tariffs imposed by trading partners. For example, Mexico imposed tariffs on cheese imports from the United States, resulting in estimated losses of $68 million in the first year, with additional indirect and induced effects (Ribera et al., Reference Ribera, Adcock and Mu2018). An event study framework by Carter and Steinback (Reference Carter and Steinback2020) investigated the short-run trade effects of retaliatory tariffs against US agricultural and food exports. The study found a substantial decline in US agricultural and food exports, with losses outweighing gains from increased trade with countries not imposing retaliatory tariffs on the United States of more than $14.4 billion. In general, countries that did not impose retaliatory tariffs reoriented their trade relationships, with South American and European countries benefiting the most from these adjustments. Compared to other commodities, US soybeans and meat products experienced significant redistribution effects. A study by Sabala and Devadoss (Reference Sabala and Devadoss2019) used computable general equilibrium modeling approaches to estimate US losses in soybean markets of $2.72 billion with reductions in producer surplus ($5.52 billion loss) overshadowing gains in consumer surplus ($2.8 billion gain).
Grant et al. (Reference Grant, Arita, Emlinger, Johansson and Xie2021), employing a monthly gravity model and utilizing panel data from January 2016 to December 2019, examined bilateral trade relationships, focusing on agricultural products. The paper integrates fixed effects to account for variations in trade policy. Findings reveal significant trade losses primarily attributed to retaliatory actions by China with, as previously mentioned, annualized direct losses ranging from $13.5 to $18.7 billion for US agriculture in Chinese markets alone. These findings highlight the challenges posed by retaliatory tariffs, emphasizing the need for strategic trade policies that mitigate adverse effects on US agriculture.
To further hone in on the impacts to specific states, Morgan et al. (Reference Morgan, Arita, Beckman, Ahsan, Russell, Jarrel and Kenner2022) use a comparable econometric framework to Grant et al. (Reference Grant, Arita, Emlinger, Johansson and Xie2021). They also find significant impacts of the retaliatory tariffs on US agricultural exports. They identified a $27 billion reduction in exports from mid-2018 to the end of 2019, with soybeans bearing the brunt of this decline, accounting for 71%. This sizable impact disproportionately affected states heavily reliant on soybean exports, such as Iowa, Illinois, and Kansas. According to Morgan et al. (Reference Morgan, Arita, Beckman, Ahsan, Russell, Jarrel and Kenner2022), in response to reductions in US imports, China increased agricultural imports from other countries, causing a redistribution of imports of nearly $16 billion with countries such as Brazil and the European Union.
This paper focuses on soybean exports to China, given the substantial impact this commodity faced as a result of the trade conflict. Notably, studies by Carter and Steinback (Reference Carter and Steinback2020), Grant et al. (Reference Grant, Arita, Emlinger, Johansson and Xie2021), and Morgan et al. (Reference Morgan, Arita, Beckman, Ahsan, Russell, Jarrel and Kenner2022) underscored this assertion. China’s imposition of retaliatory tariffs on US soybeans triggered a significant decline in exports. Given the strategic importance of soybeans in US agricultural trade, particularly with China being the largest importer of US soybeans, this paper aims to provide a nuanced understanding of the reduction of US soybean exports during this time.
2.3. Machine learning approaches to model international trade
Despite growing interest and promising applications of ML approaches in agricultural economics, there remain few published studies using this methodology (Coble et al., Reference Coble, Mishra, Ferrel and Griffin2018; Storm et al., Reference Storm, Baylis and Heckelei2020). A notable consideration of ML applications is that they exhibit distinct characteristics when handling either cross-sectional or time-series/spatially dynamic data (Storm et al., Reference Storm, Baylis and Heckelei2020). As mentioned previously, a common critique of ML approaches has been the lack of large sample properties of estimators or clear guidance on comparing results across multiple estimated ML models or approaches (Athey and Imbens, Reference Athey and Imbens2019). Applications of ML to gravity models in international trade have shown promising results, with ML techniques often providing a better fit and predictive accuracy compared to traditional models (Gopinath et al., Reference Gopinath, Batarseh and Beckman2020, Reference Gopinath, Batarseh, Beckman, Kulkarni and Jeong2021). Consequently, ML approaches may be more suitable for forecasting trade volumes under various policies and scenarios, such as tariffs, than general equilibrium models or traditional econometric approaches.
In the case of ML applications to trade, a recent study by Breinlich et al. (2022) highlights the challenges of overfitting and multicollinearity when estimating the effects of trade provisions and proposes novel data-driven methods, drawing from ML and variable selection literature, to address these issues. Jošić and Žmuk (Reference Jošić and Žmuk2022) employ ML algorithms to forecast Croatia’s international bilateral trade flows, presenting the efficacy of ML in predicting trade patterns and providing valuable insights for economic policymakers.
In a different vein, Baier and Regmi (Reference Baier and Regmi2023) explore the use of ML techniques to capture heterogeneity in free trade agreements, finding that more comprehensive agreements tend to result in larger estimated impacts on trade. Gupta and Kumar (Reference Gupta and Kumar2021) conduct a comprehensive literature review of ML applications in forecasting international trade patterns, emphasizing the increasing adoption of ML and deep learning techniques for economic forecasting. While traditional statistical approaches retain their importance, ML techniques are gaining prominence and often offer superior accuracy in economic forecasting tasks. This is especially poignant given that another drawback of gravity model approaches used in traditional econometric estimates has been considerable variation in mean estimates for trade (Cipollina and Salvatici, Reference Cipollina and Salvatici2010).
3. Data and modeling procedure
We use historical soybean export data from the US Department of Commerce Bureau of Trade (International Trade Data. U.S. Census Bureau. https://www.census.gov/foreign-trade/data/index.html) to quantify the changes in US soybean exports in terms of volume and value to China and all other regions as a result of retaliatory tariffs. We estimate traditional forecasting models as well as forecasting models that include ML methods to predict the expected value and the volume of soybeans exported without tariffs and then compare them to the actual exports. The data, empirical approach and models, and modeling procedure are described below.
3.1. Soybean exports
Time series data of monthly values of US soybean exports to China and to other regions from January 2010 to December 2021 (144 observations) were obtained from the Global Agricultural Trade System (https://apps.fas.usda.gov/gats/default.aspx). Figure 1 illustrates the value and volume of soybean exports to China and to the other regions over this period. As shown, China is by far the largest US agricultural soybean export market (Figure 1). Before the onset of the 2018 trade war, US soybean exports to China had shown rapid growth, outpacing growth in overall global exports (Tortajada and Zhang, Reference Tortajada and Zhang2022), at $1 billion in 2000 and reaching $14 billion in 2016. Notably, 61% of US soybeans were imported by China (Gale et al., 2019) in the year before the trade conflict began.
US soybean exports to China and other regions. Note: The dotted lines represent locally estimated scatterplot smoothing (LOESS) smoothers, which are used to visualize the underlying trends in the data. Source: Global Agricultural Trade System (GATS) (https://apps.fas.usda.gov/gats/default.aspx).
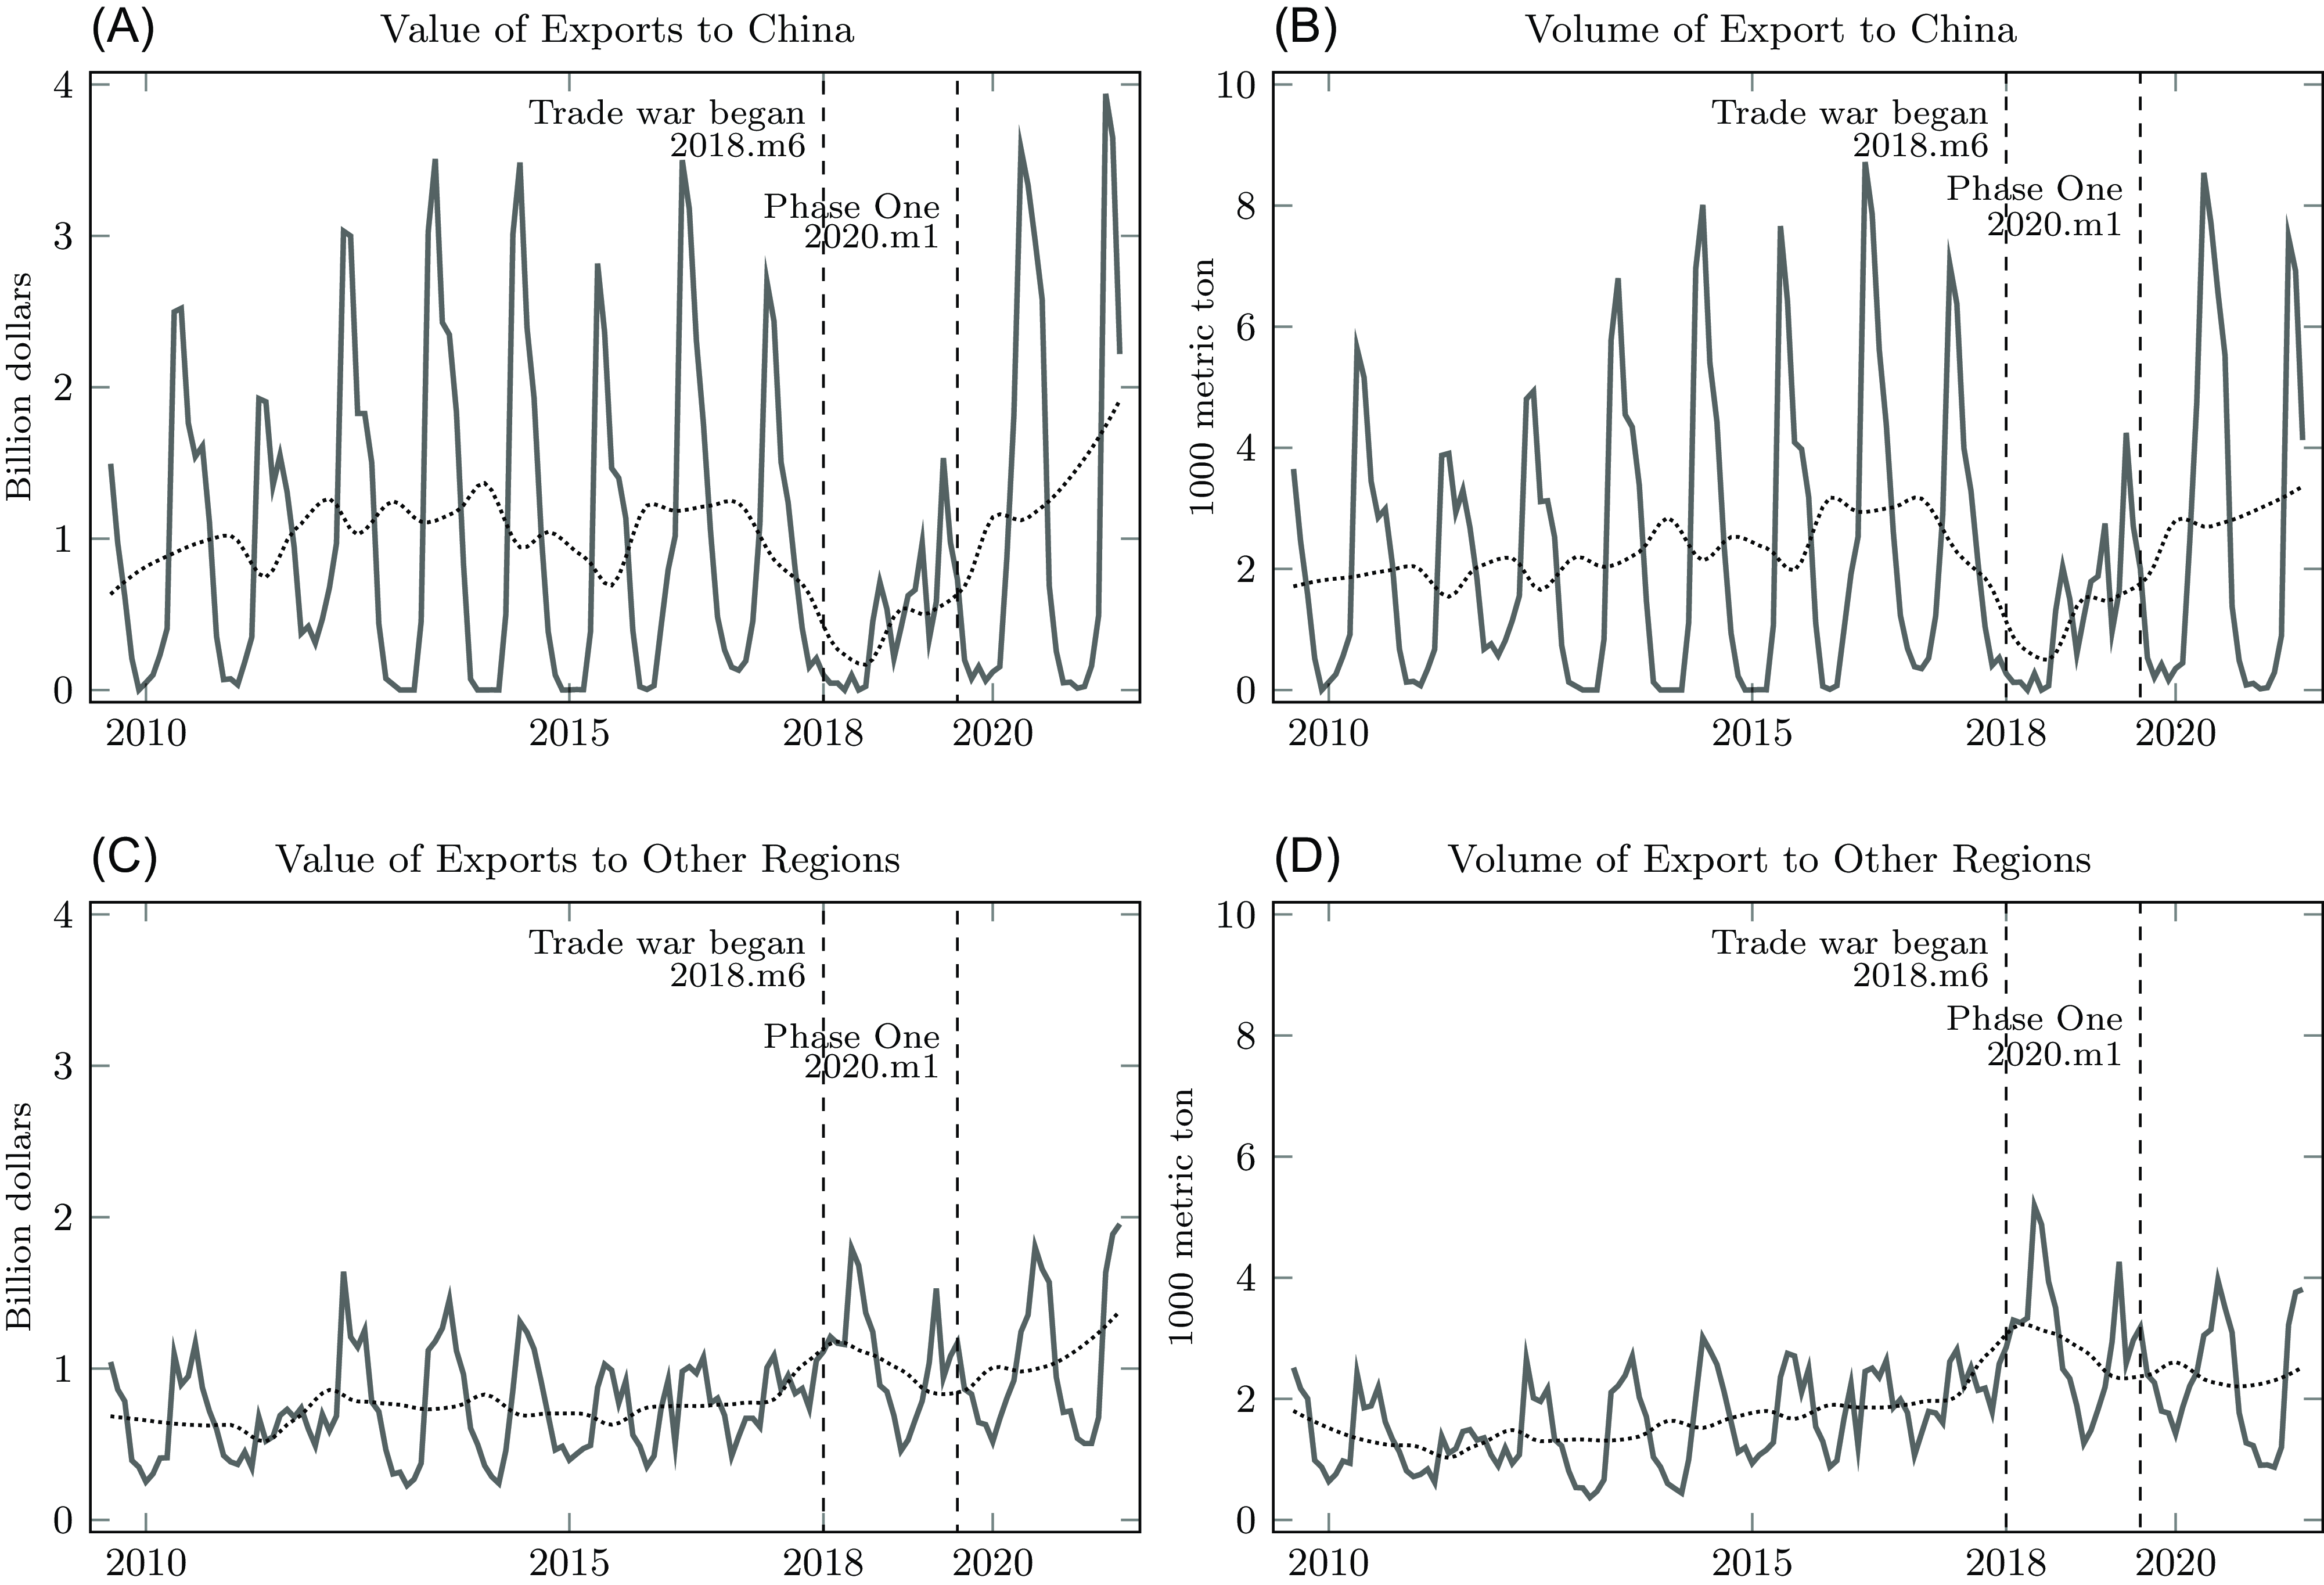
As trade tensions escalated into a full-scale trade war in 2018, the value and volume of US soybean exports to China plummeted (Figure 1). Export value to China fell sharply from $12.3 billion in 2017 to $3.1 billion in 2018. At the same time, international soybean trade markets were disrupted as China imported soybeans from Brazil to meet the shortfall in US soybeans while the United States sought to increase soybean exports to other markets (Gale et al., 2019). This can be seen in Figure 1, with steady seasonal patterns in value and volume of exports to other regions before the trade war and increased exports after the trade war began.
One notable trend in Figure 1 is the overall steady fluctuations in export value and volumes. Seasonal patterns are evident, with peaks and troughs in export levels throughout the year, reflecting harvest and timing of supply where higher export values and volumes are observed during harvest seasons, while lower volumes occur during off-harvest periods. A significant event marked in the data is the onset of the trade conflict between the United States and China in June 2018, indicated by the dotted vertical line. Following this event, some disruption appears in the trend of the value and volume of soybean exports to China, with fluctuations and possibly a slowdown in export growth. More specifically, there was a substantial reduction in the value and volume of US exports to China following the implementation of retaliatory tariffs, lasting at least until the end of 2019.
In January 2020, the United States and China reached an enforceable agreement known as the Phase One trade deal. This agreement entailed structural reforms and other changes to China’s economic and trade regime in various sectors, including intellectual property, technology transfer, agriculture, financial services, and currency and foreign exchange (Bown, Reference Bown2022; Tortajada and Zhang, Reference Tortajada and Zhang2022). Additionally, the Phase One trade agreement outlined China’s commitment to make substantial additional purchases of US goods and services over the coming years. One significant aspect of the agreement was the establishment of a robust dispute resolution system. As part of the deal, the United States agreed to modify its Section 301 tariff actions significantly. Consequently, soybean exports, which had been impacted by the trade tensions, appear to return to normal levels following the agreement (Tortajada and Zhang, Reference Tortajada and Zhang2022).
3.2. Modeling procedure
To forecast the value and volume of US soybean exports to China and other regions in the absence of retaliatory tariffs, we divided each of the 144 monthly observations into two groups. Group 1 included 102 observations (from January 2010 to June 2018Footnote 2), representing the pre-retaliatory tariff period. Group 2 consisted of the 42 monthly observations that occurred post-retaliatory tariffs (from July 2018 to December 2021). For the purposes of illustration, Figure 2 shows the forecasting approach using the value of soybean trade to China. The estimation process is repeated for soybean export volume to China, value of exports to other regions, and volume of exports to other regions. Group 1 includes the observations from the training and testing set, delineated up until the vertical dashed line, where the trade conflict began. Group 2 consists of the forecasted, delineated from the second vertical dashed line indicating the start of the trade conflict to the right.
Soybean export to China showing observations for training, testing, and forecasting.
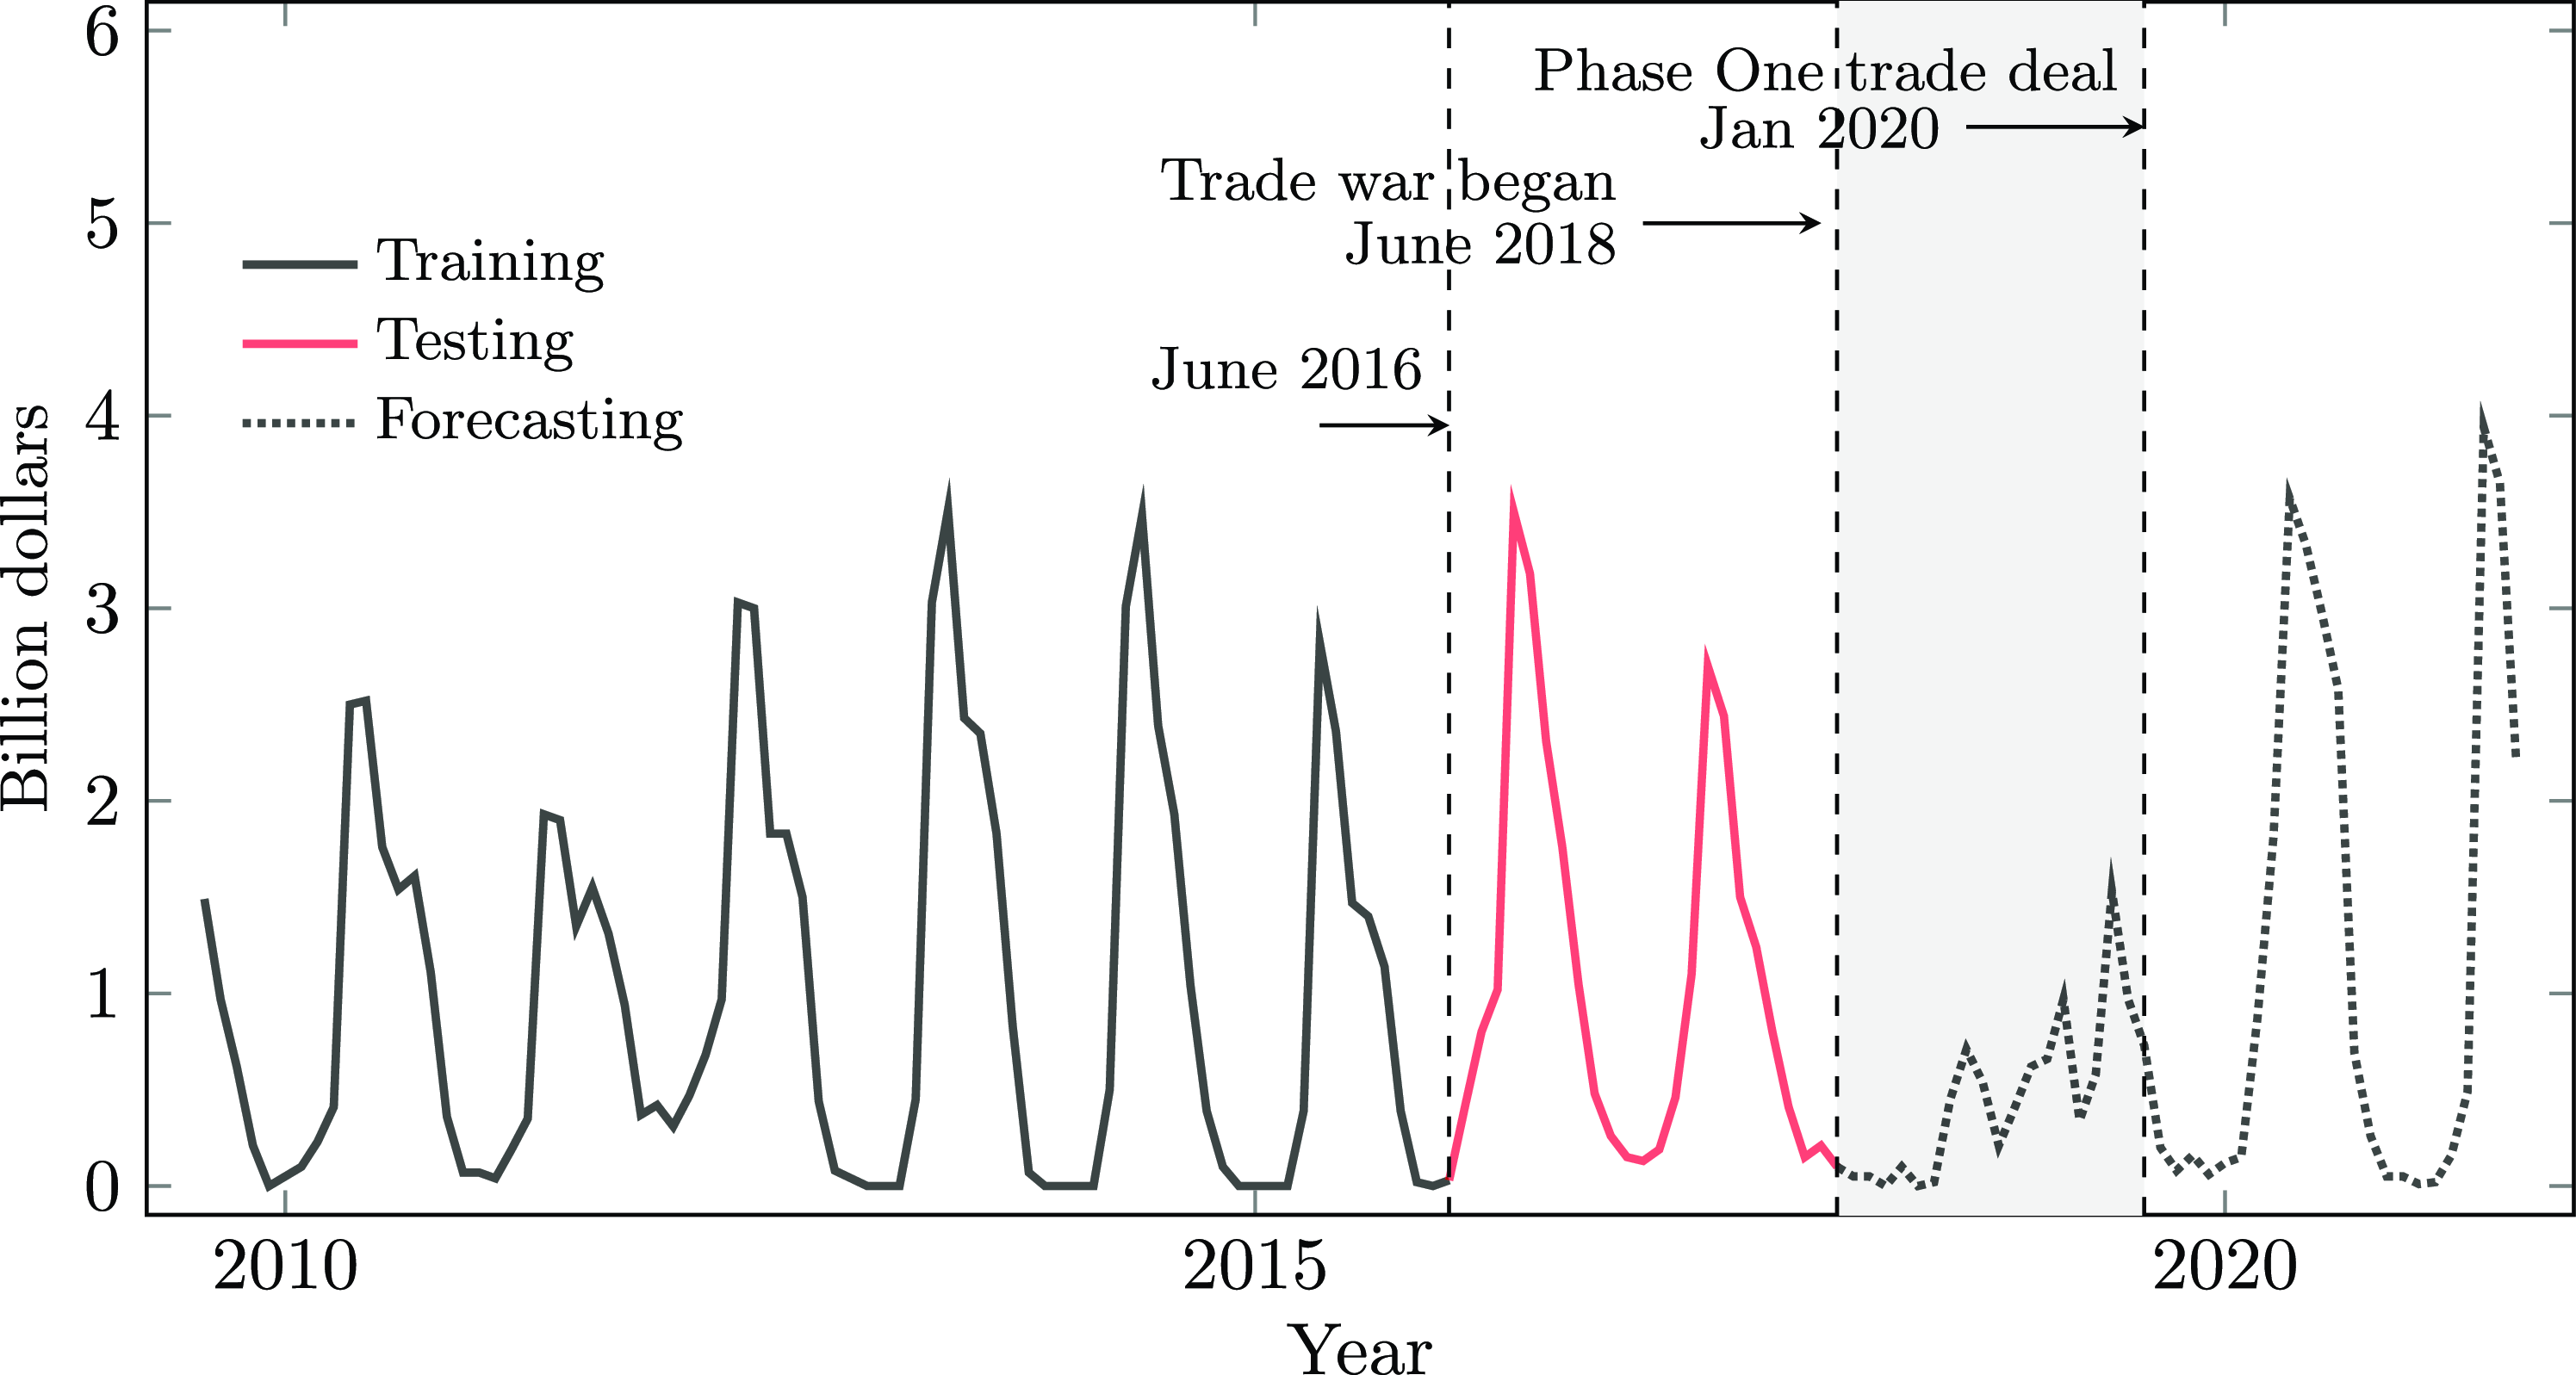
The data observations from Group 1 were further split into two subgroups. The first subgroup comprised data from January 2010 to June 2016, used to train (or estimate) the models and then used to forecast either the volume or value of soybeans exported to China or other regions from July 2016 and June 2018. This latter is named the testing period (red solid line in Figure 2). The difference between the actual and forecasted values from June 2016 to June 2018 is tested for each model so as to find the best forecasting model. After selecting the best model according to accuracy criteria, we re-estimated exports (volume and value) using observations until June 2018 and then forecasted the post-retaliatory tariff period (from July 2018 to December 2021). The difference between these forecasted values and the volume of exports and the actual value and volume of exports reflects the change in exports due to tariffs.
To summarize, the models are trained on data, and then forecasted values are predicted using a two-step process for validation and comparison (Ramasubramanian and Singh, Reference Ramasubramanian and Singh2018). In the first step, the training data from January 2010 to June 2016 is used to train the models. After the training stage, estimated models are used to predict the test set or subset of observation (forecasting July 2016 to June 2018). A model’s predictive abilities were evaluated using established methods to compare model fit by comparing the actual testing set data with the predicted data. In the second step, the data from Group 1 data (January 2010 to June 2018) were used to train the models a second time and then forecast forward (forecasting Group 2 from July 2018 to December 2021).
4. Empirical models
Six models were selected to forecast the volume and value of exports of US soybeans to China and other regions following the implementation of retaliatory tariffs. The purpose of using multiple models is to compare the forecasted value and volume of soybean exports to China and other regions (Figure 2) against the actual observed values. The six models used in this comparison were ARIMA, ARIMA XGBoost, Prophet, Prophet XGBoost, Elastic Net, and Error-Trend-Season (ETS). The different models were selected to ensure an unbiased preference in the prediction outcome and according to the range of loss estimates. The ARIMA model, a widely used time-series model, is commonly employed for forecasting purposes. The Prophet model is a nonlinear model that is appropriate for series with seasonality (Hyndman and Athanasopoulos, Reference Hyndman and Athanasopoulos2021). The Elastic Net model is categorized as a global/parametric predictor model (Mullainathan and Spiess, Reference Mullainathan and Spiess2017). The ETS model is another widely used time-series model that includes specific terms to capture the error, trend, and seasonality of the underlying data. The ARIMA and Prophet models do not require ML techniques, given that they follow a defined algorithm (fully described below). For these models, the procedure of Automatic Models was applied using the modeltime package (Dancho, Reference Dancho2023). These diverse models allow for a more robust, informed forecasting process including a comprehensive evaluation of their performance. All statistical analysis, forecasting, and use of the aforementioned packages was computed using R.
4.1. ARIMA
The ARIMA model stands for autoregressive integrated moving average and is commonly used for analyzing time-series data. If additional seasonal terms are included, the model is known as SARIMA, represented as SARIMA(p,d,q)(P,D,Q)s, where p and q refer to the orders of autoregressive and moving average components, d is the degree of differencing, and s refers to the number of periods in each season. The uppercase P, D, and Q refer to the autoregressive, differencing, and moving average terms for the seasonal part of the model. Discussion regarding SARIMA modeling closely follows the notations and conventions introduced by Lütkepohl and Krätzig (Reference Lütkepohl and Krätzig2004). The general form of the SARIMA model is given by:
 $${{\phi _s}({L^s})\phi (L)\Delta _s^d{\Delta ^d}{y_t} = {\theta _s}({L^s})\theta (L){\varepsilon _t}}$$
where ϕ(L) = 1 − ϕ 1L − ϕ 2L 2 − ⋯ − ϕ pL p, ϕ s(L s) = 1 − ϕ s1L s − ϕ s2L s2 − ⋯ − ϕ sPL sP, θ(L) = 1 + θ 1L + ⋯ + θ qL q, and θ s(L s) = 1 + θ s1L s + ⋯ θ sQL sQ where L indicates the lag operator. For instance, SARIMA(1,1,1)(1,0,1)[4] model is given by (1−ϕ 41L 4)(1−ϕ 1L)Δy t = (1+θ 41)(1+θ 1L)ε t or Δy t = ϕ 1Δy t − 1 + ϕ 41y t − 4 − ϕ 1ϕ 41Δy t − 5 + ε t + θ 1ε t − 1 + θ 41ε t − 4 + θ 1θ 41ε t − 5. Deterministic terms such as a constant or a trend may be added to equation (1).
We used the default “Auto ARIMA” function to forecast data in following the ARIMA model proposed by Hyndman and Khandakar (Reference Hyndman and Khandakar2008). The autoarima function utilizes unit root tests and minimizes information criteria such as AIC (Akaike information criterion), AICc (corrected Akaike criterion), or Bayesian information criterion to determine the best SARIMA model. The function searches for the most suitable model within the default constraints provided. These constraints include maximum values of P, D, and Q set at 2, 1, and 2, respectively.Footnote 3
4.2. Prophet
The second model utilized in this study was the Prophet model, as outlined by Taylor and Letham (Reference Taylor and Letham2018, Reference Taylor and Letham2022). Developed by Facebook’s Core Data Science team (Taylor and Letham, Reference Taylor and Letham2022), this time-series forecasting algorithm is particularly effective for handling seasonal data. The Prophet model decomposes time series into three main components: trend, seasonality, and holidays, represented as:
 $${{y_t} = g(t) + s(t) + h(t) + {\varepsilon _t}}$$
Here, g(t) describes a piecewise-linear trend, s(t) represents various seasonal patterns, h(t) captures holiday effects, and ε t denotes a white noise error term. To address seasonality, we allowed the model to toggle a seasonal component to model year-over-year patterns.
Following Taylor and Letham (Reference Taylor and Letham2018), the seasonal component of our model captures recurring patterns at fixed intervals, such as monthly or yearly cycles. To represent this component, we employed a Fourier series within the Prophet model:
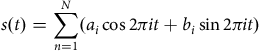 $${s(t) = \sum _{n = 1}^N({a_i}\cos 2\pi it + {b_i}\sin 2\pi it)}$$
Here, a i and b i denote the coefficients of the seasonal Fourier terms, and i represents the frequency of the seasonal component. By using the Fourier series, Prophet efficiently captures and models recurring patterns in time-series data, ensuring accurate forecasts even in the presence of complex seasonal behavior. Since our data is monthly, we opted to ignore the holiday effect in the model. Importantly, default parameters were applied in R for all other model components.
4.3. Elastic net
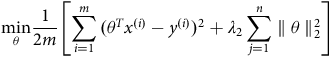
The third model employed in this study integrates ML techniques, utilizing a supervised learning algorithm to glean insights from the data and generate predictions (Athey and Imbens, Reference Athey and Imbens2019). Specifically, we employed Elastic Net, building upon the foundational work by (Firedman et al., Reference Firedman, Hastie and Tibshirani2010) and the extensions proposed by Xing et al. (Reference Xing, Li and Li2022). Elastic Net extends linear regression by incorporating regularization penalties into the loss function during training. By combining both Lasso (L1) and Ridge regression (L2) techniques, Elastic Net aims to prevent overfitting by controlling the amount of information used in the model. This approach ensures more robust and accurate predictions, particularly in scenarios involving high-dimensional datasets or multicollinearity among predictor variables. Lasso regression (Least Absolute Shrinkage and Selection Operator) adds a penalty term to the linear regression based on absolute values of regression coefficient to the loss function and aims at minimizing equation (4). It is helpful for identifying influential time-series components or predictor variables in forecasting tasks.
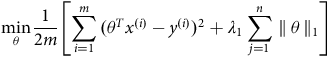 $${\mathop {{\rm{min}}}\limits_\theta {1 \over {2m}}\left[ {\mathop \sum \limits_{i = 1}^m {{({\theta ^T}{x^{\left( i \right)}} - {y^{\left( i \right)}})}^2} + {\lambda _1}\mathop \sum \limits_{j = 1}^n \parallel \theta \,{\parallel _1}} \right]}$$
where θ is the vector of coefficients, so the first part inside the bracket in equation (4) is the linear regression, which minimizes sum of squared residuals. The term $\mathop \sum \nolimits_{j = 1}^n \parallel \theta \parallel $
is the penalty. Ridge regression adds squared magnitude of coefficient as penalty term to the loss function and aims at minimizing equation (5):
$\mathop \sum \nolimits_{j = 1}^n \parallel \theta \parallel $
is the penalty. Ridge regression adds squared magnitude of coefficient as penalty term to the loss function and aims at minimizing equation (5):
 $${\mathop {{\rm{min}}}\limits_\theta {1 \over {2m}}\left[ {\mathop \sum \limits_{i = 1}^m {{({\theta ^T}{x^{\left( i \right)}} - {y^{\left( i \right)}})}^2} + {\lambda _2}\mathop \sum \limits_{j = 1}^n \parallel \theta \parallel _2^2} \right]}$$
When L1 (Lasso regression) and L2 (Ridge regression) regularization are used in combination, the result describes the Elastic Net method. Elastic Net aims at minimizing equation (6):
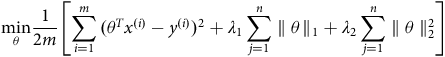 $${\mathop {{\rm{min}}}\limits_\theta {1 \over {2m}}\left[ {\mathop \sum \limits_{i = 1}^m {{({\theta ^T}{x^{\left( i \right)}} - {y^{\left( i \right)}})}^2} + {\lambda _1}\mathop \sum \limits_{j = 1}^n \parallel \theta\, {\parallel _1} + {\lambda _2}\mathop \sum \limits_{j = 1}^n \parallel \theta \parallel _2^2} \right]}$$
Elastic Net can handle various components commonly found in time-series data, such as trend, seasonality, and autocorrelation. By incorporating appropriate lagged values and seasonal terms as predictor variables, the algorithm captures temporal dependencies and patterns, enabling accurate forecasting.
4.4. Error-Trend-Season (ETS)
The Error-Trend-Season (ETS) model is a forecasting tool that combines elements of exponential smoothing with a state space framework to capture various patterns in time-series data (Hyndman et al., Reference Hyndman, Koehler, Snyder and Grose2002, Reference Hyndman, Akram and Archibald2008). The ETS model comprises three main components: Error (E), Trend (T), and Seasonality (S). The Error component accounts for random fluctuations or noise in the data and is modeled using exponential smoothing. It represents the difference between observed values and predicted values based on the trend and seasonality. The Trend component captures the long-term direction or tendency in the data. It is also modeled using exponential smoothing and represents the systematic change over time. The Seasonality component accounts for periodic fluctuations in the data that occur at regular intervals, such as weekly and monthly patterns. This component is particularly useful for modeling seasonal effects, such as holiday sales spikes or weather-related fluctuations.
Mathematically, the ETS model can be expressed as a set of recursive equations that update the estimates of the Error, Trend, and Seasonality components over time. These equations incorporate smoothing parameters that control the influence of past observations on the current estimates, allowing the model to adapt to different patterns in the data. The Error component is given by:
 $${{{\hat e}_t} = \alpha ({y_t} - {{\hat y}_{t|t - 1}}) + (1 - \alpha ){{\hat e}_{t - 1}}}$$
where ${\hat e}_t$
represents the estimated error at time t. y t is the observed value at time t and ŷ t|t − 1 is the forecasted value at time t based on the previous time step. α is the smoothing parameter for the Error component, controlling the influence of the current observation on the error estimate. Trend (T) component can be represented as follows:
${\hat e}_t$
represents the estimated error at time t. y t is the observed value at time t and ŷ t|t − 1 is the forecasted value at time t based on the previous time step. α is the smoothing parameter for the Error component, controlling the influence of the current observation on the error estimate. Trend (T) component can be represented as follows:
 $${{{\hat T}_t} = \beta ({{\hat y}_{t|t - 1}} - {{\hat y}_{t - 1|t - 1}}) + (1 - \beta ){{\hat y}_{t - 1}}}$$
where T̂ t represents the estimated trend at time t. β is the smoothing parameter for the trend component, controlling the influence of the previous trend estimate on the current trend estimate. Seasonality (S) component is:
 $${{{\hat S}_t} = \gamma ({y_t} - {{\hat y}_{t|t - 1}} - {{\hat e}_t}) + (1 - \gamma ){{\hat S}_{t - m}}}$$
where Ŝ t represents the estimated seasonality at time t. γ is the smoothing parameter for the seasonality component, controlling the influence of the current observation on the seasonality estimate. m is the length of the seasonal cycle (e.g., 12 for monthly data). The forecasted value ŷ t|t − 1 at time t is obtained by adding the estimated components together:
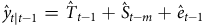 $${{{\hat y}_{t|t - 1}} = {{\hat T}_{t - 1}} + {{\hat S}_{t - m}} + {{\hat e}_{t - 1}}}$$
One intuitive way to understand the ETS model is to think of it as decomposing the time-series data into its underlying components: a smoothed trend line, seasonal fluctuations around this trend, and random noise. By explicitly modeling these components, the ETS model can provide more accurate forecasts and better insights into the underlying dynamics of the data.
4.5. ARIMA and Prophet XGBoost
Hybrid ML models, also known as combined predictor models, integrate automated algorithms with ML techniques (Mullainathan and Spiess, Reference Mullainathan and Spiess2017). In this study, we adopt the ARIMA and Prophet models and enhance them with the XGBoost algorithm (Chen and Guestrin, Reference Chen and Guestrin2016; Chen et al., Reference Chen, He, Benesty, Khotilovich, Tang, Cho, Chen, Mitchell, Cano, Zhou, Li, Xie, Lin, Geng, Li and Yuan2024). XGBoost, short for extreme Gradient Boosting, belongs to the ensemble learning algorithm family. In ensemble learning, weak learners (individual models) are sequentially constructed and aggregated to form a more robust predictive model. XGBoost operates iteratively, with each subsequent model rectifying the errors of the previous ones, thereby enhancing overall performance (Mullainathan and Spiess, Reference Mullainathan and Spiess2017). To implement the ARIMA and Prophet Boost models, we first model the data using ARIMA or Prophet to capture its intrinsic patterns. Next, we employ the XGBoost algorithm to regress the residuals obtained from the ARIMA or Prophet model. This two-step approach harnesses the strengths of both techniques, enabling us to capitalize on the predictive capabilities of ARIMA or Prophet’s time-series modeling and the ensemble learning framework XGBoost. Importantly, XGBoost is renowned as a scalable tree boosting system (Chen and Guestrin, Reference Chen and Guestrin2016). It stands out as a rapid and efficient tool for constructing accurate models and is widely recognized as the algorithm of choice for classification or regression problems in ML.
Intuitively, XGBoost operates by iteratively improving upon the predictive capabilities of weaker models. It does so by training subsequent models to correct the errors made by earlier ones, gradually refining predictions with each iteration. This iterative refinement process, coupled with its ensemble learning approach, enables XGBoost to capture intricate patterns and relationships within data, ultimately leading to superior predictive performance.
4.6. Forecast accuracy measures
Forecast accuracy can be measured using metrics such as mean absolute error (MAE), mean absolute percentage error (MAPE), symmetric mean absolute percentage error (SMAPE), or root mean squared error (RMSE) (Hyndman and Athanasopoulos, Reference Hyndman and Athanasopoulos2021). Suppose the soybean export dataset is denoted by y 1, y 2, ⋯, y T, and we split it into two sections: the training data y 1, y 2, ⋯, y N and the test data y N + 1, y N + 2, ⋯, y T. To assess the accuracy of our forecasting method, we estimate the parameters using the training data and forecast the next T − N observations. These forecasts are then be compared to the test data. The h-step-ahead forecast can be denoted as ŷ N + h|N. The “hat” notation indicates that it is an estimate rather than an observed value, and the subscript indicates that we are estimating y N + h using all the data observed up to and including time period N. The forecast errors are the differences between the actual values in the test set and the forecasts produced using only the data in the training set. Thus:
 $${{e_t} = {y_t} - {{\hat y}_{t|N}},\,\,\;{\rm{for}}\,{{t = N + 1}}, \cdots, {\rm{T}}}$$
MAE is defined as MAE = mean(|e t|), MAPE as ${\rm MAPE}={\rm mean}\left(\left| {100e_{t} \over y_{t}}\right| \right)$
, and RMSE as
${\rm MAPE}={\rm mean}\left(\left| {100e_{t} \over y_{t}}\right| \right)$
, and RMSE as ${\rm RMSE}=\sqrt{{\rm mean}(e_{t}^{2})}$
. When comparing forecast methods on a single dataset, the MAE is popular as it is easy to understand and compute (Hyndman and Athanasopoulos, Reference Hyndman and Athanasopoulos2021).
${\rm RMSE}=\sqrt{{\rm mean}(e_{t}^{2})}$
. When comparing forecast methods on a single dataset, the MAE is popular as it is easy to understand and compute (Hyndman and Athanasopoulos, Reference Hyndman and Athanasopoulos2021).
In addition to these, we employ SMAPE, as defined by:
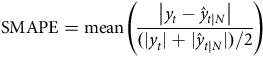 $${{\rm{SMAPE}} = {\rm{mean}}\left( {{{\left| {{y_t} - {{\hat y}_{t|N}}} \right|} \over {(|{y_t}| + |{{\hat y}_{t|N}}|)/2}}} \right)}$$
SMAPE addresses asymmetry in error values, where the discrepancy between predicted and actual values may yield different outcomes depending on their relative magnitudes. This issue is particularly notable in the MAPE, which some researchers caution against due to its differential treatment of forecast errors above versus below the actual observations. To mitigate this concern, a symmetric MAPE has been proposed by Goodwin and Lawton (Reference Goodwin and Lawton1999).
Lastly, we may use the coefficient of determination (R 2), which measures the proportion of the variance in the dependent variable that is predictable from the independent variables. It provides insight into how well the model explains the variability of the data, which is given by:
 $${{R^2} = 1 - {{\mathop \sum \nolimits_{i = 1}^n {{({y_i} - {{\hat y}_{t|N}})}^2}} \over {\mathop \sum \nolimits_{i = 1}^n {{({y_i} - \bar y)}^2}}}}$$
where $\overline{y}$
is the mean of the observed values.
$\overline{y}$
is the mean of the observed values.
5. Results and discussion
We trained the six models discussed above using data from January 2010 to June 2016 and tested the models from July 2016 to June 2018 for export value and volume to China and export value and volume to other regions. Using the estimates from the testing set, we calculated five different criteria metrics to evaluate model fit: MAE, MAPE, SMAPE, RMSE, and R-squared (Table 1). Each model’s performance is detailed in the table provided. For MAE, MAPE, SMAPE, and RMSE, the model with the lowest value for each metric is considered the best, whereas a higher R-squared value is preferred. Based on these six models, the Prophet XGBoost model consistently achieves the lowest MAE, MAPE, and RMSE or highest R-squared value, indicating superior relative performance. From Table 1, the Prophet XGBoost model achieves the best accuracy metric when forecasting the value of exports to China and the volume of exports to other regions. It also obtains the lowest MAPE and SMAPE across all trade measures forecasted. While the Prophet XGBoost model is the most accurate model when forecasting the volume of exports to China, the SARIMA(2,0,0)(2,1,0)[12] XGBoost model also appears to perform well and shows a higher R-squared value and lower RMSE compared to the Prophet XGBoost.
Accuracy table

Note: In the accuracy table, bold numbers indicate the best-performing model for each respective metric. The starred model indicates the best-performing model overall.
It is worth noting that integrating the XGBoost algorithm enhances the performance of both the SARIMA and Prophet models for specific measures of model accuracy compared to the same model without XGBoost. For example, the SARIMA(2,0,0)(2,1,0)[12] XGBoost model indicates improved performance in terms of MAE, MAPE, SMAPE, and RMSE for volume and value of exports to China and all other regions. Similarly, the Prophet XGBoost model outperforms the standalone Prophet model, displaying higher R-squared and lower MAE, MAPE, SMAPE, and RMSE. While this suggests the effectiveness of integrating XGBoost to refine predictions and reduce errors in both SARIMA and Prophet models, there is one case in this table where the metric was not improved with the integration of XGBoost. This suggests that while integrating XGBoost into traditional forecasting models could improve accuracy, caution is recommended.
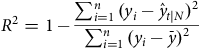
After re-estimating the value and volume of exports to China and other regions, with data spanning from January 2010 to June 2018, a forecast from July 2018 to December 2021 is estimated to quantify changes as a result of tariffs and policies enacted during the trade conflict. Figure 3 Footnote 4 shows the results, where the differences between the actual (gray line) and predicted models (red dotted line) and the value and volume of exports to China and volume and value of exports to other regions are compared. Over the entire test period, the Prophet XGBoost model performed well, as shown with the red dotted line (predicted) closely tracked by the gray line (actual value and volume of exports).
Actual and predicted value and volume of soybean exports using prophet with XGBoost. Note: Shaded area = 95% confidence intervals. The red dotted line represents forecasted exports. The solid gray line represents actual exports.
From Figure 3, the large seasonal swings in value and volume of exports are largely captured by the predicted models in the pre-trade conflict period. From the start of the trade conflict, the actual value and volume of exports to China have fallen below the predicted values. Conversely, the actual value and volume of exports increased above the predicted values in summer 2019, continuing above through the Phase One Trade Deal; the actual value still remains within the 95% confidence bounds. Then, as the trade war cooled, the predicted volume and value of exports closely followed the actual values from late spring to summer 2020. A similar pattern in the value and volume of exports to other regions is observed, with the predicted model largely capturing the patterns in the data observed before the trade war. After July 2018, the model fails to show any statistically significant change in the value of exports to other regions, as shown by the actual value of exports staying within the 95% confidence interval of the predicted values. The actual volume exceeds the 95% confidence interval on the predicted volume, suggesting a significant increase in the volume of exports to other regions early in the trade conflict. Finally, the actual and predicted value and volume of exports to other regions aligned after the Phase One trade deal was put in place in January 2020.
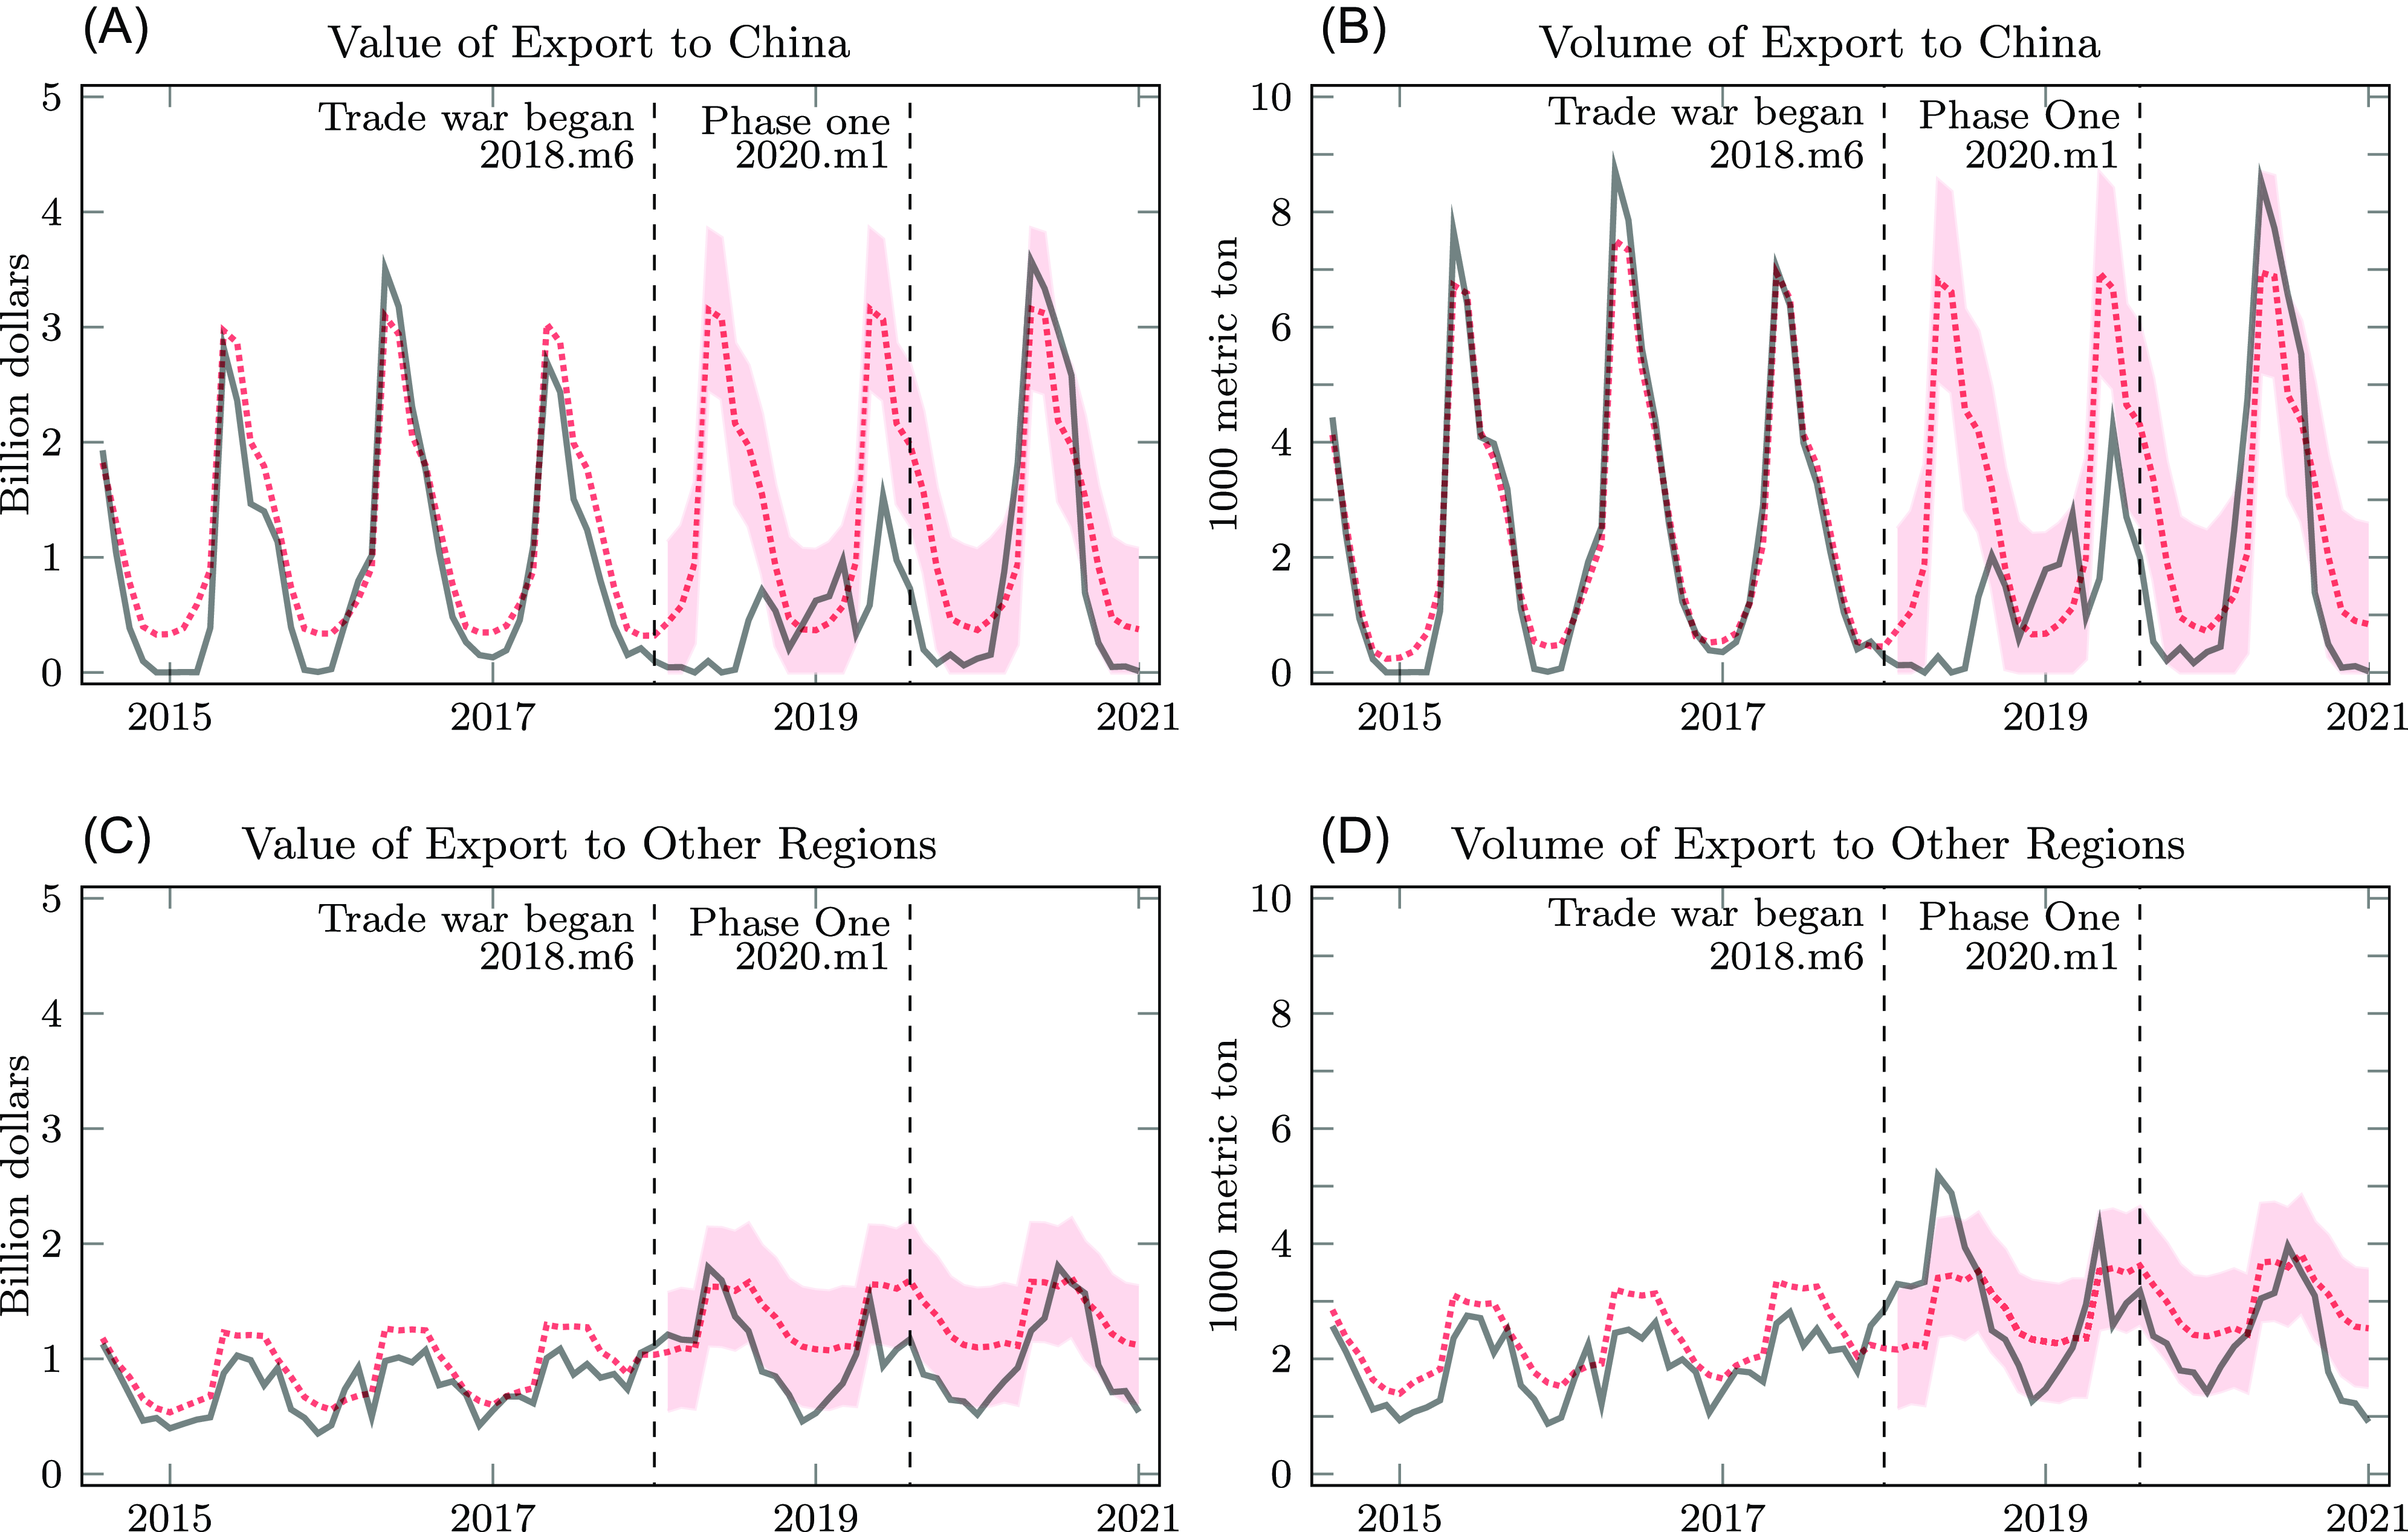
The disparity between forecasted and actual values is shown in Figure 4 to further illustrate the impact of the tariffs and trade war on the US soybean exports. Figure 4 illustrates differences between forecasted and actual exports with more severe negative values indicating periods of losses identified by actual export value or volume falling below the predicted levels. Specifically, deviations from the observed values (horizontal line) are plotted. This allows for a visual comparison of the model’s accuracy by illustrating the actual values and volume of exports before the trade war. Once the trade conflict began, a drop in the value and volume of exports to China was observed, with approximate forecasted losses of up to $3 billion in value or approximately 6,000 metric tons in volume. As noted previously, the volume of exports to other regions increased slightly following the start of the trade conflict at less than 2,000 metric tons.
Difference between actual and forecasted value and volume of soybean exports using prophet XGBoost. Note: The red dotted line represents the deviations from the observed values. Deviations are calculated as the difference between actual exports [value and volume] minus forecasted exports. The shaded area represents the 95% confidence intervals.
Confidence intervals in Figure 4 are displayed as the shaded areas. The magnitude of the difference between actual and predicted values and the associated confidence interval on point estimate vary between measures of soybean exports. As noted, there was an increase in the actual value of exports to other regions following the start of the Trade War, as well as in the actual value and volume of exports to China in the summer of 2019 before the Phase One trade deal, these increases did not fall outside of the confidence intervals. As such, while they may have somewhat helped restore the soybean trade, they did not seem to significantly offset losses from previous months.
The monthly estimated differences between the actual and forecasted values and volumes of soybean exports to China and other regions are shown in Table 2. Export losses primarily occurred during the first year of the trade conflict, from June 2018 to June 2019, with primary losses from the value and volume of exports to China. Then, in accordance with the seasonal pattern observed prior to tariffs, continued losses were observed in late 2019 and into early 2020 in terms of both the value and volume of exports to China. As noted previously, while efforts were made to increase the soybean trade value and volume to other regions, only the volume of exports to other regions was statistically significant early on in the trade war, from July 2018 through November 2018. Notably, the volume of exports to other regions was statistically significantly lower than forecasted in May 2019.
Forecasted loss in soybean volume and value exported to China and other regions during trade war

Losses are calculated as actual exports minus forecasted exports from Prophet with XGBoost errors Numbers with * indicate statistical significance at the 5% level.
1 Sum of only statistically significant estimates.
The cumulative estimated reduction in exports during the 24-month period from July 2018 to June 2020 is presented in Table 2 and is derived from the sum of all statistically significant differences as depicted in Figure 4. In total, over the 2-year period, the reduction in exports amounts to $20.2 billion for the value of exports to China and is not offset by any (statistically) significant increases in the value of exports to other regions. Moreover, the volume of exports to China, as calculated by the sum of all statistically significant differences, amounts to a reduction in exports of 37,210 metric tons, which is offset by an increase in exports to all other regions of 4,400 metric tons. These losses represent direct economic setbacks for the industry and domestic producers due to lower-than-anticipated export volumes.Footnote 5 Results are presented over the entire trade war period, through six months following the Phase One trade deal. For this reason, annual losses are approximately $10.16 billion in total value or 16,410 metric tons in total volume. Previous studies place the estimated losses around $10.7 billion (Grant et al., Reference Grant, Arita, Emlinger, Johansson and Xie2021).
All models captured the seasonality of the data, with Prophet XGBoost most accurately estimating the large swings in monthly year-to-year exports as discussed in Table 1. Disparities between the actual data (black line) and forecasted (red line) emerged as exports fell due to the trade war (Figure 3). As seen in Figure 4, the model Prophet XGBoost was able to capture the variability and seasonality of the export volume and value data before the trade conflict, displaying little difference between the forecasted model and actual data. These forecast models utilizing ML techniques incorporate complex time-series processes and can provide precise monthly estimates of changes to export patterns for data series that vary in terms of seasonality and magnitude. When included, it may be inferred that changes to existing trade patterns from unprecedented policies or shocks can be modeled with increased precision through traditional forecasting procedures that include ML techniques.
6. Summary and concluding remarks
This study provides a comprehensive estimation of the effects of retaliatory tariffs by China on US soybean exports. By considering a diverse array of forecasting models and additionally including changes in soybean exports to other regions, we derive estimates of the impact of retaliatory tariffs on the value and volume of soybean exports, shedding light on the impact of retaliatory tariffs on international trade patterns. The inclusion of both traditional econometric methods and advanced ML techniques mitigated potential biases, providing enhanced and robust findings. Notably, this study provides a novel effort to couple outcomes from conventional econometric forecasting and ML models to enhance and improve the measurement of loss estimates.
Results take into account substantial declines in soybean exports following the imposition of tariffs, with total estimated losses of $20.32 billion in export value or 32,810 metric tons over a 24-month period, even when the effect of exports to other regions is included. These estimates are consistent with previous studies and show the potential use of ML techniques to incorporate complex trade patterns in the estimation process. This study emphasizes the benefit of enhanced methods for estimating the impacts of trade policy and its direct consequences on all pertinent stakeholders involved.
Despite the significance of our findings, there are certain limitations in both the conceptualization of international trade patterns and the modeling approach that warrant acknowledgment. First, while this study focuses on estimating changes in US soybean exports during the recent trade conflict, it does not account for other factors that may have mitigated or influenced the impact of reduced soybean exports. Specifically, we do not incorporate the effects of market facilitation payments or other strategies designed to alleviate the impact on producers. Furthermore, our analysis does not consider export volume or value for competing commodities, nor does it explore competition for acreage among US crops. While outside the scope of this article, it is important to note that producers typically adjust their planting decisions based on relative price signals from different crops. These decisions could affect the overall availability of soybeans for export and, by extension, influence prices and international trade flows.
Additionally, while our study employed a broad range of model specifications, including both ML techniques and traditional econometric forecasting models, further refinements could help narrow the range of estimated losses. This modeling effort sought to address the challenges inherent in applied forecasting for complex, asymmetric time-series processes. As demonstrated, ML methods can offer valuable insights, but it is crucial to also consider the strengths and limitations of any modeling approach. Specifically, the methodology we used relies on past data to forecast future changes in export volume and value. This means that the estimated changes are not based on a structural model that accounts for dynamic adjustments over time. Future research could apply this approach to other commodities or policy situations where the strengths of ML approaches to handle heteroskedasticity, zero value observations, and complex time-series processes may be beneficial.
The insights gleaned from this study can serve to gain an improved understanding of estimated potential losses in the event of future tariff impositions by other nations on US exports and thus provide benefit in assessing implications in the formulation of domestic trade policies. By improving the assessment of the economic consequences that arise from trade disputes, our study contributes to an enhanced understanding of the dynamics governing international trade relations. This, in turn, underscores the imperative of formulating informed policy to mitigate adverse outcomes for domestic industries and stakeholders.


 Open access