


1. Introduction
Custom manufacturing industries, particularly those operating under Engineer-to-Order (ETO) and mass customization models, face increasing complexity in managing Bills of Materials (BOMs). A BOM can be described as a representation of the relationships between parts and components required to produce a product (Reference Van Veen and WortmannVan Veen & Wortmann, 1992). Companies offering a high variety of products must cope with significant structural and data-management challenges (Reference Modrak, Soltysova, Modrak and BehunovaModrak et al., 2017). As product variety increases, a traditional approach has been to maintain a separate BOM for each variant (Reference Olsen and SætreOlsen & Sætre, 1997). However, this approach leads to data explosion, redundancy, poor scalability, and separation of information across systems (Reference Jiao, Tseng, Ma and ZouJianxin Jiao et al., 2000). The result is a proliferation of BOM structures prone to inconsistencies, negatively affecting downstream processes such as production planning, costing, and change management. These structural challenges directly impact operational efficiency across organizations. Low-quality master data, including BOMs, can lead to faulty decision making, inaccurate costing, inefficiencies, customer dissatisfaction, and erosion of trust in digital tools (Reference Haug, Zachariassen and LiempdHaug et al., 2011). Such consequences are particularly critical in ETO environments, where engineering decisions must be made continuously based on evolving specifications and configurations.
To address these issues, companies not only need to structure BOMs around product families and generic operations but also require tools that support understanding and navigation of complex, highly variant structures. Traditional static or tabular representations often fail to convey the depth and variability inherent in ETO BOMs. As argued by Reference Bhat, Berryman, Burkhardt, Cho, Ferkau, Gharbiah, Johnston, Kaiser, Lynch, Mittman, Risch and SwansenBhat et al. (2021), “seeing” manufacturing complexity is a crucial first step toward understanding and improving it. Prior work has shown that interactive visualizations can support traceability, filtering, and comprehension in nested BOM structures, improving coordination across engineering and manufacturing domains.
Despite extensive research on modularization, 150% BOMs, and BOM visualization, industrial ETO environments still lack explicit traceability between configurator rule logic and generic BOM structures maintained in Product Lifecycle Management (PLM) systems. As a result, inconsistencies between configuration intent and released BOM structures often remain hidden until late validation stages, requiring time-consuming manual diagnosis. Existing visualization approaches primarily depict structural relationships, but do not provide diagnostic insight into rule-to-node relationships or misalignment between engineering and manufacturing views.
This paper makes the following contributions:
-
a) a five-stage visualization-driven framework that links PLM-based generic BOM (GBOM) structures with configurator rule logic to support variant traceability in Engineer-to-Order environments.
-
b) a conceptual data model specifying the core entities and relationships required to connect configuration options, rules, and BOM nodes across systems.
-
c) an interactive prototype providing variant-based filtering, metadata overlays, and diagnostic highlighting of structural and data inconsistencies; and
-
d) an industrial proof-of-concept case study on a highly configurable laser system, including exploratory observations and identified limitations.
The remainder of the paper is structured as follows. Section 2 reviews relevant literature, Section 3 outlines the research methodology, and Section 4 describes data collection and analysis. Section 5 presents the proposed framework and data model, followed by the test case in Section 6, findings in Section 7, and conclusions in Section 8.
2. Literature review
2.1. BOM structures and configuration in high-variability environments
A Bill of Materials (BOM) not only defines the structure of a product but also plays a central role throughout the lifecycle of complex manufacturing operations. BOMs support activities ranging from product development and procurement to production planning, quality control, and cost accounting (Reference Wang, Liu, Bai and XiaoWang et al., 2023). As highlighted by Reference Narasimha, Mudunuri and AraganiNarasimha et al. (2024), accurate and consistent BOM data is essential to ensure timely part availability, adherence to production schedules, and effective cost control.
To manage increasing product variety, modularization has become a widely adopted strategy. Modular BOMs organize products around configurable modules, enabling reuse and reducing engineering effort (Reference Balcerak and DaleBalcerak & Dale, 1992; Reference Pakkanen, Juuti, Lehtonen and MämmeläPakkanen et al., 2022). While modularization improves scalability and supports parallel development (Reference Vickery, Koufteros, Dröge and CalantoneVickery et al., 2016), it also introduces additional structural complexity, requiring more sophisticated representations than traditional flat BOM formats.
In highly customized manufacturing contexts such as Engineer-to-Order (ETO) and Configure-to-Order (CTO), configurable BOM structures are commonly used to manage this complexity. Overcomplete or 150% BOMs act as master structures containing all possible components and subassemblies, avoiding duplication of variant-specific BOMs (Reference Fan and YanFan & Yan, 2022). Generic BOMs (GBOMs) complement this approach by embedding configuration logic that governs valid variants (Reference Malatesta, Cicconi, Raffaeli and GermaniMalatesta et al., 2015). Together, these structures provide a scalable foundation for variant management but depend on transparent linkage between configuration logic and BOM structures.
2.2. EBOM–MBOM alignment and PLM integration challenges
As products transition from design to production, BOM representations must support different organizational perspectives. Engineering BOMs (EBOMs) reflect design intent, while Manufacturing BOMs (MBOMs) capture production sequencing, routings, and shop-floor constraints. These BOM types are often managed in separate systems, leading to misalignment and information loss (Reference StoltStolt, 2023). Several studies emphasize that poor integration between EBOM and MBOM structures can result in procurement errors, rework, and delayed production starts (Reference Wang, Ren, Zhang and ZhaoWang et al., 2022). In ETO environments, where frequent engineering changes and customer-specific configurations are common, these challenges are amplified. Configuration logic is often maintained outside the PLM system, further complicating traceability between customer requirements, configuration rules, and released BOM structures.
While PLM-centric approaches aim to provide a unified data backbone, they typically focus on data consistency rather than transparent configuration logic. As a result, misalignment between configurator outputs and PLM-stored BOMs is often detected late and corrected manually.
2.3. Visualization approaches for complex BOMs
Visualization has been widely recognized as an effective means of supporting understanding and decision-making in complex product structures. Reference Wu, Olsen and SaetreWu et al. (2002) highlight the value of visual environments for constructing and validating GBOMs, emphasizing features such as hierarchical navigation and constraint visualization. More recent work demonstrates the usefulness of interactive BOM visualizations for communicating relationships across engineering and manufacturing domains (Reference Bhat, Berryman, Burkhardt, Cho, Ferkau, Gharbiah, Johnston, Kaiser, Lynch, Mittman, Risch and SwansenBhat et al., 2021; Reference Lynch, Bhat, Cho, Jacobs, Kaiser, Maksi and RischLynch et al., 2024).
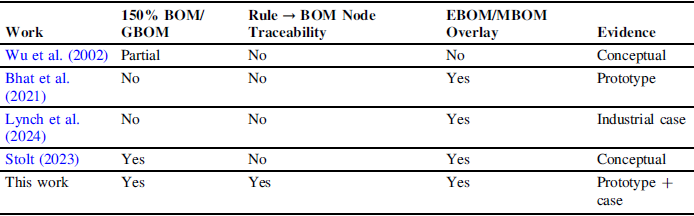
These approaches show that visualization can improve comprehension, coordination, and error detection in complex manufacturing contexts. However, existing visualization solutions primarily focus on structural representation and do not explicitly link configurator rule logic to generic BOM nodes. Furthermore, they typically lack diagnostic capabilities that highlight misalignment between derived variant-specific BOMs and PLM-maintained structures.
Table 1 summarizes key differences between existing BOM visualization and configuration approaches, and the framework proposed in this paper. In contrast to prior work, the proposed approach integrates rule-to-node traceability with interactive visualization and diagnostic support.
Comparison of BOM visualization and configuration approaches

3. Research method
This study adopts an exploratory single-case study methodology, which is well suited for investigating complex, real-life phenomena in their organizational context, particularly when existing theory is limited (Reference Voss, Tsikriktsis and FrohlichVoss et al., 2002). The case study approach enables close interaction with practitioners and supports the development and refinement of novel frameworks grounded in industrial practice.
The unit of analysis is a visualization-driven BOM management framework and its prototype implementation, developed and evaluated within a European custom laser manufacturing company operating in an Engineer-to-Order (ETO) environment. The research followed a collaborative, design-oriented approach, in which researchers worked closely with engineers to iteratively develop the framework, informed by existing literature and practical challenges observed in the company.
The primary purpose of the case study was twofold: first, to support the development and structuring of the proposed framework, and second, to conduct an exploratory evaluation of its applicability and perceived benefits in an industrial setting. The study does not aim to provide statistically generalizable results, but rather to generate analytical insights and identify boundary conditions for future research.
4. Data collection and analysis
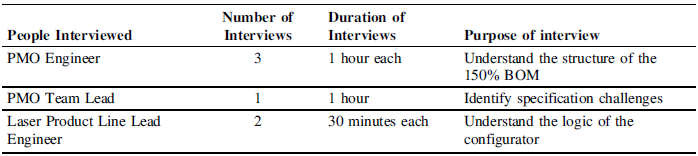
To support the development and exploratory evaluation of the proposed framework, data were collected in collaboration with a European custom laser manufacturing company operating in an Engineer-to-Order (ETO) context. The data collection process comprised three main activities, summarized in Figure 1.
-
• Interviews. Semi-structured interviews were conducted with key stakeholders involved in BOM definition and configuration activities, including members of the Project Management Office (PMO) and lead engineers from the main product line. The interviews focused on understanding the structure and use of the 150% BOM, the logic embedded in the configurator, and recurring challenges encountered during variant specification and validation. An overview of the interview participants and objectives is provided in Table 2.
Table 2.Overview of interview participants and objectives


Overview of the data collection and interaction activities during the case study

-
• Document Analysis. Internal documentation, including product specifications, released BOMs, PLM records, and configurator inputs and outputs, was reviewed to complement the interview data and support triangulation.
-
• Workshop. A small, semi-structured workshop was organized to test early visualization concepts and validate preliminary interpretations of the data.
A central finding from the analysis was the lack of transparent integration between the PLM system and the configurator environment. While the PLM system manages engineering-relevant BOM information, the configurator generates variant-specific BOMs and configuration logic independently. The absence of explicit linkage and visualization results in redundancy, misalignment, and time-consuming manual validation. This challenge is illustrated in Figure 2 and motivated the proposed framework.
Current disconnect between PLM and configurator systems in the studied ETO environment

5. Modeling approach
5.1. Conceptual data model
To enable explicit traceability between configuration logic and generic BOM structures, a conceptual data model integrating configurator and PLM information was defined. Existing PLM schemas represent product structure and metadata, but do not capture how configuration rules influence BOM element inclusion. The proposed model addresses this gap by making rule–structure relationships explicit.
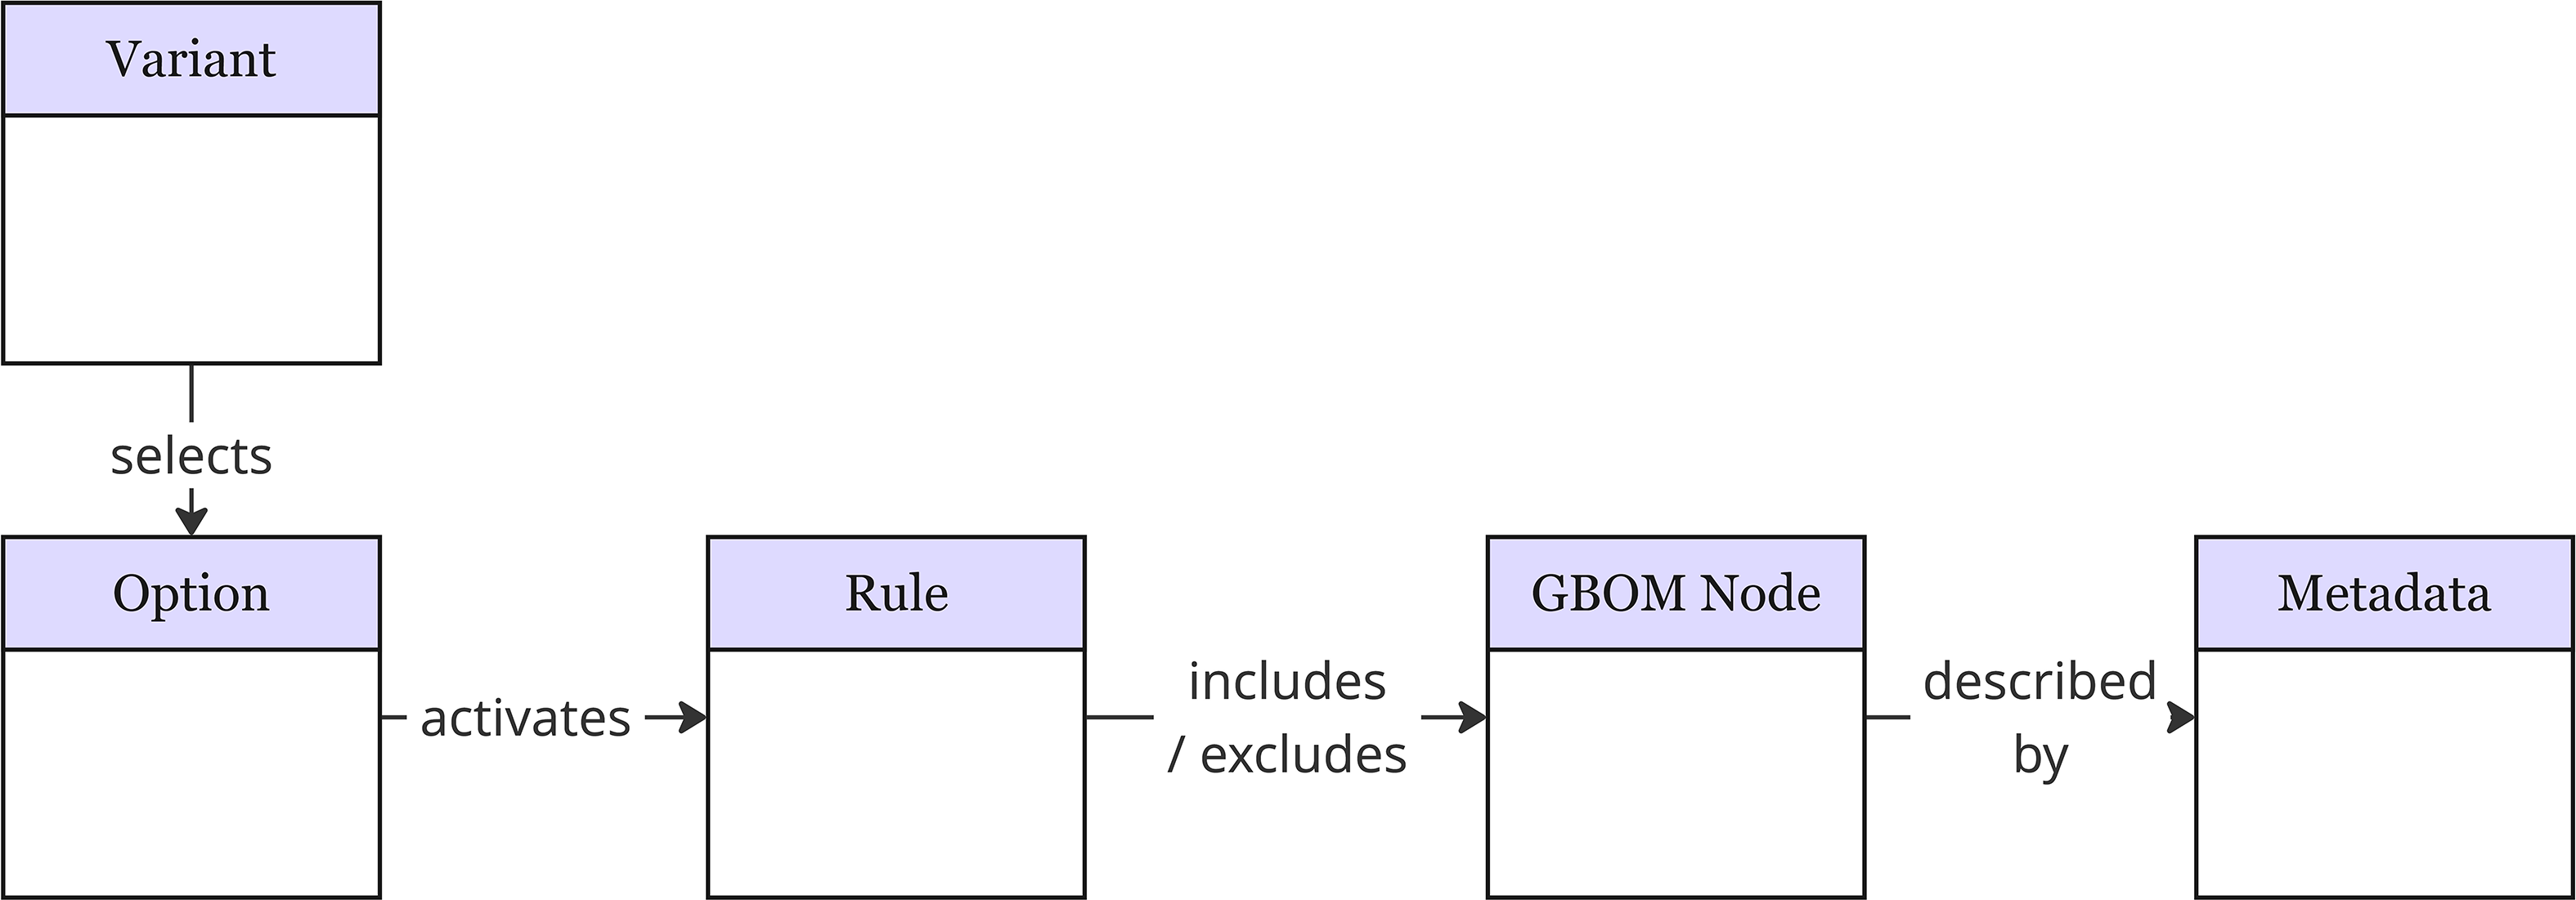
The model comprises seven core entities: BOM, BOMNode, Item, Variant, Option/Feature, Rule/Constraint, and Metadata. BOM and BOMNode represent the hierarchical product structure, Item captures part or assembly definitions, and Variant represents a specific configuration derived from selected options. Option/Feature and Rule/Constraint originate from the configurator and encode logic.
A central element of the model is the Rule/Constraint entity, which mediates the relationship between option selections and BOMNode inclusion or exclusion. This linkage enables traceability from configuration intent to structural outcomes. Metadata entities capture attributes such as site, unit, classification, and production status, supporting alignment between Engineering BOM (EBOM) and Manufacturing BOM (MBOM) perspectives.
Figure 3 presents a UML-style representation of the conceptual data model, illustrating the core entities and relationships across the configurator and PLM domains and providing a foundation for variant evaluation, visualization, and diagnostic analysis.
UML-style representation of the conceptual data model

5.2. Visualization-driven framework
Building on the conceptual data model and case study insights, a visualization-driven framework was developed to support BOM management in high-variability Engineer-to-Order environments. The framework comprises five interrelated stages, shown in Figure 4.
Framework Overview: a five-stage visual of the approach

-
• Stage 1: Functional decomposition of the 150% BOM. The process begins with the modular decomposition of the overcomplete (150%) BOM into functionally and operationally meaningful subassemblies. This step provides a structured foundation for interpreting configuration logic and reduces cognitive complexity.
-
• Stage 2: Mapping configuration logic to GBOM structures. In the second stage, configuration rules and option selections are explicitly mapped to GBOM nodes using the conceptual data model. This makes previously implicit configuration logic transparent and enables engineers to understand how specific options influence structural BOM elements.
-
• Stage 3: Integration of engineering and manufacturing perspectives. The third stage integrates metadata relevant to both EBOM and MBOM views, such as production site, unit, classification, and release status. By layering this information onto the GBOM structure, the framework supports cross-functional alignment and reduces the risk of misinterpretation between engineering and manufacturing domains.
-
• Stage 4: Interactive visualization and exploration. The fourth stage introduces interactive visualization capabilities that allow users to switch between the full GBOM and variant-specific BOM views. Filtering and navigation mechanisms enable users to focus on relevant subsets of the structure depending on task and role.
-
• Stage 5: Diagnostic analysis and alignment support. The final stage focuses on identifying and highlighting inconsistencies, including missing metadata, misaligned structures, and incomplete rule effects. Diagnostic visualization supports early detection of issues that would otherwise require manual cross-system checks, enabling more efficient variant validation and BOM correction.
Together, these stages form a coherent framework linking configuration logic, structural BOM data, and visualization-based diagnostics. The flow of inputs, processing logic, and visualization outputs is summarized in Figure 5.
Flow of inputs, processing logic, and visualization outputs in the BOM structuring framework

6. Test case
6.1. Industrial test case context
To demonstrate applicability, a proof-of-concept (PoC) prototype was developed and applied in a European company specializing in highly configurable fiber laser systems operating in an Engineer-to-Order (ETO) context. The selected test case focused on a high-power, single-frequency laser platform characterized by a complex 150% BOM, extensive configuration logic, and frequent engineering changes, making it representative of the challenges addressed by the framework.
6.2. Prototype implementation
The PoC prototype integrates real engineering data extracted from the company’s PLM system and configurator environment and operationalizes the conceptual data model and five-stage framework described in Section 5.
Figure 6 illustrates the dual-stage visualization environment implemented in the prototype. Visualization enables switching between the complete 150% BOM and variant-specific views by filtering non-included nodes based on evaluated configuration rules.
Dual-stage BOM visualization environment

Figure 6 Long description
Panel A: The left side of the diagram shows a hierarchical structure of a high-power single-frequency laser BOM visualization. It includes various BOMs such as Amplifier Fiber BOM, Fiber Laser Monitoring BOM, Coupler Item, Variable Optical Attenuator BOM, Main Output BOM, Monitor Output BOM, Substrate BOM, and Fiberlaser Stage BOM. Each BOM is further broken down into components and subcomponents, illustrating the detailed structure and relationships within the BOM. Panel B: The right side of the diagram depicts a released variant selection mode for the high-power single-frequency laser. It shows how different variants are selected and visualized, highlighting components with relevant information, missing components, and suspicious configuration information. The diagram illustrates the flow from a 150 percent BOM to a configuration BOM, showing the relationships and interactions between different components and variants.
Figure 7 illustrates the prototype visualization concept for exploring variant-specific BOMs derived from a generic 150% BOM. The left view shows the complete generic structure, while the right view displays a released variant with non-included nodes filtered out and detected inconsistencies highlighted.
Prototype visualization of a generic 150% BOM (left) and a variant-specific BOM (right)

The visualization supports comparison between generic and variant-specific BOM structures and enables early validation of configuration outcomes. The user interface has been simplified, and all item names and identifiers have been altered or masked for confidentiality.
6.3. Diagnostic visualization capabilities
Beyond structural exploration, the prototype provides diagnostic visualizations that support alignment and validation activities. For example, empty or redundant subassemblies that should have been excluded by configuration logic are visually identifiable, as are missing or incomplete metadata fields originating from either the PLM system or the configurator.
Additionally, incomplete or ambiguous rule effects can be detected by comparing derived variant structures with stored BOM representations. These diagnostic capabilities support early identification of inconsistencies that would otherwise require manual cross-system checks, thereby operationalizing Stage 5 of the proposed framework.
It should be noted that the prototype was developed for exploratory purposes and evaluated in a limited setting. While sensitive information has been anonymized, all data used in the prototype reflects real engineering and configuration structures maintained by the company.
6.4. Prototype capabilities
The prototype implements a set of capabilities derived from the requirements identified during the case study and operationalizes the stages of the proposed framework.
Visualization views include:
-
• V1: a GBOM overview displaying the complete 150% BOM structure.
-
• V2: a variant-specific view showing only nodes included for a selected configuration.
-
• V3: a rule-trace view linking configuration options and rules to affected BOM nodes; and
-
• V4: a metadata overlay view visualizing attributes such as site, unit, classification, and production status.
User interactions supported by the prototype include:
-
• I1: selection of released variants to filter non-included BOM nodes.
-
• I2: metadata-based filtering and sorting; and
-
• I3: node selection to display provenance information, including PLM object references and rule sources.
Diagnostic functions enable identification of potential misalignment issues, including missing mandatory metadata, inconsistencies between derived and stored BOM structures, and ambiguous or incomplete rule effects.
6.5. Visualization pipeline
The visualization pipeline implemented in the prototype follows a five-step process aligned with the conceptual data model and framework stages:
-
1. Data ingestion, importing PLM extracts and configurator rule exports.
-
2. Mapping, establishing identifier-based links between PLM items, BOM nodes, and configuration rules.
-
3. Variant evaluation, computing the set of BOM nodes included for a selected configuration.
-
4. Rendering, applying hierarchical layouts and visual encodings; and
-
5. Filtering, enabling user-driven refinement based on variant selection and metadata attributes.
6.6. Users & use cases
The prototype was designed to support users involved in BOM definition, validation, and coordination activities. Primary users include members of the Project Management Office (PMO) and product line engineers.
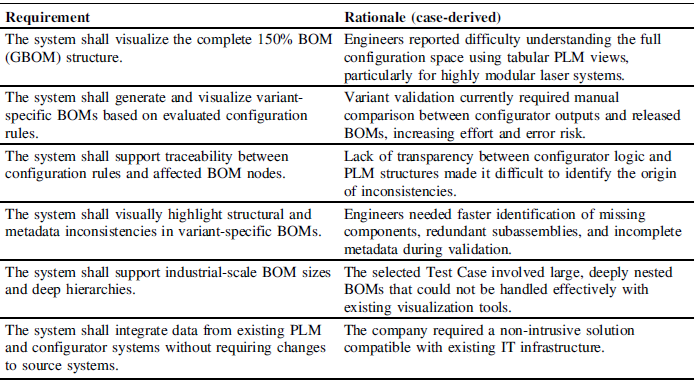
Key use cases identified during the case study include variant validation, BOM consistency checking, engineering change impact analysis, and cross-functional alignment between engineering and manufacturing during specification review. These use cases informed the selection of visualization views, interactions, and diagnostic functions implemented in the prototype. Based on the identified users and use cases, a set of functional and non-functional requirements was derived to guide the prototype implementation (Table 3).
Functional and non-functional requirements derived from the case study

7. Exploratory findings
Initial testing of the proposed framework and visualization tool was conducted through a short proof-of-concept (PoC) application using real configuration and engineering data from the selected industrial case. Although the tool remains at a prototype stage and has not been deployed at organizational scale, the exploration provided qualitative insights into its potential utility during variant validation and BOM review activities.
The visualization tool supported identification of inconsistencies and assessment of alignment in variant-specific BOMs. During the PoC test, participants were able to trace variant-specific dependencies across the BOM structure and its submodules, detect configuration mismatches such as missing components, incorrect constraints, or misaligned metadata fields, and improve communication and shared understanding during specification validation and variant review discussions.
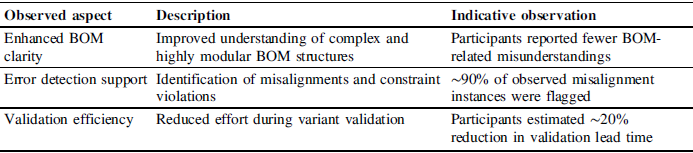
While no formal performance measurements were conducted, participants reported perceived improvements in understanding complex BOM structures, faster identification of potential issues, and reduced effort during variant validation. These exploratory observations are summarized in Table 4. Reported impact estimates reflect participant assessments during the short test and should be interpreted as indicative rather than statistically validated.
Exploratory observations from PoC short test on the high-power laser platform

8. Conclusion
This study presented a visualization-driven framework for managing complex Bills of Materials (BOMs) in Engineer-to-Order (ETO) environments. The framework integrates modular BOM structures, configuration logic, and cross-domain metadata into a coherent conceptual model and interactive visualization approach.
A proof-of-concept prototype was developed and applied in a European custom laser manufacturing context to explore the applicability of the framework using real industrial data. The exploratory use of the prototype indicated that visualization-based traceability between configuration rules and generic BOM structures can support understanding, alignment, and early identification of inconsistencies during variant validation activities.
The study is limited to a single industrial case and a prototype-level implementation. The framework has not yet been deployed at organizational scale and depends on consistent identifiers across PLM and configurator systems. Data quality in source systems directly affects diagnostic effectiveness, and the approach is most applicable to ETO environments characterized by high variant counts, stable rule bases, and extractable PLM structures.
Future work will focus on scaling the framework, extending the prototype, and further investigating its integration into industrial PLM and configurator environments, as well as conducting more systematic evaluations across multiple cases.





 Open access

