


1. Introduction
Collisional type orogens are often characterized by the presence of crustal-scale shear zones driving and affecting the tectono-metamorphic evolution of the inner portion of the belts (Fossen & Cavalcante, Reference Fossen and Cavalcante2017). Such crustal-scale shear zones can show different kinematics, from normal-sense (e.g. South Tibetan Detachment System; Burchfiel et al. Reference Burchfiel, Zhiliang, Hodges, Yuping, Royden, Changrong and Jiene1992) to thrust-sense (e.g. Main Central Thrust; Searle et al. Reference Searle, Law, Godin, Larson, Streule, Cottle and Jessup2008 and Higher Himalayan Discontinuity; Montomoli et al. Reference Montomoli, Iaccarino, Carosi, Langone and Visonà2013, Reference Montomoli, Carosi, Iaccarino, Mukherjee, Carosi, van der Beek, Mukherjee and Robinson2015) up to transtension and transpression (Goscombe et al. Reference Goscombe, Gray and Hand2005). Regardless, their long-lasting tectonic history (several Ma) is able to have a deep impact on the P–T–t paths of the metamorphic rocks and their exhumation (Carosi et al. Reference Carosi, Montomoli and Iaccarino2018 and references therein).
Transpressive tectonics, at the regional scale, can result from different factors such as an oblique convergence (e.g. Coast Mountains; Depine et al. Reference Depine, Andronicos and Hollister2011) or the irregular shape of the continental margins (e.g. Armorican Massif; Gébelin et al. Reference Gébelin, Rogera and Brunel2009). Regardless, the occurrence of transpression coeval with or subsequent to the continental collision deeply affects the evolution of the orogen with respect to the frontal collisional setting.
During the last 30 years, many theoretical, modelling and fieldwork studies have been carried out in order to characterize transpressional tectonics in complex oblique collisional events (e.g. Sanderson & Marchini, Reference Sanderson and Marchini1984; Tikoff & Fossen, Reference Tikoff and Fossen1993; Tikoff & Teyssier, Reference Tikoff and Teyssier1994; Fossen & Tikoff, Reference Fossen, Tikoff, Holdsworth, Strachan and Dewey1998; Schulmann et al. Reference Schulmann, Thompson, Lexa and Ježek2003). Occurrences of transpressional tectonics are often related to collisional belts where transpression represents an evolution of the nappe stacking and crustal thickening (Matte et al. Reference Matte, Lancelot and Mattauer1998; Carosi & Oggiano, Reference Carosi and Oggiano2002; Carosi & Palmeri, Reference Carosi and Palmeri2002; Carosi et al. Reference Carosi, Di Pisa, Iacopini, Montomoli and Oggiano2004). Transpressional tectonics also has a profound impact on the metamorphic architecture of an orogenic belt, the latter presenting substantial differences in terms of the tectono-metamorphic evolution compared to perpendicular collisional environments (Thompson et al. Reference Thompson, Schulmann and Jezek1997; Carosi & Palmeri, Reference Carosi and Palmeri2002; Goscombe et al. Reference Goscombe, Hand, Gray and Mawby2003, Reference Goscombe, Gray and Hand2005). Syn-collisional transpression has been investigated in first-order regional-scale shear zones within the main European crystalline basements such as the South-Armorican Shear Zone in Brittany (Gébelin et al. Reference Gébelin, Rogera and Brunel2009); the central sector of the Maures-Tanneron massif in southern France (Corsini & Rolland, Reference Corsini and Rolland2009; Schneider et al. Reference Schneider, Corsini, Reverso-Peila, Lardeaux, Schulmann, Martínez Catalán, Lardeaux, Janoušek and Oggiano2014); the Ferrier-Mollieres shear zone in the Argentera–Mercantour Massif (Carosi et al. Reference Carosi, D’Addario, Mammoliti, Montomoli and Simonetti2016; Simonetti et al. Reference Simonetti, Carosi, Montomoli, Langone, D’Addario and Mammoliti2018); and the Posada–Asinara Line (PAL) in northern Sardinia (Carosi & Palmeri, Reference Carosi and Palmeri2002; Carosi & Oggiano, Reference Carosi and Oggiano2002; Carosi et al. Reference Carosi, Frassi, Iacopini and Montomoli2005, Reference Carosi, Frassi and Montomoli2009; Iacopini et al. Reference Iacopini, Carosi, Montomoli and Passchier2008; Frassi et al. Reference Frassi, Carosi, Montomoli and Law2009; Cruciani et al. Reference Cruciani, Montomoli, Carosi, Franceschelli and Puxeddu2015). In these areas, a major role of transpressive structures related to the exhumation of high- and medium-grade metamorphic complexes has been recognized, well before the onset of the typical post-collisional extensional events (Turrillot et al. Reference Turrillot, Augier, Monié and Faure2011; Schneider et al. Reference Schneider, Corsini, Reverso-Peila, Lardeaux, Schulmann, Martínez Catalán, Lardeaux, Janoušek and Oggiano2014). In this work we investigated an area in NE Sardinia (Fig. 1) where a portion of the PAL, one of the first-order transpressive shear zones of the Variscan Belt in southern Europe, crops out (Corsini & Rolland, Reference Corsini and Rolland2009; Carosi et al. Reference Carosi, Cruciani, Franceschelli and Montomoli2015; Simonetti et al. Reference Simonetti, Carosi, Montomoli, Langone, D’Addario and Mammoliti2018). This shear zone has been studied by many authors with respect to the structural settings (e.g. Elter et al. Reference Elter, Musumeci and Pertusati1990), metamorphic evolution, and dynamics and kinematics of flow (e.g. Carosi & Palmeri, Reference Carosi and Palmeri2002; Carosi et al. Reference Carosi, Frassi, Iacopini and Montomoli2005; Iacopini et al. Reference Iacopini, Carosi, Montomoli and Passchier2008; Frassi et al. Reference Frassi, Carosi, Montomoli and Law2009; Cruciani et al. Reference Cruciani, Montomoli, Carosi, Franceschelli and Puxeddu2015). These authors investigated the bulk deformation linked to the transpressive monoclinic flow (Iacopini et al. Reference Iacopini, Carosi, Montomoli and Passchier2008) mainly focusing on the initial conditions of the shearing event at medium T conditions (520–630 °C; Carosi & Palmeri, Reference Carosi and Palmeri2002). The aim of this paper is to fill in the gap concerning the geological history of the long-lasting late transpressive tectonics, constraining the structural evolution and flow kinematics during the latest increments of shear deformation related to the PAL activity.
Sketch-map of the Variscan Belt in Sardinia (modified after Carmignani et al. Reference Carmignani, Oggiano, Barca, Conti, Salvadori, Eltrudis, Funedda and Pasci2001) and location of the study area (white square).

We present the results of a new structural study on mylonites along the PAL, metamorphosed under medium-grade conditions, coupled with microstructural analyses including the study of quartz crystallographic preferred orientation (CPO). Quartz petrofabric data allowed us to infer the deformation temperatures and the kinematic vorticity of the flow. Moreover we estimated for the first time the flow stresses and the strain rate along a N–S profile of the PAL, applying published recrystallized grain-size palaeopiezometers for quartz and wet-quartzite flow.
Combining our structural and petrofabric data with the existing published dataset, we propose an updated model of the PAL tectonic evolution and its role in the exhumation/extrusion of metamorphic complexes in orogenic belts.
2. Geological setting
2.a. Overview of the Variscan Belt in Sardinia
The Variscan Belt in Sardinia (Italy) is one of the most complete transects of the Southern Variscan Domain (Matte, Reference Matte1986; Carmignani et al. Reference Carmignani, Carosi, Di Pisa, Gattiglio, Musumeci, Oggiano and Pertusati1994, Reference Carmignani, Oggiano, Barca, Conti, Salvadori, Eltrudis, Funedda and Pasci2001; Corsini & Rolland, Reference Corsini and Rolland2009; Cruciani et al. Reference Cruciani, Montomoli, Carosi, Franceschelli and Puxeddu2015) characterized by a general lack of strong Alpine–Apenninic reworking. The current position of Sardinia derives from a 30° anticlockwise rotation of the Corsica–Sardinia microplate, related to the opening of the Balearic basin (Alvarez, Reference Alvarez1972; Montigny et al. Reference Montigny, Edel and Thuizat1981; Deino et al. Reference Deino, Gattacceca, Rizzo and Montanari2001; Gattacceca, Reference Gattacceca2001) in the Oligocene Period. Variscan Sardinia consists of metasedimentary and metaigneous rocks of the northern margin of Gondwana, affected by Palaeozoic deformation from the Devonian to Carboniferous periods, related to the collision between Gondwana, Armorica and Laurussia (Carmignani et al. Reference Carmignani, Cocozza, Ghezzo, Pertusati, Ricci, Carmignani, Cocozza, Ghezzo, Pertusati and Ricci1982, Reference Carmignani, Carosi, Di Pisa, Gattiglio, Musumeci, Oggiano and Pertusati1994, Reference Carmignani, Oggiano, Barca, Conti, Salvadori, Eltrudis, Funedda and Pasci2001). During the collision, the Gondwanan margin was the lower plate subducting under Armorica and the peri-Gondwanan terranes, accommodating most of the deformation (Matte, Reference Matte1986). The Variscan Orogeny is responsible for the main deformation and metamorphic features of Sardinia, consisting of a S- to SW-verging stacking of tectonic units with an increasing metamorphic grade moving from the SW to NE (Carmignani et al. Reference Carmignani, Cocozza, Ghezzo, Pertusati, Ricci, Carmignani, Cocozza, Ghezzo, Pertusati and Ricci1982, Reference Carmignani, Carosi, Di Pisa, Gattiglio, Musumeci, Oggiano and Pertusati1994; Franceschelli et al. Reference Franceschelli, Memmi, Ricci, Carmignani, Cocozza, Ghezzo, Pertusati and Ricci1982).
The Sardinian basement represents the eastern portion of the inner Ibero-Armorican indenter (Matte, Reference Matte1986; Carosi & Palmeri, Reference Carosi and Palmeri2002; Reference Cruciani, Montomoli, Carosi, Franceschelli and PuxedduCruciani et al. 2015), and it can be subdivided into three areas characterized by a different tectono-metamorphic evolution (Carmignani et al. Reference Carmignani, Cocozza, Ghezzo, Pertusati, Ricci, Carmignani, Cocozza, Ghezzo, Pertusati and Ricci1982, Reference Carmignani, Carosi, Di Pisa, Gattiglio, Musumeci, Oggiano and Pertusati1994, Reference Carmignani, Oggiano, Barca, Conti, Salvadori, Eltrudis, Funedda and Pasci2001; Cruciani et al. Reference Cruciani, Montomoli, Carosi, Franceschelli and Puxeddu2015). Along a S to N structural profile, the three areas are (Fig. 1):
(i) The foreland area (External Zone), restricted to SW Sardinia, composed of a poly-deformed Palaeozoic sequence showing very low- to low-grade metamorphism (e.g. Carmignani et al. Reference Carmignani, Carosi, Di Pisa, Gattiglio, Musumeci, Oggiano and Pertusati1994; Franceschelli et al. Reference Franceschelli, Battaglia, Cruciani, Pasci and Puxeddu2017 and references therein).
(ii) A SW-verging nappe stack in the central area constituted by Palaeozoic metasedimentary and metaigneous rocks with low- to medium-grade metamorphism (Carmignani et al. Reference Carmignani, Carosi, Di Pisa, Gattiglio, Musumeci, Oggiano and Pertusati1994; Carosi & Pertusati, Reference Carosi and Pertusati1990; Carosi et al. Reference Carosi, Musumeci and Pertusati1991; Montomoli et al. Reference Montomoli, Iaccarino, Simonetti, Lezzerini and Carosi2018). This area is subdivided into two sectors: the External and the Internal Nappe zones. The Internal Nappe Zone has also been subdivided into the ‘Medium-Grade Metamorphic Complex’ and the ‘Low-Grade Metamorphic Complex’ characterized, respectively, by medium- and low-grade metamorphic imprints.
(iii) The Inner Zone, or High-Grade Metamorphic Complex, in the northernmost sector of the island, represented by high-grade metamorphic rocks (Franceschelli et al. Reference Franceschelli, Memmi, Ricci, Carmignani, Cocozza, Ghezzo, Pertusati and Ricci1982, Reference Franceschelli, Puxeddu, Cruciani, Dini and Loi2005; Cruciani et al. Reference Cruciani, Montomoli, Carosi, Franceschelli and Puxeddu2015).
This architecture is intruded by late- to post-Variscan granitoids (Ghezzo et al. Reference Ghezzo, Memmi and Ricci1979; Macera et al. Reference Macera, Conticelli, Del Moro, Di Pisa, Oggiano and Squadrone1989; Casini et al. Reference Casini, Cuccuru, Puccini, Oggiano and Rossi2015).
2.b. Northern Sardinia
Northern Sardinia is divided into areas with different metamorphic signatures (Fig. 1): the Internal Nappe Zone represented by the Low- and Medium-Grade Metamorphic complexes (L–MGMC) and the Inner Zone represented by the High-Grade Metamorphic Complex (HGMC) (Cruciani et al. Reference Cruciani, Montomoli, Carosi, Franceschelli and Puxeddu2015 and references therein). The HGMC is located in the northernmost part of the island and consists of migmatites, orthogneisses, amphibolites, minor paragneisses and micaschists, calcsilicates and Carboniferous granitoids (Carmignani et al. Reference Carmignani, Carosi, Di Pisa, Gattiglio, Musumeci, Oggiano and Pertusati1994, Reference Carmignani, Oggiano, Barca, Conti, Salvadori, Eltrudis, Funedda and Pasci2001; Casini et al. Reference Casini, Cuccuru, Maino, Oggiano and Tiepolo2012). The HGMC experienced an early high-pressure (HP) eclogitic stage (700–740 °C and >1.5 GPa; see Cruciani et al. Reference Cruciani, Montomoli, Carosi, Franceschelli and Puxeddu2015 for a review) followed by a HP granulitic event (660–730 °C, 0.75–0.90 GPa; Miller et al. Reference Miller, Sassi and Armari1976; Ghezzo et al. Reference Ghezzo, Memmi and Ricci1979; Franceschelli et al. Reference Franceschelli, Memmi, Ricci, Carmignani, Cocozza, Ghezzo, Pertusati and Ricci1982; Di Pisa et al. Reference Di Pisa, Oggiano and Talarico1993; Cruciani et al. Reference Cruciani, Montomoli, Carosi, Franceschelli and Puxeddu2015) as suggested by granulitized relics of eclogite-facies metabasite embedded within the migmatite. Metamorphic ages are available only for the granulitic event that is constrained at ~350 Ma (Giacomini et al. Reference Giacomini, Bomparola and Ghezzo2005) or younger at ~330 Ma (Reference Palmeri, Fanning, Franceschelli, Memmi and RicciPalmeri et al. 2004). Southwards, the L–MGMC, made up of lower Palaeozoic metasedimentary rocks intruded by Ordovician metagranitic bodies, crops out (Carmignani et al. Reference Carmignani, Carosi, Di Pisa, Gattiglio, Musumeci, Oggiano and Pertusati1994, Reference Carmignani, Oggiano, Barca, Conti, Salvadori, Eltrudis, Funedda and Pasci2001). The metasedimentary rocks consist of greenschist- to amphibolite-facies micaschists and paragneisses characterized by an increasing Barrovian metamorphic grade from south to north (Franceschelli et al. Reference Franceschelli, Memmi, Ricci, Carmignani, Cocozza, Ghezzo, Pertusati and Ricci1982, Reference Franceschelli, Memmi, Pannuti, Ricci, Daly, Cliff and Yardley1989; Cruciani et al. Reference Cruciani, Montomoli, Carosi, Franceschelli and Puxeddu2015). The metamorphic zoning in the L–MGMC comprises, moving northward, a garnet + albite zone, garnet + oligoclase zone, staurolite + garnet + biotite zone, kyanite zone and sillimanite zone (Franceschelli et al. Reference Franceschelli, Memmi, Ricci, Carmignani, Cocozza, Ghezzo, Pertusati and Ricci1982, Reference Franceschelli, Memmi, Pannuti, Ricci, Daly, Cliff and Yardley1989; Carmignani et al. Reference Carmignani, Oggiano, Barca, Conti, Salvadori, Eltrudis, Funedda and Pasci2001; Cruciani et al. Reference Cruciani, Montomoli, Carosi, Franceschelli and Puxeddu2015). Close to the sheared contact between the two metamorphic complexes, the Barrovian isograds are very tight (Carosi & Palmeri, Reference Carosi and Palmeri2002; Carosi et al. Reference Carosi, Frassi, Iacopini and Montomoli2005). The boundary between the HGMC and L–MGMC is represented by the PAL. The PAL (Fig. 1) is a nearly 150 km long and 10–15 km wide dextral transpressive shear belt crossing the whole of northern Sardinia from Asinara island in the NW to the Posada River Valley in the NE (Cruciani et al. Reference Cruciani, Montomoli, Carosi, Franceschelli and Puxeddu2015). This structure is variably oriented (Fig. 1) from E–W to NW–SE and steeply dips to the south in the NE part (Carosi & Palmeri, Reference Carosi and Palmeri2002). The PAL was originally interpreted as a strike-slip shear zone active in Late Carboniferous time (Elter et al. Reference Elter, Musumeci and Pertusati1990), and later as a wide transpressional shear zone (Carosi & Palmeri, Reference Carosi and Palmeri2002; Iacopini et al. Reference Iacopini, Carosi, Montomoli and Passchier2008; Carosi et al. Reference Carosi, Frassi and Montomoli2009; Frassi et al. Reference Frassi, Carosi, Montomoli and Law2009). Cappelli et al. (Reference Cappelli, Carmignani, Castorina, Di Pisa, Oggiano and Petrini1992) interpreted the PAL as an oceanic suture zone between Armorica and Gondwana because of the occurrence of amphibolitic boudins aligned along it. The amphibolites show a normal mid-ocean ridge basalt (N-MORB) geochemical signature and locally preserve relics of eclogite facies (Oggiano & Di Pisa, Reference Oggiano, Di Pisa and Carmignani1992; Cortesogno et al. Reference Cortesogno, Gaggero, Oggiano and Paquette2004). Recent geochemical constraints attributed the HGMC to the northern margin of Gondwana, confirming the PAL as an intracontinental orogen-parallel shear zone (Giacomini et al. Reference Giacomini, Bomparola, Ghezzo and Guldbransen2006). In situ Ar–Ar dating of white mica (Di Vincenzo et al. Reference Di Vincenzo, Carosi and Palmeri2004) and U–(Th)–Pb dating of monazite (Carosi et al. Reference Carosi, Montomoli, Tiepolo and Frassi2012) constrained the age of the transpressional shearing to between ∼300 Ma and 320 Ma. These authors recognized the presence of two main deformation phases associated with the Variscan tectonic evolution: a regional D1 phase associated with the collisional stage recognizable all across the whole of Sardinia, and a later orogen-parallel D2 phase linked to the transpressive activity. Based on pseudosection calculations, a prograde HP metamorphic signature (1.8 GPa and 460–500 °C) has been recognized by Cruciani et al. (Reference Cruciani, Franceschelli, Massonne, Carosi and Montomoli2013) for the D1, allowing the linking of this phase to prograde metamorphism related to underthrusting and nappe stacking. The age of the D1 is ~330–340 Ma (Di Vincenzo et al. Reference Di Vincenzo, Carosi and Palmeri2004; Carosi et al. Reference Carosi, Montomoli, Tiepolo and Frassi2012). The transition between D1 and D2 represents a change in metamorphic conditions from high pressure to lower pressure with increasing temperature during decompression (Carosi & Palmeri, Reference Carosi and Palmeri2002; Cruciani et al. Reference Cruciani, Franceschelli, Massonne, Carosi and Montomoli2013, Reference Cruciani, Montomoli, Carosi, Franceschelli and Puxeddu2015) followed by decompression and cooling.
2.c. Study area (Baronie Region)
The study area is located within the northern sector of the L–MGMC and comprises part of the garnet + plagioclase zone and the garnet + staurolite + biotite zone, a few kilometres south of the boundary with the HGMC (Fig. 2) where a detailed geological and structural map (at the scale of 1:5000) was compiled.
(a) Geological map of the study area. The central granodioritic orthogneiss antiform separates micaschist with different metamorphic assemblages: garnet + plagioclase + biotite in the southern portion and garnet + staurolite + biotite in the northern area. Lower hemisphere stereographic projections for L2: mineral and object lineations related to D2; A3: fold axes related to F3 folds; S2: poles to the main foliation, S2. (b) N–S geological cross-section of the studied area (see trace A–A' in Fig. 2a). The main deformation style is characterized by N-verging F2 isoclinal folds with steeply S-dipping axial planes in the northern area, and a more gentle S-dipping in the southern area. In the northern area a crenulation belt, related to the D3, is highlighted.
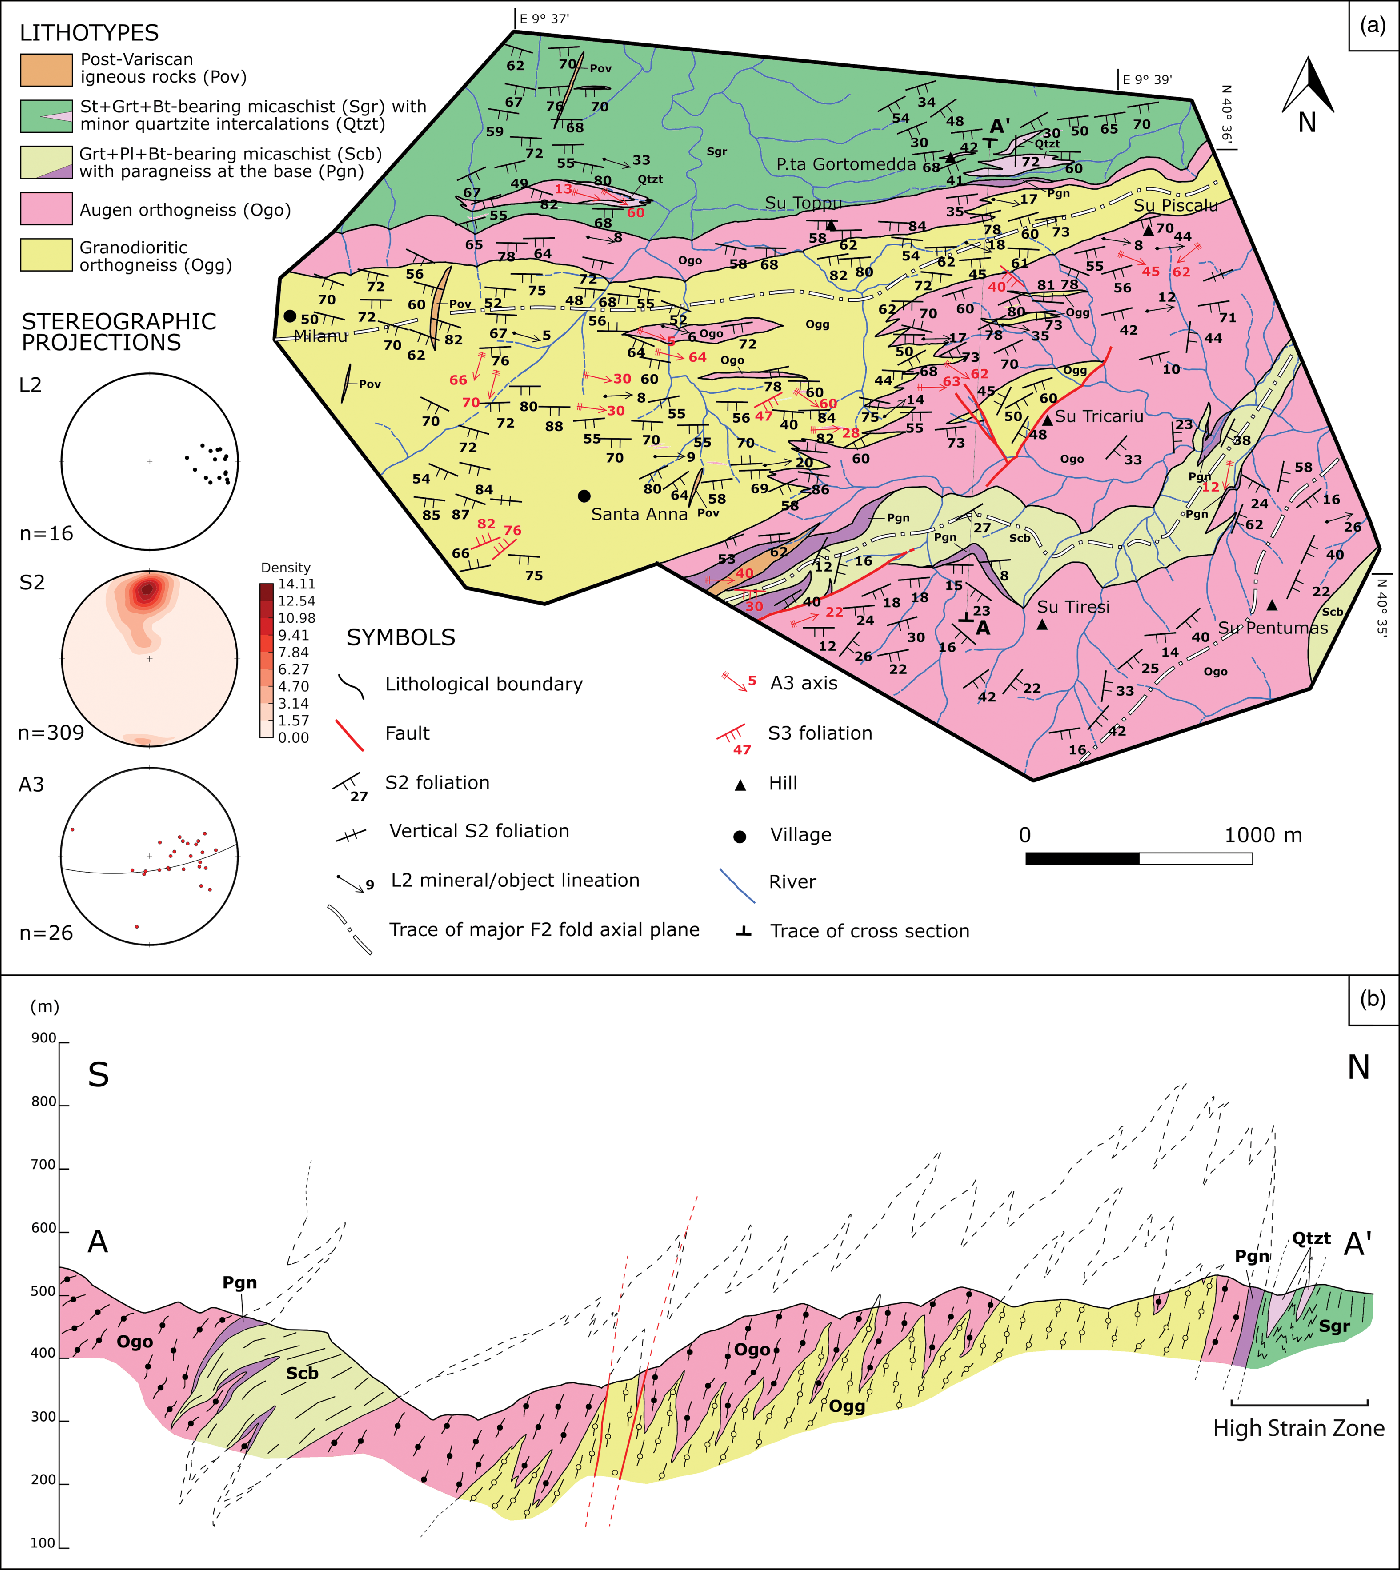
The structural setting is dominated by N–NE-verging regional-scale isoclinal folds with axial planes striking N20–90° and dipping 20–80° to the SE (Fig. 2b). In the core of the antiforms an orthogneiss body crops out with a protolith age of 456 ± 14 Ma (Helbing & Tiepolo, Reference Helbing and Tiepolo2005). It is composed of granodioritic orthogneiss (Fig. 3a) at the base, surrounded by granitic augen orthogneiss (Fig. 3b). The northern area and the cores of the synforms expose Pre-Cambrian (?) to Cambrian micaschist (Fig. 3c, d) with paragneiss and quartzitic lenses (Carmignani et al. Reference Carmignani, Carosi, Di Pisa, Gattiglio, Musumeci, Oggiano and Pertusati1994). In the southern area the micaschist is affected by a low- (garnet + albite) to medium- (garnet + oligoclase) grade metamorphism. The medium-grade metamorphic conditions in the micaschist, cropping out in the northern area, are evident from the garnet + staurolite + biotite metamorphic assemblage.
Main lithotypes in the study area. (a) Biotite-rich granodioritic orthogneiss (coin for scale is 2.3 cm diameter). (b) Augen orthogneiss with K-feldspar porphyroclasts (pencil tip for scale is 3 cm long). (c) Garnet + plagioclase-bearing micaschist (hammer for scale is 32 cm long). (d) Garnet + staurolite + biotite-bearing micaschist (fingernail for scale is ~1.2 cm wide). In some specific areas, S3 crenulation cleavage is affecting, respectively, (e) orthogneiss (compass for scale: visible upper side is ~3.2 cm long) and (f) micaschist (hammer for scale is 30 cm long).

3. Deformation history and structural analysis
On the basis of geological mapping, as well as of detailed meso- and microstructural analyses, five ductile deformation phases, followed by brittle tectonics, have been identified. All microstructural observations have been conducted on thin-sections cut perpendicular to the main foliation and parallel to the mineral lineation to better approximate the XZ section of the finite strain ellipsoid.
The first deformation phase is recognizable mainly at the microscale and it is poorly expressed at the mesoscale. It is represented by a relict foliation, S1, within D2 microlithon domains and by internal foliations, Si, within garnet, staurolite and plagioclase intertectonic porphyroblasts. This phase is related to the syn-kinematic growth of white mica, biotite, feldspar and garnet in the micaschist.
In the study area the prominent deformation event is the second deformation phase (D2), associated with the development of isoclinal folds (F2). The F2 folds have similar geometry (Ramsay, Reference Ramsay1967); they are non-cylindrical, trending N080–090° with axes showing variable plunge, from horizontal in the western area to 30–40° to the east in the eastern area (Fig. 2a). The F2 axial planes (Ap2) strike mostly N080–090°. In the eastern sector they strike N010–020°. The Ap2 dips 70–80° to the south in the northern sector of the area, and 10–20° to the south in the southern sector (Fig. 2b). This variation is owing to the presence of late deformation events (D4 and D5) deforming their original attitude (see below). The main foliation of the study area, S2, shows a mylonitic fabric. Within the orthogneiss, the S2 foliation is a discrete spaced schistosity, marked by the alternation of mica-rich cleavage domains and quartz-feldspathic microlithons. Within the micaschist, S2 varies from a continuous to a spaced foliation. In domains of spaced foliation, the S2 is characterized by anastomosing biotite- and white mica-bearing lepidoblastic layers alternated with lenticular microlithon domains (Fig. 4a, b), where S1 relics are present.
Microstructures associated with the main deformation events present in the study area from the (a–c) early D2 stage to the (d–e) late D2 stage and (f) D3 phase. (a) S-C fabric in garnet + plagioclase-bearing micaschist with S planes composed of biotite and white mica. Dextral sense of shear, corresponding to a top-to-the-W and -NW sense of shear in the field (mylonitic foliation steeply dips to the south) (crossed nicols). (b) Biotite and white mica foliation fish in garnet + staurolite + biotite-bearing micaschist (crossed nicols). (c) Mica fishes (group 1 and 2) in a quartz-rich matrix (ten Grotenhuis et al. Reference ten Grotenhuis, Trouw and Passchier2003) (crossed nicols). (d) Garnet porphyroclast in garnet + plagioclase-bearing micaschist with syn-D2late growth of chlorite in fractures and strain shadows (parallel nicols). (e) C' plane with syn-kinematic growth of chlorite in garnet + plagioclase + biotite-bearing micaschist (parallel nicols). (f) F3 centimetre fold in the granodioritic orthogneiss. Furthermore, it is also possible to note how the D3 event is associated with pressure solution as the main deformation mechanisms (parallel nicols). Mineral abbreviations: Grt – garnet; Qtz – quartz; Wm – white mica; Chl – chlorite; Bt – biotite.

The D2 mylonitic fabric is well recognizable at all scales. Shear sense indicators have been observed only on sections parallel to the XZ plane of the finite strain ellipsoid (i.e. perpendicular to the S2 foliation and parallel to mineral lineation) and they have not been detected on YZ and XY sections.
S-C-C′ structures, mica fishes (mainly of groups 1, 2 and 3 according to the classification of ten Grotenhuis et al. Reference ten Grotenhuis, Trouw and Passchier2003), asymmetric strain shadows around porphyroblasts and oblique foliations point to a dextral sense of shear consistent with the top-to-the-W/NW direction of tectonic transport associated with the PAL (Fig. 4a–e). Elongation of feldspar, garnet and staurolite crystals on the S2 planes form a sub-horizontal L2 mineral/grain and aggregate lineation (average plunge 0–10° to the E).
The M2 metamorphism is related to the syn-kinematic growth of the main mineral assemblages (biotite + white mica + garnet + plagioclase + quartz in the southern sector and biotite + white mica + garnet + staurolite + quartz in the northern sector). A late syn-kinematic growth of chlorite on the late shearing planes (mainly C′ planes and shear bands), in the strain shadows around garnet (Fig. 4d, e) and filling fractures in garnet and staurolite has been recognized. This retrogression is present in the studied transect and highlights a progressive decrease in metamorphic grade during D2, starting from lower amphibolite to greenschist facies. Interlobate to ameboidal grain boundaries in quartz ribbons are consistent with grain boundary migration (GBM) recrystallization (Stipp et al. Reference Stipp, Stünitz, Heilbronner, Schmid, De Meer, Drury, De Bresser and Pennock2002a,b; Law, Reference Law2014).
The presence of finer equigranular quartz grains along the grain boundaries suggests superposition of subgrain rotation (SGR) recrystallization, which heterogeneously reworks and overprints the GBM microstructures in all the studied samples (Fig. 5a–c). Although SGR occurs in all of the study area, in the N–S transect the intensity of SGR varies from incipient in the southern sector (Fig. 5a) to pervasive in the northern sector, where core and mantle structures (Fig. 5b) or nearly complete recrystallization (Fig. 5c) are present.
General overview of syn-D2 quartz microstructures recognized in the study area along samples collected at different distances from the high strain zone of the PAL (i.e. boundary between L–MGMC and HGMC). (a) Southern sector of the study area: quartz microstructures are dominated by GBM recrystallization with incipient SGR. Sb represents the oblique foliation due to the shape preferred orientation (SPO) of quartz aggregates (crossed nicols). (b) Central sector of the study area: SGR microstructures are more developed (crossed nicols). (c) In the northern sector of the study area, close to the high strain zone, the SGR process is pervasive and completely obliterates GBM microstructures (crossed nicols). (d) Plastic deformation in quartz within the hinge zone of an F3 fold where the SPO of quartz crystals is parallel to the S3 foliation (crossed nicols).

The D3 phase is characterized by a heterogeneous deformation localized in E–W-trending lenticular domains developed at the hectometric scale. Here an S3 crenulation cleavage (Fig. 3e, f), linked to centimetric- to hectometric-scale F3 similar folds (Ramsay, Reference Ramsay1967) occurs (Fig. 4f). F3 axial planes (Ap3) and S3 foliation are parallel to S2 mylonitic foliation. F3 folds have a non-cylindrical geometry, and the plunge of the A3 axes varies from sub-vertical to a few degrees to the east. The parallelism between the S2 and S3 foliation planes, and the scattering of the A3 axes along the S2 great circle (Fig. 2a) on the stereographic projection, point to a similar geometry and kinematics of deformation during the D2 and D3 phases. At the microscale, the S3 is a crenulation cleavage characterized by pressure solution and by a shape preferred orientation (SPO) of quartz aggregates (Fig. 5d). Pressure solution and quartz deformation mechanisms acting during the D3 phase suggest shallower conditions with respect to the D2 phase.
The D4 deformation event is detectable only at the map scale by the occurrence of gentle kilometric folds. The F4 folds cause the variation of S2 strike from N080–090° up to N000–010° (Fig. 2a). The F4 axial planes (Ap4) strike about N135°/55° NE while the A4 axes trend N105°, plunging 35° to the SE. No axial plane foliation is observed parallel to the F4 axial planes.
The D5 deformation phase is characterized by meso- to map-scale folds. The F5 folds have a gentle to close geometry with a sub-horizontal axial plane and N88°-trending axes slightly plunging to the east. The variation in the dip of the S2 mylonitic foliation is due to later F5 folds producing type 3 interference structures when overprinting the F2 folds (Fig. 2b). Foliations and lineations related to the D5 phase have not been detected in the study area. This observation, coupled with the absence of mineral growth or related microstructures, suggests that D5 took place at shallow structural levels. The D5 phase has been associated with the late exhumation related to the final collapse of the Sardinian Variscan Belt (Carmignani et al. Reference Carmignani, Carosi, Di Pisa, Gattiglio, Musumeci, Oggiano and Pertusati1994).
Evidence of brittle deformation is poorly represented in the study area. In the southeastern portion of the study area (Fig. 2a), conjugated normal faults have been detected. They strike N045° and N155° and steeply dip, respectively, to the NW and NE (Fig. 2a).
4. EBSD analysis and quartz petrofabric
4.a. Methods
Of the 39 rock specimens (Fig. 6) used for the microstructural analysis, ten representative samples of the main lithotypes were selected to investigate the rheological behaviour of quartz during the deformation. On these samples we performed image analyses using the software ImageJ (ver: 1.47v by Wayne Rasband).
Geological sketch map of the Baronie region showing sample dataset and location of the samples selected for specific analyses (modified from Carosi et al. Reference Carosi, Frassi, Iacopini and Montomoli2005). Abbreviations: Sil – sillimanite; Ky – kyanite; St – staurolite; Grt – garnet; Pl – plagioclase; Bt – biotite.

For each specimen, several statistics images away from quartz ribbon areas (Fig. 7) were processed to estimate the amount of quartz in the matrix. All the analysed samples show a modal abundance of quartz in the matrix ranging between 24 % and 81 % (Fig. 8; Table 1). Following a microstructural analysis on the complete dataset and the modal estimates, three quartz-rich samples were selected for the CPO study.
Examples of quartz (Qtz) modal analysis on rock specimens homogeneously distributed along the studied transect. In all the analysed samples, quartz (white in processed figures) represents an important volumetric phase in the rocks and it is typically distributed in interconnected granoblastic layers (see Table 1 for the complete dataset and Fig. 6 for sample locations).

Localization of the acquired EBSD maps on the analysed samples (crossed nicols). Black boxes indicate the representative maps chosen for Figure 9. White boxes indicate the other areas where EBSD data have been acquired to reach a statistical number of points to build the pole figures in Figure 9.

Modal abundance of quartz along the study transect (see Fig. 6 for sample locations)

* The structural distance refers to the relative position with respect to the boundary between the HGMC and L–MGMC.
These samples contain polycrystalline quartz ribbons recrystallized during the D2 phase (Fig. 8). The analysed samples were selected at different distances from the high-strain zone (Fig. 7) within the three main lithotypes occurring in the study area: SCB006R from the garnet + plagioclase zone (southern area); OGO026R from the augen orthogneiss zone (central area); and SGR031R from the garnet + staurolite + biotite zone (northern area) (Fig. 6). The electron backscatter diffraction (EBSD) analysis was performed on selected areas representative of the SGR recrystallization domains, related to the late D2 phase, in order to better constrain the late-D2 deformation event (Fig. 8).
EBSD analysis was performed on carbon-coated polished thin-sections using a JEOL 6610 scanning electron microscope (SEM) at the Plymouth University Electron Microscopy Centre, with the following working conditions: acceleration voltage of 20 kV, high vacuum and 70° sample tilt. EBSD patterns were acquired on rectangular grids ~6–9 mm2 in size (Fig. 8), with an electron beam step-size of 3.5–5.0 µm.
The bulk CPO data have been represented with pole figures of the main crystallographic elements of quartz: c axis <0001>, a axes {11–20} and m planes {10–10}. The orientation data have been plotted as one point per grain. The EBSD results have also been shown as inverse pole figure (IPF) crystallographic maps to visualize the spatial distribution of the CPO domains (Fig. 9).
(a) Quartz EBSD data from the analysed samples (for sample locations see Fig. 8). The colours of the example IPF figures on the left and the pole figures are in reference to the Z axis of the finite strain (pole of the main foliation). Black lines are high-angle boundaries (misorientation >10°), fuchsia lines are low-angle boundaries (misorientation 3–10°) and red lines are Dauphiné twin boundaries (misorientation of 60° around the c axis). The orientation in the pole figures data has been plotted as one point per grain. (b) Legend for the quartz IPF map, showing the main quartz crystallographic directions with different colours. (c) Interpreted quartz c-axes <0001> patterns of the studied samples. OA – opening angle; β – angle between the mylonitic foliation and the orthogonal plane of the quartz c-axes central girdle.

4.b. Crystallographic preferred orientation data
The distribution of the quartz c axes is similar for the three analysed samples. Both SCB006R and SGR031R have a type-1 crossed girdle transitional to single girdle distribution (Fig. 9a, c) (Lister & Hobbs, Reference Lister and Hobbs1980; Schmid & Casey, Reference Schmid, Casey, Hobbs and Heard1986; Passchier & Trouw, Reference Passchier and Trouw2005, p. 104; Toy et al. Reference Toy, Prior and Norris2008). OGO026R presents an incomplete c-axes distribution owing the larger grain size compared to the other samples. Type-1 crossed girdle distributions suggest a plane strain deformation (Lister & Hobbs, Reference Lister and Hobbs1980; Schmid & Casey, Reference Schmid, Casey, Hobbs and Heard1986). The asymmetry of the distribution points to a non-coaxial regime (Law, Reference Law, Knipe and Rutter1990; Passchier & Trouw, Reference Passchier and Trouw2005, p. 105) with a top-to-the-W sense of shear, in agreement with independent kinematic indicators (see above) and consistent with the D2 phase. Despite the incomplete data, a type-1 crossed girdle distribution is still recognizable.
The pole figures and the IPF maps are consistent with the dominant activity of the rhomb<a> slip system, with a lesser contribution of prism<a> and basal<a> (Fig. 9a, b) (Toy et al. Reference Toy, Prior and Norris2008; Fazio et al. Reference Fazio, Punturo, Cirrincione, Kern, Pezzino, Wenk, Goswami and Mamtani2017; Hunter et al. Reference Hunter, Weinberg, Wilson and Law2018). These data, under typical geological conditions for H2O content and geological strain rate, suggest a deformation temperature in the upper greenschist facies (e.g. Passchier & Trouw, Reference Passchier and Trouw2005, p. 57; Toy et al. Reference Toy, Prior and Norris2008). Deformation temperatures (Td) have been estimated using the relationship between Td and the opening angle (OA) of the c-axes distribution (Fig. 9c) (Kruhl, Reference Kruhl1998; Morgan & Law, Reference Morgan and Law2004; Law, Reference Law2014) with the most recent, pressure sensitive, calibration proposed by Faleiros et al. (Reference Faleiros, Moraes, Pavan and Campanha2016):
 $${\rm{Td}} = {\rm{}}410.44\ {\rm{ln}}\left( {{\rm{OA}}} \right){\rm{}} + {\rm{}}14.22{\rm{P}} - {\rm{}}1272$$
To estimate the Td with this relationship, an external pressure constraint (P) is necessary. In this work, the P constraint has been obtained from the data of Carosi & Palmeri (Reference Carosi and Palmeri2002), who estimated a pressure of 0.7 GPa for the D2 peak. Moreover, considering that the late recrystallized areas developed under retrograde greenschist facies, the rocks deformed during the late D2 phase were likely under lower pressure conditions compared to the peak conditions. For this reason, a more realistic P of 0.5 GPa has been also assumed (based on P–T paths of Carosi & Palmeri, Reference Carosi and Palmeri2002) for the calculations. The estimated temperatures at the corresponding P of 0.5 GPa for SCB006R and SGR031R are 400 ± 50 °C and 390 ± 50 °C, respectively. The estimations for OGO026R were not possible owing to the incomplete nature of the c-axes distribution. These temperatures estimated using 0.5 GPa as the pressure constraint do not present a significant deviation (less than 30 °C) from those obtained at the corresponding pressure of 0.7 GPa. These data do not show large variations from the Td values obtained by the original Kruhl (Reference Kruhl1998), as modified by Morgan & Law (Reference Morgan and Law2004), calibration. The results obtained by the different calibrations and pressure values are well within the error range of the method (± 50°; see also Law, Reference Law2014). The Td data are consistent with the estimated greenschist-facies conditions, and indicate a homogeneous deformation temperature in the study area along the N–S transect, as also supported by the late syn-D2 greenschist minerals.
4.c. Kinematic vorticity data
The kinematic vorticity represents the magnitude of the kinematic vector, which the material lines tend to rotate around during flow deformation (Xypolias, Reference Xypolias2010 and references therein). The kinematic vorticity number (indicated as Wn, for single deformation increments) is identified by the cosine of the angle between the two flow apophyses. Kinematic vorticity is an estimate of the relative contribution of pure and simple shear components during the flow.
Quartz CPO data have been used to estimate the components of simple and pure shear of the flow kinematic during the late D2 deformation increments (Wallis, Reference Wallis1995; Law et al. Reference Law, Searle and Simpson2004, Reference Law, Mainprice, Casey, Lloyd, Knipe, Cook, Thigpen, Law, Butler, Holdsworth, Krabbendam and Strachan2010, Reference Law, Jessup, Searle, Francsis, Waters and Cottle2011, Reference Law, Stahr Iii, Francsis, Ashley, Grasemann and Ahmad2013; Xypolias, Reference Xypolias2010). This estimate has been performed by calculating the sectional kinematic vorticity number (Wn) on recrystallized quartz domains using the β/δ method (Fig. 10) proposed by Xypolias (Reference Xypolias2010) (see also Wallis, Reference Wallis1995), where:
 $${\rm{Wn}} = {\rm{sin}}\left[ {2\left( {{\rm{\delta }} + {\rm{\beta }}} \right)} \right]{\rm{}}$$
Schematic representation of the β/δ method (Xypolias, Reference Xypolias2009, Reference Xypolias2010), applied in the current study, in order to estimate the sectional kinematic vorticity number (Wn) by studying the CPO and SPO of a deformed quartz ribbon. (a) δ is the angle between the mylonitic foliation and the maximum oblique foliation (Sb) in quartz aggregates (microphotograph, crossed nicols, sample SGR031R), (b) while β is the angle between the mylonitic foliation and the orthogonal plane of the quartz c-axes central girdle. (c) Representation of instantaneous and finite elements of flow in Mohr space, with the stretching rate (s) as the horizontal axis and the angular velocity (ω) as the vertical axis; δ represents the angle between the foliation and the instantaneous stretching axis ISA2 while β represents the angle between the foliation and the flow apophysis A2 (modified from Xypolias, Reference Xypolias2010).

In this equation, β is the angle between the main foliation and the plane normal to the quartz c-axes distribution (Figs 9c, 10b), while δ is the highest angle between the main foliation and the SPO foliation of quartz aggregates (Fig. 10a, b). δ has been derived from a range of angles measured via optical microscopy (Fig. 5a).
This method is based on the relationship between the simple shear component and the angle between the flow apophysis, A2, highlighted by the orientation of the quartz CPO and the instantaneous stretching axis, ISA2, represented by the oblique foliation. Showing the main flow elements in the Mohr space (Fig. 9c), the Wn can be obtained by the sine of the angle between A2 and ISA2. The kinematic vorticity estimations (Fig. 11) provided Wn = 0.99–1.00 for SCB006R, Wn = 0.91–1.00 for OGO026R and Wn = 0.99–1.00 for SGR031R. The obtained Wn values point to very high components of simple shear for all samples.
Comparison between kinematic vorticity data obtained in this work and previous estimates in the same area (left, see Fig. 6 for sample locations) and along the whole PAL profile. Kinematic vorticity data, resulting from the quartz CPO analysis in this work, is higher than the previous data obtained by previous authors both using the quartz-based petrofabric (Frassi et al. Reference Frassi, Carosi, Montomoli and Law2009) and other vorticity gauges (Carosi & Palmeri, Reference Carosi and Palmeri2002; Carosi et al. Reference Carosi, Frassi, Iacopini and Montomoli2005; Iacopini et al. Reference Iacopini, Carosi, Montomoli and Passchier2008).

4.d. Palaeopiezometry and strain rate
Following the pioneering analysis of Twiss (Reference Twiss and Wyss1977) it has been suggested that the grain size of recrystallized grains is a primary function of the applied flow stress, representing the theoretical base of palaeopiezometry (Behr & Platt, Reference Behr and Platt2011, Reference Behr and Platt2013, Reference Behr and Platt2014; Menegon et al. Reference Menegon, Nasipuri, Stünitz, Behrens and Ravna2011; Boutonnet et al. Reference Boutonnet, Leloup, Sassier, Gardien and Ricard2013). The grain-size distribution of the analysed quartz aggregates (Fig. 12a) was derived for each sample with the aid of the EBSD data. These distributions have been used to estimate the flow stress acting during the recrystallization process related to the late D2 activity of the PAL. For this purpose, we used the recrystallized grain-size palaeopiezometer for quartz proposed by Stipp & Tullis (Reference Stipp and Tullis2003) for the recrystallization regime 2/3, where:
 $${\rm{D}} = {\rm{}}3631{\rm{\Delta }}{{\rm{\sigma }}^{ - 1,26}}$$
(a) Quartz grain-size distributions for the selected sample. See Figure 6 for sample locations. The grain-size intervals used for palaeopiezometry have been picked out from the total distribution, selecting the D2late new grains formed by SGR, which represent the finest population of grains for each sample. (b) Results of strain rate (s−1) estimations from the analysed samples using the different quartz flow law calibrations in the dislocation creep regime. A consistent trend of increasing strain rates towards the N (i.e. from sample SCB006R to sample SGR031R) is evident.

With this relationship, the flow stress (Δσ) can be obtained from the average recrystallized grain diameter (D). The calculated values were: D = 34 ± 16 µm and σ = 41 ± 18 MPa for SCB006R; D = 25 ± 6 µm and σ = 53 ± 11 MPa for OGO026R; and D = 16 ± 4 µm and σ = 74 ± 16 MPa for SGR031R, showing an increase in flow stress moving from the southern to the northern sectors of the study area, along a N–S transect of the PAL. The flow stress data have been used to calculate the strain rate ( ${\dot{\varepsilon}}$
) with the wet-quartzite flow law:
${\dot{\varepsilon}}$
) with the wet-quartzite flow law:
 $${\rm{\dot{\varepsilon}}}{\rm{}} = {\rm{A\Delta }}{{\rm{\sigma }}^{\rm{n}}}{\left( {{\rm{f}}{{\rm{H}}_2}{\rm{O}}} \right)^{\rm{m}}}\ {{\rm{e}}^{ - {\rm{Q}}/{\rm{RT}}}}$$
For the strain rate estimation, a temperature constraint (T) is necessary. The T values used in this work have been obtained from the opening angle of the c-axes distribution (Law, Reference Law2014) as described above. A water fugacity (fH2O) of 12.25 MPa was calculated using the water fugacity coefficient listed in Tödheide (Reference Tödheide and Franks1972) for T = 400 °C and P = 0.5 GPa. Different experimental calibrations for the wet-quartzite flow law have been proposed in the literature (see Table 2, where: A, n and m are experimentally calculated parameters that change for each calibration and R is the ideal gas constant), and they led to dissimilar strain rate estimations (Menegon et al. Reference Menegon, Nasipuri, Stünitz, Behrens and Ravna2011; Boutonnet et al. Reference Boutonnet, Leloup, Sassier, Gardien and Ricard2013; Montomoli et al. Reference Montomoli, Iaccarino, Simonetti, Lezzerini and Carosi2018).
Available calibrations for the wet-quartzite flow law and associated experimentally derived flow law parameters*

* Q – activation energy; A – material parameter; m – water fugacity exponent; n – stress exponent.
The results of the different calibrations used in this paper are summarized in Figure 12b. Strain rate estimations cover a wide range, spanning from 10−16 to 10−11 s−1 (including the uncertainties due to the propagation of the error on temperature and flow stress). Although the strain rates estimated using different flow laws are different, they coherently indicate an increasing trend of ε moving from south to north (Fig. 12b). Among the different calibrations for the quartzite flow law, the one proposed by Hirth et al. (Reference Hirth, Teyssier and Dunlap2001) has been selected since, according to Behr & Platt (Reference Behr and Platt2013, Reference Behr and Platt2014), it is considered the most realistic (see also Boutonnet et al. Reference Boutonnet, Leloup, Sassier, Gardien and Ricard2013 for a discussion on this topic). The estimated strain rate values are in the range of 10−13 to 10−12 s−1 (Fig. 12b).
Comparable strain rate results have been reported for the mid crustal shear zone from different areas such as the Betic Cordillera of southern Spain (Behr & Platt, Reference Behr and Platt2013), the Rodope Massif in Greece (Fazio et al. Reference Fazio, Ortolano, Visalli, Cirrincione, Fiannacca, Memgel, Pezzino and Punturo2018), the Kabilo–Calabride crystalline basement in southern Italy (Ortolano et al. Reference Ortolano, Fazio, Visalli, Alsop, Pagano and Cirrincione2020) and the Chelmos Shear Zone in the External Hellenides (Xypolias & Koukouvelas, Reference Xypolias and Koukouvelas2001).
5. Discussion
5.a. Structural evolution
Our field, meso- and microstructural data document a complex polyphase tectono-metamorphic evolution of the Sardinian Variscan Belt after the collisional stage. The PAL activity is confirmed to be related to the D2 phase, during which micaschist and orthogneiss are deformed under amphibolite-facies conditions, coeval with a non-coaxial dextral transpressive shearing (Carosi & Palmeri, Reference Carosi and Palmeri2002). The syn-kinematic growth of chlorite, in strain shadows and along the C′ planes (Fig. 4e), is consistent with a metamorphic retrogression towards greenschist facies during the evolution of the late D2 phase. The syn-kinematic growth of chlorite during the D2 phase, at the expense of biotite and garnet, supports the presence of H2O-rich fluids during this phase.
The D3 phase developed heterogeneously in the study area. The parallelism of the structural elements between the D2 and D3 deformation phases allows the D3 to be interpreted as an evolution of the D2 phase linked to the latest deformation increments of the PAL. The D2–D3 transition could be related to a strain hardening due to shallower metamorphic conditions with strain localization and deformation concentrated in parallel crenulated domains (Fig. 13).
Simplified reconstruction of the structural evolution of the L–MGMC during the transpressive tectonics linked to the PAL. The transpression developed in a pure shear dominated general flow during the D2early and evolved into a simple shear dominated flow during the D2late. The D2late deformation is characterized by an increasing strain gradient moving towards the core of the PAL. During the D3 phase, the last deformation increments may have been accommodated by the development of crenulation cleavage, and related plunging upright folds. For the D2early and the D2late events the position and the angle between the flow apophyses (A1 and A2) has been inferred from the kinematic vorticity data. As the kinematic vorticity increases, the angle between the apophyses decreases.

The absence of metamorphic assemblages related to the D4 and D5 phases points to a further T decrease associated with the deformation of the L–MGMC at shallower structural levels.
5.b. Quartz deformation
The important role of quartz in governing the rheology of the analysed rocks is evidenced by the modal abundance of this phase. The modal estimations show a quartz percentage range of 24 to 81 % (Table 1), reaching the minimum abundance (Fig. 7) to be considered the strain-supporting phase in each specimen (~20 % according to Handy, Reference Handy1990). A quartz-dominated rheology allowed us to consider the CPO analysis, performed on quartz ribbons, reliable at the larger scale.
At fluid-present conditions and at geological strain rates (Law, Reference Law2014), microstructures in quartz related to GBM recrystallization are generally indicative of dislocation creep deformation under amphibolite-facies metamorphic conditions (Stipp et al. Reference Stipp, Stünitz, Heilbronner, Schmid, De Meer, Drury, De Bresser and Pennock2002a,b). The transition from GBM to SGR can be related to several factors: a variation in deformation temperature, a decrease in water content or an increase in strain rate (Stipp et al. Reference Stipp, Stünitz, Heilbronner, Schmid, De Meer, Drury, De Bresser and Pennock2002a,b; Menegon et al. Reference Menegon, Pennacchioni, Heilbronner and Pittarello2008, Reference Menegon, Nasipuri, Stünitz, Behrens and Ravna2011; Law, Reference Law2014 and references therein). On the other hand, assuming no significant variations in water content and strain rate, SGR recrystallization (Fig. 5a–c) suggests a dislocation creep regime under a lower deformation temperature with respect to GBM (Stipp et al. Reference Stipp, Stünitz, Heilbronner, Schmid, De Meer, Drury, De Bresser and Pennock2002a,b; Passchier & Trouw, Reference Passchier and Trouw2005; Law, Reference Law2014). The dextral sense of shear, testified to by the orientation of the oblique foliation, highlighted by quartz grains recrystallized by SGR fits well with the dominant sense of shear during the activity of the PAL. The syn-kinematic growth of retrograde assemblages, including chlorite along the C′ planes (Fig. 4c, e), suggests a continuation of the PAL activity from higher to lower temperatures. This transition is testified to also by the quartz c-axis opening angle that points to lower temperatures compared to the peak conditions associated with the D2 (see Carosi & Palmeri, Reference Carosi and Palmeri2002; Di Vincenzo et al. Reference Di Vincenzo, Carosi and Palmeri2004). For these reasons we infer that the superimposition of SGR is related mainly to a syn-shearing temperature decrease. In this framework, according to the structural and metamorphic evidence discussed above, a complex (and long-lasting) evolution of the D2 phase has been inferred. The D2 deformation phase is subdivided in two stages: an early D2early stage associated with the thermal D2 peak, and a late D2late stage as part of the retrograde exhumation path with decreasing temperatures. The variation in quartz dislocation creep regime from GBM to SGR is linked to a temperature decrease, and the acquisition of CPO data on the areas affected by SGR recrystallization allowed the constraining of the conditions of the D2late deformation increments. The temperature of nearly 400 °C, derived from the c-axes opening angle, is consistent with the greenschist-facies metamorphism and suggests a thermal homogenization during the late stages of D2.
The kinematic vorticity analysis performed on recrystallized quartz aggregates resulted in high Wn values (0.91–1.00) indicative of a simple shear dominated flow (Fig. 11). Previous studies (Carosi & Palmeri, Reference Carosi and Palmeri2002; Carosi et al. Reference Carosi, Frassi, Iacopini and Montomoli2005) pointed out a pure shear dominated flow in the same study area (Wm = 0.30–0.70), estimated using the stable porphyroclasts method (Passchier, Reference Passchier1987; Wallis et al. Reference Wallis, Platt and Knott1993; Xypolias, Reference Xypolias2010). A possible explanation for these different results could be found in the different methods applied to the estimation of the kinematic vorticity values. It is necessary to take into account the different strain memory of the quartz recrystallization with respect to the porphyroclasts (Wallis, Reference Wallis1995; Xypolias, Reference Xypolias2009, Reference Xypolias2010). Carosi & Palmeri (Reference Carosi and Palmeri2002) and Carosi et al. (Reference Carosi, Frassi, Iacopini and Montomoli2005) applied the stable porphyroclasts method using K-feldspar and plagioclase porphyroclasts, crystallized before the D2 phase and experiencing a rigid-clast behaviour during the PAL shearing. Competency contrast could be responsible for strain partitioning (Goodwin & Tikoff, Reference Goodwin and Tikoff2002), so that some minerals, such as, for example, K-feldspar, with a different viscosity than quartz, could partition different kinematic (coaxial versus non-coaxial) and rheological (brittle versus viscous) components of the bulk deformation. On the other hand, quartz microstructures and CPO have a shorter strain memory (Xypolias, Reference Xypolias2009, Reference Xypolias2010) and better record the late deformation increments, especially in our case study, where the later SGR recrystallization areas were selected for the EBSD analysis. From the comparison of the data acquired by the two different methods, likely related to different stages of the transpression, it is possible to better reconstruct the kinematic evolution of the PAL, which was dominated by pure shear during the early deformation stages and by simple shear in the late deformation increments (Fig. 13).
Other transpressive systems, showing a bulk non-coaxial deformation, with a deformation regime evolving from a pure shear dominated transpression to a simple shear dominated transpression, have been documented by Carreras et al. (Reference Carreras, Czeck, Druguet and Hudleston2010).
5.c. Consideration of the exhumation mechanism
Shear zones are common features in deforming rocks and occur at all scales from the millimetre scale to the kilometre scale (Fossen & Cavalcante, Reference Fossen and Cavalcante2017). Whereas most of the studies have focused on metre- to hectometre-scale shear zones, comparatively fewer studies are available for regional-scale shear zones and on the consequences on the P–T–t paths of the deformed rocks. In the Himalayas, a regional-scale (thrust-sense) shear zone running for more than 1000 km along-strike, the High Himalayan Discontinuity (Montomoli et al. Reference Montomoli, Iaccarino, Carosi, Langone and Visonà2013, Reference Carosi, Cruciani, Franceschelli and Montomoli2015), affected the tectonic and metamorphic evolution of the metamorphic core of the belt for more than 10–15 Ma (Carosi et al. Reference Carosi, Montomoli and Iaccarino2018).
Analogously, the PAL is an example of a (transpressive) crustal-scale shear zone that affected the inner portion of the Variscan Belt for several hundred kilometres (from Sardinia–Corsica and the Maures massif up to the External Massifs of the Alps: Corsini & Rolland, Reference Corsini and Rolland2009; Simonetti et al. Reference Simonetti, Carosi, Montomoli, Langone, D’Addario and Mammoliti2018 with references) for more than c. 20 Ma (Carosi et al. Reference Carosi, Montomoli, Tiepolo and Frassi2012; Simonetti et al. Reference Simonetti, Carosi, Montomoli, Langone, D’Addario and Mammoliti2018), and it efficiently exhumed the deeper portions of the belt from medium-temperature up to low-temperature conditions, playing a primary role in the tectonic end-metamorphic evolution of the Variscan Belt. Considering the overall development of the PAL and its prosecution in the External Crystalline Massifs of the Alps, this first-order shear zone is a major zone of weakness in the crust, and it allowed further localization of the deformation during the first stages of the Alpine cycle (Bergomi et al. Reference Bergomi, Dal Piaz, Malusà, Monopoli and Tunesi2017; Ballevre et al. Reference Ballevre, Manzotti and Dal Piaz2018).
The PAL has a sub-horizontal or gently plunging (L2) stretching lineation and sub-vertical foliation, and the exhumation could be expected to be driven by a nearly horizontal extrusion (e.g. Tikoff & Fossen, Reference Tikoff and Fossen1993; Schulmann et al. Reference Schulmann, Thompson, Lexa and Ježek2003; Iacopini et al. Reference Iacopini, Carosi, Montomoli and Passchier2008). On the other hand, mylonite in a transpressive zone could be affected by vertical movement of the rock flow. This case, where pure and simple shear are active coevally during deformation, is typically related to a vertical stretching lineation during the whole deformation history or caused by the flipping of an originally shallowly plunging lineation to a vertical attitude (Tikoff & Fossen, Reference Tikoff and Fossen1993; Schulmann et al. Reference Schulmann, Thompson, Lexa and Ježek2003; Iacopini et al. Reference Iacopini, Carosi, Montomoli and Passchier2008). However, in simple shear dominated transpression, in the case of vertical extrusion, horizontal lineation can be preserved (Iacopini et al. Reference Iacopini, Carosi, Montomoli and Passchier2008). It is worth noting that in the study sector of the PAL, the kinematic flow was dominated by simple shear only during the latest D2 increments. The L2 is marked by feldspars, quartz and syn-D2early porphyroblasts of garnet and staurolite. During the D2early phase, the kinematic flow was in general shear condition with a sub-horizontally directed simple shear component (Carosi & Palmeri, Reference Carosi and Palmeri2002). A major component of pure shear is not compatible with the development of a horizontal lineation in the case of vertical flow, and for this reason the occurrence of a vertical extrusion during the whole duration of PAL activity is unlikely. Considering the high Wn value, close to simple shear, recorded for the D2late phase, the horizontal lineation related to this phase could be developed in both horizontal or vertical extrusion regimes. The structural data relative to the D2 phase are compatible with two different hypotheses of tectonic evolution: (i) a constant horizontal or slightly oblique extrusion or (ii) a composite evolution with horizontal extrusion in the D2early and vertical extrusion in the D2late phases.
5.d. Strain partitioning during the late D2 stage
As previously mentioned, the superposition intensity of SGR (D2late) microstructures over the older GBM (D2early) fabric in quartz aggregates increases moving from south to north in the study area, reaching the highest intensity approaching the core of the PAL. Considering that the deformation temperature during D2late was nearly homogeneous along the N–S study transect, as suggested by syn-kinematic minerals and opening angle thermometry, the increase in SGR intensity cannot be attributed to a (significant) temperature variation. On the contrary, petrofabric data suggest that the strain rate spatially increases moving to the north from ~10−13 s−1 to ~10−12 s−1 according to the Hirth et al. (Reference Hirth, Teyssier and Dunlap2001) flow law (Fig. 12b). Thus, we can infer that strain rate variations played an important role in the microstructural evolution of quartz during SGR recrystallization in this area (Hobbs, Reference Hobbs and Wenk1985; Passchier & Trouw, Reference Passchier and Trouw2005).
The grain-size palaeopiezometry and strain rate estimates, performed on the analysed samples, can be compared with other data available in the literature for the Sardinian Variscan Belt (e.g. Casini et al. Reference Casini, Funedda and Oggiano2010; Casini & Funedda, Reference Casini and Funedda2014; Montomoli et al. Reference Montomoli, Iaccarino, Simonetti, Lezzerini and Carosi2018). According to these authors, the strain rates increase moving from south to north, ranging from ~1016 s−1 to ~10−15 s−1 in the Foreland Zone to ~10−15 s−1 to ~10−13 s−1 in the Nappe Zone and ~1013 s−1 to ~10−11 s−1 in the Inner Zone.
The strain rate proposed in this work is closely comparable to the results obtained by Casini et al. (Reference Casini, Funedda and Oggiano2010) in the same area of the orogen. These estimations also exceed the value of 10−14 s−1 proposed as a typical geological strain rate (Pfiffner & Ramsay, Reference Pfiffner and Ramsay1982; Passchier & Trouw, Reference Passchier and Trouw2005). Nevertheless, it is worthwhile to consider the discussion recently opened by Fagereng & Biggs (Reference Fagereng and Biggs2019) where they postulate on the underestimation of 10−14 s−1 as a typical strain rate value.
6. Conclusions
Data from geological mapping and structural analysis, at different scales, allowed the constraint of the tectonic evolution of the northern sector of the Variscan Belt in Sardinia within the L–MGMC close to the PAL. The PAL is regarded as an orogen-parallel transpressional shear zone that drove the exhumation of the Sardinian metamorphic complexes. In the northern L–MGMC, the shearing event is represented by the D2 phase, which started to be active close to the metamorphic ‘peak’, under amphibolite-facies conditions (D2early), and lasted up to greenschist-facies conditions during the D2late event. The transpressive tectonics related to the PAL continued during the D3 phase under even shallower crustal conditions. The shift in metamorphic conditions caused strain partitioning along the mylonitic belt, giving rise to shear zone-parallel discontinuous domains characterized by the folding of S2 foliation (Fig. 13).
Quartz petrofabrics, together with microstructural data, suggest that the transition from D2early to D2late has been characterized by:
-
(1) a nearly thermal homogenization at ~400 °C where a shift in the dynamic recrystallization mechanisms in quartz aggregates, from GBM to SGR, is documented. The SGR overprinting microstructures are incipiently developed in the southern area and gradually become more pervasive moving into the northern area;
-
(2) an increase in the simple shear component during deformation, ranging from pure shear to simple shear dominated transpression (Fig. 13).
Comparing the structural analysis data with the available kinematic vorticity estimates, based on different vorticity gauges, it is possible to infer that the PAL, in the study area, led to a tectonic evolution characterized by horizontal extrusion or, alternatively, by a horizontal extrusion occurring during the D2early phase followed by a vertical extrusion coeval with the D2late phase. With the present data it is not possible to verify the latter hypothesis and to clarify the kinematics of the late mylonitic flow of the PAL, and further investigations are needed.
The flow stresses and the strain rates suggest an increase in these two parameters moving closer to the core of the PAL. This variation is in agreement with the presence of the superimposition of the SGR recrystallization mechanism in quartz in the northern sector.
The new data support a framework in which a single long-lasting, crustal-scale shear zone, once formed at depth, is able to continue to localize deformation and to drive the exhumation of the inner portions of the belt towards lower P–T conditions. This shear zone, continuing in other portions of the Southern Variscan Belt, was active until the end of the Variscan Orogeny and acted as a weak zone reactivated during the later Alpine tectonics.
Acknowledgements
The staff at the Plymouth University Electron Microscopy Centre is thanked for support during EBSD analysis. Funding: PRIN 2015 (University of Torino: R. Carosi and C. Montomoli); funds Ricerca Locale University of Torino (ex-60%, R. Carosi and S. Iaccarino); PRA 20018_41 to C. Montomoli. Jorge Alonso-Henar and Eugenio Fazio are thanked for their careful reviews. We thank the editor, Prof. Lacombe for his very efficient handling of the paper.


 Open access