


Impact statement
In this study, a short form of the Children’s Test Anxiety Scale, one of the most frequently used measurement tools for assessing children’s test anxiety, was developed. For this purpose, two different sample datasets and a new short-form technique called Ant Colony Optimization were used. The short form, named CTAS-S, contains 14 items and has high construct validity and high reliability. A useful tool named CTAS-VS, containing 3 items and measuring general test anxiety, was also developed.
Introduction
Exams stand out as an integral part of the education system in the evaluation of students’ academic success. Exams conducted at national and international levels are used not only as a means of evaluating individual success but also as a means of evaluating the effectiveness of education systems (Organization for Economic Co-operation and Development [OECD], 2017). However, these evaluation processes can lead to significant psychological pressure, especially in younger age groups. Students can experience intense stress due to high performance expectations, fear of failure and social pressures during the preparation and application process for exams. This situation brings about a common psychological reaction called test anxiety, which can negatively affect students’ academic processes (Zeidner, Reference Zeidner1998).
Test anxiety is a serious problem that is common among students (Ergene, Reference Ergene2003; Bodas and Ollendick, Reference Bodas and Ollendick2005). Many studies have indicated that high levels of test anxiety are associated with lower learning and test performance (Spielberger and Vagg, Reference Spielberger, Vagg, Speilberger and Vagg1995; Zeidner, Reference Zeidner1998; Sub and Prabha, Reference Sub and Prabha2003; Chapell et al., Reference Chapell, Blanding, Silverstein, Takahashi, Newman, Gubi and McCann2005; Howard, Reference Howard2020). Meta-analyses of these studies conclude that persistent test anxiety is associated with weaker test and academic performance (Hembree, Reference Hembree1988; Seipp, Reference Seipp1991; von der Embse et al., Reference von der Embse, Jester, Roy and Post2018). Test anxiety experienced at an early age can be carried over to later ages if not intervened and negatively affect students’ academic and psychosocial development (Delvecchio et al., Reference Delvecchio, Cavallina, Di Riso and Mazzeschi2017). Therefore, identifying test anxiety at an early age and intervening effectively is of critical importance in terms of preventive psychological support services. The literature reveals that test anxiety is related not only to students’ cognitive characteristics but also to affective features such as self-concept, depression, motivation and self-efficacy (e.g., von der Embse et al., Reference von der Embse, Jester, Roy and Post2018). Among these variables, the construct of academic self-efficacy, defined within the framework of Bandura’s (Reference Bandura1997) Social Cognitive Theory, holds special importance in understanding test anxiety. Self-efficacy is defined as an individual’s belief in their ability to successfully complete a specific academic task. Theoretically, it is expected that a student with low belief in their own abilities (self-efficacy) will experience an increased threat perception and, consequently, heightened anxiety when faced with a challenging evaluative situation (an exam). Indeed, research concerning the relationship between these two variables has confirmed a moderate to strong negative correlation between academic self-efficacy and test anxiety (Bandalos et al., Reference Bandalos, Yates and Thorndike-Christ1995; Preiss et al., Reference Preiss, Gayle, Allen, Gayle, Preiss, Burrell and Allen2006; Barrows et al., Reference Barrows, Dunn and Lloyd2013; Brandmo et al., Reference Brandmo, Bråten and Schewe2019; Maier et al., Reference Maier, Schaitz, Kröner, Berger, Keller, Beschoner and Sosic-Vasic2021; Chen, Reference Chen2023; Jia et al., Reference Jia, Ma, Xu, Zheng, Ma, Zhang and Liu2023; Santi et al., Reference Santi, Gorghiu and Pribeanu2024; Niaz et al., Reference Niaz, Niaz and Mukhtar2025).
Test anxiety is a widely studied variable in the literature due to its relationship with many cognitive and affective features. Therefore, researchers have tried to define test anxiety in various ways. Test anxiety has been a topic of research in the educational and psychological literature since the early 1950s (Mandler and Sarason, Reference Mandler and Sarason1952), and since its inception, the concept has evolved in accordance with theoretical developments, research findings and contemporary needs in the field (Zeidner, Reference Zeidner1998). First defined in psychological literature by Mandler and Sarason (Reference Mandler and Sarason1952), test anxiety is characterized by high levels of anxiety before or during tests (Lowe et al., Reference Lowe, Lee, Witteborg, Prichard, Luhr, Cullinan and Janik2008). Various theoretical approaches have been proposed in the literature to elucidate the structure of test anxiety. Liebert and Morris (Reference Liebert and Morris1967) increased the measurability of this structure by suggesting that test anxiety consists of two components, “worry” and “emotionality.” The worry component includes the uncontrollable negative thoughts students generate about their performance on tests (self-deprecating thoughts, etc.), and the emotionality component includes the autonomic reactions students experience in test situations (bodily reactions such as nausea, sweating and increased heart rate, etc.). Researchers such as Friedman and Bendas-Jacob (Reference Friedman and Bendas-Jacob1997) developed more complex models in the following years, proposing three-dimensional structures that also included social factors. In this context, it was stated that test anxiety is shaped not only by internal experiences but also by the individual’s interaction with their social environment (Lowe et al., Reference Lowe, Lee, Witteborg, Prichard, Luhr, Cullinan and Janik2008). These social factors can be seen as being ridiculed by peers, receiving negative reactions from parents or teachers or losing face in evaluative settings.
Building on these perspectives, theorists have expanded the definition of test anxiety beyond cognitive and affective responses to include behavioral manifestations that occur during test situations. Zeidner (Reference Zeidner1998) also defined test anxiety as the phenomenological, physiological and behavioral reactions that accompany anxiety about possible negative outcomes or failure in an exam or evaluation situation. Wren and Benson (Reference Wren and Benson2004) include off-task behaviors, which represent distracting behaviors such as foot tapping and looking around the room or at others during the exam, as a third dimension of test anxiety. Many theorists have proposed that test anxiety consists of more than just cognitive and emotional elements, suggesting the inclusion of a behavioral component (Dusek, Reference Dusek1980; Sieber, Reference Sieber1980). Fleege et al. (Reference Fleege, Charlesworth, Burts and Hart1992) provided an operational framework for this dimension, identifying several off-task behaviors, such as (a) auto-manipulation (e.g., rocking, playing with hair or clothing), (b) object manipulation (e.g., tapping or biting pencils), and (c) inattentive or distracted actions (e.g., looking around the room or losing focus on the test). The attentional aspect of this behavioral component had already been noted in earlier work by Wine (Reference Wine1982) and Dusek (Reference Dusek1980), who observed that children with high test anxiety tend to focus more on task-irrelevant stimuli than their low-anxious peers (Wren and Benson, Reference Wren and Benson2004).
The change in the definition of the concept of test anxiety from the past to the present is also reflected in the efforts to measure this construct. For this reason, there are many measurement tools developed to evaluate test anxiety. To assess the test anxiety levels of students in grades 3–6, Wren and Benson (Reference Wren and Benson2004) developed the 30-item Children’s Test Anxiety Scale (CTAS), consisting of three dimensions: thoughts, off-task behaviors and autonomous reactions. Subsequent multidimensional instruments have extended this framework, including the Test Anxiety Inventory for Children and Adolescents (TAICA; Lowe et al., Reference Lowe, Lee, Witteborg, Prichard, Luhr, Cullinan and Janik2008), the Test Anxiety Scale for Elementary Students (TAS-E; Lowe et al., Reference Lowe, Ang and Loke2011), and the Test Anxiety Questionnaire for Elementary and Middle School Students (TAQ-C; Donolato et al., Reference Donolato, Marci, Alto’e and Mammarella2020).
When studies on determining children’s test anxiety were examined, it was determined that the Children’s Test Anxiety Scale (CTAS), developed by Wren and Benson (Reference Wren and Benson2004), was used in more studies than other scales (Driscoll, Reference Driscoll2007; Lowe et al., Reference Lowe, Lee, Witteborg, Prichard, Luhr, Cullinan and Janik2008, Reference Lowe, Ang and Loke2011; Donolato et al., Reference Donolato, Marci, Alto’e and Mammarella2020) and that the scale was adapted and used in different countries (Turkey, Egypt, Argentina, Iran, Finland, England, Romania, Sweden, Canada, Australia, Poland, Portugal, China, Singapore) outside the United States, where the scale was developed. In a meta-analysis study examining the test anxiety of children between the ages of 5 and 12, it was determined that the most used scale was again the CTAS (Robson et al., Reference Robson, Johnstone, Putwain and Howard2023). The scale consists of a total of 30 items structured in three factors: thoughts, off-task behaviors and autonomous reactions. The thought factor includes negative, self-deprecating, or failure-focused cognitive thoughts about the exam. The inner conversations experienced by the student before or during the test and the expectations of failure are within the scope of this dimension. In short, this dimension represents the cognitive component of test anxiety. This factor includes 13 items. The off-task behavior factor describes distractions, restlessness and off-task behaviors during the exam. It includes behaviors such as the student’s inability to pay attention to the questions, playing with the pencil, looking around and fidgeting in the chair. This dimension is the behavioral component of test anxiety. This factor includes 8 items. The autonomic reactions factor refers to physiological reactions that occur during the exam. Involuntary bodily reactions such as increased heart rate, sweating, nausea, dizziness and shaking hands are included in this dimension. This factor includes 9 items (Wren and Benson, Reference Wren and Benson2004).
In particular, in multivariate studies involving children, where many variables are considered together, although the use of long scales provides comprehensive data, children’s limited attention spans can cause fatigue, which can reduce data quality. Therefore, this situation limits the practical use of comprehensive scales (Zheng et al., Reference Zheng, Cheon and Katz2020; Kilmen, Reference Kilmen2022). Additionally, assessment processes conducted under time constraints in educational settings increase the need for comprehensive yet shorter, easier-to-administer, valid and reliable tools. This necessitates the development of shorter and more user-friendly versions of scales such as CTAS. However, developing a short form of a scale should not merely involve reducing the number of items; it also requires a systematic approach that preserves the scale’s structural validity, factor structure and psychometric properties (Smith et al., Reference Smith, McCarthy and Anderson2000; Kleka and Soroko, Reference Kleka and Soroko2018). Given this theoretical and methodological development, the need for shorter yet psychometrically robust versions of existing scales has become increasingly important – particularly for use in applied educational and psychological settings where time and attention constraints are critical.
In recent years, meta-heuristic algorithms have been widely used in psychometrics to develop shorter forms of measurement tools in a more comprehensive and optimization-focused manner. One of these algorithms, Ant colony optimization (ACO), scans all possibilities in the item pool and aims to find the best combination in terms of criteria such as model fit, internal consistency, factor structure and content validity (Leite et al., Reference Leite, Huang and Marcoulides2008; Olaru and Danner, Reference Olaru and Danner2021). ACO is an algorithm inspired by the foraging behavior of ants in nature (Dorigo et al., Reference Dorigo, Birattari and Stutzle2006). As ants choose short paths, they benefit from a process such as more pheromone accumulating on these paths and thus other ants following the same path. In the context of scale development, this approach creates a selection loop in which each short form combination is evaluated according to psychometric criteria and the most suitable ones are highlighted in subsequent iterations by receiving more “pheromone” (Raborn et al., Reference Raborn, Leite and Marcoulides2020). This method allows for to production more balanced and scientifically sound short forms not only by criteria such as internal consistency or item loadings, but also by optimizing multiple validity measures simultaneously (Dong, Reference Dong and Dumas2025). Studies emphasizing that ACO is an effective method for developing short forms of psychological scales have increased in recent years. For example, Dong (Reference Dong and Dumas2025) emphasized that models developed with ACO may be “less wrong”; however, whether these models are “more useful” in a psychological sense should be evaluated separately, and they demonstrated the importance of using ACO in a way that takes into account not only statistical but also theoretical dimensions.
Current study
The aim of the current study is to develop the short and very short forms of the CTAS developed by Wren and Benson (Reference Wren and Benson2004) using the ACO algorithm. In this study, the primary reason for developing both the “Short Form” (CTAS-S) and the “Very Short Form” (CTAS-VS) instead of a single short form is to serve the different contextual needs of test anxiety measurement. The literature emphasizes that scale length should be optimized according to the purpose of the measurement (e.g., assisting clinical diagnosis vs. conducting epidemiological screening) (Streiner, Reference Streiner2005; Ziegler et al., Reference Ziegler, Kemper and Kruyen2014). Additionally, participant load is a much more critical factor when working with children than with adults (De Leeuw, Reference De Leeuw2011). With two different forms, it is aimed to provide researchers and practitioners with the flexibility to manage the trade-off between “reliability/content validity” and “brevity/efficiency” (Smith et al., Reference Smith, McCarthy and Anderson2000). For this purpose, the validity and reliability of the short form (CTAS-S) and the one-dimensional very short form (CTAS-VS), which were developed while preserving the original three-factor structure of the scale, were tested. Although the behavioral factor demonstrated relatively weaker fit indices, it was conceptually preserved because it captures observable behavioral manifestations of test anxiety, which are integral to its multidimensional structure.
In this study, the short form development strategy proposed by Raborn et al. (Reference Raborn, Leite and Marcoulides2020) was used and data were collected from two different samples. The short form item selection algorithm was applied to the first sample, the “training sample” (Sample-1), and the validity and reliability evidence of the best possible short form was obtained. In the second study, the second sample was divided into two separate groups and the validity and reliability evidence for the short form obtained in the “test sample” called Sample-2a was obtained again. Thus, the short form that best reflects the CTAS-S was also verified in a different sample. In addition, in order to compare the scores of the CTAS according to gender, it is necessary to examine the measurement invariance of such psychological variables. In this study, as a proof of the validity of the CTAS-S, the measurement invariance according to gender was also examined on Sample-2a. In the third study, with the data obtained from the other half of the second sample, Sample-2b, a 3-item and uni-dimensional very short form (CTAS-VS) was developed using ACO. Comprehensive meta-analyses and international studies report that female students exhibit statistically significantly higher test anxiety compared to male students in both childhood and adolescence (e.g., Hembree, Reference Hembree1988; Putwain, Reference Putwain2007; von der Embse et al., Reference von der Embse, Jester, Roy and Post2018). Therefore, in this study, measurement invariance analyses were conducted based on gender. Thus, testing measurement invariance across gender is important to confirm that the developed short form measures the same construct for both groups and to ensure that potential score differences based on this demographic variable can be validly interpreted.
As a result, this study aims to develop a version of a critical structure, such as test anxiety, that can be assessed in a shorter but valid and reliable way. In addition, it is planned to present a new, very short and global version of the scale. Thus, it is expected to contribute to obtaining more effective and economical tools for the assessment of children’s emotional processes. In addition, it is aimed to provide a time-efficient and scientifically sound assessment tool for both educators and mental health professionals.
Methods
Participants
Sample-1
Sample-1 consists of a group of 570 secondary school students. 52.3% of the participants were female. The ages of the participants ranged between 12 and 15 years (M = 13.31, SD = 0.90). 72.8% had a room of their own and 58.6% reported using technological products every day.
Sample-2
Sample-2 consists of a group of 825 secondary school students; 48.6% of the participants were female. The ages of the participants ranged between 12 and 15 years (M = 13.39, SD = 0.39); 68.1% had a room of their own and 61.5% reported using technological products every day. Care was taken to select different schools in different regions in Sample-1 and Sample-2. Sample-2 was randomly divided into two and used for two different purposes. Half of the selected sample (Sample-2a; N = 413) was used to conduct validity and reliability analyses of the short form (CTAS-S), while the other half (Sample-2b; N = 412) was used to conduct preliminary analyses of the very short form of the scale (CTAS-VS).
Data collection procedures
The data collection process was conducted in two stages among secondary school students in various provinces of Turkey. Ethical approval of the study was obtained before the study started. Data was collected face-to-face with the permission of school administrators, teachers and parents. To provide informed consent, all participants actively chose they agree to participate in the study before proceeding with the questions.
Measures
Personal information form
It contains several items related to variables such as gender and age.
Children’s test anxiety scale
The 30-item Test Anxiety Scale in Children (CTAS), which comprises three factors (thoughts, off-task behaviors and autonomous reactions), was developed by Wren and Benson (Reference Wren and Benson2004) for the purpose of assessing the test anxiety levels of students in grades 3–6. The original language of the CTAS is English and it consists of 30 items in three factors. The items are rated on a 4-point Likert scale, with responses ranging from 1 (Almost Never) to 4 (Almost Always). Confirmatory factor analysis demonstrated that the model fit for the three-factor structure of the scale was better than other alternative models (Wren and Benson, Reference Wren and Benson2004). The adaptation study for Turkish culture was conducted by Aydın and Bulgan (Reference Aydın and Bulgan2017). The original 3-factor structure was confirmed in this study (CFI = .97 and RMSEA = .05) and alpha values were calculated between .72 and .82. There are no reverse-coded items in the scale. In our study from Sample-1, alpha values were .85, .70 and .88 for thoughts, off-task behaviors and autonomous reactions factors, respectively.
Children’s perceived academic self-efficacy scale
Jinks and Morgan (Reference Jinks and Morgan1999) developed the Perceived Academic Self-Efficacy Scale for Children (CPSE). Three factors and 30 items constitute the scale. A 4-point Likert scale is used for the scale’s response category. The highest degree of agreement (1) and the lowest degree of agreement (4) are ranked. According to Jinks and Morgan (Reference Jinks and Morgan1999), the scale’s Cronbach Alpha reliability coefficients, which comprise 30 items in three sub-dimensions, are 0.78 for 13 items in the talent sub-dimension, 0.70 for 13 items in the context sub-dimension, and 0.66 for four items in the effort sub-dimension. Items 4, 5, 15, 19, 20, 22, 23, 24 and 28 are reverse coded. The adaptation study of the scale to Turkish culture was conducted by Özyeter and Kutlu (Reference Özyeter and Kutlu2022). In this study, in which the original factor structure was confirmed (CFI = .90 and RMSEA = .06), alpha values were obtained in the range of .61–.91. In our study from Sample-1, alpha values were .82, .82 and .62 for talent, context and effort factors, respectively.
Analysis
The data set was inspected for outliers and missing data prior to analysis. According to the study’s analysis of the skewness (Sk) and kurtosis (Ku) coefficients for univariate outliers, every item satisfied the requirements (Sk < ǀ3ǀ and Ku < ǀ8ǀ–ǀ10ǀ; Kline, Reference Kline2016). The Mahalanobis distance measure was used to examine the existence of multivariate outliers. The findings were robust to the presence of multivariate outliers; therefore, no data were removed in order to preserve the full sample size. There is no missing data in the data set.
Using Sample-1, to test CTAS’ original correlated three-factor structure, CFA were performed on the Lavaan package in R (Rosseel, Reference Rosseel2012) with the weighted least square mean and variance adjusted (WLSMV) estimator. Based on the literature, WLSMV is better suited than estimators based on maximum probability for ordinal categorical items with five or fewer response options (Finney and DiStefano, Reference Finney, DiStefano, Hancock and Mueller2006). The most optimal short form was found using ACO, one of the meta-heuristic algorithms. Previous studies have shown that this algorithm is more effective than other algorithms (Raborn et al., Reference Raborn, Leite and Marcoulides2020). The ACO is tuned with 20 consecutive steps for convergence, 0.9 evaporation, 20 ants and 1,000 maximum steps for no improvement based on prior research (Leite et al., Reference Leite, Huang and Marcoulides2008; Schultze and Eid, Reference Schultze and Eid2018; Raborn et al., Reference Raborn, Leite and Marcoulides2020). The ShortForm 0.4.6 package (Raborn and Leite, Reference Raborn and Leite2018) was used in the R environment to apply the ACO algorithm analysis. This package fits both unidimensional and multidimensional factor structures using the Lavaan package (Rosseel, Reference Rosseel2012). A subset of 14 items (thoughts factor: 6, off-task behaviors factor: 4 and autonomous reactions factor: 4) was repeatedly chosen from a total pool of 30 items in the ACO algorithm used in this study to obtain the short form. The criteria for chi-square statistics, CFI, TLI and RMSEA were used to assess how well the chosen items fit the model.
Small modification indices, small covariance residuals, adequate content validity, crossloadings of minimally ≤0.300 but ideally ≤0.200 (Morin et al., Reference Morin, Myers, Lee, Tenenbaum and Eklund2020), and factor loadings of minimally ≥0.300 but ideally ≥0.500 (Morin et al., Reference Morin, Myers, Lee, Tenenbaum and Eklund2020) were all associated with items that were preferred. While maintaining sufficient content coverage (Nunnally and Bernstein, Reference Nunnally and Bernstein1994), we aimed to cut the questionnaire’s length by at least 50% (Marsh et al., Reference Marsh, Ellis, Parada, Richards and Heubeck2005). We also aimed for the construct validity of the short form to be at least as good as the construct validity of the long form. Using Sample-2a, validity analyses were conducted again for the current factor structure. Using Sample-2b, preliminary analyses were conducted to develop a very short form of the scale (CTAS-VS) with the help of the ACO algorithm. The CTAS-VS was planned to have a structure with a unidimensional structure and 3 items, since only one item from each factor was included.
Numerous fit indices, such as the Standardized Root Mean Square Residual (SRMR), Tucker-Lewis Index (TLI), Root Mean Square Error of Approximation (RMSEA), and Comparative Fit Index (CFI), were used to assess the model-data fit. While RMSEA below .05 and SRMR below .10 indicate an acceptable fit of a dataset to a measurement model, CFI and TLI values above .90 and .95 indicate an acceptable and perfect fit, respectively (Hu and Bentler, Reference Hu and Bentler1999, pp. 24–26). An acceptable fit falls between 2 and 3, but χ 2/df should be less than 2 (Schermelleh-Engel et al., Reference Schermelleh-Engel, Moosbrugger and Müller2003).
As reliability analyses, hierarchical omega coefficient for subscales (ωHS; Reise et al., Reference Reise, Bonifay and Haviland2013), ordinal alpha coefficients, and Average Variance Extracted (AVE) were calculated. All coefficients are computed from semTools package 0.5–4 (Jorgensen et al., Reference Jorgensen, Pornprasertmanit, Schoemann, Rosseel, Miller, Quick and Enders2016).
Measurement invariance across gender based on the final model was tested using Sample-2a for further validity confirmation. For this, the semTools package 0.5–7 (Jorgensen et al., Reference Jorgensen, Pornprasertmanit, Schoemann, Rosseel, Miller, Quick and Enders2016) and Lavaan (Rosseel, Reference Rosseel2012) were utilized. Four nested patterns – i) configural invariance, (ii) metric invariance, (iii) scalar invariance and (iv) strict invariance – were used to analyze measurement invariance. According to Marsh et al. (Reference Marsh, Balla and McDonald1988), chi-square test statistics are known to be extremely sensitive to sample size. For this reason, this statistic was not applied as a standard. The criteria of ΔCFI <.010, ΔTLI <.010 and ΔRMSEA <.015 were used to test for measurement invariance between the nested models (Cheung and Rensvold, Reference Cheung and Rensvold2002; Chen, Reference Chen2007). The same marker items were used across groups to ensure comparability.
Due to the reduction in the number of items on the scale, content validity was assessed using the Lawshe (Reference Lawshe1975) technique. For this purpose, nine experts were asked to evaluate the long form and short form of the scale in terms of content validity, and Content Validity Ratios (CVR) and Content Validity Index (CVI) were calculated based on the data obtained. For this purpose, considering the general rule, the minimum value of CRIs should be .75 for 9 experts. A content validity index (CVI) score of 0.79 or more is deemed adequate; a score of 0.79 to 0.70 is dubious and requires revision and correction; a score of less than 0.70 is inappropriate and ought to be eliminated (Madadizadeh and Bahariniya, Reference Madadizadeh and Bahariniya2023).
Convergent validity was assessed using CPSE and CTAS scores. It was anticipated that these two scale scores would negatively correlate. To do this, the Pearson correlation coefficient was used to determine the correlations between the three-factor structures of the CPSE and the CTAS-S scores. All CTAS forms, as well as R codes were shared on the OSF link: https://shorturl.at/t9vM6.
Findings from sample-1
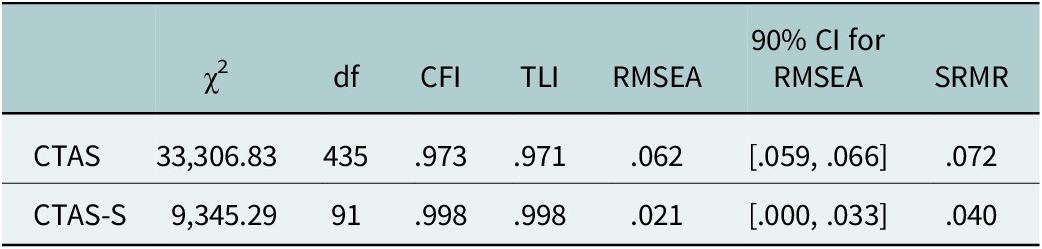
The long form of the CTAS with 3 factors and 30 items was used on Sample-1. Using this data set, the most optimal item set containing 14 items was determined with the ACO algorithm by preserving the 3-factor structure so that each factor would contain at most 50% of the items. The model-data fits of the CTAS and CTAS-S created with this optimal item set are presented in Table 1.
Fit indices of the CTAS and CTAS-S

Note: CFI, comparative fit index; CI, confidence interval; df, degrees of freedom; RMSEA, root mean square error of approximation; SRMR, standardized root mean square residual; TLI, Tucker–Lewis index.
The validity of the short form of a scale should be at least as good as the validity of the long form (Anonymous, 2020). The model-data fit values of the short form were better than those of the long form and a perfect model-data fit was revealed (Table 1). Standard factor loadings, omega, ordinal alpha and AVE values of the short form are given in Table 2.
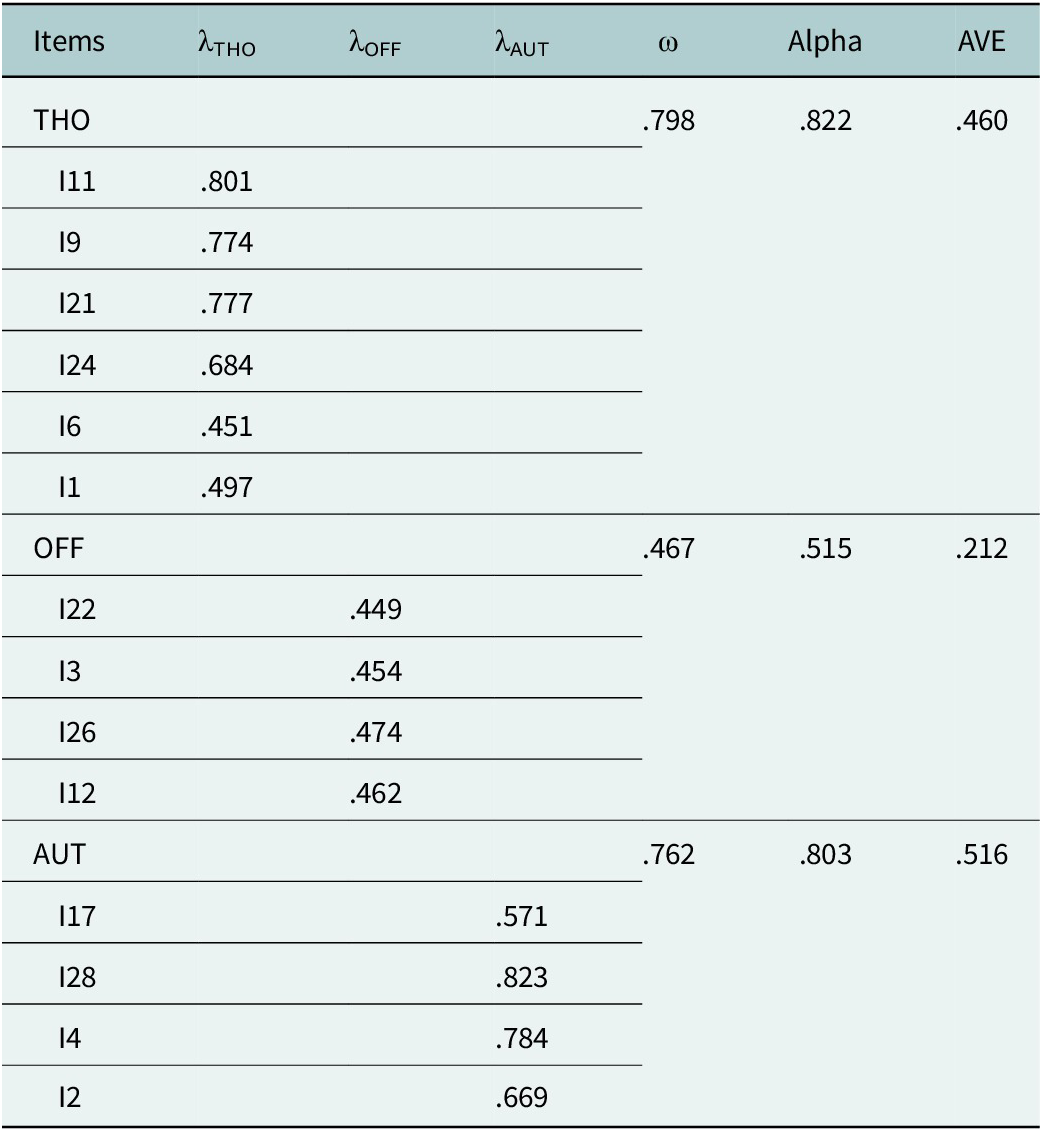
Standardized factor loadings (λ), omega, ordinal alpha and ECV coefficients for the CTAS-S (sample-1)

Note: Alpha, ordinal alpha coefficient; AVE, average variance extracted; AUT, autonomic reactions; OFF, off-task behaviors; THO, thoughts; ω, hierarchical omega coefficient for specific factors.
In Table 2, the factor loadings of the thoughts and autonomic reactions factors of the CTAS-S vary between .451–.801 and .571–.823, respectively. The ordinal alpha, omega and AVE values of these factors are also adequate. However, the factor loadings of the off-task behaviors factor (.449–474) along with the ordinal alpha, omega and AVE values show a weak internal consistency and homogeneity. Similar findings were found in some studies in which CTAS was developed and adapted (Wren and Benson, Reference Wren and Benson2004; Aydın and Bulgan, Reference Aydın and Bulgan2017). The correlations between the factors of the CTAS-S and the factors of the CPSE ranged from −.070 to −.265. The relationships between test anxiety and perceived academic self-efficacy are negative and low. Considering the model-data fit, internal consistency coefficients and AVE value together, the CTAS-S has obtained sufficient validity and reliability evidence.
Findings from sample-2
The 14 short-form items decided by the ACO algorithm were administered over Sample-2. This sample was randomly divided into Sample-2a (N = 413) and Sample-2b (N = 412) and model-data fit values, factor loadings, omega, ordinal alpha and AVE values of the CTAS-S were determined with the data set of Sample-2a. In addition, measurement invariance by gender was tested. With the data set belonging to Sample-2b, preliminary analyses of the CTAS-VS were performed using the ACO algorithm with 3 items and a unidimensional structure. Model-data fit values, factor loadings, omega, ordinal alpha and AVE values of CTAS-VS were determined. Correlations between factors of CTAS-S and CATS-VS were also reported.
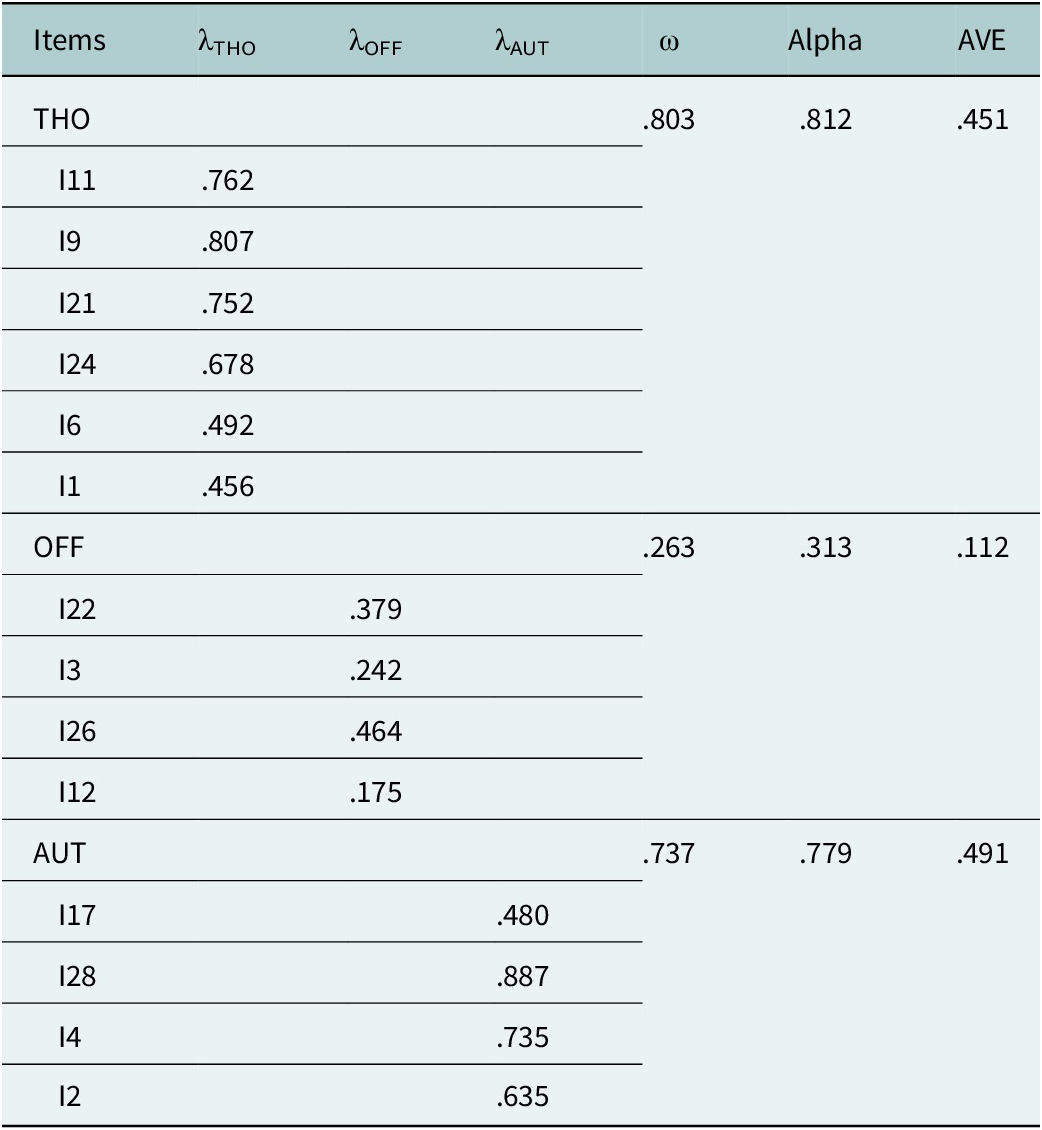
Model-data fit values for CTAS-S indicate excellent fit (CFI = .991; TLI = .989; RMSEA = .040, 90% CI [.027, .052]; SRMR = .056). Standard factor loadings, omega, ordinal alpha and AVE values of the short form are given in Table 3.
Standardized factor loadings (λ), omega, ordinal alpha and ECV coefficients for the CTAS-S (sample-2a)

Note: Alpha, ordinal alpha coefficient; AVE, average variance extracted; AUT, autonomic reactions; OFF, off-task behaviors; THO, thoughts; ω, hierarchical omega coefficient for specific factors.
In Table 3, the factor loadings of the thoughts and autonomic reactions factors of the CTAS-S vary between .456–.807 and .480–.887, respectively. According to the ordered alpha, omega and AVE values of these factors, homogeneity and internal consistency are at a sufficient level. However, the factor loadings of the off-task behaviors factor (.175–464) along with the ordinal alpha, omega and AVE values show a weak internal consistency and homogeneity. The CVR values for the 14 items in CTAS-S range from .78 to 1.00. The CVI value is 0.87. In this case, the items and the test retained their content validity in the short form.
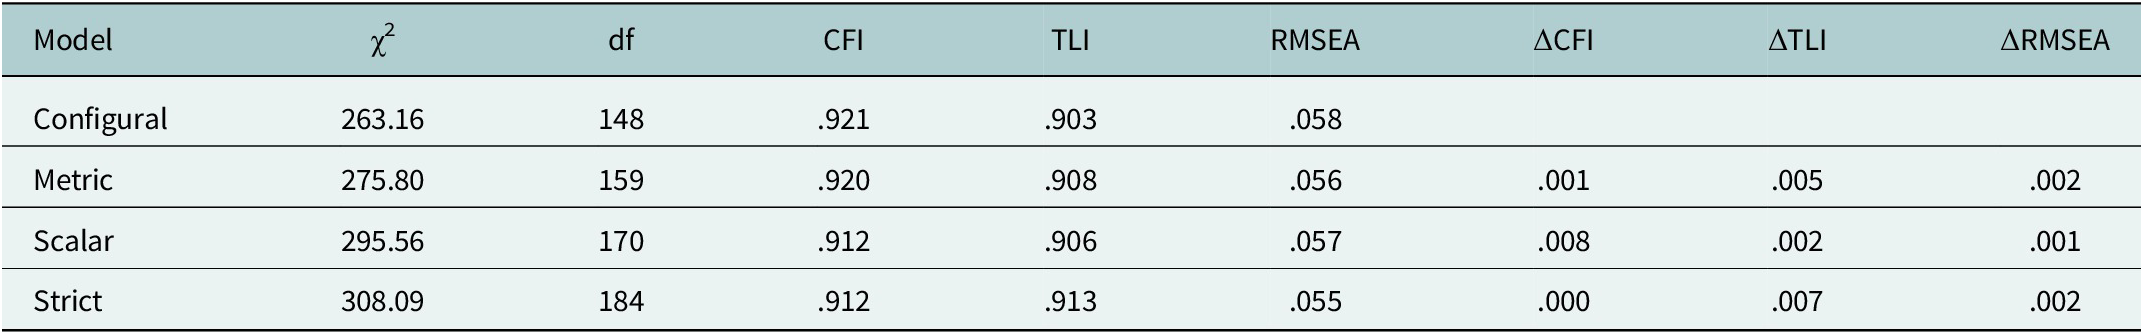
The findings of the measurement invariance test according to gender are presented in Table 4.
Fit indices of measurement invariance model

Note: CFI, comparative fit index; ΔCFI, CFI values difference; RMSEA, root mean square error of approximation; ΔRMSEA, RMSEA values difference; TLI, Tucker–Lewis index; ΔTLI, TLI values difference.
Table 4 presents the measurement invariance (MI) results of the CTAS-S test by gender. The same number and pattern of factors are obtained by the gender groups in the first stage, at configural MI. A very good model-data fit is indicated by the results of the metric invariance step. Furthermore, metric invariance is confirmed when the model-data fit difference between the two models is less than the criteria value, as shown by the model comparison results. It is possible to say that factor loadings are equal in the present case. A very good model-data fit is also shown by the results of the scalar invariance step. Scalar invariance is attained when the model-data fit difference between the two models is less than the criteria value, as shown by the model comparison results. In this instance, it is possible to specify that the item threshold parameters and the factor loadings are equivalent. A very good model-data fit is also shown by the strict invariance stage results. Strict invariance is attained when the model-data fit difference between the two models is less than the criterion value. In this instance, it can be stated that the item threshold settings, factor loadings and residual variance values are all equal.
The CTAS-VS form was created by applying the ACO algorithm on the CTAS-S data set obtained from Sample-2b. By selecting one item from each factor, 3 items and a unidimensional structure were obtained (thoughts factor: Item 21, off-task behaviors factor: Item 26, and autonomous reactions factor: Item 2). The model-data fit for this structure is perfect (CFI = 1.000; TLI = 1.000; RMSEA = .000, 90% CI [.000, .000]; SRMR = .000). As a result, we were compelled to evaluate the CFA representation of K-CSES-VS responses using parameter estimates as opposed to model fit. Given that this extremely short measure aims to capture a broad construct with relatively few indicators linked to vastly various features, these parameter estimates (item 2: λ = 0.580; item 21: λ = 0.650; item 26: λ = 0.487; ω = 0.532; ordinal alpha = .591) are adequate.
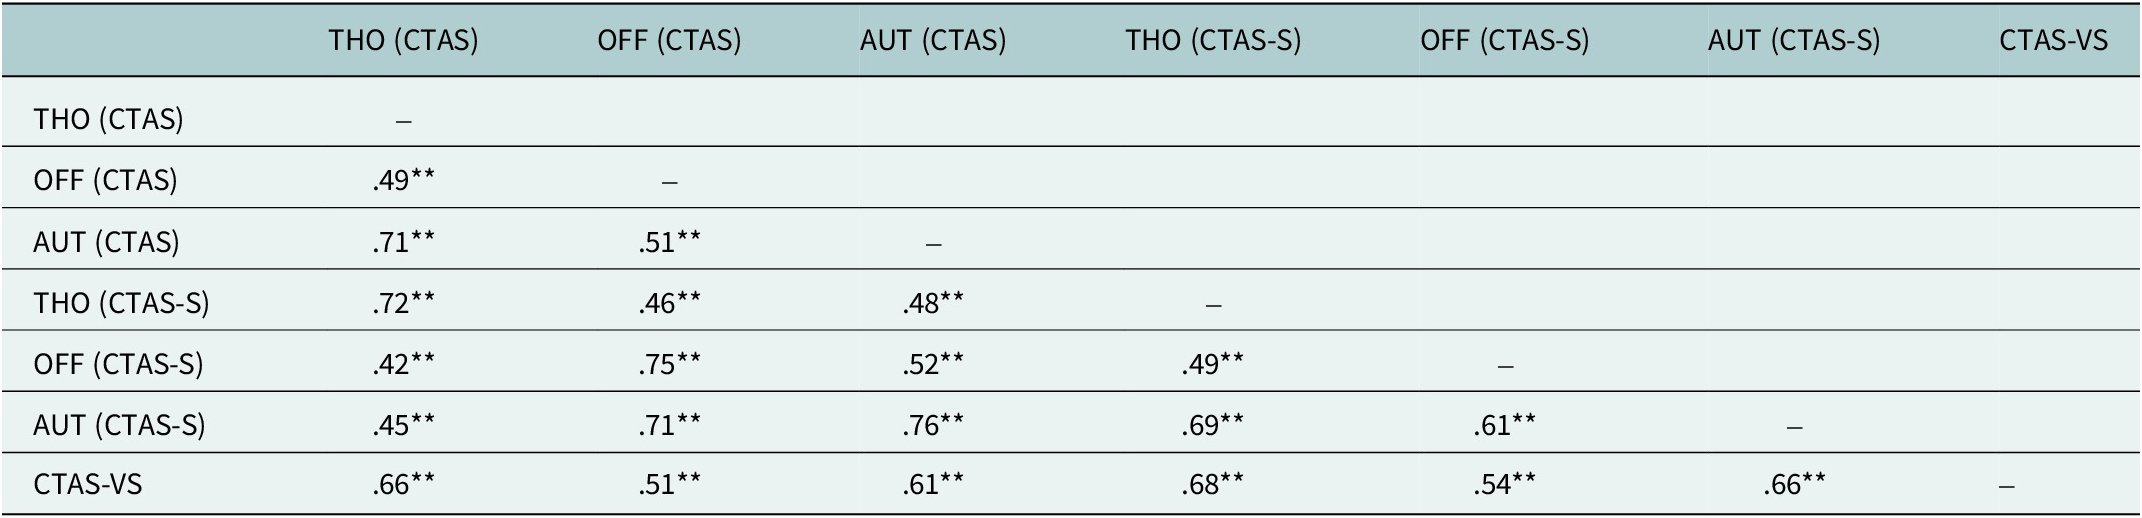
In Table 5, the correlation between thoughts and off-task behaviors factors of CTAS-S is .42, between thoughts and autonomic reactions factors is .69, and between off-task behaviors and autonomic reactions factors is .61. The correlations between CTAS factors range from .49 to .71. The correlation coefficient between CTAS-VS and CTAS factors ranges from .51 to .66, while the correlation between CTAS-S factors ranges from .54 to .68. All coefficients are statistically significant at the .001 level and are moderate to high. The scores for the three separate forms measuring the same trait are similar.
Correlations among CTAS, CTAS-S and CTAS-VS scores

Note: AUT, autonomic reactions; OFF, off-task behaviors; THO, thoughts.
** p < .001
Discussion
This study aimed to develop the short (CTAS-S) and very short (CTAS-VS) forms of CTAS using the meta-heuristic item selection procedure ACO in a student sample between the ages of 12–15 in Turkey. For this purpose, the study was conducted on three different samples.
In the initial study, the original form of the CTAS, comprising 30 items, was administered to Sample-1. The data obtained were then subjected to analysis using the ACO algorithm, leading to the development of a shortened version of the CTAS, consisting of 14 items. The three-factor structure of the original scale was also preserved in the CTAS-S. The model-data fit of the 14-item CTAS-S was determined to be superior to that of the long form. While the ordinal alpha, omega and AVE values of the thoughts and autonomic reactions sub-factors of the CTAS-S were sufficient, the ordinal alpha, omega and AVE values of the off-task behaviors factor were found to be weak. In most studies where the CTAS was developed and adapted, the alpha value of the off-task behavior factor was found to be lower than the alpha value of other factors (Wren and Benson, Reference Wren and Benson2004; Curtis, Reference Curtis2009; Lieberman-Acobas, Reference Lieberman-Acobas2010; Putwain and Daniels, Reference Putwain and Daniels2010; Putwain et al., Reference Putwain, Nicholson, Connors and Woods2013; Aydın and Bulgan, Reference Aydın and Bulgan2017; Coşkun, Reference Coşkun2018; Fergus et al., Reference Fergus, Limbers and Bocksel2020; Genç and Şanlı, Reference Genç and Şanlı2023). The findings of this study confirmed the three-factor structure of the CTAS (Cognitive, Affective and Behavioral), but the “behavioral” dimension demonstrated lower internal consistency compared to the other two dimensions. However, as emphasized in the Structural Equation Modeling literature, assessing the statistical fit of a model cannot be considered separately from its theoretical basis (Bentler and Bonett, Reference Bentler and Bonett1980; Bollen, Reference Bollen1989; Bentler, Reference Bentler1990). This suggests that the dimension is measured more noisily than the others or is of a different nature. As detailed in the introduction, the observable components of test anxiety (especially in children) are integral to the construct’s theoretical scope.
The findings of this study, findings that the reliability coefficient of the off-task behavior factor was moderate were encountered (Cahalan, Reference Cahalan2008; Dalaman and Medikoğlu, Reference Dalaman and Medikoğlu2018; Shoahosseini and Baghaei, Reference Shoahosseini and Baghaei2020). These findings in other studies are similar to the findings of the current study; however, higher model-data fit values were mostly obtained in our study. When the model-data fit, internal consistency coefficients and AVE value are considered together, sufficient validity and reliability evidence were obtained for CTAS-S. In addition, all of the correlations between the factors of the scale are significant and are at medium (.421 and .405) and close to the high limit (.716). This finding is similar to the findings of Aydın and Bulgan (Reference Aydın and Bulgan2017) and Shoahosseini and Baghaei (Reference Shoahosseini and Baghaei2020). The correlations between the factors in the sample in which the scale was developed are also at a moderate level (Wren and Benson, Reference Wren and Benson2004). When the discriminant validity is examined, the negative and low correlations between the subfactors of CTAS-S and the CPSE factors also provide evidence for the validity of the short form. The findings of previous studies (Bandalos et al., Reference Bandalos, Yates and Thorndike-Christ1995; Preiss et al., Reference Preiss, Gayle, Allen, Gayle, Preiss, Burrell and Allen2006; Barrows et al., Reference Barrows, Dunn and Lloyd2013; Brandmo et al., Reference Brandmo, Bråten and Schewe2019; Maier et al., Reference Maier, Schaitz, Kröner, Berger, Keller, Beschoner and Sosic-Vasic2021; Chen, Reference Chen2023; Santi et al., Reference Santi, Gorghiu and Pribeanu2024; Niaz et al., Reference Niaz, Niaz and Mukhtar2025) generally show a significant and moderate negative correlation between test anxiety and perceived academic self-efficacy. The findings of this study yielded negative but low correlations. This may be due to the smaller sample size and the sample being more homogeneous compared to other studies. The negative and low correlation between test anxiety and perceived academic self-efficacy indicates that the measured constructs are theoretically different and provides indirect evidence for the discriminant validity of the test anxiety scale (Campbell and Fiske, Reference Campbell and Fiske1959; Fornell and Larcker, Reference Fornell and Larcker1981; McLeod, Reference McLeod2024).
In the second study, confirmatory analyses were performed on the data obtained from Sample-2a by applying the 14-item CTAS-S, and measurement invariance was examined according to gender. In the findings obtained from Sample-2a, it was determined that the model-data fit was higher than the findings obtained from the original scale; while the sequential alpha, omega and AVE values of the thoughts and autonomic reactions sub-factors were sufficient, the sequential alpha, omega and AVE values of the off-task behaviors factor were weak. In addition, strict invariance of CTAS-S according to gender was ensured. Therefore, possible differences between the item responses of gender groups are only due to group differences. This result shows that CTAS-S can be used in different gender groups without significant measurement deviations. No study was found examining the measurement invariance of CTAS in different groups. In conclusion, this study is the first study in which a high range of validity and reliability evidence was obtained by testing CTAS-S on a culture-based sample. Based on these results, researchers and practitioners can use the CTAS-S to measure test anxiety of middle school students.
In the third study, the three-item single-factor CTAS-VS was created by applying the ACO algorithm to data from Sample 2b. This very short form was specifically developed to provide researchers with access to a short, easy-to-analyze measure of students’ test anxiety levels. This very short three-item form was also found to have very good model-data fit. Given that this extremely short measure aims to capture a broad construct with a small number of indicators, it was concluded that the item parameter estimates and ordinal alpha and omega values were adequate. Short scales are often criticized for their low reliability, but this view is often based on the traditional focus on the internal consistency of scales, which leads to an underestimation of true item reliabilities (Sijtsma, Reference Sijtsma2009).
In short, it can be said that this new and very short measurement tool represents a reliable and valid measure of students’ general test anxiety levels. It was found that there was a significant medium to high correlation between the scores obtained from this three-item scale and the scores on the 14-item CTAS-S sub-factors. The high correlation coefficients between the long and short form scores indicate that the short form successfully represents the construct measured by the original scale. It also suggests that the basic aspects of the measured construct were preserved. Smith et al. (Reference Smith, McCarthy and Anderson2000) also stated that short forms can be a functional alternative to the long form when carefully developed while preserving construct validity. This supports the fact that the short form can be used as a valid measurement tool. However, since the content scope of the short form is not as wide as the long form, a careful evaluation should be made in terms of content validity. Stanton et al. (Reference Stanton, Sinar, Balzer and Smith2002) also stated that the high correlations between the long form and the short form indicate that the short form measures the same psychological construct, but this situation necessitates a careful evaluation in terms of content validity.
Furthermore, these findings must be considered in light of the literature indicating that hyperactivity and test anxiety frequently co-occur (i.e., high comorbidity) (Kavakcı et al., Reference Kavakcı, Güler and Çetinkaya2011; Dan and Raz, Reference Dan and Raz2015; Nelson et al., Reference Nelson, Lindstrom and Foels2015). Therefore, it should not be overlooked that high scores obtained from the scale’s short forms may be an indicator of hyperactivity in addition to high test anxiety.
In this context, caution is particularly warranted when interpreting high scores derived from the OFF (Off-Task) factor of the CTAS-S. Moreover, it is recommended that the CTAS-VS form be used with caution, prioritizing its practicality for the rapid screening of test anxiety.
Limitations and recommendations
Although this study has some notable strengths, such as comprehensive statistical analyses, large sample size and the use of three different samples, future supporting research is needed to replicate and confirm our findings. Our sample consisted of secondary school students in a province in the northern part of Turkey. This may limit the generalizability of our findings to larger populations. Therefore, it is recommended that a more diverse sampling strategy be considered for future studies. Therefore, further evaluation of the validity of the CTAS-S and CTAS-VS in various populations (e.g., younger age groups, different ethnic groups, students with different cultural backgrounds, etc.) is necessary. Further validation of the measure in different cultural contexts and populations is important to strengthen the robustness and generalizability of the scale. Secondly, a more adequate representation of reliability can be based on the test–retest correlations of the scale. Therefore, it is recommended to calculate the test–retest reliability coefficient as well as the reliability coefficients in terms of internal consistency.
Also, although the data collected from the second sample were arbitrarily divided into Sample-2a and Sample-2b data sets, these are the same data from a cross-sectional survey and therefore more homogeneous. For cross-validation, it is recommended to conduct analyses by collecting data from a different sample in future studies.
Finally, although the current study demonstrates the cross-sectional robustness of the abbreviated CTAS, it does not demonstrate temporal stability, which should be investigated in future studies. Longitudinal studies are recommended. In addition, future studies can investigate the usefulness of the CTAS-S in assessing changes in test anxiety after test anxiety-based interventions and the relationship between test anxiety and various psychological measures.
Conclusion
In general, consistent results were obtained in terms of model fit, factor structure and validity of the scales in the three studies. In addition, the analyses showed that the reliability of the new short scales was acceptable, with only weak reliability values for the off-task behavior sub-factor of the CTAS-S. The ACO algorithm excludes items that are highly correlated with another item due to similar wording, thus reducing redundancy. This probably led to a slight decrease in the internal reliability of the two short scales compared to the long scales. In addition, a decrease was expected because the 14-item CTAS-S and the 3-item CTAS-VS have fewer items than the 30-item CTAS. The results showed that both the 14-item short form (CTAS-S) and the 3-item very short version (CTAS-VS) based on the ACO have very good psychometric properties.
The shorter versions are more appropriate and applicable, especially when faced with time and energy constraints (e.g., in studies involving many variables or when working with populations with limited attention spans), in pilot studies, when a rapid assessment is required, or for screening purposes (e.g., to obtain rapid, actionable insights from a patient or employee; Gilbert et al., Reference Gilbert, Tóth-Király, Garn and Morin2025). These shorter versions preserve the theoretical underpinnings of the original scale while providing an effective and reliable assessment tool for researchers and practitioners. Thus, the CTAS-S and CTAS-VS provide a good estimate of the structure of test anxiety while preserving the structure of the original CTAS.
In summary, although the behavioral factor showed relatively poor model fit, it was retained to capture the observable aspect of test anxiety reactions. The short and very short forms showed strong correlations with the full version, supporting their validity as effective alternatives for research and practice. However, theoretical caution should be exercised when interpreting the unidimensional CTAS-VS form, which was primarily designed as a screening measure.
Open peer review
To view the open peer review materials for this article, please visit http://doi.org/10.1017/gmh.2025.10115.
Data availability statement
The data sets used in the study are available upon reasonable request to the corresponding author.
Author contribution
Study conception, design and data collection were performed by Author-1; study conception, design and data analysis were performed by Author-2; study conception and design were performed by Author-3. All authors read and approved the final manuscript.
Financial support
The author(s) received no financial support for the research, authorship and/or publication of this manuscript.
Competing interests
The authors declare none.
Ethics statement
The authors of this manuscript have complied with APA ethical principles in their treatment of individuals participating in the research, program, or policy described in the manuscript.

 Open access
Comments
Dear Editor,
Please find attached the paper, “Development of Short (CTAS-S) and Very Short (CTAS-VS) Form of Children’s Test Anxiety Scale Using Ant Colony Optimization” by Dr. Selda Örs Özdil, Dr. Hakan Koğar, and Dr. Esra Kınay Çiçek, which we would like to submit for possible publication to Cambridge Prisms: Global Mental Health. We confirm that this work is original and has not been published elsewhere nor is it currently under consideration for publication elsewhere.
Children’s Test Anxiety Scale (CTAS) is an important measurement tool to measure children’s test anxiety. In this study, we attempted to develop a short form and a very short form of the scale using ACO based on two large samples. We believe that we have obtained important findings in this regard.
For any information concerning this manuscript, please contact us preferably by e-mail at hkogar@gmail.com
Thank you for your consideration of this manuscript.
We look forward to hearing from you soon.
Sincerely yours
Dr. Selda Örs Özdil
Dr. Hakan Koğar
Dr. Esra Kınay Çiçek