


1. Introduction
This paper is concerned with the various modes of failure that occur in fluid saturated, elastic–plastic and elastic–visco-plastic rocks. The common way of approaching this topic for pressure sensitive plastic materials (Sibson, Reference Sibson, Simpson and Richards1981; Cox, Reference Cox2010) is based on a Mohr–Coulomb failure criterion with no cap (Borja & Aydin, Reference Borja and Aydin2004; see Section 2) on the yield surface. The lack of inclusion of a cap implies the rock can sustain unlimited compressive and shear stresses without yielding. Even if a yield surface cap is included (Issen & Rudnicki, Reference Issen and Rudnicki2000) the yield in compression is considered to be by grain crushing, and compaction bands are the result (Fossen et al. Reference Fossen, Schultz, Shipton and Mai2007). Veveakis & Regenauer-Lieb (Reference Veveakis and Regenauer-Lieb2015) and Alevizos et al. (Reference Alevizos, Poulet, Sari, Lesueur, Regenauer-Lieb and Veveakis2017) have described situations for capped yield surfaces and fluid saturated rocks where opening-mode displacement discontinuities can arise in compression for suitable combinations of strain rate and permeability. The opening-mode behaviour is enhanced by coupling between chemical reactions (especially those with large negative ΔV or involving dissolution) and deformation (Alevizos et al. Reference Alevizos, Poulet, Sari, Lesueur, Regenauer-Lieb and Veveakis2017). In this paper we first concentrate on vein systems and extend the framework already established by the above authors to include coupling between deformation, fluid flow and mineral reactions in materials with capped yield surfaces. The result is a new interpretation of some classes of veins that form as opening structures in the compaction field of deformation. These opening-mode structures are exemplified by the two types of veins shown in Figure 1. In Figure 1a solution seams or stylolites are shown parallel to the vein margin whereas in Figure 1b stylolites are normal to the vein boundary. With the assumption that the teeth on stylolites point towards σ 1 (Toussaint et al. Reference Toussaint, Aharonov, Koehn, Gratier, Ebner, Baud, Rolland and Renard2018), this means that the vein in Figure 1a forms normal to σ 1 whereas that in Figure 1b forms parallel to σ 1. The addition of a cap on the yield surface also has important implications for failure-mode diagrams (Cox, Reference Cox2010), fault reactivation (Sibson et al. Reference Sibson, Robert and Poulsen1988), breccias and for kinematic interpretations of vein systems in general. In particular an aseismic alternative to the fault-valve mechanism (Sibson, Reference Sibson2020), which we call mode-switching, arises. This paper is concerned with these implications and processes.
Two different types of veins. (a) Laminated quartz vein in relatively impermeable metamorphosed pelitic host rock. Solution seams and stylolites are parallel to vein boundary. Bendigo, Australia. Reprinted from Chace (Reference Chace1949). (b) Stylolites normal to vein boundary in limestone.

Various authors (for instance, Pollard & Segall, Reference Pollard, Segall and Atkinson1987; Pollard & Aydin, Reference Pollard and Aydin1988; Schultz & Fossen, Reference Schultz and Fossen2008) have developed terminology to describe displacement discontinuities in brittle rocks. We extend the spirit of that terminology to describe the kinematics of veins as shown in Table 1. The term displacement discontinuity is used as a general term to include veins, compaction bands, joints, shear zones and faults. In this paper compressive stresses are taken to be positive. The term yield surface is used as that surface in stress space that defines the change from elastic behaviour, inside the surface, to rate independent plastic or rate dependent visco-plastic behaviour on the surface. The yield surface can change its position, shape and size as deformation evolves. The term failure surface refers to the displacement discontinuity that develops upon yielding.
Kinematic framework for displacement discontinuities associated with veins in brittle rocks

The classical view of the origin of fracturing associated with vein formation (Bons et al. Reference Bons, Elburg and Gomez-Rivas2012) employs the Mohr–Coulomb yield envelope and the concept of effective stress: the material yields when the Mohr stress circle touches the yield surface; this happens when the fluid pressure is increased (Fig. 2a). Although this approach has been and continues to be extremely useful, there are limitations:
-
The initial stress difference, (σ 1 − σ 3), has to be small (less than the cohesion) for the increase in fluid pressure, P f , to produce a new effective stress state that touches the yield envelope at the tension cut-off so that pure extension fractures can form. Here σ 1 and σ 3 are the maximum and minimum principal stresses with compressive stress taken to be positive.
-
If σ 3 = lithostatic load = ρgh, then increasing the fluid pressure to lithostatic may not result in the effective stress circle touching the yield surface at the tension cut-off (Fig. 2a). In general it touches before reaching the tension cut-off resulting in opening-mode shear fracture. Here, ρ is the rock density, g is the acceleration due to gravity and h is the distance below the surface of the Earth.
-
The yield surface is not bounded for increasing normal stress. In fact as indicated above, Figure 2a implies that the material can sustain infinite normal and shear stresses without yielding. In order to address the last dot point a ‘cap’ is added to the yield surface as indicated in Figure 2b.
Uncapped and capped yield surfaces. (a) The classical Mohr–Coulomb failure criterion. Failure occurs when the pore pressure is increased by P f so that the Mohr stress circle touches the yield surface. The form of the yield surface implies the normal stress can increase indefinitely without resulting in yield. (b) In order to define an upper limit to the normal stress that a material can sustain, a ‘cap’ is added to the classical yield surface. The material can now yield by increasing the fluid pressure and by decreasing the fluid pressure. Similar behaviour is discussed by Rudnicki (Reference Rudnicki, Chuang and Rudnicki2000) and Bésuelle & Rudnicki (Reference Bésuelle, Rudnicki, Guéguen and Boutéca2004). The material can also yield by keeping the fluid pressure constant and increasing (σ 1 − σ 3) as in Figure 4a. Stress states with primes are effective stresses.

The structure of this paper is as follows. In Section 2 we discuss capped yield surfaces and the planar failure discontinuities predicted by classical approaches. In Section 3 failure modes in the capped region of the yield surface are considered for deformations coupled with fluid flow and mineral reactions; the concept of cnoidal waves is introduced. Section 4 considers the resulting implications for various vein types. Section 5 considers the significance of a capped yield surface for failure-mode diagrams (Cox, Reference Cox2010) whilst Section 6 considers the orientations of these failure modes and shows that failure at the cap produces discontinuities in orientations otherwise interpreted as reactivated features. Section 7 considers concepts of fault reactivation/fault-valve models and introduces the concept of mode-switching. Section 8 discusses axial plane structures such as veins and melt segregations whilst a discussion of breccias is included in Section 9. Section 10 is a general discussion and conclusions are drawn in Section 11.
2. Capped yield surfaces
The classical Mohr–Coulomb failure criterion is open ended in the sense that the material can support an infinite normal or mean stress at an infinite shear stress without yielding as shown in Figure 2a. Real materials are not like this, and both the upper values of shear stress and normal stress that can be supported without yielding are capped (Schofield & Wroth, Reference Schofield and Wroth1968; Dimaggio & Sandler, Reference Dimaggio and Sandler1971; Fossum et al. Reference Fossum, Senseny, Pfeifle and Mellegard1995; Wong et al. Reference Wong, David and Zhu1997; Olsson, Reference Olsson1999; Fossum & Fredrich, Reference Fossum, Fredrich, Girard, Liebman, Breeds and Doe2000). A model for such capped yield surfaces is shown in Figure 2b. The various modes of yielding are shown in Figure 4b. An alternative way of portraying the yield surface, applicable both to pressure sensitive brittle materials and to rate sensitive visco-plastic materials is Figure 3 in mean stress, shear stress space. This latter way is the dominant way of portraying stress states at yield in the mechanics literature, but we restrict ourselves initially to the use of Mohr-space except to point out in the Discussion that Cox-failure-mode diagrams (Cox, Reference Cox2010) are a special case of Figure 3.
Model of a capped yield surface (after Aydin et al. Reference Aydin, Borja and Eichhubl2006). Capped yield surface in mean stress – shear stress space with deformation modes shown. n is the normal to the failure surface in the material; m is the incremental strain rate vector. The orientation of the potential surface, the slope of which is tan−1 (dilation angle) is marked in each sector of the yield surface. The dilation angle is the angle m makes with the shearing plane.

A realistic yield surface with curved boundaries. (a) Yield by increasing (σ 1 − σ 3). The material yields at σ 1 = σ 1y (the orange circle). (b) The various modes of yielding: pure extension fracture, extension plus shearing, compaction plus shearing and pure compaction.

3. Failure modes in the capped region
Failure in the capped region of the yield surface is commonly considered as comprising closing-mode, planar compaction bands normal to σ 1. Compaction bands were first discussed from a mechanics point of view in Olsson (Reference Olsson1999) and Issen & Rudnicki (Reference Issen and Rudnicki2000), although hints were made in Vardoulakis & Sulem (Reference Vardoulakis and Sulem1995); the literature until recently has considered a decrease in porosity within a localized layer as the only form of failure in the so called ‘compactional regime’ (see Figs 3, 4b). The idea that compaction bands exist has co-existed with a large number of field studies (see Fossen et al. Reference Fossen, Schultz, Shipton and Mai2007 for a review) where compaction bands have been documented in initially high porosity sandstones. However, recently, it has been suggested (Veveakis & Regenauer-Lieb, Reference Veveakis and Regenauer-Lieb2015; Regenauer-Lieb et al. Reference Regenauer-Lieb, Poulet and Veveakis2016; Alevizos et al. Reference Alevizos, Poulet, Sari, Lesueur, Regenauer-Lieb and Veveakis2017) that such behaviour is not the only form of yield and the inverse is also possible where the yielding layer constitutes an increase in porosity. Thus, the deformation in the unstable layer is dilatant rather than compactive so that dilatant instabilities form as layers normal to the maximum compressive stress. If the deformation is coupled to fluid flow and dissolution/mineral reactions then opening-mode veins can form normal to compression (Alevizos et al. Reference Alevizos, Poulet, Sari, Lesueur, Regenauer-Lieb and Veveakis2017).
To give some physical insight into this counter-intuitive behaviour we note that natural examples of opening-mode veins formed in compression (Fig. 1a) occur typically within altered chlorite-rich rocks derived through hydrothermal alteration of mafic or sedimentary rocks. A common mineral reaction involved here is:
 $$3\,tremolite + 2\,clinozoisite + 10{{ }}{\rm \;C{O_2} + 8\,{H_2}O + 10\,{O_2}} \to 3\,chlorite + 10\,calcite + 6\,quartz$$
This reaction is exothermic and has ΔV = +4.45 %, but if quartz and calcite are removed in solution (to be deposited in the vein) the effective decrease in volume is −41.9 %. Thus, if reactions (including dissolution) such as this proceed during deformation with stress states at the cap part of the yield surface, opening-mode discontinuities are easily accommodated by the decrease in volume generated by the alteration/dissolution reactions. A selection of these mineral reactions is given by Haack & Zimmermann (Reference Haack and Zimmermann1996, table 1) where large ΔV’s are reported for reactions involving no removal of quartz.
The formation of these opening-mode discontinuities in compression arises from competition between the fluid diffusivity and the deformation diffusivity in the compression direction. If the fluid diffusivity exceeds the deformation diffusivity then opening-mode discontinuities form; otherwise closing-mode compaction bands form. Veveakis & Regenauer-Lieb (Reference Veveakis and Regenauer-Lieb2015) showed that the development of opening-mode instabilities normal to compression is described by a reaction diffusion equation involving the diffusion of the fluid pressure, the volumetric plastic strain rate and the mass balance arising from mineral reactions. The solution to this reaction diffusion equation involves elliptical functions, sn and cn, where sn and cn refer to the elliptical sn- and cn-functions, which are the elliptical equivalents of the circular sine- and cosine-functions (Schwalm, Reference Schwalm2015). The patterning of opening discontinuities in compression is expressed as cnoidal waves (Veveakis & Regenauer-Lieb, Reference Veveakis and Regenauer-Lieb2015). A detailed elaboration of the theory behind failure at the capped region is Cier et al. (in press) where the acoustic tensor is used to define the conditions for bifurcation from the homogeneous to the localized state.
The condition required to form dilatant bands in compression is that a critical value of a parameter, λ, is exceeded:
 $$\lambda = {{mechanical \;diffusivity} \over {fluid \;diffusivity}} = {{{{\dot\varepsilon }_n}\mu } \over {kp_n^/}}{H^2}{\lambda _{crit}}$$
where ${{\dot\varepsilon }_n}$
is the strain rate in the loading direction, μ is the fluid viscosity, k is the permeability,
${{\dot\varepsilon }_n}$
is the strain rate in the loading direction, μ is the fluid viscosity, k is the permeability, $p_n^/$
is the volumetric effective mean stress and H is a length scale in the compression direction. As an example, if
$p_n^/$
is the volumetric effective mean stress and H is a length scale in the compression direction. As an example, if ${{\dot\varepsilon }_n}$
= 10−10 s−1, μ = 10−3 Pa s, k = 10−18 m2,
${{\dot\varepsilon }_n}$
= 10−10 s−1, μ = 10−3 Pa s, k = 10−18 m2, $p_n^/$
= 50 MPa and H = 100 m, then λ = 20. In the theory developed by Alevizos et al. (Reference Alevizos, Poulet, Sari, Lesueur, Regenauer-Lieb and Veveakis2017), λ
crit
= 13 (Fig. 5) and the number of discontinuities is
$p_n^/$
= 50 MPa and H = 100 m, then λ = 20. In the theory developed by Alevizos et al. (Reference Alevizos, Poulet, Sari, Lesueur, Regenauer-Lieb and Veveakis2017), λ
crit
= 13 (Fig. 5) and the number of discontinuities is $0.26\sqrt \lambda $
= 1.2 so that quite widely spaced (relative to H) opening-mode discontinuities are expected. We note that Cier et al. (in press) have modifications to this result. Thus, in a given system, dilatant compressive layers are favoured by (1) high strain rates, (2) low permeability and (3) low volumetric effective mean stresses, and are therefore expected in relatively impermeable pelites whereas compaction compressive bands are expected in permeable arenites. The development of dilatant compressive layers is a play-off between the rate of deformation, and/or the rate of volumetric strain arising from mineral reactions, and the rate at which fluid can be supplied to the dilating site. The spacing between dilatant compressional bands is inversely related to λ (Fig. 5a–d). In Figure 5a–d there is no coupling between deformation/fluid flow and mineral reactions or dissolution so that the discontinuities have zero thickness.
$0.26\sqrt \lambda $
= 1.2 so that quite widely spaced (relative to H) opening-mode discontinuities are expected. We note that Cier et al. (in press) have modifications to this result. Thus, in a given system, dilatant compressive layers are favoured by (1) high strain rates, (2) low permeability and (3) low volumetric effective mean stresses, and are therefore expected in relatively impermeable pelites whereas compaction compressive bands are expected in permeable arenites. The development of dilatant compressive layers is a play-off between the rate of deformation, and/or the rate of volumetric strain arising from mineral reactions, and the rate at which fluid can be supplied to the dilating site. The spacing between dilatant compressional bands is inversely related to λ (Fig. 5a–d). In Figure 5a–d there is no coupling between deformation/fluid flow and mineral reactions or dissolution so that the discontinuities have zero thickness.
Spacing of dilatant compression bands as a function of λ. (a–d) The critical value of λ is between 12 and 13 in these examples. The figures are plots of the effective stress against the normalized spacing, ξ/H. After Veveakis & Regenauer-Lieb (Reference Veveakis and Regenauer-Lieb2015). (e, f) Plots of porosity against ξ/H after Alevizos et al. (Reference Alevizos, Poulet, Sari, Lesueur, Regenauer-Lieb and Veveakis2017). In (e) chemical reactions do not contribute to a volume change whereas in (f) they do.

Although the spacing between cnoidal discontinuities is described by λ, the thickness is controlled by the coupling between fluid flow and chemical reactions including dissolution (Stefanou & Sulem, Reference Stefanou and Sulem2014; Alevizos et al. Reference Alevizos, Poulet, Sari, Lesueur, Regenauer-Lieb and Veveakis2017). Now a parameter η, defined by $\eta = {{chemical \;diffusivity} \over {fluid \;diffusivity}}$
is the controlling factor. η is temperature and fluid pressure dependent so that the behaviour of the system depends on the heat balance involving the relative rates of exothermic deformation and exothermic/endothermic mineral reactions such as mineral precipitation/dissolution or melt crystallization/production. An example is shown in Figure 5e, f where there is coupling between deformation/fluid flow and mineral reactions or dissolution and the discontinuities are wide.
$\eta = {{chemical \;diffusivity} \over {fluid \;diffusivity}}$
is the controlling factor. η is temperature and fluid pressure dependent so that the behaviour of the system depends on the heat balance involving the relative rates of exothermic deformation and exothermic/endothermic mineral reactions such as mineral precipitation/dissolution or melt crystallization/production. An example is shown in Figure 5e, f where there is coupling between deformation/fluid flow and mineral reactions or dissolution and the discontinuities are wide.
In summary,
-
In fluid saturated rocks with a cap on the yield surface, some veins form at sites where compressive dilatant bands develop whilst fluids deposit quartz and carbonates in these dilating layers. Solution seams within these layers remove material from the system. Such veins are normal to the principal compression (Fig. 1a) as opposed to extensional veins that form parallel to the principal compression (Fig. 1b). The space occupied by the opening-mode vein is offset by mineral reactions with negative ΔV and/or by dissolution in the matrix between veins.
-
According to Alevizos et al. (Reference Alevizos, Poulet, Sari, Lesueur, Regenauer-Lieb and Veveakis2017), the spacing between these discontinuities is defined by λ whereas the thickness of the resulting layers is defined by η (Fig. 5e, f).
-
Opening-mode compressional veins form in relatively impermeable lithologies whereas closing-mode compaction bands form in relatively permeable lithologies.
4. Laminated veins and crack-seal veins
The best candidates for dilatant compressional veins are the laminated veins characteristic of orogenic gold deposits (Fig. 1a). These almost invariably have stylolites and/or solution seams parallel to the vein margins confirming that σ 1 was normal to the veins at the time of formation of the stylolites. Stylolite parallel laminated quartz veins are known from around the world. Some examples are given by Ferguson & Gannett (Reference Ferguson and Gannett1932; crinkly veins, California, USA), Chace (Reference Chace1949; Bendigo, Australia), Hough et al. (Reference Hough, Bierlein, Ailleres and McKnight2010; Walhalla, Australia) and Cheong et al. (Reference Cheong, Peters, Iriondo, Cluer, Price, Struhsacker, Hardyman and Morris2000; Nevada, USA). The best candidates for classic crack-seal extension veins are those commonly observed in massive sandstones and limestones (Fig. 1b) and their metamorphosed equivalents (Bons et al. Reference Bons, Elburg and Gomez-Rivas2012).
The notion of dilatant compressional veins is quite new and much needs to be understood. At present the theory is one-dimensional and so only planar layers are predicted at periodic spacings. A three-dimensional theory with permeability a function of position would produce non-periodic spacings, more than one set and perhaps non-planar layers. Finally, much more field and microstructural work is needed in parallel with theoretical work whilst shedding the blinkering associated with the classical concepts in Figure 2a. Independently of the theoretical development of this subject we rely on the worldwide observation, mainly from hydrothermal gold deposits, of laminated veins parallel to solution seams and stylolites to support the notion that opening-mode veins can form at high angles to compression.
5. Implications of a cap for failure-mode diagrams
In order to explore the implications of a yield surface cap for the failure-mode diagrams proposed by Cox (Reference Cox2010) we follow Reiweger et al. (Reference Reiweger, Gaume and Schweizer2015) who developed a Mohr–Coulomb yield surface with an elliptical cap for snow. Elliptical caps in sandstone (Fig. 6a) are supported by the experimental work of Wong et al. (Reference Wong, David and Zhu1997). The equation for the cap is written:
 $${\tau _{cap}} = b\sqrt {1 - {{{{\left( {\sigma + {\sigma _t}} \right)}^2}} \over {{{\left( {{\sigma _c} + {\sigma _t}} \right)}^2}}}} \;{\rm{where}} \;b = K\sqrt {{{{{\left( {{\sigma _c} + {\sigma _t}} \right)}^2}} \over {{{\left( {{\sigma _c} + {\sigma _t}} \right)}^2} - {{\left( {{K \over {\tan \phi }}} \right)}^2}}}} $$
Mohr–Coulomb failure criteria with elliptical cap. (a) Construction following Reiweger et al. (Reference Reiweger, Gaume and Schweizer2015). (b) The standard Cox-failure-mode diagram with the additional failure modes arising from a cap. Calculations to define the cap are in the Appendix. (c) The Cox-failure-mode diagram with failure modes for reverse, strike-slip and normal faults indicated. The addition of a cap can severely limit the extent of the failure modes. Cap_low corresponds to σc = 100 MPa and K = 75 MPa; Cap_high corresponds to σc = 200 MPa and K = 175 MPa. (d) The generic Cox-failure-diagram with the caps in (c) added using the constitutive parameter values of Cox (Reference Cox2010). Initial stress states marked as X, Y and ‘reactivated stress states’, A, B, can be outside the yield surface and not possible for the assumed constitutive parameters and the low_cap position.

This corresponds to an ellipse with centre at (−σ
t
, 0), major axis, $\left| {{\sigma _c} + {\sigma _t}} \right|$
, and minor axis, b, as shown in Figure 6a. The maximum normal stress the material can sustain without collapsing is σ = σ
c
and the maximum shear stress the material can sustain without yielding is τ
cap
= K. Both σ
c
and K are material parameters that are independent of each other, except that since σ
t
is generally small,
$\left| {{\sigma _c} + {\sigma _t}} \right|$
, and minor axis, b, as shown in Figure 6a. The maximum normal stress the material can sustain without collapsing is σ = σ
c
and the maximum shear stress the material can sustain without yielding is τ
cap
= K. Both σ
c
and K are material parameters that are independent of each other, except that since σ
t
is generally small, ${\sigma _c} \gt K$
; having set their values, along with σ
t
, b is defined. In addition,
${\sigma _c} \gt K$
; having set their values, along with σ
t
, b is defined. In addition, $\left( {{\sigma _c} + {\sigma _t}} \right) \gt {K \over {\tan \phi }}$
must always be true for b to be real. The position of the cap for various values of σ
c
and K is shown in Figure 7a using the parameters given by Cox (Reference Cox2010). The suggested upper and lower bounds for the cap in Figure 6c, d are prompted by the experimental ranges of
$\left( {{\sigma _c} + {\sigma _t}} \right) \gt {K \over {\tan \phi }}$
must always be true for b to be real. The position of the cap for various values of σ
c
and K is shown in Figure 7a using the parameters given by Cox (Reference Cox2010). The suggested upper and lower bounds for the cap in Figure 6c, d are prompted by the experimental ranges of ${\sigma _c}$
and K reported by Wong et al. (Reference Wong, David and Zhu1997). These are ≈200 to ≈400 MPa for
${\sigma _c}$
and K reported by Wong et al. (Reference Wong, David and Zhu1997). These are ≈200 to ≈400 MPa for ${\sigma _c}$
and ≈150 to ≈250 MPa for K.
${\sigma _c}$
and ≈150 to ≈250 MPa for K.
(a) The cap plotted on a Cox-failure-mode diagram for various values of σ c and K. Comparison with the diagrams proposed in Cox (Reference Cox2010) shows that the permissible region on the failure-mode diagram where stress states can be below yield can be restricted for some values of the cap parameters σ c and K. (b) The maximum value of Λ that results in failure for a given value of (σ 1 – σ 3) and of (σ 1 + σ 3). For the same value of (σ 1 – σ 3), at A and B, but different values of (σ 1 + σ 3), different values of P f and hence Λ result in yield.

A limitation of the Cox-failure-mode diagram is that a stress state with coordinates ( $\left( {{\sigma _1} - {\sigma _3}} \right),\lambda $
) gives no information on the value of
$\left( {{\sigma _1} - {\sigma _3}} \right),\lambda $
) gives no information on the value of $\left( {{\sigma _1} + {\sigma _3}} \right)$
unless some assumption is made regarding the value of
$\left( {{\sigma _1} + {\sigma _3}} \right)$
unless some assumption is made regarding the value of ${\sigma _3}$
. This means that if
${\sigma _3}$
. This means that if $\left( {{\sigma _1} - {\sigma _3}} \right)$
, the diameter of the Mohr circle, is given then there is no information of the position of the Mohr circle on the normal stress axis in normal stress – shear stress space. Thus, the fluid pressure required to move the Mohr circle so that it just touches the yield surface is not defined by the Cox-failure-mode diagram. This pressure is given by
$\left( {{\sigma _1} - {\sigma _3}} \right)$
, the diameter of the Mohr circle, is given then there is no information of the position of the Mohr circle on the normal stress axis in normal stress – shear stress space. Thus, the fluid pressure required to move the Mohr circle so that it just touches the yield surface is not defined by the Cox-failure-mode diagram. This pressure is given by
 $$P_f^{critical} = {{{\sigma _1} + {\sigma _3}} \over 2} - {{\cot \phi } \over 2}\left( {\left( {{\sigma _1} - {\sigma _3}} \right) - 2c} \right)$$
 $$\Lambda _{}^{critical} = {{P_f^{critical}} \over {\rho gh}} = {1 \over {\rho gh}}\left[ {{{{\sigma _1} + {\sigma _3}} \over 2} - {{\cot \phi } \over 2}\left( {\left( {{\sigma _1} - {\sigma _3}} \right) - 2c} \right)} \right]$$
where ρ is the mean rock density, g is the acceleration due to gravity and h is the depth below the surface. $\Lambda _{}^{critical}$
is plotted on Figure 7b for h = 10 km depth. This means that it may not be possible, depending on the value of
$\Lambda _{}^{critical}$
is plotted on Figure 7b for h = 10 km depth. This means that it may not be possible, depending on the value of $\left( {{\sigma _1} + {\sigma _3}} \right)$
, to move an arbitrary initial stress state such as X and Y to positions D and C on the yield surface in Figure 6d by the indicated changes in Λ as shown in that figure.
$\left( {{\sigma _1} + {\sigma _3}} \right)$
, to move an arbitrary initial stress state such as X and Y to positions D and C on the yield surface in Figure 6d by the indicated changes in Λ as shown in that figure.
In the Appendix we derive the expression for ${P_f}$
at failure in terms of
${P_f}$
at failure in terms of $\left( {{\sigma _1} - {\sigma _3}} \right)$
and the optimally oriented failure plane, θ, as
$\left( {{\sigma _1} - {\sigma _3}} \right)$
and the optimally oriented failure plane, θ, as
 \begin{align}{P_f} &= \left[ {{1 \over 2}\left( {{\sigma _1} - {\sigma _3})\left( {1 + \cos 2\theta } \right) + {\sigma _3} + {\sigma _t}} \right)} \right]\\
&\quad \quad - \sqrt {a - \left( {a - c} \right){{{{\left( {{\sigma _1} - {\sigma _3}} \right)}^2}} \over {4{K^2}}}{{\sin }^2}2\theta }\end{align}
\begin{align}{P_f} &= \left[ {{1 \over 2}\left( {{\sigma _1} - {\sigma _3})\left( {1 + \cos 2\theta } \right) + {\sigma _3} + {\sigma _t}} \right)} \right]\\
&\quad \quad - \sqrt {a - \left( {a - c} \right){{{{\left( {{\sigma _1} - {\sigma _3}} \right)}^2}} \over {4{K^2}}}{{\sin }^2}2\theta }\end{align}
where $a = {\left( {{\sigma _c} + {\sigma _t}} \right)^2}$
and
$a = {\left( {{\sigma _c} + {\sigma _t}} \right)^2}$
and $c = {\left( {{K \over {\tan \phi }}} \right)^2}$
.
$c = {\left( {{K \over {\tan \phi }}} \right)^2}$
.
Figure 7a shows a plot of ${\Lambda _v} = {{Fluid \;pressure} \over {Vertical \;stress}}$
against
${\Lambda _v} = {{Fluid \;pressure} \over {Vertical \;stress}}$
against $\left( {{\sigma _1} - {\sigma _3}} \right)$
for various values of σ
c
and K. One sees that the permissible stress states can be severely restricted compared to failure-mode diagrams with no cap.
$\left( {{\sigma _1} - {\sigma _3}} \right)$
for various values of σ
c
and K. One sees that the permissible stress states can be severely restricted compared to failure-mode diagrams with no cap.
6. Orientations of failure surfaces
In uncapped models of yield, the angle, θ, between the normal to the failure surface and the maximum compression axis, σ 1, is given by half the angle between the σ N-axis and the line connecting the centre of the Mohr circle to the point of intersection of the Mohr circle with the yield surface (Fig. 8a, left side). In this case 2θ is always greater than 90° and so the failure surface is inclined at less than 45° to σ 1. In Figure 8a (left) 2θ is 120° and so the failure surface is inclined at 30° to σ 1 and has a reverse sense of movement. The same general rule holds for a capped yield surface (Fig. 8a, right) except that now 2θ is always less than 90° and the failure surface is inclined at greater than 45° to σ 1. In Figure 8a (right) 2θ is 45° and so the failure surface is inclined at 67.5° to σ 1 and has a reverse sense of movement if σ 1 is horizontal. This orientation and the associated reverse sense of displacement have been interpreted as inconsistent with Andersonian fault mechanics (Anderson, Reference Anderson1905, Reference Anderson1951) and hence necessitates reactivation of pre-existing faults (Sibson, Reference Sibson1985; Sibson et al. Reference Sibson, Robert and Poulsen1988; Cox, Reference Cox2010). However, one can see that this geometry is an intrinsic result arising from failure at the cap of the yield surface and does not necessarily imply reactivation.
Orientations of failure surfaces associated with a capped yield surface. θ is the angle between σ 1 and the normal to the failure surface. (a, left) 2θ for failure on the uncapped yield surface. The angle between the failure surface and σ 1 is always less than 45°. (a, right) 2θ for failure on the capped yield surface. The angle between the failure surface and σ 1 is always greater than 45°. (b) Failure on the cap for various values of the Mohr circle diameter. Once the radius of curvature, r, of the Mohr circle matches that of the ellipse, θ drops to zero and remains at zero for all smaller Mohr circles. Note that this same argument follows for the tensile end of the yield surface if it is elliptical.

An additional important result follows from the geometry of the cap. If this cap is elliptical then for a critical radius, r, of the Mohr circle whose radius of curvature matches that of the ellipse and that just touches the cap at σ
c
(θ = 0°) there is just one failure surface normal to σ
1. All smaller Mohr circles (Fig. 8b) result in θ = 0°. The critical radius for an elliptical cap is $r = {{{b^2}} \over a}$
where 2a, 2b are the major and minor axes of the ellipse. Thus, the angle between the failure surface and σ
1 moves rapidly between ∼60° and 90° as the diameter of the Mohr circle becomes smaller (Fig. 9). A detailed discussion of this variation in θ is given by Rudnicki (Reference Rudnicki2004). Figure 9 supports a common observation in natural examples that failure surfaces are either normal to compression or at an angle of 60–70° to the compression axis, with angles in the range <90° to >60° rare. The same is true at the tensile end of the yield surface (if the yield surface is rounded) where failure surfaces in natural examples tend to be parallel or at 30° to the compression axis. Rarely, hybrid failure surfaces are reported with a small angle between the failure surface and σ
1 (Price & Cosgrove, Reference Price and Cosgrove1990).
$r = {{{b^2}} \over a}$
where 2a, 2b are the major and minor axes of the ellipse. Thus, the angle between the failure surface and σ
1 moves rapidly between ∼60° and 90° as the diameter of the Mohr circle becomes smaller (Fig. 9). A detailed discussion of this variation in θ is given by Rudnicki (Reference Rudnicki2004). Figure 9 supports a common observation in natural examples that failure surfaces are either normal to compression or at an angle of 60–70° to the compression axis, with angles in the range <90° to >60° rare. The same is true at the tensile end of the yield surface (if the yield surface is rounded) where failure surfaces in natural examples tend to be parallel or at 30° to the compression axis. Rarely, hybrid failure surfaces are reported with a small angle between the failure surface and σ
1 (Price & Cosgrove, Reference Price and Cosgrove1990).
Angle between the normal to the failure surface and σ 1 for cap failure as the diameter, (σ 1 − σ 3), of the Mohr circle increases at the compressive end of the yield surface. For a range of diameters, this angle is zero, and at a critical diameter, the angle rapidly increases to ∼30°. The value of the critical diameter depends on the shape of the cap and on the constitutive parameters of the material (Rudnicki, Reference Rudnicki2004).

7. Implications for the fault-valve model
Cyclical and coupled changes in stress and fluid pressure states, with associated transitory fluid flow events during seismic cycles, are referred to as fault-valve behaviour (Sibson, Reference Sibson2020). Intrinsic to such a concept is the seismic cycle so that the whole process is driven by tectonic forcing and depends on failure defined by open-ended yield surfaces. Thus, in Figure 2a a seismic event is identified with an increase in fluid pressure causing the Mohr circle to touch the yield surface. The concept also involves episodic breaching and sealing of an ‘impermeable seal’ as fluid pressure increases and decreases. Here we explore the implications of adding a cap to the yield surface. This enables a different model to be developed that is driven by coupled deformation–chemical processes, requires no ‘seal’ and that is only incidentally related to seismic processes. We label this model the mode-switching process; we emphasize, seismicity is not crucial to this process.
Historically (Sibson, Reference Sibson1985), the fault-valve model depends on the geometry of the gold mineralized system at Val d’Or in Canada (Fig. 10, left-hand side). A steeply dipping mineralized zone comprising laminated quartz veins is identified with a reverse fault that is episodically cross-cut by opening-mode crack-seal veins. Recently, Cowan (Reference Cowan2020) has pointed out that the mineralized zone is a shear zone occupying the steep dipping limb of a fold. Since the ‘fault’ does not have the geometry to be expected from Andersonian fault mechanics (Anderson, Reference Anderson1905, Reference Anderson1951; Scholz, Reference Scholz1989), Sibson (Reference Sibson1985) proposed that the fault was a reactivated early normal fault. Episodic increases in fluid pressure are then responsible for episodic reactivation and associated seismic events. However, the introduction of a cap on the yield surface prompts a completely different model (Fig. 10, right-hand side), which we explore below.
Interpretation of the Sibson (Reference Sibson2020) model of Val d’Or geometry in terms of a mode-switching model. Adapted from Sibson (Reference Sibson2020).

7.a. The mode-switching model
We consider a vertical two-dimensional section through a region of the upper crust where brittle mechanisms in concert with pressure solution and fluid transport/deposition of dissolved materials are the essential modes of deformation (Wintsch & Yi, Reference Wintsch and Yi2002; Gratier et al. Reference Gratier, Dysthe, Renard and Dmowska2013). Fluid is injected into the base of this region at a constant Darcy velocity, $\hat V$
, and the fluid pressure or fluid flux is fixed at the top of the region. Then, inverting the normal way of expressing Darcy’s law (Phillips, Reference Phillips1991; Zhao et al. Reference Zhao, Hobbs and Ord2008, pp. 7–15), we write
$\hat V$
, and the fluid pressure or fluid flux is fixed at the top of the region. Then, inverting the normal way of expressing Darcy’s law (Phillips, Reference Phillips1991; Zhao et al. Reference Zhao, Hobbs and Ord2008, pp. 7–15), we write
 $${\rho _{fluid}}g - \nabla {P^{_{fluid}}} = {{\mu \hat V} \over K}$$
where $\nabla {P^{fluid}}$
is the gradient in fluid pressure, K is the permeability, μ and ρ
fluid
are the fluid viscosity and density, and g is the acceleration due to gravity. If a part of the region has permeability, K
1 and fluid pressure gradient,
$\nabla {P^{fluid}}$
is the gradient in fluid pressure, K is the permeability, μ and ρ
fluid
are the fluid viscosity and density, and g is the acceleration due to gravity. If a part of the region has permeability, K
1 and fluid pressure gradient, $\nabla P_1^{fluid}$
, and the permeability changes, by precipitation or dissolution, to K
2, whilst
$\nabla P_1^{fluid}$
, and the permeability changes, by precipitation or dissolution, to K
2, whilst $\hat V$
remains constant in order to satisfy mass continuity, then, for constant μ and g (Zhao et al. Reference Zhao, Hobbs and Ord2008; Hobbs & Ord, Reference Hobbs and Ord2015, pp. 386–8), the fluid pressure gradient changes to
$\hat V$
remains constant in order to satisfy mass continuity, then, for constant μ and g (Zhao et al. Reference Zhao, Hobbs and Ord2008; Hobbs & Ord, Reference Hobbs and Ord2015, pp. 386–8), the fluid pressure gradient changes to $\nabla P_2^{fluid}$
given by
$\nabla P_2^{fluid}$
given by
 $$\nabla P_2^{fluid} = {{{K_1}} \over {{K_2}}}\nabla P_1^{fluid} + {\rho _{fluid}}g\left( {1 - {{{K_1}} \over {{K_2}}}} \right)$$
Hence, if K
1 = 0.1K
2, then $\nabla P_2^{fluid} = 0.1\nabla P_1^{fluid} + 0.9{\rho ^{fluid}}g$
. Thus, if
$\nabla P_2^{fluid} = 0.1\nabla P_1^{fluid} + 0.9{\rho ^{fluid}}g$
. Thus, if $\nabla P_1^{fluid}$
is lithostatic (1.7 × 10⁴ Pa m−1) then
$\nabla P_1^{fluid}$
is lithostatic (1.7 × 10⁴ Pa m−1) then $\nabla P_2^{fluid}$
is 1.07 × 10⁴ Pa m−1, which is just above a hydrostatic gradient (104 Pa m−1). Here we assume ρ
rock
= 2700 kg m−3 and g = 10 ms−2. The principle is illustrated in Figure 11a, b where, as an example, we take a block 30 m high.
$\nabla P_2^{fluid}$
is 1.07 × 10⁴ Pa m−1, which is just above a hydrostatic gradient (104 Pa m−1). Here we assume ρ
rock
= 2700 kg m−3 and g = 10 ms−2. The principle is illustrated in Figure 11a, b where, as an example, we take a block 30 m high.
Fluid flow models with changes in permeability. (a) A block of material with layered permeability. Fluid flux fixed at base and top at 2.7 × 10⁻⁸ m s−1. Permeability (K1) in bottom and top layers is 10−15 m2. The middle layer has permeability K2 = 10−14 m2. This means the fluid pressure gradient in the bottom and top layers is lithostatic. For mass continuity, the fluid pressure gradient in the middle layer is (lithostatic/10). The yellow lines are fluid pressure contours at 1 × 10⁵ Pa spacing. (b) Fluid pressure gradients in (a). (c, d) The mode-switching model, see text for description. Yellow lines are fluid streamlines. Black lines are fluid pressure contours. These models were constructed using the finite difference code FLAC (ITASCA, 2008). The fluid viscosity is taken to be 10−3 Pa s.

The essence of the mode-switching model is shown in Figure 11c, d. An antiform is shown composed of material with permeability, K
5. This is embedded in material with permeability, K
4, with K
5 < K
4. In Figure 11c a fault with permeability K
3 cuts the hinge of the antiform and K
3 > K
4 > K
5. Fluid is injected at the base of the model with fixed Darcy velocity, $\hat V$
, and leaves at the top with the same velocity. The fluid stream lines are shown in yellow and the fluid pressure contours in black. In Figure 11c the stream lines are focused into the fault and the fluid pressure gradient in the gap in the low permeability layer is decreased by dissolution relative to the surrounding material. In Figure 11d the permeability in the gap and the fault below the antiform is decreased by precipitation. The stream lines now are deflected around the position of the fault and the pressure gradient in the gap is now increased relative to the surroundings. This increase in fluid pressure results in dissolution by pressure solution and the permeability increases returning the situation to Figure 11c. The cycle then repeats driven by the imposed deformation. Although this model is not fully coupled, in that the dissolution/precipitation processes, and hence permeability changes, are not explicitly modelled, the model captures the essence of a fully coupled model. A fully coupled model is the subject of another paper in preparation.
$\hat V$
, and leaves at the top with the same velocity. The fluid stream lines are shown in yellow and the fluid pressure contours in black. In Figure 11c the stream lines are focused into the fault and the fluid pressure gradient in the gap in the low permeability layer is decreased by dissolution relative to the surrounding material. In Figure 11d the permeability in the gap and the fault below the antiform is decreased by precipitation. The stream lines now are deflected around the position of the fault and the pressure gradient in the gap is now increased relative to the surroundings. This increase in fluid pressure results in dissolution by pressure solution and the permeability increases returning the situation to Figure 11c. The cycle then repeats driven by the imposed deformation. Although this model is not fully coupled, in that the dissolution/precipitation processes, and hence permeability changes, are not explicitly modelled, the model captures the essence of a fully coupled model. A fully coupled model is the subject of another paper in preparation.
The process known as pressure solution consists of dissolution of material at places where the Helmholtz energy arising from strain is high and transfer of that material is into a nearby fluid. The thermodynamics of the process was first discussed by Gibbs (Reference Gibbs1876) and elaborated upon by Kamb (Reference Kamb1961), Cahn (Reference Cahn1989) and Sekerka & Cahn (Reference Sekerka and Cahn2004). Gibbs pointed out that the solution becomes supersaturated and, given the opportunity, precipitates on some other kinetically favourable surface (Frolov & Mishin, Reference Frolov and Mishin2010). The process of transport of material from strained sites to deposition sites is known as solution transfer. The driving force for the dissolution process is the increased strain energy of the material expressed as the Helmholtz energy density, ψ. There have been various attempts to derive a constitutive law for materials undergoing deformation by pressure solution (see Gratier et al. Reference Gratier, Dysthe, Renard and Dmowska2013, table 2.3 for examples) assuming various geometrical and physical models for the process but, independently of the precise physics, dimensional analysis suggests that such a constitutive law for one dimension and isothermal small elastic strains is of the form

or,
 $$\dot \varepsilon = {\it A\left( t \right){{\psi \left( t \right)} \over G}k\left( t \right) = A\left( t \right){{\sigma \left( t \right)\varepsilon } \over G}k\left( t \right)}$$
Here we have written the Helmholtz energy density as the product of stress and strain. An expression in terms of the elastic moduli for a general stress state is given by Houlsby & Puzrin (Reference Houlsby and Puzrin2006, p. 78). Equation (1) is of the same form as derived by Rutter (Reference Rutter1976), Paterson (Reference Paterson1995) and Shimizu (Reference Shimizu1997, Reference Shimizu1995) and others (Gratier et al. Reference Gratier, Dysthe, Renard and Dmowska2013, table 2.3) except that those authors assumed that only one component of the stress contributes to the energy driving dissolution and not the total strain energy. The distinction is important since neglecting the strain dependence introduces an error of order ≈10−3, the maximum value of the elastic strain. Dependence on grain size and grain boundary structure is included in the dimensionless geometrical factor, A. However if the stress depends on grain size or shape then an exponential dependence of strain rate on stress can be introduced (Gratier et al. Reference Gratier, Dysthe, Renard and Dmowska2013). The elastic shear modulus, G, is included to ensure the equation is dimensionally correct; neglect of a factor such as G introduces an error of ≈1011. Equation (1), in the absence of a grain size/shape stress dependence, predicts a linear dependence of strain rate on stress and upon dissolution rate as do Paterson and Shimizu and many other authors. Note that Equation (1) specifies a dependence of A, ψ and k on time arising from the evolution in geometry, stress and/or dissolution mechanisms. This introduces the possibility of Equation (1) being nonlinear in time as discussed by Gratier et al. (Reference Gratier, Dysthe, Renard and Dmowska2013, section 3.4.4).
Thus, for a constant strain rate, the stress is inversely proportional to the dissolution reaction rate, which in turn is a function of the fluid pressure, pH, fluid chemical composition and temperature (Fournier & Potter, Reference Fournier and Potter1982; Dove & Rimstidt, Reference Dove and Rimstidt1994; Manning, Reference Manning1994). Here we consider only the dependence on fluid pressure. The dependence of dissolution rate on fluid pressure arises from expressions such as equation (21) of Dove & Rimstidt (Reference Dove and Rimstidt1994) where the dissolution rate constant for quartz is proportional to the square of the fugacity of H2O. Thus, a decrease in fluid pressure results in decreased solubility of quartz and hence precipitation of quartz leading to decreased permeability. Importantly, decreased pressure also results in decreased dissolution rate that, through Equation (1), results in an increase in effective stress. The decrease in fluid pressure drives the Mohr circle to the cap end of the failure surface, and this coupled with high stress results in failure at the cap. The inverse is also true so that an increase in fluid pressure results in increased solubility and hence increased permeability. Increases in fluid pressure also lead to a decrease in the stress. The coupling between decreased stress and increased fluid pressure leads to failure at the extension end of the yield surface. The sequence of processes accompanying a decreased $ \leftrightarrow $
increased fluid pressure cycle is captured in Figure 12a.
$ \leftrightarrow $
increased fluid pressure cycle is captured in Figure 12a.
The mode-switching cycle. (a) The complete cycle. High permeability leads to low fluid pressure and hence low equilibrium solubility and hence precipitation. The low fluid pressure also leads to a low reaction rate and hence, from Equation (1), high effective stress. These conditions of low fluid pressure and high stress lead to opening-mode discontinuities forming normal or at a high angle to compression. Precipitation produces low permeability and hence high fluid pressure and high equilibrium solubility and dissolution. The high fluid pressure also leads to a high reaction rate and hence, from Equation (1), low stress. These conditions of high fluid pressure and low stress initiate opening-mode discontinuities forming parallel or at a low angle to compression. The dissolution produces high permeability and the cycle repeats. (b) The mode-switching cycle coupled to the seismic cycle where high stress leads to accelerated slip and high fluid pressure leads to failure at the extensile end of the yield surface.

Thus, the mode-switching process is a chemical precipitation $ \leftrightarrow $
dissolution cycle driven by an imposed strain rate coupled to fluid flow. It can operate independently of any seismic activity but can also be coupled to seismicity since high fluid pressures can, in principle, nucleate sliding on fault surfaces. Such failure occurs at the extension end of the yield surface whereas high stresses at low fluid pressures at the cap end of the yield surface result in accelerated slip on suitably oriented faults (Fig. 12b). The mode-switching mechanism represents a switching between failure modes at the cap end of the yield surface (non-Andersonian structures at high angles to compression) and failure modes at the tensile end (Andersonian structures at low angles to compression).
$ \leftrightarrow $
dissolution cycle driven by an imposed strain rate coupled to fluid flow. It can operate independently of any seismic activity but can also be coupled to seismicity since high fluid pressures can, in principle, nucleate sliding on fault surfaces. Such failure occurs at the extension end of the yield surface whereas high stresses at low fluid pressures at the cap end of the yield surface result in accelerated slip on suitably oriented faults (Fig. 12b). The mode-switching mechanism represents a switching between failure modes at the cap end of the yield surface (non-Andersonian structures at high angles to compression) and failure modes at the tensile end (Andersonian structures at low angles to compression).
8. Axial plane structures: quartz and melt veins
The enigmatic occurrence of veins and melt accumulations parallel to the axial planes of folds is well documented. For reviews see Vernon & Paterson (Reference Vernon and Paterson2001), Weinberg et al. (Reference Weinberg, Veveakis and Regenauer-Lieb2015) and Druguet (Reference Druguet2019). Some examples are given in Figure 13. Explanations for these structures vary widely and include the influences of initial fabric anisotropy and fabric heterogeneity, reorientation of older structures, relaxation or switching of stresses and preferential melting along planes normal to compression. The array of explanations reflects the difficulties inherent in concepts based on uncapped yield surfaces. Weinberg et al. (Reference Weinberg, Veveakis and Regenauer-Lieb2015) and Veveakis et al. (Reference Veveakis, Regenauer-Lieb and Weinberg2015) presented models for axial plane leucosomes in terms of compaction-driven instabilities based on a capped yield surface. Their model is based on Veveakis & Regenauer-Lieb (Reference Veveakis and Regenauer-Lieb2015), as is this paper.
Axial plane quartz and melt veins. (a, b) Axial plane veins, Harvey’s Retreat, Kangaroo Island, Australia. (a) is ≈1 m wide and (b) is ≈2 m wide. (c) Axial plane melt veins. Reprinted from Vernon & Paterson (Reference Vernon and Paterson2001), Copyright (2001), with permission from Elsevier.

The important point elaborated upon by Alevizos et al. (Reference Alevizos, Poulet, Sari, Lesueur, Regenauer-Lieb and Veveakis2017) is that the development of both axial plane veins and melt accumulations involve mineral reactions (dissolution and deposition, melting and crystallization) that are either endothermic or exothermic. Such processes are fundamental in controlling the widths of opening-mode compaction instabilities at a high angle to compression as discussed in Section 3.
The progressive development of axial plane veins is envisaged as follows: axial plane veins are opening-mode discontinuities formed in compression under relatively low fluid (including melt) pressure – high stress conditions, perhaps as part of the mode-switching cycle. Even though the fluid pressure is low in the discontinuity it is higher than in the regions outside the discontinuity. The low pressure enables precipitation of quartz in the vein. If the fluid pressure increases in the discontinuity then dissolution may be initiated as is common in a laminated vein.
The situation is somewhat different for axial plane leucosomes: The rock is assumed to be at or just below the liquidus. The pressure in the axial plane discontinuity is higher than outside the discontinuity, so melting will take place preferentially within the discontinuity (Thompson, Reference Thompson1988). This relationship was suggested in a slightly different context for shear zones with high dilatancy by Ord (Reference Ord, Knipe and Rutter1990). If the melt pressure increases within the discontinuity then increased melting is favoured. The width of the leucosome is a function of the parameter η (Alevizos et al. Reference Alevizos, Poulet, Sari, Lesueur, Regenauer-Lieb and Veveakis2017). The larger is η the wider the leucosome.
It is of some interest to note that processes resulting in compaction melt structures parallel to compression have been developed by Rabinowicz & Vigneresse (Reference Rabinowicz and Vigneresse2004). These in the anatectic domain are the conceptual equivalent of crack-seal veins in the dissolution–precipitation domain. Thus, during a mode-switching cycle it is possible that switching between the development of leucosomes at high angles and low angles to compression can occur resulting in the common observation of layered leucosomes with other leucosomes at high angles to the layering. Examples are figures A2, B45, D24, D30 and E3 in Sawyer (Reference Sawyer2008).
9. Brecciation
Wong et al. (Reference Wong, David and Zhu1997) showed experimentally that cataclasis is associated with hardening of an elliptical cap on the yield surface (Fig. 14a). The mechanics and thermodynamics of breakage have been discussed by Einav (Reference Einav2007 a,b) and Nguyen & Einav (Reference Nguyen and Einav2009). The measure of the degree of breakage adopted by Einav (Reference Einav2007 a) is the ratio of the area under the current fragment size distribution to that under the final fragment size distribution. Figure 14 shows the hardening of the cap associated with breakage.
Hardening of the cap arising from breakage. (a) Expansion of the cap arising from fragmentation. The evolution of the cap is controlled by the degree of breakage (Nguyen & Einav, Reference Nguyen and Einav2009). (b) Modes of failure. The line AB marks the boundary between friction dominated and breakage dominated failure modes resulting in different brecciation modes.

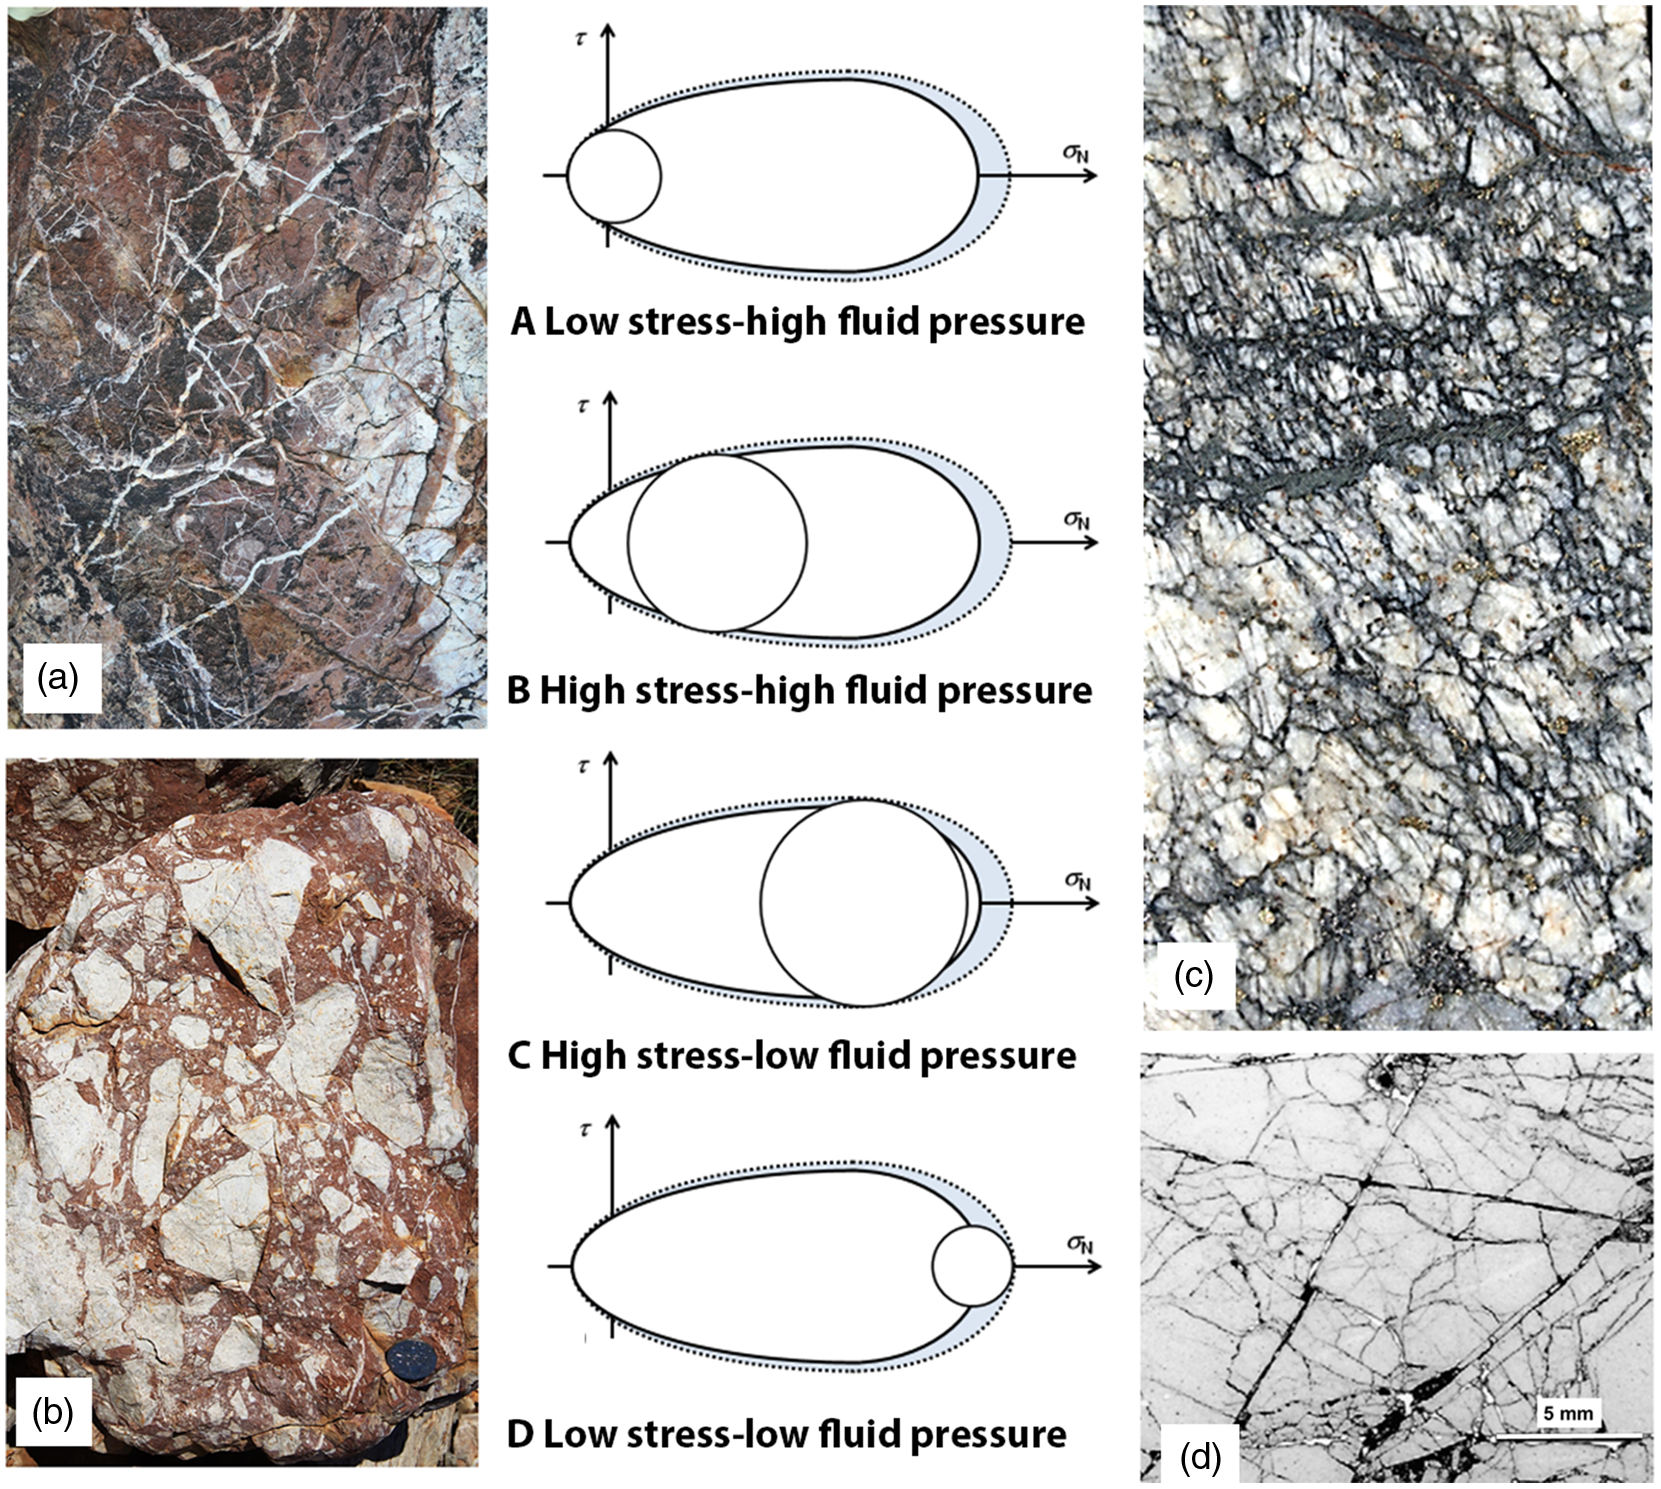
On the basis of the work of Wong et al. (Reference Wong, David and Zhu1997) and Nguyen & Einav (Reference Nguyen and Einav2009) we recognize four end-member classes of breccia (Fig. 15) that arise from the mode-switching cycle. The first corresponds to low stress and high fluid pressure where the stress circle exceeds the tensile end of the yield surface. Failure is essentially by opening-mode veining (A in Fig. 15). The second corresponds to high stress and high fluid pressure where the stress circle exceeds the tensile-shear part of the yield surface. This corresponds to considerable dilation and mineral precipitation with the formation of clast unsupported breccias (B in Fig. 15). The third corresponds to high stress and low fluid pressure where the stress circle exceeds the cap part of the yield surface. The result is a closing-mode breccia with solution seams and mineral precipitation (C in Fig. 15). The fourth corresponds to low stress and low fluid pressure where the stress circle exceeds the cap tip part of the yield surface. This corresponds to collapse fracturing and little mineral precipitation (D in Fig. 15). Each of these classes has clearly defined fabrics associated with their development (Fig. 15).
The four end-member classes of breccia. (a) Low stress – high fluid pressure. Stress circle exceeds the extension end of the yield surface. Failure is essentially by veining. (b) High stress – high fluid pressure. Stress circle exceeds the extension–shear part of yield surface with considerable dilation and mineral precipitation. (c) High stress – low fluid pressure. Stress circle exceeds the cap part of yield surface with solution seams and mineral precipitation. (d) Low stress – low fluid pressure. Stress circle exceeds the cap tip part of yield surface with collapse fracturing and little mineral precipitation.
10. Discussion
This paper discusses the implications of adding a cap to the classical open-ended Mohr–Coulomb yield surface along with the added effects of coupling to fluid flow and chemical reactions that result in negative ΔV or in dissolution, fluid transport and precipitation. Behaviour at the cap is controlled by competition between fluid flow diffusivities and deformation diffusivities. For a constant strain rate, low permeability results in opening-mode discontinuities normal to compression (but only if the deformation is coupled to mineral reactions that lead to a decrease in volume in the matrix of the rock) whereas high permeability results in compaction bands. The result is nonlinear behaviour where the inverse relationship between stress and dissolution/precipitation reaction rates drives oscillatory behaviour between high fluid pressure – low differential stress states and low fluid pressure – high differential stress states. This cyclic behaviour is accompanied by oscillations between classic extension veins parallel to compression (typically crack-seal veins) and stylolite parallel veins normal to compression (typically laminated or quartz-ribbon veins). The deformation–chemical-driven aseismic cyclic behaviour, labelled mode-switching, is an alternative to the seismically driven fault-valve process described by Sibson (Reference Sibson2020). The mode-switching process does not involve mechanical breaching of a hydraulic ‘seal’ nor reactivation of faults at high angles to compression and need not be coupled to seismic activity. Axial plane veins (commonly parallel to axial plane solution seams) and melt segregations belong to the class of discontinuities formed by failure at the cap. Brecciation is the result of failure associated with a hardening cap.
The treatment in this paper largely neglects thermal effects such as heat produced by frictional sliding, breakage and exothermal mineral reactions (such as mineral dissolution) or heat absorbed by endothermic mineral reactions (such as mineral deposition). Quartz deposition is particularly important here. We assume that ΔH 0 for the quartz deposition reaction is approximately equal to the activation energy, E a , determined by Rimstidt & Barnes (Reference Rimstidt and Barnes1980, their table 4). Thus, for the endothermic reaction
 $${{\rm{H}}_{\rm{4}}}{\rm{Si}}{{\rm{O}}_{\rm{4}}} \to {\rm{Si}}{{\rm{O}}_{\rm{2}}}_{(solid)} + {\rm{ 2}}{{\rm{H}}_{\rm{2}}}{\rm{O}}$$
ΔH 0 is approximately 71 kJ mol−1. This means that the deposition of 1 cubic metre of quartz requires ≈3.127 × 10⁶ kJ of heat. If this deposition occurs over 105 years then the heat absorption rate is a massive 10−3 W m−3, which is far in excess of the average radiogenic crustal heat production rate. Shorter time frames increase the heat production rates. The behaviour of the coupled deformation–chemical reaction system we have described in this paper depends on the competition between exothermic processes such as frictional deformation, breakage and the production of new surfaces, mineral dissolution and endothermic processes such as mineral deposition. Typically such systems are episodic in behaviour as heat and mass supply compete with heat and mass consumption (Lesueur et al. Reference Lesueur, Poulet and Veveakis2020), and a full understanding of the mode-switching model depends on incorporation of such thermal effects.
A more realistic treatment would also include the influence of anisotropy on the shape of the yield surface, and this is probably needed to explain why one only observes single orientations of failure surfaces in the field rather than ubiquitous conjugate pairs.
Although the treatment here has concentrated on brittle behaviour, Wintsch & Yi (Reference Wintsch and Yi2002) have emphasized that dissolution and replacement creep can be an important mechanism in the deep crust, and so the oscillatory switching between dissolution and deposition may be an important process even at high metamorphic grades where the Mohr–Coulomb yield surface is replaced by a capped elastic–plastic-viscous yield surface. Wintsch & Yeh (Reference Wintsch and Yeh2013) have further suggested that oscillations between reaction weakening and reaction strengthening can result in switching between ductile and brittle behaviour. All of these processes have the potential to produce strong feedback relationships so that not only does the fluid pressure oscillate as the crust deforms but also the yield surface can change shape and size with mineral reactions producing oscillations in fluid pressure, dissolution, precipitation, veining and brecciation.
Finally, we note that the failure-mode diagrams of Cox (Reference Cox2010) are special examples of the mean stress – shear stress diagrams commonly used in the soil mechanics literature in particular (Schofield & Wroth, Reference Schofield and Wroth1968), but also in the experimental rock deformation literature. In this case, the fluid pressure is equal to the mean stress for elastic deformations (Hobbs & Ord, Reference Hobbs, Ord, Gessner, Blenkinsop and Sorjonen-Ward2018) so that the use of a mean stress – shear stress diagram up until yield is equivalent to a Cox-failure-mode diagram. The modes of failure on mean stress – shear stress diagrams are shown in Figure 16.
Cox-failure-mode diagrams expressed as modified mean stress – shear stress diagrams. (a) Plastic failure modes. (b) Classes of breccia.

11. Conclusions
We have explored several implications of adding a cap to the yield surface for elastic–plastic and elastic–visco-plastic materials. Such a cap ensures that the necessity, implied by uncapped yield surfaces, for the deforming rock to support infinite shear and normal stresses is overcome. Failure at the cap results in compaction bands for highly permeable rocks but results in opening-mode discontinuities forming normal to compression in low permeability rocks if the deformation is coupled to mineral reactions that lead to a decrease in volume in the matrix of the rock. These opening-mode structures appear as laminated veins with vein parallel stylolites and solution seams and contrast with opening-mode veins that form normal to stylolites at the extension end of the yield surface. The addition of a cap can severely limit the permissible stress states that can be represented on a Cox-failure-mode diagram. Failure at the cap in fluid saturated low permeability rocks also results in opening-shear structures at high angles to compression. These are commonly interpreted as reactivated older normal faults, but the addition of a cap makes such an interpretation unnecessary.
A capped yield surface means that a deforming fluid saturated rock mass automatically oscillates between a low stress – high fluid pressure, low permeability state and a high stress – low fluid pressure, high permeability state controlled by competition between dissolution and precipitation. This process, labelled mode-switching, is a coupled mineral reaction – deformation – fluid flow cyclic mechanism that is an alternative to the fault-valve process. The mode-switching process involves switching between reverse slip on discontinuities at a high angle to compression and the operation of opening-mode discontinuities at a low angle to compression. Mode-switching does not depend on fluids breaching a permeability ‘seal’ and is intrinsically aseismic, although it can, in principle, nucleate a seismic cycle process.
The addition of a cap to the yield surface also provides a basis for the development of axial plane veins and melt segregations together with various classes of breccias. The capped yield surface concept provides a unifying self-consistent approach for vein/breccia formation, cyclic yielding and fluid flow and for the kinematics of brittle rocks undergoing solution creep.
Acknowledgements
We thank John Rudnicki and two anonymous reviewers for their helpful and stimulating observations and comments. This research did not receive any specific grant from funding agencies in the public, commercial or not-for-profit sectors. We have no competing interests.
Appendix Equation for an elliptical cap in a Mohr–Coulomb material
We follow Reiweger et al. (Reference Reiweger, Gaume and Schweizer2015) who developed a Mohr–Coulomb yield surface with a cap for compacted snow. The equation for the cap is written:
 $${\tau _{cap}} = b\sqrt {1 - {{{{\left( {\sigma + {\sigma _t}} \right)}^2}} \over {{{\left( {{\sigma _c} + {\sigma _t}} \right)}^2}}}} \;{\rm{where}} \;b = K\sqrt {{{{{\left( {{\sigma _c} + {\sigma _t}} \right)}^2}} \over {{{\left( {{\sigma _c} + {\sigma _t}} \right)}^2} - {{\left( {{K \over {\tan \phi }}} \right)}^2}}}} $$
This corresponds to an ellipse with centre at (−σ
t
, 0), major axis, $\left| {{\sigma _c} + {\sigma _t}} \right|$
and minor axis, b, as shown in Figure 6a. The maximum normal stress the material can sustain without collapsing is σ = σ
c
and the maximum shear stress the material can sustain without yielding is τ
cap
= K. Both σ
c
and K are material parameters that are independent of each other, except that since σ
t
is generally small,
$\left| {{\sigma _c} + {\sigma _t}} \right|$
and minor axis, b, as shown in Figure 6a. The maximum normal stress the material can sustain without collapsing is σ = σ
c
and the maximum shear stress the material can sustain without yielding is τ
cap
= K. Both σ
c
and K are material parameters that are independent of each other, except that since σ
t
is generally small, ${\sigma _c} \gt K$
; having set their values, along with σ
t
, b is defined. In addition,
${\sigma _c} \gt K$
; having set their values, along with σ
t
, b is defined. In addition, $\left( {{\sigma _c} + {\sigma _t}} \right) \gt {K \over {\tan \phi }}$
must always be true for b to be real.
$\left( {{\sigma _c} + {\sigma _t}} \right) \gt {K \over {\tan \phi }}$
must always be true for b to be real.
We write the following expressions involving only material parameters:
 $$a = {\left( {{\sigma _c} + {\sigma _t}} \right)^2},\,\,\,c = {\left( {{K \over {\tan \phi }}} \right)^2}$$
Then
 $${\tau _{cap}} = b\sqrt {1 - {{{{\left( {\sigma + {\sigma _t}} \right)}^2}} \over a}} \;{\rm{and}}\,\,b = K\sqrt {{a \over {a - c}}} $$
The equation for the cap becomes:
 $${\tau _{cap}} = b\sqrt {1 - {{{{\left( {\sigma + {\sigma _t}} \right)}^2}} \over a}} = K\sqrt {{{a - {{\left( {\sigma + {\sigma _t}} \right)}^2}} \over {a - c}}} $$
We now put ${\sigma ^\prime} = \sigma + {P_f}$
where
${\sigma ^\prime} = \sigma + {P_f}$
where ${\sigma ^\prime}$
is the effective normal stress at yield and
${\sigma ^\prime}$
is the effective normal stress at yield and ${P_f}$
is the fluid pressure at yield in the cap region. Notice that one adds the fluid pressure rather than subtracting as in the classical situation with no cap since here the fluid pressure is decreased rather than increased to enable yield.
${P_f}$
is the fluid pressure at yield in the cap region. Notice that one adds the fluid pressure rather than subtracting as in the classical situation with no cap since here the fluid pressure is decreased rather than increased to enable yield.
Now the equation for the cap at yield is:
 $$\tau _{cap}^{} = K\sqrt {{{a - {{\left( {{\sigma ^/} - {P_f} + {\sigma _t}} \right)}^2}} \over {a - c}}} $$
Resulting in: $\tau _{cap}^{} = K\sqrt {{{a - {{\left( {{\sigma ^/} - {P_f} + {\sigma _t}} \right)}^2}} \over {a - c}}} $
or, ${P_f} = \left( {{\sigma ^/} + {\sigma _t}} \right) - \sqrt {a - \left( {a - c} \right)\tau _{cap}^2 /{K^2}} $
We now write the standard relationships (from here on the principal stresses are effective stresses):
 $${\sigma ^/} = {{{\sigma _1} + {\sigma _3}} \over 2} + {{{\sigma _1} - {\sigma _3}} \over 2}\cos 2\theta = {{{\sigma _1} - {\sigma _3} + 2{\sigma _3}} \over 2} + {{{\sigma _1} - {\sigma _3}} \over 2}\cos 2\theta $$
and ${\tau _{cap}} = - {{{\sigma _1} - {\sigma _3}} \over 2}\sin 2\theta $
or, ${\sigma ^/} = {1 \over 2}\left( {{\sigma _1} - {\sigma _3}} \right)\left( {1 + \cos 2\theta } \right) + {\sigma _3}$
and
${\sigma ^/} = {1 \over 2}\left( {{\sigma _1} - {\sigma _3}} \right)\left( {1 + \cos 2\theta } \right) + {\sigma _3}$
and ${\tau _{cap}} = - {{{\sigma _1} - {\sigma _3}} \over 2}\sin 2\theta $
Then the expression for ${P_f}$
in terms of
${P_f}$
in terms of $\left( {{\sigma _1} - {\sigma _3}} \right)$
becomes
$\left( {{\sigma _1} - {\sigma _3}} \right)$
becomes
 \begin{align}{P_f} &= \left[ {{1 \over 2}\left( {{\sigma _1} - {\sigma _3})\left( {1 + \cos 2\theta } \right) + {\sigma _3} + {\sigma _t}} \right)} \right]\\
&\quad \quad - \sqrt {a - \left( {a - c} \right){{{{\left( {{\sigma _1} - {\sigma _3}} \right)}^2}} \over {4{K^2}}}{{\sin }^2}2\theta }\end{align}
\begin{align}{P_f} &= \left[ {{1 \over 2}\left( {{\sigma _1} - {\sigma _3})\left( {1 + \cos 2\theta } \right) + {\sigma _3} + {\sigma _t}} \right)} \right]\\
&\quad \quad - \sqrt {a - \left( {a - c} \right){{{{\left( {{\sigma _1} - {\sigma _3}} \right)}^2}} \over {4{K^2}}}{{\sin }^2}2\theta }\end{align}
The equation for P f versus (σ 1 – σ 3) at yield is therefore a parabola. This means the complete failure-mode diagram consisting of the classical Cox function plus a cap is as in Figure 6b.
We now take the values for the various constitutive parameters as in Cox (Reference Cox2010), namely, $\theta = {1 \over 2}{\tan ^{ - 1}}\left( {{1 \over \mu }} \right)$
; μ = 0.75; 2θ = 53.13°; sin 2θ = 0.8; cos 2θ = 0.6;
$\theta = {1 \over 2}{\tan ^{ - 1}}\left( {{1 \over \mu }} \right)$
; μ = 0.75; 2θ = 53.13°; sin 2θ = 0.8; cos 2θ = 0.6;
ϕ = tan−1 μ = 36.87°; σ t = 5 MPa; C = 3.75 MPa; depth, z = 10 km so that σ 3 = ρgz = 265 MPa.
Then $a = {\left( {{\sigma _c} + {\sigma _t}} \right)^2} = {\left( {{\sigma _c} + 5} \right)^2}$
;
$a = {\left( {{\sigma _c} + {\sigma _t}} \right)^2} = {\left( {{\sigma _c} + 5} \right)^2}$
; $c = {\left( {{K \over {\tan \phi }}} \right)^2} = {\left( {1.3333K} \right)^2}$
so that
$c = {\left( {{K \over {\tan \phi }}} \right)^2} = {\left( {1.3333K} \right)^2}$
so that
 \begin{align}b &= K\sqrt {{a \over {a - c}}} = K\sqrt {{{{{\left( {{\sigma _c} + {\sigma _t}} \right)}^2}} \over {{{\left( {{\sigma _c} + {\sigma _t}} \right)}^2} - {{\left( {{K \over {\tan \phi }}} \right)}^2}}}}\\
&\quad = K\sqrt {{{{{\left( {{\sigma _c} + 5} \right)}^2}} \over {{{\left( {{\sigma _c} + 5} \right)}^2} - {{(1.3333K)}^2}}}}\end{align}
\begin{align}b &= K\sqrt {{a \over {a - c}}} = K\sqrt {{{{{\left( {{\sigma _c} + {\sigma _t}} \right)}^2}} \over {{{\left( {{\sigma _c} + {\sigma _t}} \right)}^2} - {{\left( {{K \over {\tan \phi }}} \right)}^2}}}}\\
&\quad = K\sqrt {{{{{\left( {{\sigma _c} + 5} \right)}^2}} \over {{{\left( {{\sigma _c} + 5} \right)}^2} - {{(1.3333K)}^2}}}}\end{align}
 \begin{align}{P_f} &= \left[ {{1 \over 2}\left( {{\sigma _1} - {\sigma _3})\left( {1 + \cos 2\theta } \right) + {\sigma _3} + {\sigma _t}} \right)} \right]\\
&\quad - \sqrt {a - \left( {a - c} \right){{{{\left( {{\sigma _1} - {\sigma _3}} \right)}^2}} \over {4{K^2}}}{{\sin }^2}2\theta }\end{align}
\begin{align}{P_f} &= \left[ {{1 \over 2}\left( {{\sigma _1} - {\sigma _3})\left( {1 + \cos 2\theta } \right) + {\sigma _3} + {\sigma _t}} \right)} \right]\\
&\quad - \sqrt {a - \left( {a - c} \right){{{{\left( {{\sigma _1} - {\sigma _3}} \right)}^2}} \over {4{K^2}}}{{\sin }^2}2\theta }\end{align}
 \begin{align}{P_f} &= \left[ {0.8\left( {{\sigma _1} - {\sigma _3}) + 270} \right)} \right]\\
&\quad - \sqrt {{{\left( {{\sigma _c} + 5} \right)}^2} - 0.16\left( {{{\left( {{\sigma _c} + 5} \right)}^2} - {{\left( {1.3333K} \right)}^2}} \right){{\left( {{\sigma _1} - {\sigma _3}} \right)}^2}/{K^2}}\end{align}
\begin{align}{P_f} &= \left[ {0.8\left( {{\sigma _1} - {\sigma _3}) + 270} \right)} \right]\\
&\quad - \sqrt {{{\left( {{\sigma _c} + 5} \right)}^2} - 0.16\left( {{{\left( {{\sigma _c} + 5} \right)}^2} - {{\left( {1.3333K} \right)}^2}} \right){{\left( {{\sigma _1} - {\sigma _3}} \right)}^2}/{K^2}}\end{align}
and
 $$\matrix{
{\Lambda = {{{P_f}} \over {{\sigma _3}}} = 0.0038\left\{ {\left[ {0.8({\sigma _1} - {\sigma _3}) + 270} \right]} \right.} \hfill \cr
} $$
$$\matrix{
{\Lambda = {{{P_f}} \over {{\sigma _3}}} = 0.0038\left\{ {\left[ {0.8({\sigma _1} - {\sigma _3}) + 270} \right]} \right.} \hfill \cr
} $$
 $$ - \sqrt {{{\left( {{\sigma _c} + 5} \right)}^2} - 0.16\left( {{{\left( {{\sigma _c} + 5} \right)}^2} + {{\left( {1.3333K} \right)}^2}} \right){{\left( {{\sigma _1} - {\sigma _3}} \right)}^2}/{K^2}\} } $$
Let us choose σ c = 500 MPa, and K = 250 MPa then
 \begin{align}b &= K\sqrt {{{{{\left( {{\sigma _c} + 5} \right)}^2}} \over {{{\left( {{\sigma _c} + 5} \right)}^2} - {{(1.3333K)}^2}}}}\\
&\quad = 250\sqrt {{{{{\left( {505} \right)}^2}} \over {{{\left( {505} \right)}^2} - {{(1.3333 \times 250)}^2}}}}\end{align}
\begin{align}b &= K\sqrt {{{{{\left( {{\sigma _c} + 5} \right)}^2}} \over {{{\left( {{\sigma _c} + 5} \right)}^2} - {{(1.3333K)}^2}}}}\\
&\quad = 250\sqrt {{{{{\left( {505} \right)}^2}} \over {{{\left( {505} \right)}^2} - {{(1.3333 \times 250)}^2}}}}\end{align}
or, b = 332.8 MPa
The Mohr–Coulomb failure envelope plus cap is shown in Figure A1. The initial stress state shown by the full blue circle can lead to failure by increasing the fluid pressure by 210 MPa to fail by dilatant shear at P or by decreasing the fluid pressure by 45 MPa to fail by compactional failure normal to σ 1 at Q.
If we take the above expression for Λ, namely,
 $$\Lambda = 0.0038\left\{ {\left[ {0.8({\sigma _1} - {\sigma _3}) + 270} \right]} \right.$$
 $$ - \sqrt {{{\left( {{\sigma _c} + 5} \right)}^2} - 0.16\left( {{{\left( {{\sigma _c} + 5} \right)}^2} + {{\left( {1.3333K} \right)}^2}} \right){{\left( {{\sigma _1} - {\sigma _3}} \right)}^2}/{K^2}\} } $$
Failure by increasing and decreasing fluid pressure for a yield surface with a cap using parameters proposed by Cox.

and take σ c = 100 MPa and K = 50 MPa, then
 $$\Lambda = 0.0038\left\{ {\left[ {0.8\left( {{\sigma _1} - {\sigma _3}) + 270} \right)} \right]} \right.$$
 $$ - \sqrt {\left( {255025 - 111105.56} \right){{\left( {{\sigma _1} - {\sigma _3}} \right)}^2}/{{250}^2}\} } $$
Other combinations of σ c and K are plotted in Figure 7a.


 Open access

