


Introduction
Clostridioides difficile infection (CDI) is a leading cause of healthcare-associated diarrhea, with approximately 500,000 infections each year in the United States alone.Reference Feuerstadt, Theriault and Tillotson1,Reference Kelly, Fischer and Allegretti2 The spread of C. difficile is influenced by factors at both the individual and facility levels. Individual risk factors include antibiotic exposure, advanced age, immunocompromised status, and length of stay in healthcare settings.Reference Kelly, Fischer and Allegretti2,Reference McDonald, Gerding and Johnson3 Facility risk factors include antibiotic use and rate of C. difficile in the community (ie, importation rate).Reference Brown, Valenta, Fisman, Simor and Daneman4,Reference Kociolek, Gerding and Carrico5 However, further understanding of facility-level predictors of C. difficile is essential for programmatic efforts to reduce CDI rates, which invariably must be deployed at the facility level.
At the facility level, environmental contamination and inadequate hand hygiene have been suggested as contributors to outbreaks of CDI,Reference Kociolek, Gerding and Carrico5–Reference Wang, Garrod, Duncombe, Lee, Ng and Short7 yet there is uncertainty regarding how to best operationalize factors such as these which are related to environment. The Centers for Medicare & Medicaid Services (CMS) monitors CDI rates in Medicare-certified hospitals, providing publicly accessible standardized infection ratios (SIRs) via their Hospital Compare website. CMS also collects patient experience data through the Hospital Consumer Assessment of Healthcare Providers and Systems (HCAHPS) survey, including patient perceptions of room cleanliness, summarized as star ratings. This patient-centered data related to hygiene therefore provides a potentially novel way of operationalizing environmental cleanliness which can be linked to standardized CDI rates across the nation. One prior study using the data from acute-care facilities in New York State found that higher patient-rated cleanliness was associated with lower rates of CDI,Reference Durant8 but there has been no national-level research exploring this relationship.
By analyzing a large national data set, this research aims to determine whether patient perceptions of cleanliness are associated with objective measures of CDI performance. Patient-rated cleanliness could inform understanding of C. difficile environmental transmission and potentially be used as a surrogate goal for interventions seeking to reduce CDI. We hypothesized that better patient-rated cleanliness would be associated with lower rates of CDI.
Methods
Data sources
The data utilized in this analysis were: (1) the Healthcare Associated Infections – Hospital and HCAHPS survey datasets from the 2023 CMS Hospital Compare Data; (2) the 2020 Decennial Census from the U.S. Census Bureau; and (3) the 2023 American Community Survey from the U.S. Census Bureau. All data are public and freely available. The Institutional Review Board of Columbia University Irving Medical Center waived approval of the study.
Study population
The population studied was Medicare-certified hospitals across the U.S., from January 1 to December 31, 2023. The majority of hospitals in the United States are Medicare-certified, meaning they meet the minimum health and safety standards set by the federal government, evaluated by the State Survey Agency or a CMS-approved accreditation program. The facilities included were all contained within the HCAHPS survey dataset. From this data set, hospitals with missing values for C. difficile predicted cases or for patient-rated cleanliness were dropped.
Outcomes
To enhance robustness, we examined three operationalizations of the CDI rate as binary variables. First, C. difficile standardized infection ratio (SIR) was compared to the 2023 national average SIR of 0.42,9 operationalized as less than or equal to, or greater than the national average C. difficile SIR. The model that predicts cases per facility, creating an SIR of 1 if predicted cases equal observed, was last updated in 201510; our operationalization allows comparison of facilities and findings to be more relevant to current infection control practices. Second, we evaluated whether observed C. difficile cases were less than or equal to predicted cases. Third, C. difficile standardized infection ratio (SIR) was compared to the national benchmark as a binary variable, operationalized as meets or better than national benchmark performance. The outcome provides insight on facilities that exceeded infection control standards, based on the categorical variable provided by CMS Hospital Compare.
C. diff SIR compared to national average
The primary outcome assessed was the NHSN 2023 C. difficile SIR compared to the 2023 national average score of 0.42 as a binary variable. This was operationalized as “less than or equal to national average” versus “greater than national average.” SIR was calculated based on the observed and predicted C. difficile events at a given hospital from January 1, 2023 to December 31, 2023 Predicted C. difficile cases were calculated by the NHSN per facility based on national aggregate data. This was adjusted for each facility based off known risk factors for C. difficile that are out of a facilities’ control, including inpatient community-onset admission prevalence rate, CDI test type, number of ICU beds, facility type, total facility bed size, and other factors.10 SIRs are not available for facilities with fewer than1 predicted case of C. difficile for the year.
C. difficile observed cases compared to expected cases
A second measure of C. difficile infection rate was classified as the difference between expected and observed C. difficile cases. Facilities with a negative difference were classified as “observed C. difficile cases >predicted” and facilities with a positive difference or no difference were classified as “observed C. difficile cases ≤predicted.” This operationalization quantifies success based on the 2015 NHSN model and includes facilities without an SIR due to no expected cases.
C. diff SIR compared to national benchmark
The third outcome assessed was the NHSN 2023 C. difficile SIR compared to national benchmark as a binary variable. This was operationalized as “meets national benchmark” versus “better than national benchmark” designations per facility as provided in HCAHPS survey dataset.
Exposures
The exposure of interest was patient-rated hospital room and bathroom cleanliness. This was captured through two operationalizations of the HCAHPS survey data. Cleanliness was analyzed (1) using a patient star rating and (2) as a continuous variable, based on the percent of patients that reported their room and bathroom as always clean.
Patient-rated cleanliness star rating
The primary exposure was patient-rated cleanliness star ratings collected via the HCAHPS survey. It was operationalized as a categorical ordinal variable, with values ranging from one to five with one being the least clean and five being the most clean. Star ratings were calculated using HCAHPS standardized methodology.11 Facilities were clustered into five groups based on the 5 possible star ratings.
Room and bathroom reported always clean, percentage
The percent of patients who reported their room and bathroom as always clean was analyzed as a continuous variable theoretically ranging from 0 to 100%. This value was provided for all facilities with submitted HCAHPS surveys and captures facilities excluded from receiving a star rating due to too few survey responses.
Covariates
Covariates considered were the facility’s geographic region and demographic information for the patient population served, approximated through facility zip-code. The four standard CDC geographic regions included were the Northeast, Midwest, South, and West.12 Demographic covariates include race and ethnicity,13 median income,Reference Guzman and Kollar14 and population aged 65+.15 These were all categorized as binary variables with value per zipcode compared to the national average.
Statistical analysis
Multivariate logistic regression models were used to analyze all C. difficile performance operationalizations. A multivariate logistic regression model was created for SIR compared to national average SIR of 0.42 as the outcome of interest with patient-rated cleanliness stars as the exposure of interest. A second multivariate logistic regression model was observed cases of C. difficile compared to expected with the primary exposure as the percent of patients who rated room as always clean. A third multivariate logistic regression model was created for SIR compared to national benchmark as the outcome of interest with patient-rated cleanliness stars as the exposure of interest. For all models, all covariates were included. All analysis was performed in StataNow/BE 18.5 for Mac (Intel 64-bit).
Results
Descriptive results
C. difficile standardized infection ratio
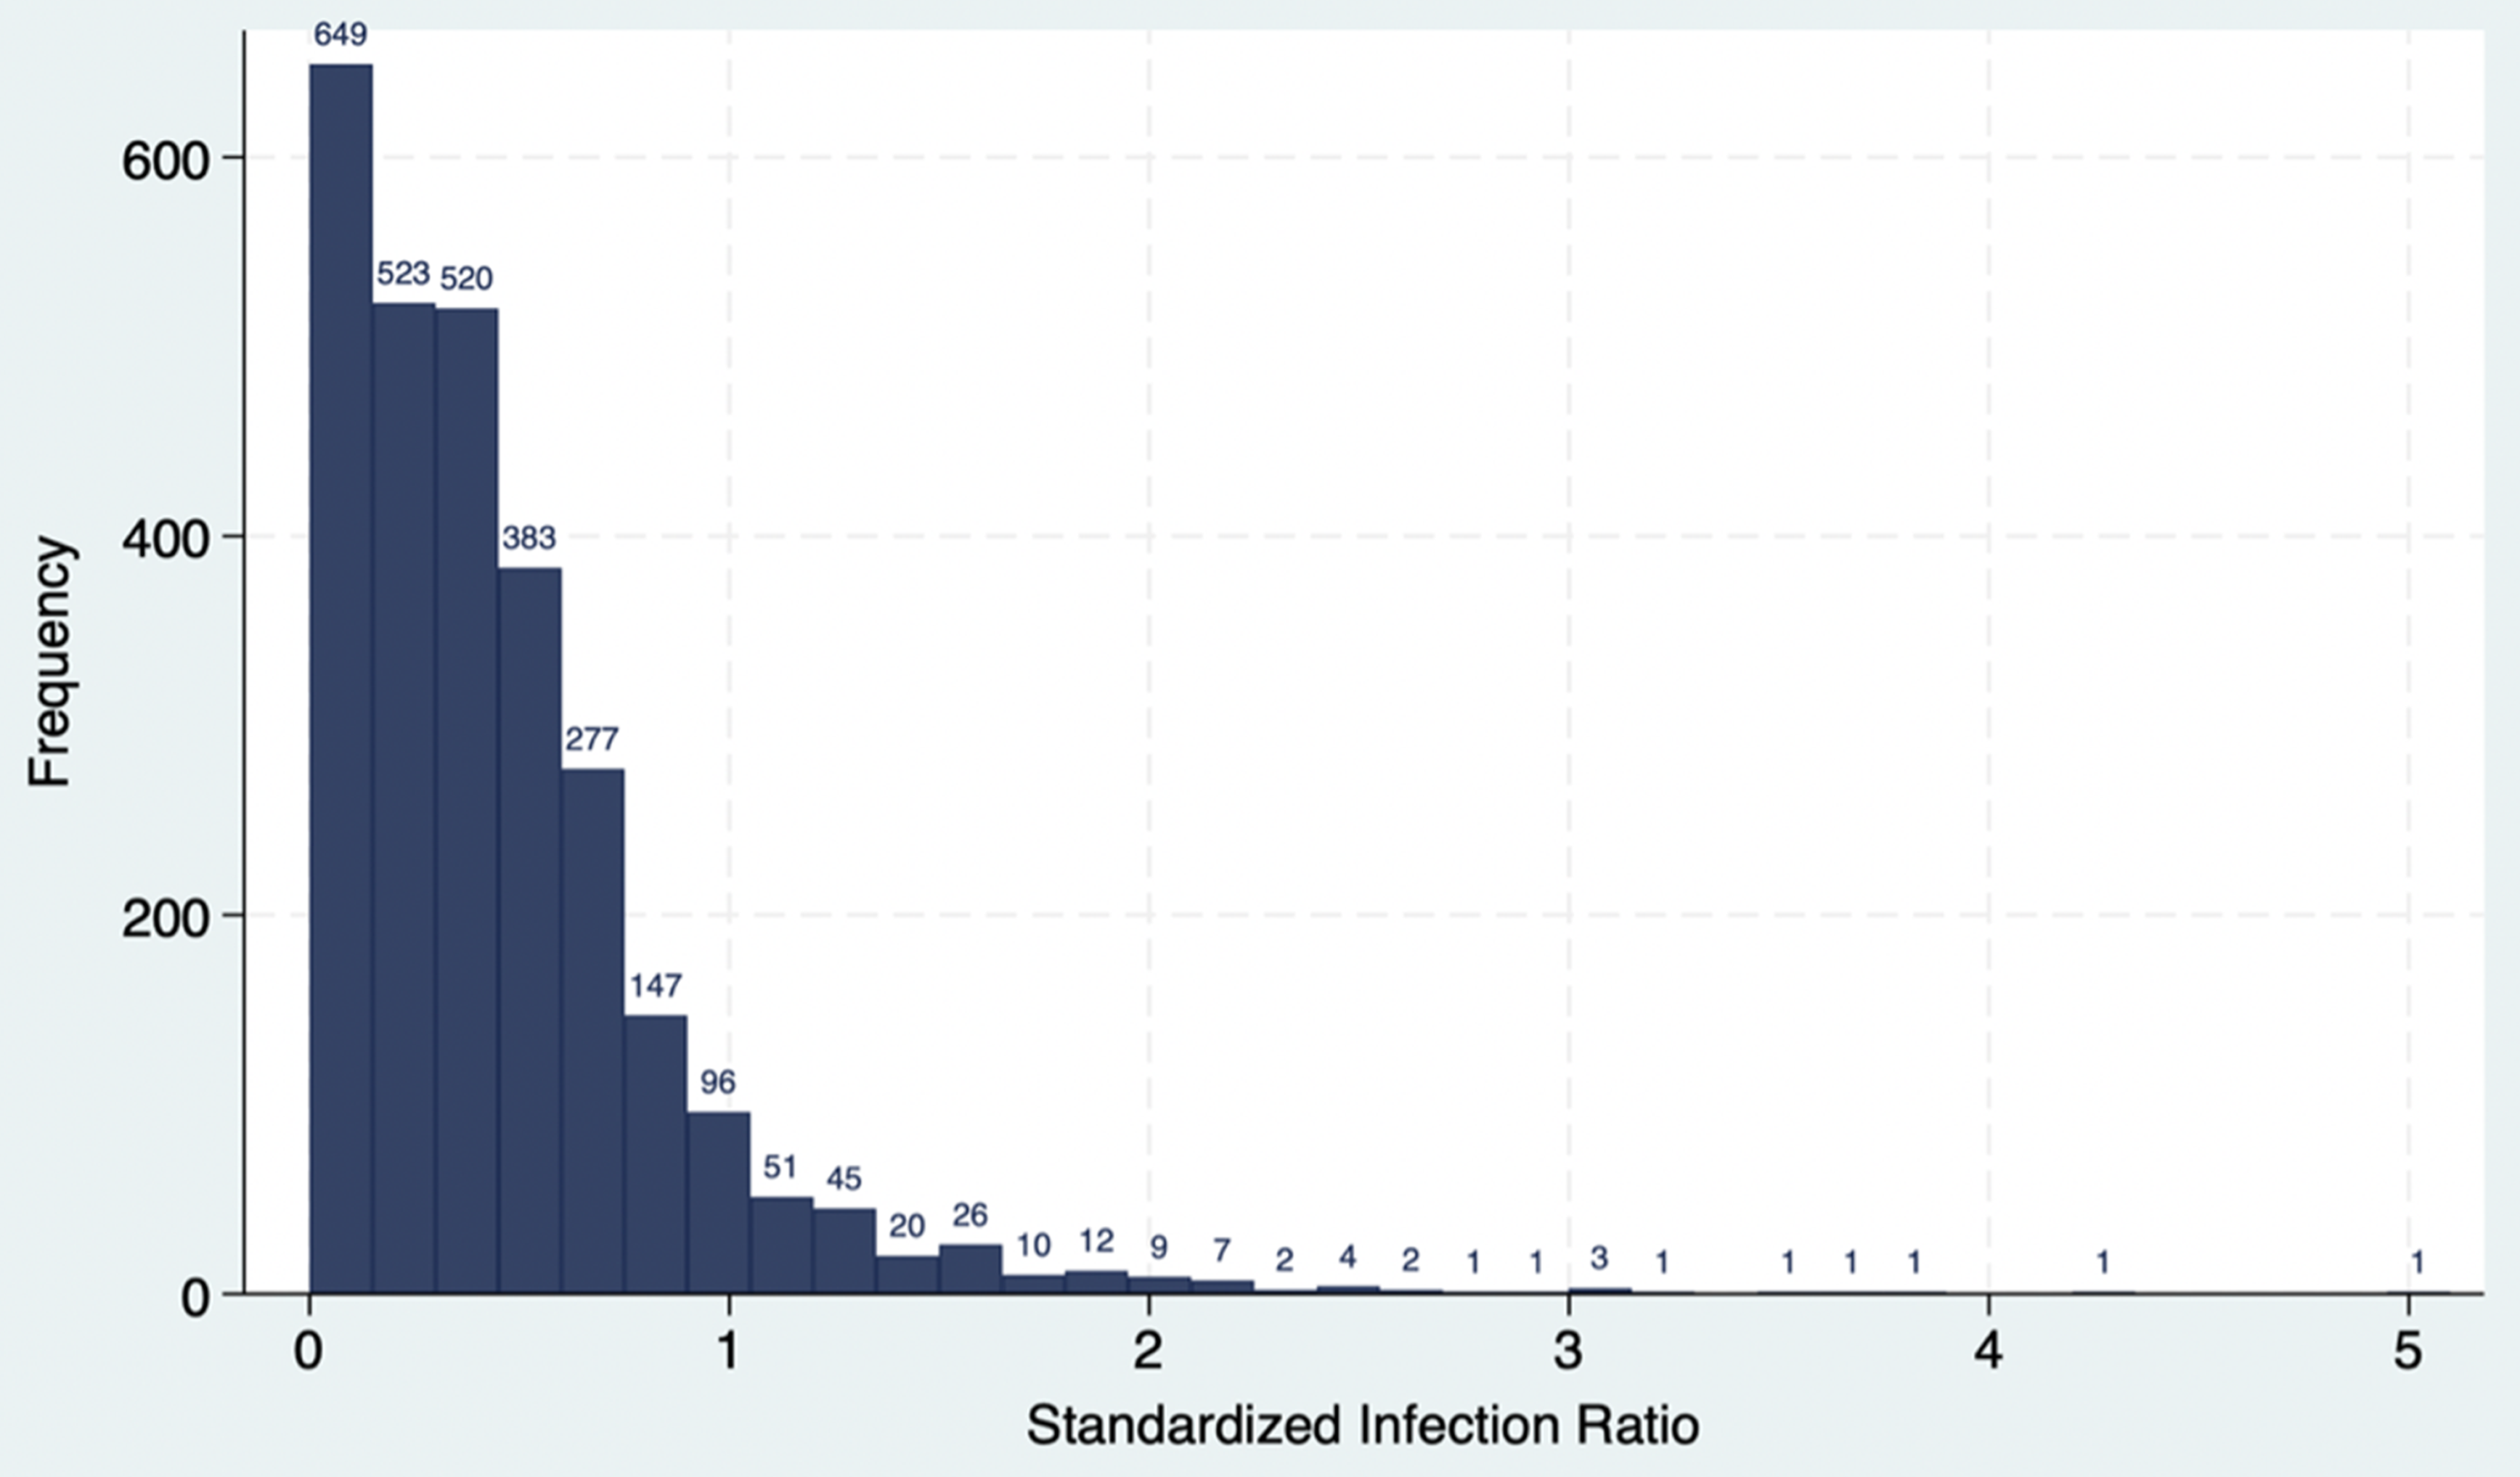
The total analyzed study population was 3,616 Medicare hospitals in the U.S. in 2023 who had an estimated, 17,994,034 unique patient admissions. We dropped 1,163 facilities from the full CMS Hospital Compare data set of 4,779 due to missing predicted cases or missing HCAHPS survey responses data. An additional 952 facilities were dropped due to missing SIR, missing cleanliness star rating, or insufficient number of HCAHPS survey responses to leave 2,664 facilities which were included in analysis of C. difficile SIR and cleanliness star rating. The C. difficile SIRs were right skewed with 58% of SIRs falling under the national average of 0.42 (Figure 1).
C. difficile standardized infection ratio histogram.

C. difficile standardized infection ratio and cleanliness star rating
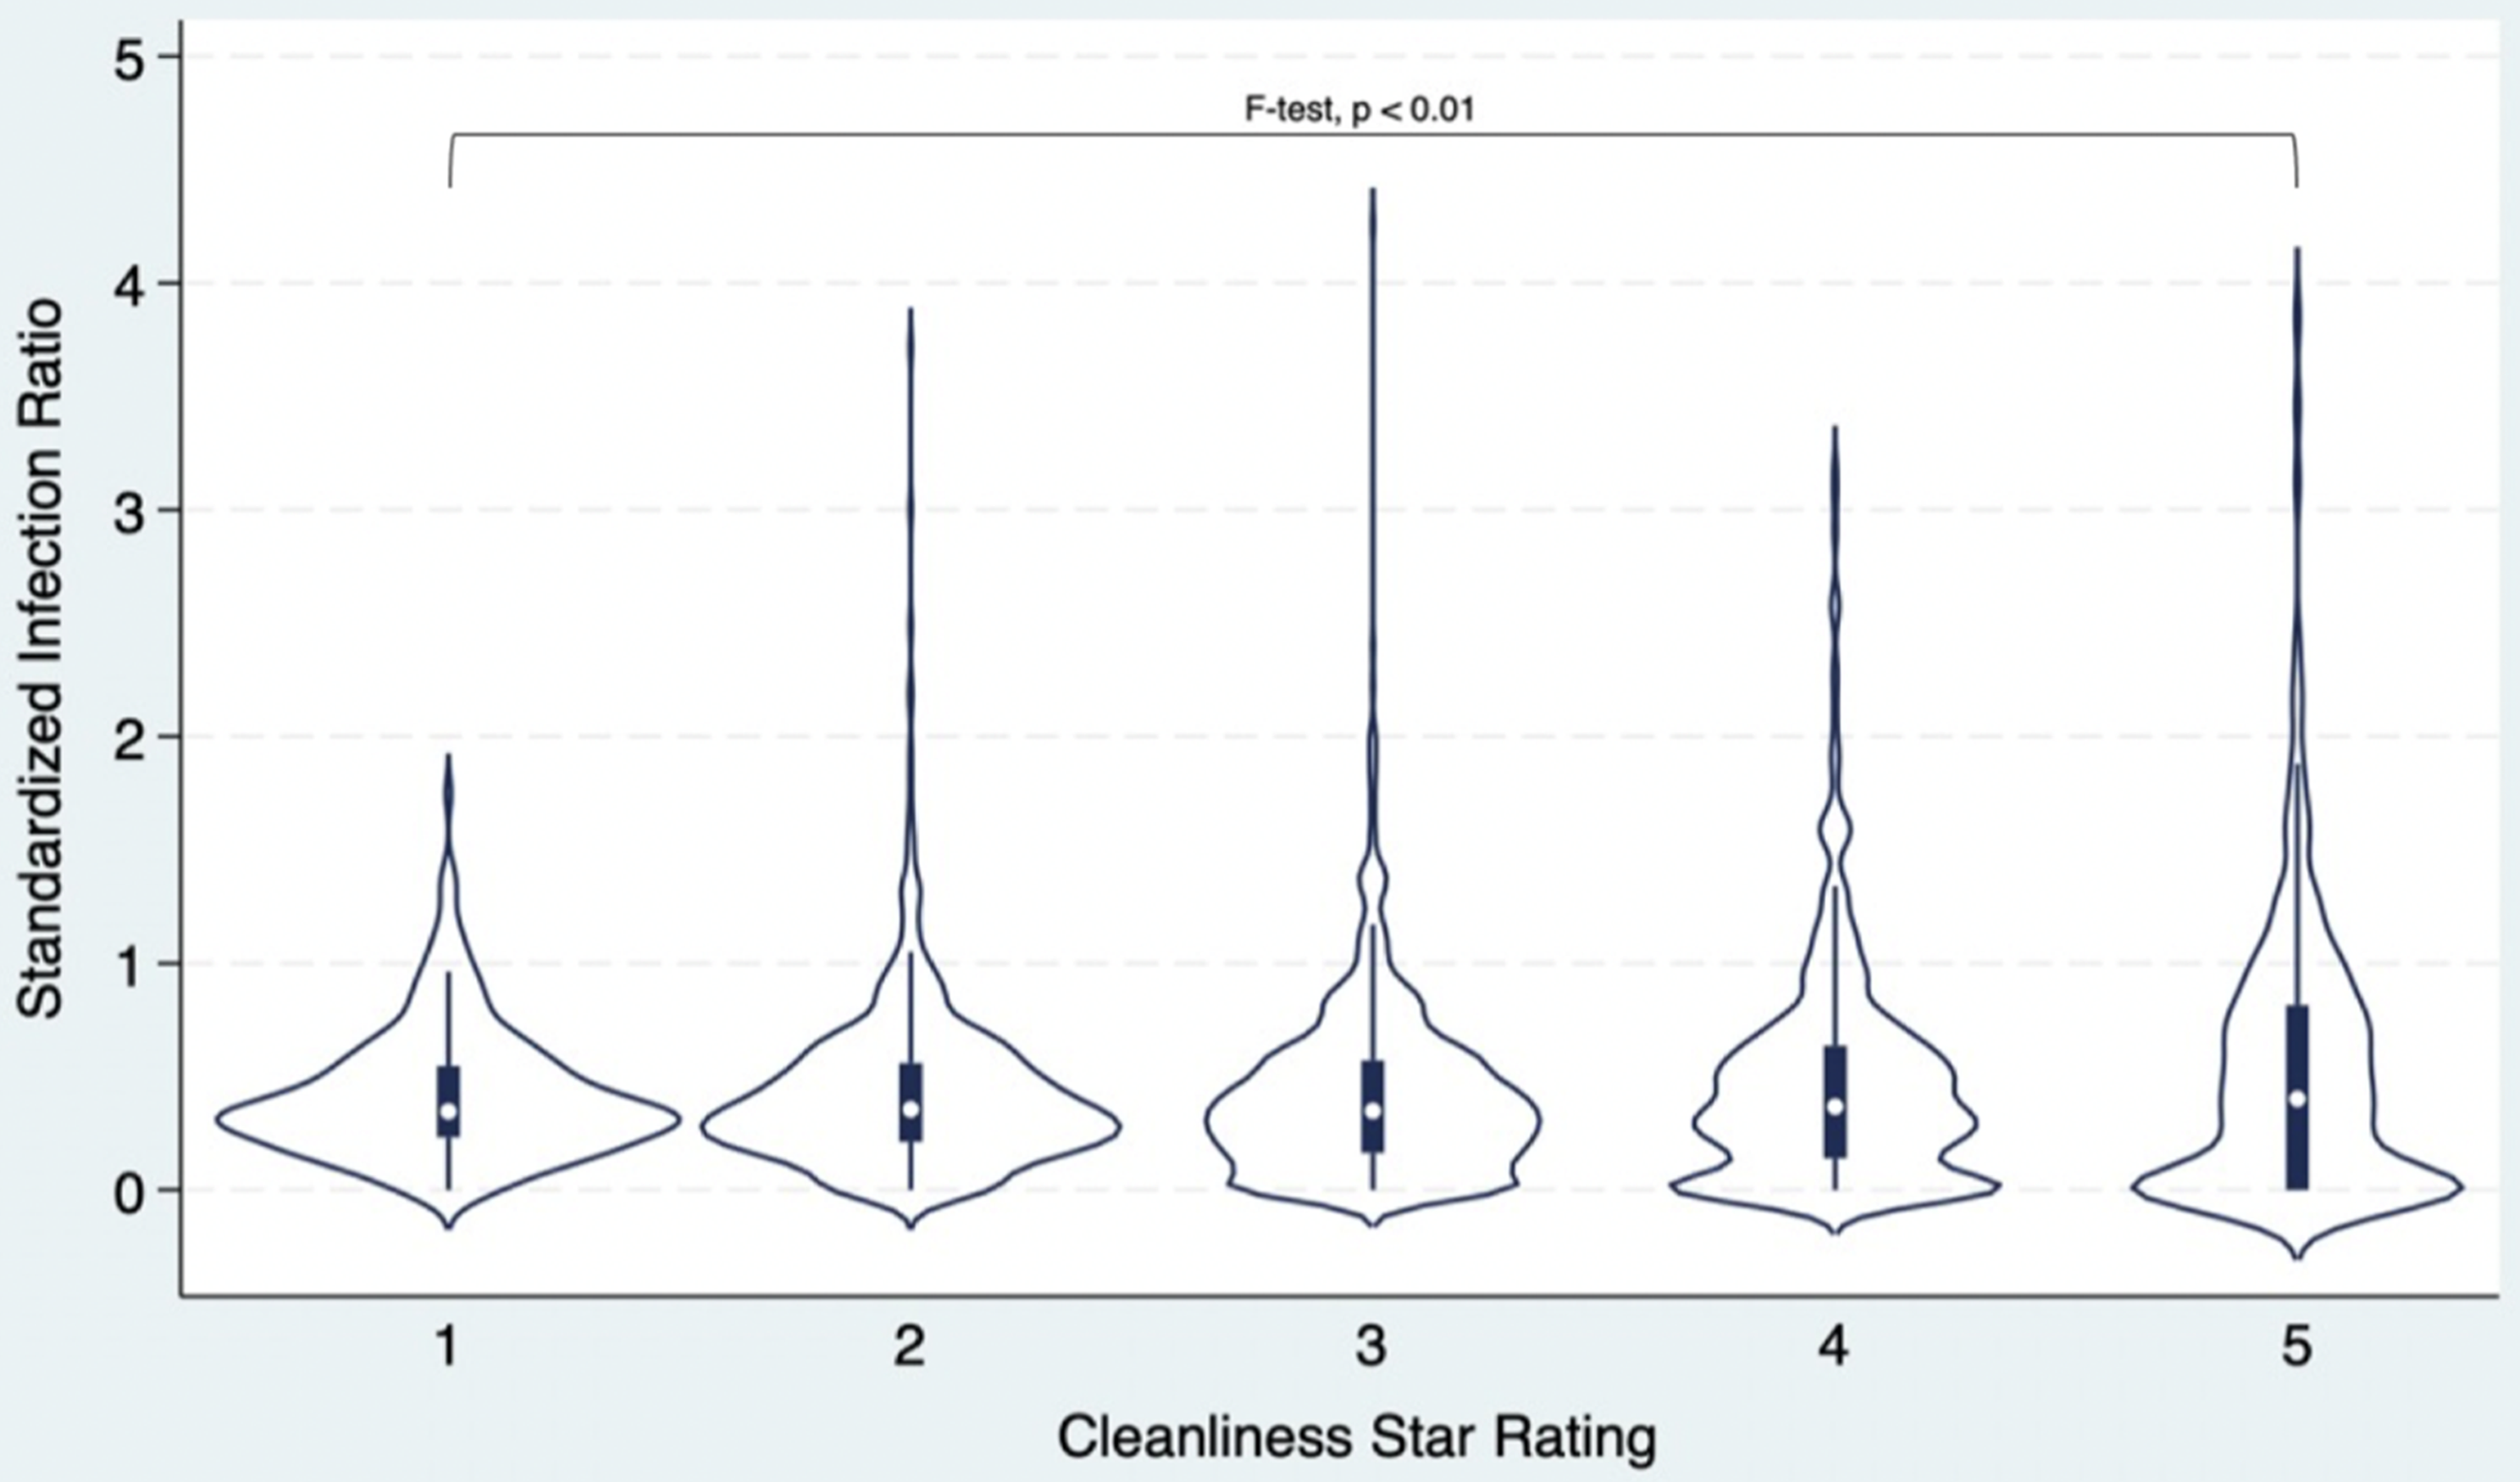
A violin plot was generated among the 2,664 facilities to illustrate the distribution of C. difficile SIRs across groups by cleanliness star ratings (Figure 2). The observed C. difficile SIRs were widely overlapping across these groups. Overall, 74% of facilities with a C. difficile SIR less than or equal to the national average of 0.42 received a 5-star cleanliness rating compared to 9.5% of facilities that had SIRs greater than the national average (P = .07, Table 1). In other words, the facilities that were performing better than the national average with respect to C. difficile rates were no different with respect to cleanliness ratings. However, only 24% of facilities with a C. difficile SIR better than the National Benchmark received a 5-star cleanliness rating compared to 17% of facilities that met (but did not exceed) the national benchmark (P < .01, Table 5, appendix). In other words, the facilities that were performing better with respect to C. difficile rates were slightly worse with respect to cleanliness ratings. Those with an SIR lower than the national average and better than the national benchmark were less likely to be in a zip-code containing older individuals and more likely to be in zip codes with high median income.
SIR by cleanliness star rating violin plot.

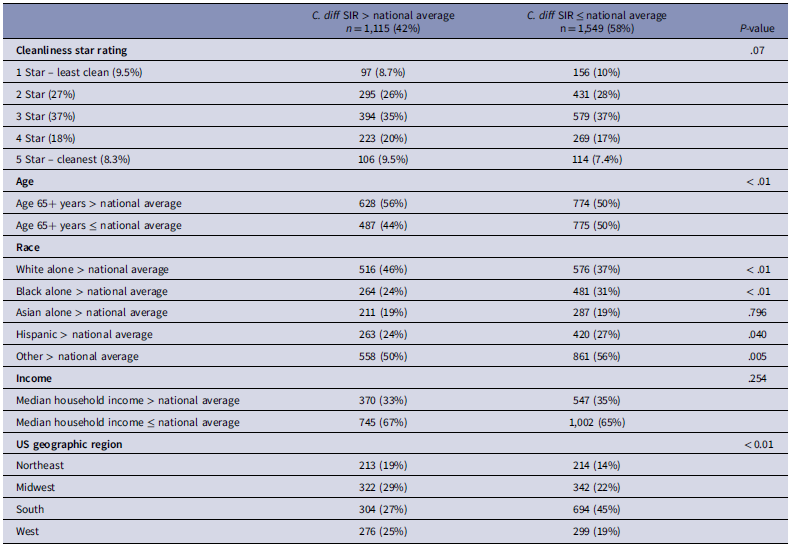
Cleanliness star ratings and population characteristics by C. difficile SIR to national average

Note. Covariates were operationalized as binary variables by comparing the percentage of the population within facilities’ ZIP codes to national average values: Age 65+ (17.3%),15 White (75.3%),13 Black (13.6%),13 Asian (6.4%),13 Other (4.7%),13 Hispanic (19.5%),13 and Median Household Income ($80,610).Reference Guzman and Kollar14 P-values were calculated using chi-square tests.
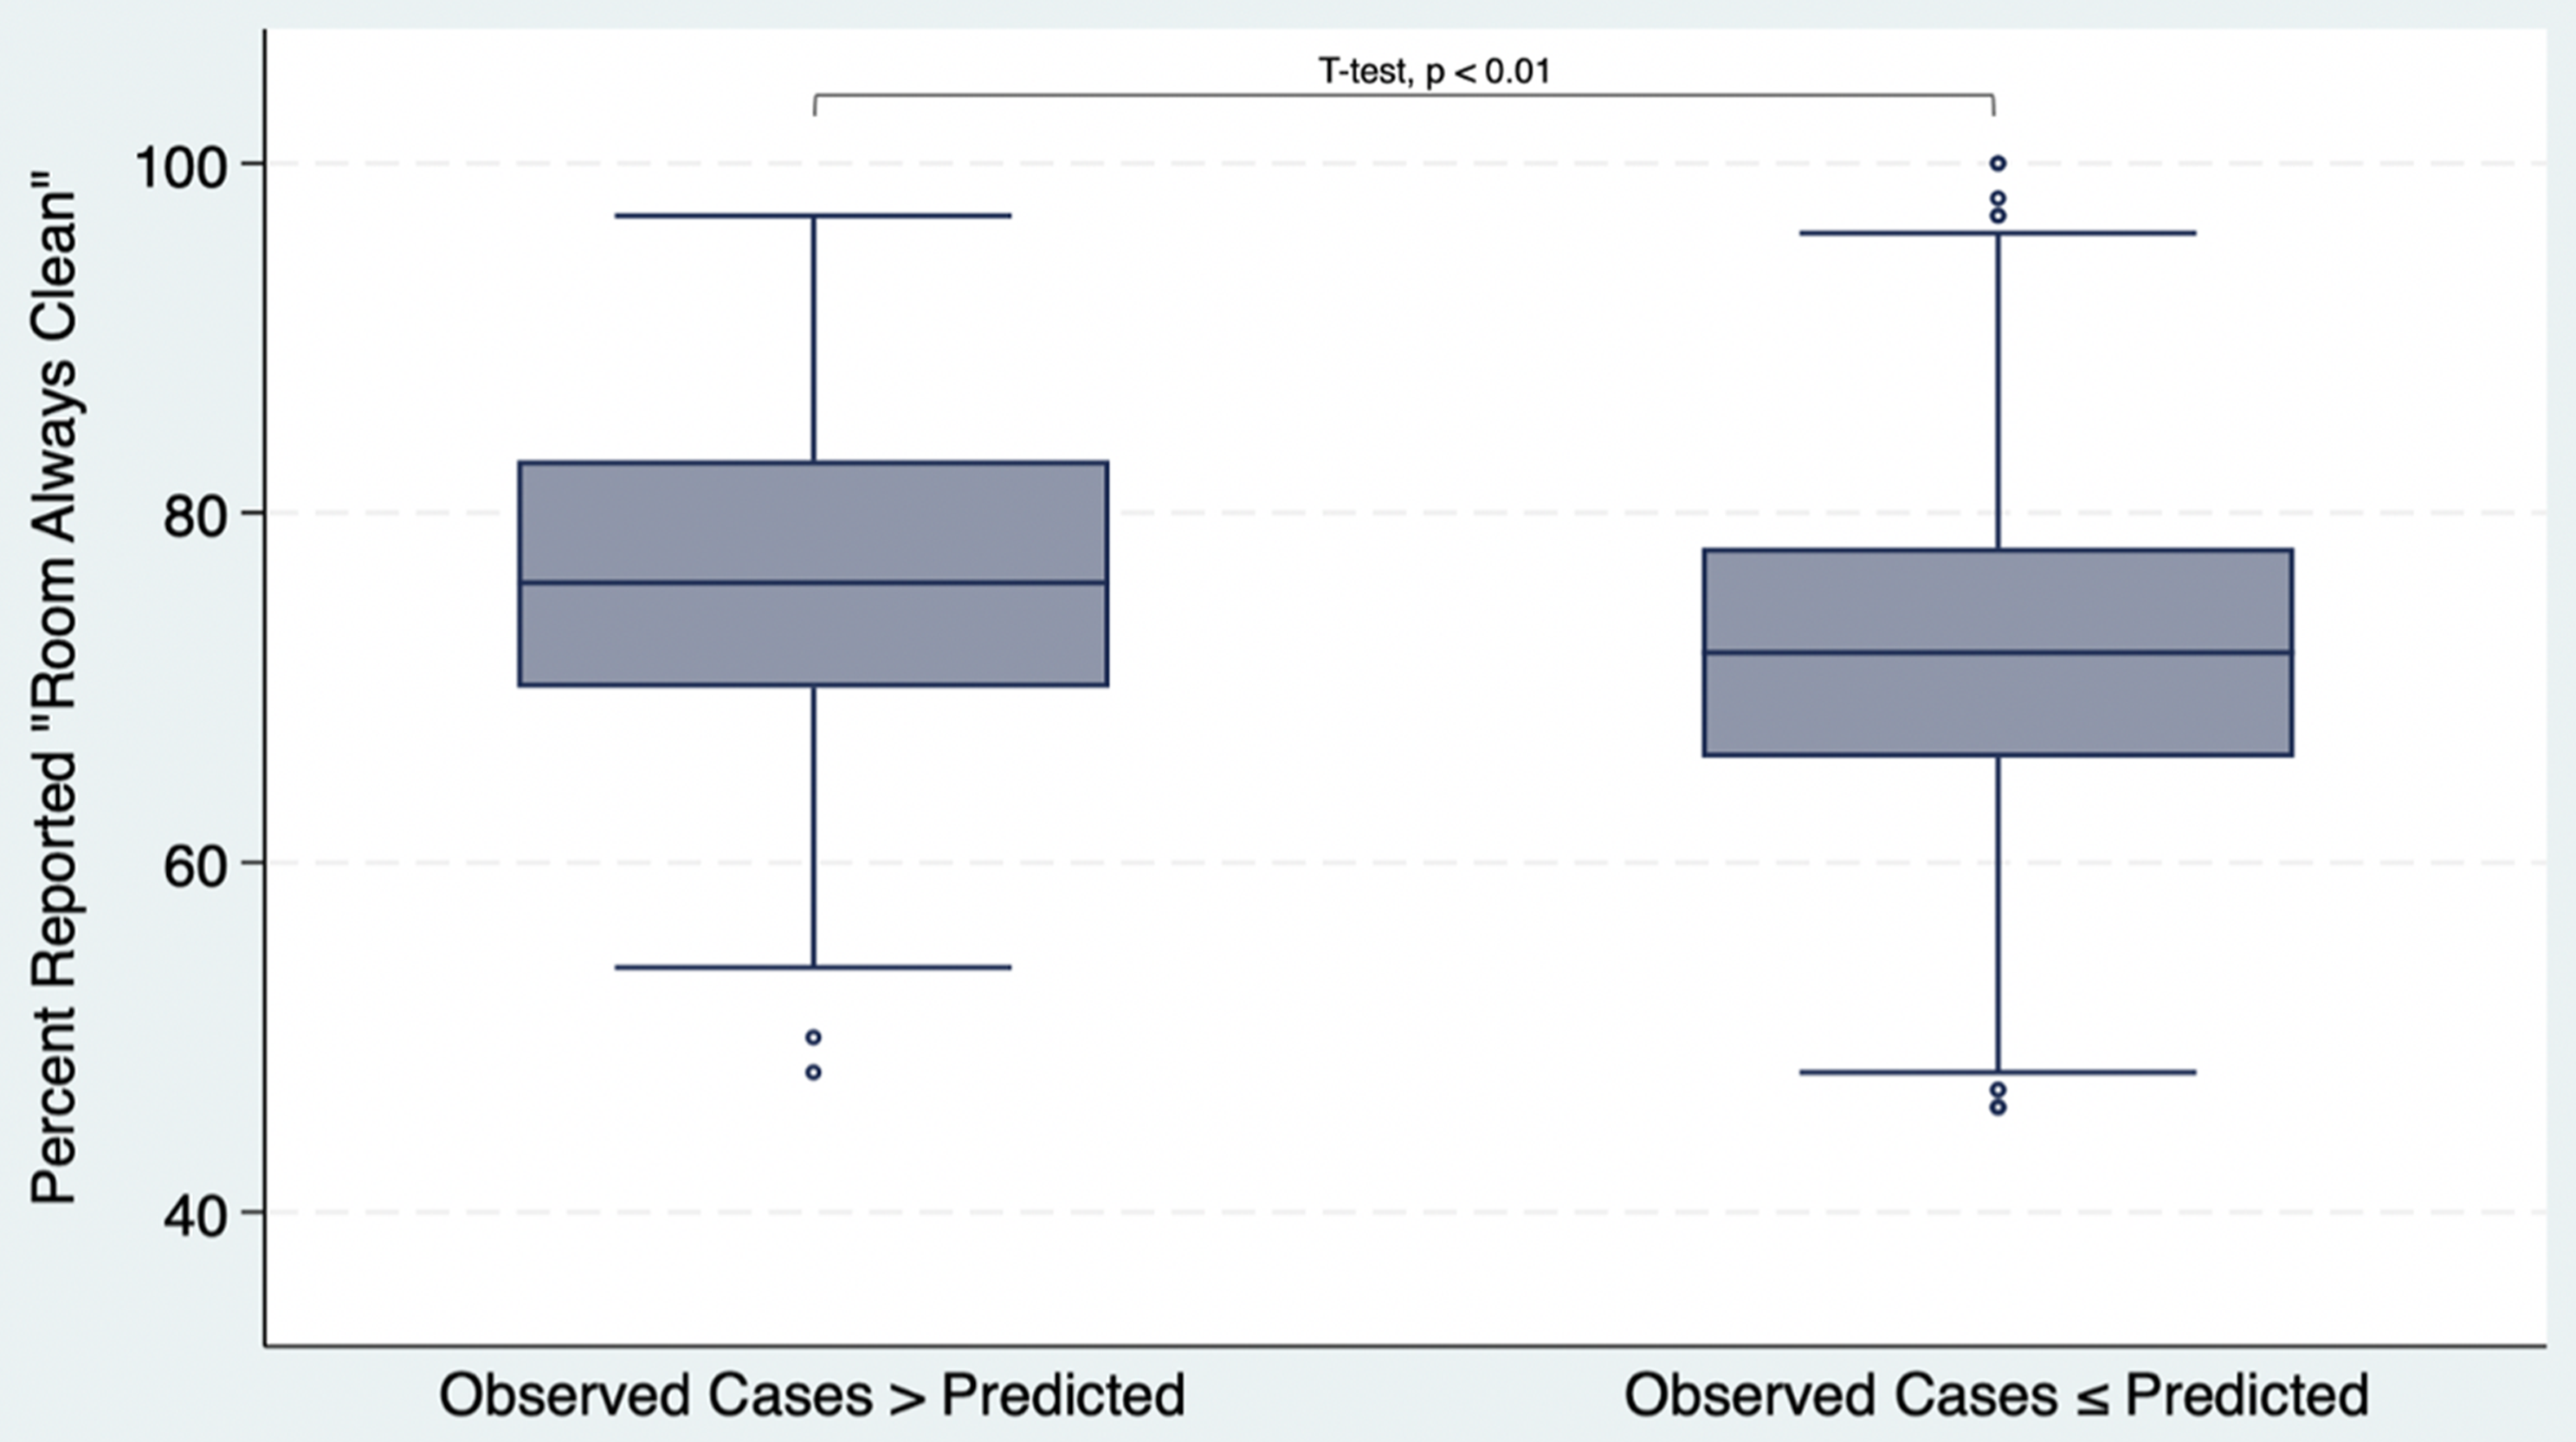
Observed cases and “Room Always Clean” sample
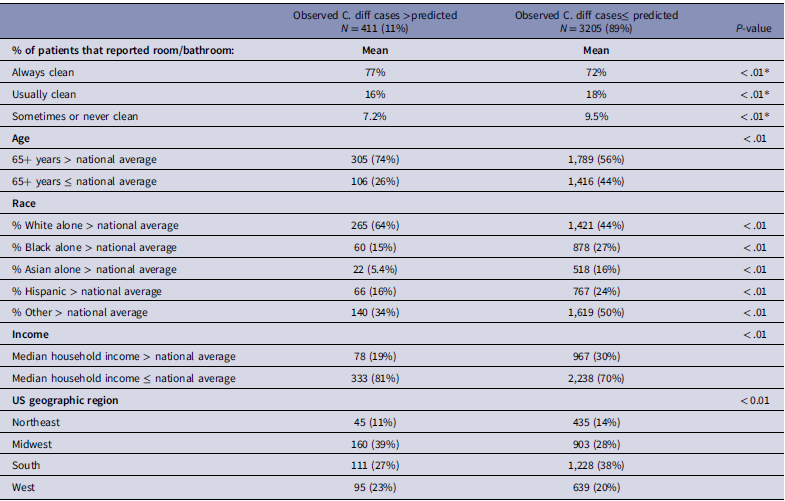
3,616 facilities were included in an analysis of observed cases compared to predicted cases and percent of patients who reported “room always clean.” This sample re-captured facilities that were excluded from the initial analysis due to having 0 predicted C. difficile cases (822 facilities), or too few HCAHPS survey responses (130 facilities). Facilities with more observed C. difficile than expected had a higher mean percentage of patients that reported their room and bathroom as always clean compared to facilities with observed cases that were less than or equal to the predicted amount (77% vs 72%, respectively, P < .01; Table 2 and Figure 3). Again, the directionality of this relationship was the reverse of what we had hypothesized. Facilities with greater than expected cases were more likely to be in a zip-code containing older individuals and less likely to be in zip codes with high median income.
Patient reported cleanliness and population characteristics by observed C. difficile cases

Note. Covariates were operationalized as binary variables by comparing the percentage of the population within facilities’ ZIP codes to national average values: Age 65+ (17.3%),15 White (75.3%),13 Black (13.6%),13 Asian (6.4%),13 Other (4.7%),13 Hispanic (19.5%),13 and Median Household Income ($80,610).Reference Guzman and Kollar14 P-values were primarily calculated using chi-square tests;
*P-values calculated from t-tests.
“Room Always Clean” and Observed vs Predicted cases box-and-whisker plot.

Logistic regression analysis
C. difficile SIR and cleanliness star rating
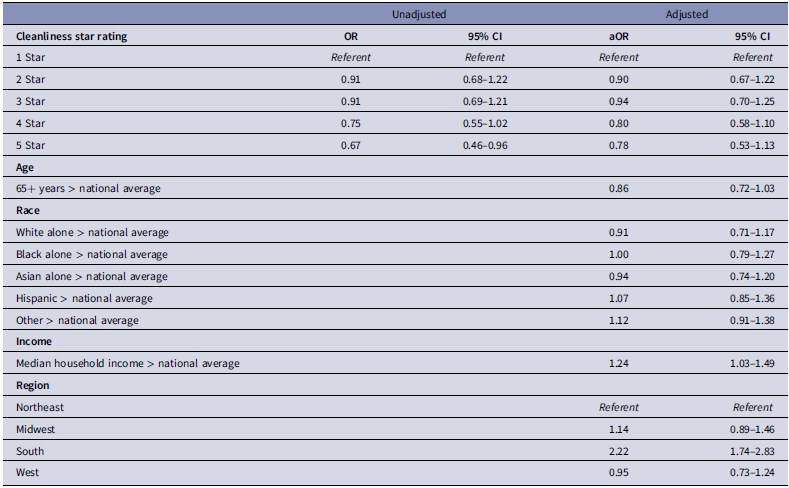
To examine the independent relationship between C. difficile SIR and cleanliness star rating, we built a logistic regression model. In the unadjusted model, there was a modest association between a rating of 5 stars (cleaner) and C. difficile SIR less than or equal to the national average (OR: 0.67, 95% CI: 0.46, 0.96; Table 3). Following the adjustment for all covariates, there was no association between cleanliness star rating and C. difficile SIR compared to the national average.
Logistic regression model for risk factors to predict SIR ≤ national average

Note. Facilities with 1-star rating acting as referent. Adjusted models includes all listed covariates, operationalized as binary variables by comparing the percentage of the population within facilities’ ZIP codes to national average values: Age 65+ (17.3%),15 White (75.3%),13 Black (13.7%),13 Asian (6.4%),13 Other (4.7%),13 Hispanic (19.5%),13 and Median Household Income ($80,610).Reference Guzman and Kollar14
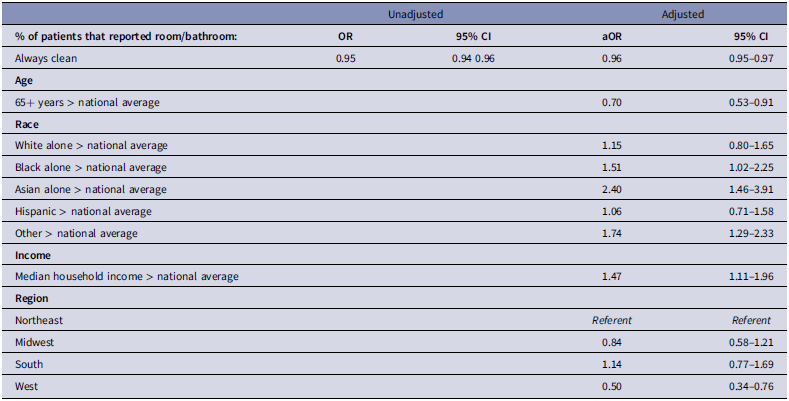
Logistic regression model for risk factors to predict observed cases ≤ predicted

Note. Percent of patients reporting room always clean is operationalized as a continuous variable, with odds ratios reflecting the change per 1% increase in reporting always clean. Adjusted models includes all listed covariates, operationalized as binary variables by comparing the percentage of the population within facilities’ ZIP codes to national average values: Age 65+ (17.3%),15 White (75.3%),13 Black (13.7%),13 Asian (6.4%),13 Other (4.7%),13 Hispanic (19.5%),13 and Median Household Income ($80,610).Reference Guzman and Kollar14
An additional logistic regression model was built to examine the relationship between C. difficile SIR by national benchmark category and cleanliness star rating. In this model, there was an association between ratings of 3–5 stars (cleaner) and worse C. difficile SIR (Table 6, appendix). As the patient-rated cleanliness star rating increased, the odds that a facility’s SIR was better than the national benchmark showed a stepwise decrease. Adjustment for age, race, income, and region had little impact on the odds ratio.
Room cleanliness and observed C. difficile cases
Similarly, a logistic regression model was built for patient-rated room cleanliness and observed C. difficile cases. In this model, room cleanliness was a continuous measure. For everyone 1% increase in patients who reported their room and bathroom as always clean, the odds of C. difficile observed cases being less than or equal to the facility’s predicted value decreased by 4% (aOR: 0.96, 95% CI: 0.95, 0.97). Adjusting for age, race, income, and region again had little impact on the odds ratio (crude OR: 0.95, aOR: 0.96).
Discussion
We investigated the relationship between patient-rated cleanliness and C. difficile SIRs in Medicare-certified hospitals. We had hypothesized that better patient-rated cleanliness would be associated with lower rates of CDI. Contrary to this hypothesis, there was no association between better patient-rated cleanliness and improved C. difficile performance. Facilities with a 5-star cleanliness rating were not more likely to have a C. difficile SIR below (better than) the national average of 0.42 compared to those with lower ratings. Similarly, hospitals with higher percentages of patients reporting their room as always clean did not have increased odds of an observed C. difficile performance better than predicted. On the contrary, better patient-rated cleanliness was associated with marginally worse C. difficile performance when using national benchmark comparisons. These findings indicate that patient perceptions of cleanliness may not be a good surrogate for infection control measures targeting C. difficile.
Our results differ from Durant et al. (2021), which identified the expected inverse association between patient-perceived cleanliness and CDI rates within hospitals in New York State (ie, better patient-rated cleanliness was associated with better CDI rates). The difference in studies may be attributable to the broader national scope of our analysis and the different data used to quantify C. difficile infection control performance. Durant used the New York state Statewide Planning and Research Cooperative System (SPARCS) to calculate facility C. difficile infection rate. This data source had more detailed information about facilities compared to the Hospital Compare data set utilized in our analysis, which is pre-adjusted for facility-specific risk factors that are not publicly available. The associations seen in Durant were modest in strength and they may not generalize to the nation as a whole.
There are several potential explanations for why high patient-rated cleanliness scores did not predict better C. difficile performance in our analysis. First, patient-reported cleanliness ratings may not accurately reflect true cleanliness levels with respect to transmission of C. difficile spores. Patient-reported cleanliness is, by nature, subjective and may say more about a patient’s perception of room organization or overall appearance rather than true environmental cleanliness. For example, a recently renovated room might appear to be clean yet have a high burden of C. difficile spores. Second, patient surveys have a low completion rate, only 19.5% in our study population, and there may be respondent bias based on who chooses to complete the surveyReference Godden, Paseka, Gnida and Inguanzo16; in other words, the completed surveys may not reflect the true patient perception of cleanliness within the population. Third, environmental burden of C. difficile spores may not be closely related to absence of dirt or staining. Spores are extremely hardy, and require substantial bleach exposure to kill. Rooms may be visually clean yet not have received sufficient bleach dwell time to effectively kill spores.Reference Ng Wong, Alhmidi, Mana, Cadnum, Jencson and Donskey17,Reference Schoyer and Hall18 Fourth, facilities with worse patient-reported cleanliness may have other facility-specific factors that serve as residual confounders and bias towards higher rates of CDI. For example, academic teaching institutions may be less focused on the patient experience and therefore perform worse on surveys, and also accept patients that are more medically complex and have a higher baseline risk for CDI.Reference Lagasse19 The national SIR for CDI, although standardized for patient factors such as age,10 may be unable to fully account for the patient-level differences between institutions. Last, C. difficile infection control measures go beyond solely maintaining effective environmental cleanliness protocols.Reference Kelly, Fischer and Allegretti2,Reference Poylin, Hawkins and Bhama20 Even if patient-rated cleanliness ratings are a reliable measure of true room cleanliness and sterilization, other factors in C. difficile infection control, such as antimicrobial stewardship practices, are not considered in this analysis and may be more important drivers of facilities’ C. difficile SIRs.
This study used secondary analyses conducted with different data operationalizations to increase the robustness of results. Utilizing the raw number values for observed cases, predicted cases, and percent of patients who reported room always clean, rather than the calculated SIR and star ratings from CMS hospital compare allowed for a larger sample size and let us interrogate the data in many ways. Throughout operationalizations, facilities that performed better than expected in terms of CDI rates had a lower mean percent of patients who reported their room as always clean compared to facilities that performed worse than expected in terms of CDI rates (ie, the opposite of our initial hypothesis). Multiple analyses reinforced the primary finding that facilities with higher cleanliness ratings do not necessarily have better C. difficile infection control performance.
This study has several strengths and also limitations. The analysis was conducted on a large national sample of medicare-certified hospitals and used multiple operationalizations of data to enhance robustness of findings. However, the data did not capture hospital-specific infection control measures, had already been previously adjusted by NHSN, and was grouped by hospital systems. Response bias in the HCAHPS survey and potential unmeasured confounders, such as differences in facility antimicrobial stewardship practices or in patient factors, may also influence results.
In sum, this study using national U.S. data from 2023 found no association between higher patient-rated cleanliness and better C. difficile performance, contradicting the one prior study to examine this novel measure for hospital hygiene. These results emphasize the difficulty in accurately measuring hygiene with respect to transmission of C. difficile and underscore the complexity of healthcare-associated CDI, an important problem which cannot be simplified as solely due to “dirty rooms.”
Supplementary material
The supplementary material for this article can be found at https://doi.org/10.1017/ice.2025.10336.
Acknowledgements
None.
Financial support
This work was funded in part by the Clinical Biospecimen and Research Core of the Columbia University Digestive and Liver Disease Research Center (P30 DK132710).
Competing interests
We have no relevant conflicts to report.
Disclosures
DEF is funded by R01 AI132403, R21 AI183029, and by grants from Otsuka and Kyowa Kirin Pharmaceutical; he has done consulting for Ferring Pharmaceutical and KeepBio.


 Open access