





1. Introduction
Fast radio bursts (FRBs), mysterious high energy radio transients that last for less than a few milliseconds, have been an ongoing enigma since their discovery in 2007 (Lorimer et al. Reference Lorimer, Bailes, McLaughlin, Narkevic and Crawford2007). FRBs trace the cosmological distribution of ionised gas through their dispersion measure (DM; Macquart et al. Reference Macquart2020). This has enabled FRBs to be used to constrain (for instance) the Hubble constant (Wu et al. Reference Wu, Zhang and Wang2022; Hagstotz et al. Reference Hagstotz, Reischke and Lilow2022; James et al. Reference James2022), fluctuations in the cosmological matter density (Baptista et al. Reference Baptista2024), the fraction of ionised gas residing in the circumgalactic and intergalactic media (Khrykin et al. Reference Khrykin2024; Connor et al. Reference Connor2025), and the gas in the Milky Way’s halo (Cook et al. Reference Cook2023; Ravi et al. Reference Ravi2025; Hoffmann et al. Reference Hoffmann, James, Glowacki, Prochaska, Gordon, Deller, Shannon and Ryder2025).
Studies of FRB host galaxies can also be used to shed light on their progenitors. The hosts of apparently non-repeating FRBs tend to follow the star-forming main sequence (Gordon et al. Reference Gordon2023; Loudas et al. Reference Loudas, Li, Strauss and Leja2025), while the small fraction of repeating FRBs ( $\lesssim3$
% Chime/FRB Collaboration et al. 2026) prefer star-forming environments such as dwarf galaxies and outer spiral arms (e.g. Chatterjee et al. Reference Chatterjee2017; Marcote et al. Reference Marcote2020; Niu et al. Reference Niu2022; Moroianu et al. Reference Moroianu2026). The role of metallicity in determining FRB host galaxies is currently debated (Sharma et al. Reference Sharma2024; Yamasaki et al. Reference Yamasaki, Hashimoto, Kusakabe and Goto2026), although typically low-metallicity environments, such as the hosts of superluminous supernova (SLSNe) and long-duration gamma-ray bursts (LGRBs), seem to be disfavoured (Bhandari et al. Reference Bhandari2022). It has also been argued that the main inconsistency with a star-forming origin is an excess of low-magnitude hosts with little star-formation (Safarzadeh et al. Reference Safarzadeh, Xavier Prochaska, Heintz and Fong2020). Spurred by the localisation of FRB 20200120E to a globular cluster (GC) in M81 (Kirsten et al. Reference Kirsten2022), GCs have also been suggested as a tracer of FRB hosts (Horowicz & Margalit Reference Horowicz and Margalit2026).
$\lesssim3$
% Chime/FRB Collaboration et al. 2026) prefer star-forming environments such as dwarf galaxies and outer spiral arms (e.g. Chatterjee et al. Reference Chatterjee2017; Marcote et al. Reference Marcote2020; Niu et al. Reference Niu2022; Moroianu et al. Reference Moroianu2026). The role of metallicity in determining FRB host galaxies is currently debated (Sharma et al. Reference Sharma2024; Yamasaki et al. Reference Yamasaki, Hashimoto, Kusakabe and Goto2026), although typically low-metallicity environments, such as the hosts of superluminous supernova (SLSNe) and long-duration gamma-ray bursts (LGRBs), seem to be disfavoured (Bhandari et al. Reference Bhandari2022). It has also been argued that the main inconsistency with a star-forming origin is an excess of low-magnitude hosts with little star-formation (Safarzadeh et al. Reference Safarzadeh, Xavier Prochaska, Heintz and Fong2020). Spurred by the localisation of FRB 20200120E to a globular cluster (GC) in M81 (Kirsten et al. Reference Kirsten2022), GCs have also been suggested as a tracer of FRB hosts (Horowicz & Margalit Reference Horowicz and Margalit2026).
Key to these discoveries is the radio localisation of FRBs to (sub-)arcsecond precision, the subsequent identification of their host galaxies by optical observations, and measurement of their redshifts (Chatterjee et al. Reference Chatterjee2017; Tendulkar et al. Reference Tendulkar2017; Bannister et al. Reference Bannister2019). While a large number of unlocalised FRBs absolutely can be used for cosmological inference (e.g. Wang et al. Reference Wang2025), the utility of a FRB with known redshift is far greater than that of one with DM information only, due to intrinsic fluctuations in the DM budget (James et al. Reference James2022). This has resulted in a huge global effort to increase the number of FRBs with arcsecond-scale radio localisations, in particular the more TRANsients and Pulsars (MeerTRAP) survey on MeerKAT (Pastor-Marazuela et al. Reference Pastor-Marazuela2025); the Commensal Real-time ASKAP Fast Transients (CRAFT) survey on the Australian Square Kilometre Array Pathfinder (Shannon et al. Reference Shannon2025); the Deep Synoptic Array (DSA-110; Sharma et al. Reference Sharma2024), and the Canadian Hydrogen Intensity Mapping Experiment’s Fast Radio Burst group and associated outriggers (CHIME/FRB; Chime/FRB Collaboration et al. 2025).
Most FRB observations are either commensal, or performed by transit telescopes, meaning that FRB discoveries are spread over a large area of the sky. Identification of FRB host galaxies therefore require wide-field optical surveys, such as SDSS (Abdurro’uf et al. Reference Abdurro’uf2022), PanSTARRS (Kaiser et al. Reference Kaiser, Stepp, Gilmozzi and Hall2010; Chambers et al. Reference Chambers2016), and DECam (Flaugher et al. Reference Flaugher2015). However, the relatively shallow depths of these surveys (magnitude limits of approximately $m_r=22.7$
,
$m_r=22.7$
, $m_r=23.3$
, and
$m_r=23.3$
, and $m_r=23.27$
respectively) leads to incompleteness in the resulting FRB host catalogues, affecting their use for cosmological parameter estimation (Hoffmann et al. Reference Hoffmann, James, Glowacki, Prochaska, Gordon, Deller, Shannon and Ryder2025). This incompleteness has been partially addressed with dedicated 8-m class observations, e.g. the sample presented by Shannon et al. (Reference Shannon2025). However, the increasing number of precisely localised FRBs has put severe constraints on the time required to identify FRB hosts that are too faint to be found in existing catalogues, and perform the spectroscopy to identify their redshifts. Furthermore, as FRB-hunting radio telescopes become more sensitive, they are finding ever-more-distant FRBs, often requiring space-based observations to find a host (Marnoch et al. Reference Marnoch2023; Caleb et al. Reference Caleb2025). The next generation of telescopes, such as CHORD (Vanderlinde et al. Reference Vanderlinde2019) and DSA-2000 (Hallinan et al. Reference Hallinan2019), are expected to find
$m_r=23.27$
respectively) leads to incompleteness in the resulting FRB host catalogues, affecting their use for cosmological parameter estimation (Hoffmann et al. Reference Hoffmann, James, Glowacki, Prochaska, Gordon, Deller, Shannon and Ryder2025). This incompleteness has been partially addressed with dedicated 8-m class observations, e.g. the sample presented by Shannon et al. (Reference Shannon2025). However, the increasing number of precisely localised FRBs has put severe constraints on the time required to identify FRB hosts that are too faint to be found in existing catalogues, and perform the spectroscopy to identify their redshifts. Furthermore, as FRB-hunting radio telescopes become more sensitive, they are finding ever-more-distant FRBs, often requiring space-based observations to find a host (Marnoch et al. Reference Marnoch2023; Caleb et al. Reference Caleb2025). The next generation of telescopes, such as CHORD (Vanderlinde et al. Reference Vanderlinde2019) and DSA-2000 (Hallinan et al. Reference Hallinan2019), are expected to find $\mathcal{O}\sim 10\,000$
FRBs/year, making dedicated spectroscopic follow-up of their hosts completely infeasible.
$\mathcal{O}\sim 10\,000$
FRBs/year, making dedicated spectroscopic follow-up of their hosts completely infeasible.
This situation is expected to change with the advent of the Vera C. Rubin Observatory’s Legacy Survey of Space and Time (LSST; Bianco et al. Reference Bianco2022). Its 3 billion-pixel digital camera will survey the entire Southern Hemisphere – the same sky scanned in radio by leading FRB detection telescopes MeerKAT, ASKAP, and, eventually, SKA-Mid and SKA-Low. In this paper, we first discuss the prospects for identifying the host galaxies of FRBs detected by ASKAP and MeerTRAP with the Rubin Observatory, and then explore the impact that uncertainties in current photometric redshift techniques may have on FRB cosmological parameter estimation.
2. How many host galaxies?
In this Section, we determine the fraction of FRB host galaxies that the Rubin Observatory is expected to be able to observe. We first determine appropriate optical magnitude limits for the Rubin Observatory, and then build a simple model of the intrinsic FRB host galaxy magnitude distribution. Finally, we use a model of FRB observations with ASKAP and MeerTRAP to determine redshift, and, hence, magnitude distributions for FRB hosts from these surveys, and determine the fraction visible to the Rubin Observatory. Throughout, we characterise the detectability of FRB hosts via their r-band magnitudes $m_r$
, which have commonly been used for host identification in follow-up observations (e.g. Shannon et al. Reference Shannon2025), and to assess the statistical probability of host association (Aggarwal et al. Reference Aggarwal, Budavári, Deller, Eftekhari, James, Xavier Prochaska and Tendulkar2021).
$m_r$
, which have commonly been used for host identification in follow-up observations (e.g. Shannon et al. Reference Shannon2025), and to assess the statistical probability of host association (Aggarwal et al. Reference Aggarwal, Budavári, Deller, Eftekhari, James, Xavier Prochaska and Tendulkar2021).
2.1. What’s visible to Rubin?
The Rubin Observatory achieved First Look in mid-2025, and the LSST has now begun in 2026. Data Preview 1 (DP1), based on commissioning camera data, has already been released, with Data Release 1 planned for 2028.Footnote a In addition to the full survey of the Southern Sky, as well as the North Ecliptic Spur and part of Virgo, Rubin will also target specific ‘deep-drilling’ fields which will be observed at a higher cadence.Footnote b
Rubin observes with six filters, ugrizy, which will be individually co-added over the full 10 year survey. The 5 $\sigma$
limiting magnitudes for both single visits and 10 year co-adds can be found in Bianco et al. (Reference Bianco2022), but we specifically highlight that the r-band single filter limiting magnitude (5
$\sigma$
limiting magnitudes for both single visits and 10 year co-adds can be found in Bianco et al. (Reference Bianco2022), but we specifically highlight that the r-band single filter limiting magnitude (5 $\sigma$
) for a single visit is
$\sigma$
) for a single visit is $m_r^\mathrm{lim}=24.7$
, and
$m_r^\mathrm{lim}=24.7$
, and $m_r^\mathrm{lim}=27.5$
in the 10 year co-adds. We therefore use these two magnitude limits going forward as characteristic minimal and maximal sensitivities of the Rubin Observatory.
$m_r^\mathrm{lim}=27.5$
in the 10 year co-adds. We therefore use these two magnitude limits going forward as characteristic minimal and maximal sensitivities of the Rubin Observatory.
2.2. Host galaxy magnitudes
Numerous studies have analysed FRB host galaxies, focusing on star-formation rate, total stellar mass, and various other properties (e.g. Heintz et al. Reference Heintz2020; Bhandari et al. Reference Bhandari2022; Gordon et al. Reference Gordon2023; Sharma et al. Reference Sharma2024). However, the only study we are aware of that models an intrinsic distribution of FRB host galaxy magnitudes, and their redshift dependence, is Marnoch et al. (Reference Marnoch2023). In this work, the authors use 23 FRB host galaxies with optical spectra, and model the expected r-band and $K_s$
-band magnitudes were those galaxies to have been located at redshifts in the range 0–2. This study however does not account for galaxy evolution (the sample is based on hosts detected with
$K_s$
-band magnitudes were those galaxies to have been located at redshifts in the range 0–2. This study however does not account for galaxy evolution (the sample is based on hosts detected with $z \lesssim 0.5$
), nor the bias due to FRBs originating in hosts too faint to be detected, and thus the results we derive here will also be subject to these deficiencies. However, it is a plausible first approximation given the level of understanding of the FRB host population in the current literature. It bears noting that the combination of LSST data with numerous low-redshift FRBs from (in particular) ASKAP will help address the latter of those two limitations, as discussed in Section 2.4. Extending the work of Marnoch et al. (Reference Marnoch2023) with the increasingly large sample of FRB host galaxies would also be of great benefit – however, spectroscopic data for the vast majority of surveys is either unavailable, or complete to significantly brighter magnitudes and/or lower redshifts (Sharma et al. Reference Sharma2024; Pastor-Marazuela et al. Reference Pastor-Marazuela2025). We hope to include the recent results of Muller et al. (Reference Muller2026) for 12 new FRB hosts in the future.
$z \lesssim 0.5$
), nor the bias due to FRBs originating in hosts too faint to be detected, and thus the results we derive here will also be subject to these deficiencies. However, it is a plausible first approximation given the level of understanding of the FRB host population in the current literature. It bears noting that the combination of LSST data with numerous low-redshift FRBs from (in particular) ASKAP will help address the latter of those two limitations, as discussed in Section 2.4. Extending the work of Marnoch et al. (Reference Marnoch2023) with the increasingly large sample of FRB host galaxies would also be of great benefit – however, spectroscopic data for the vast majority of surveys is either unavailable, or complete to significantly brighter magnitudes and/or lower redshifts (Sharma et al. Reference Sharma2024; Pastor-Marazuela et al. Reference Pastor-Marazuela2025). We hope to include the recent results of Muller et al. (Reference Muller2026) for 12 new FRB hosts in the future.
Both Marnoch et al. (Reference Marnoch2023) and Caleb et al. (Reference Caleb2025) have used these data by effectively treating the m(z) distribution as a series of $\delta$
-functions at the calculated values of the 23 hosts, so that the probability
$\delta$
-functions at the calculated values of the 23 hosts, so that the probability $p(m_r \lt m_r^\mathrm{lim})$
can be obtained by counting the fraction
$p(m_r \lt m_r^\mathrm{lim})$
can be obtained by counting the fraction $N(z)/N_\mathrm{tot}$
of hosts with estimated magnitudes less than
$N(z)/N_\mathrm{tot}$
of hosts with estimated magnitudes less than $m_r^\mathrm{lim}$
, i.e. it becomes a step-function in
$m_r^\mathrm{lim}$
, i.e. it becomes a step-function in $m_r$
. To avoid this step-like behaviour, we evaluate the mean
$m_r$
. To avoid this step-like behaviour, we evaluate the mean $\mu_r(z)$
and standard deviation
$\mu_r(z)$
and standard deviation $\sigma_r(z)$
of the FRB host galaxies studied by Marnoch et al. (Reference Marnoch2023), and assume an underlying normal distribution, i.e. at any z,
$\sigma_r(z)$
of the FRB host galaxies studied by Marnoch et al. (Reference Marnoch2023), and assume an underlying normal distribution, i.e. at any z, $m_r \sim N(\mu_r,\sigma_r)$
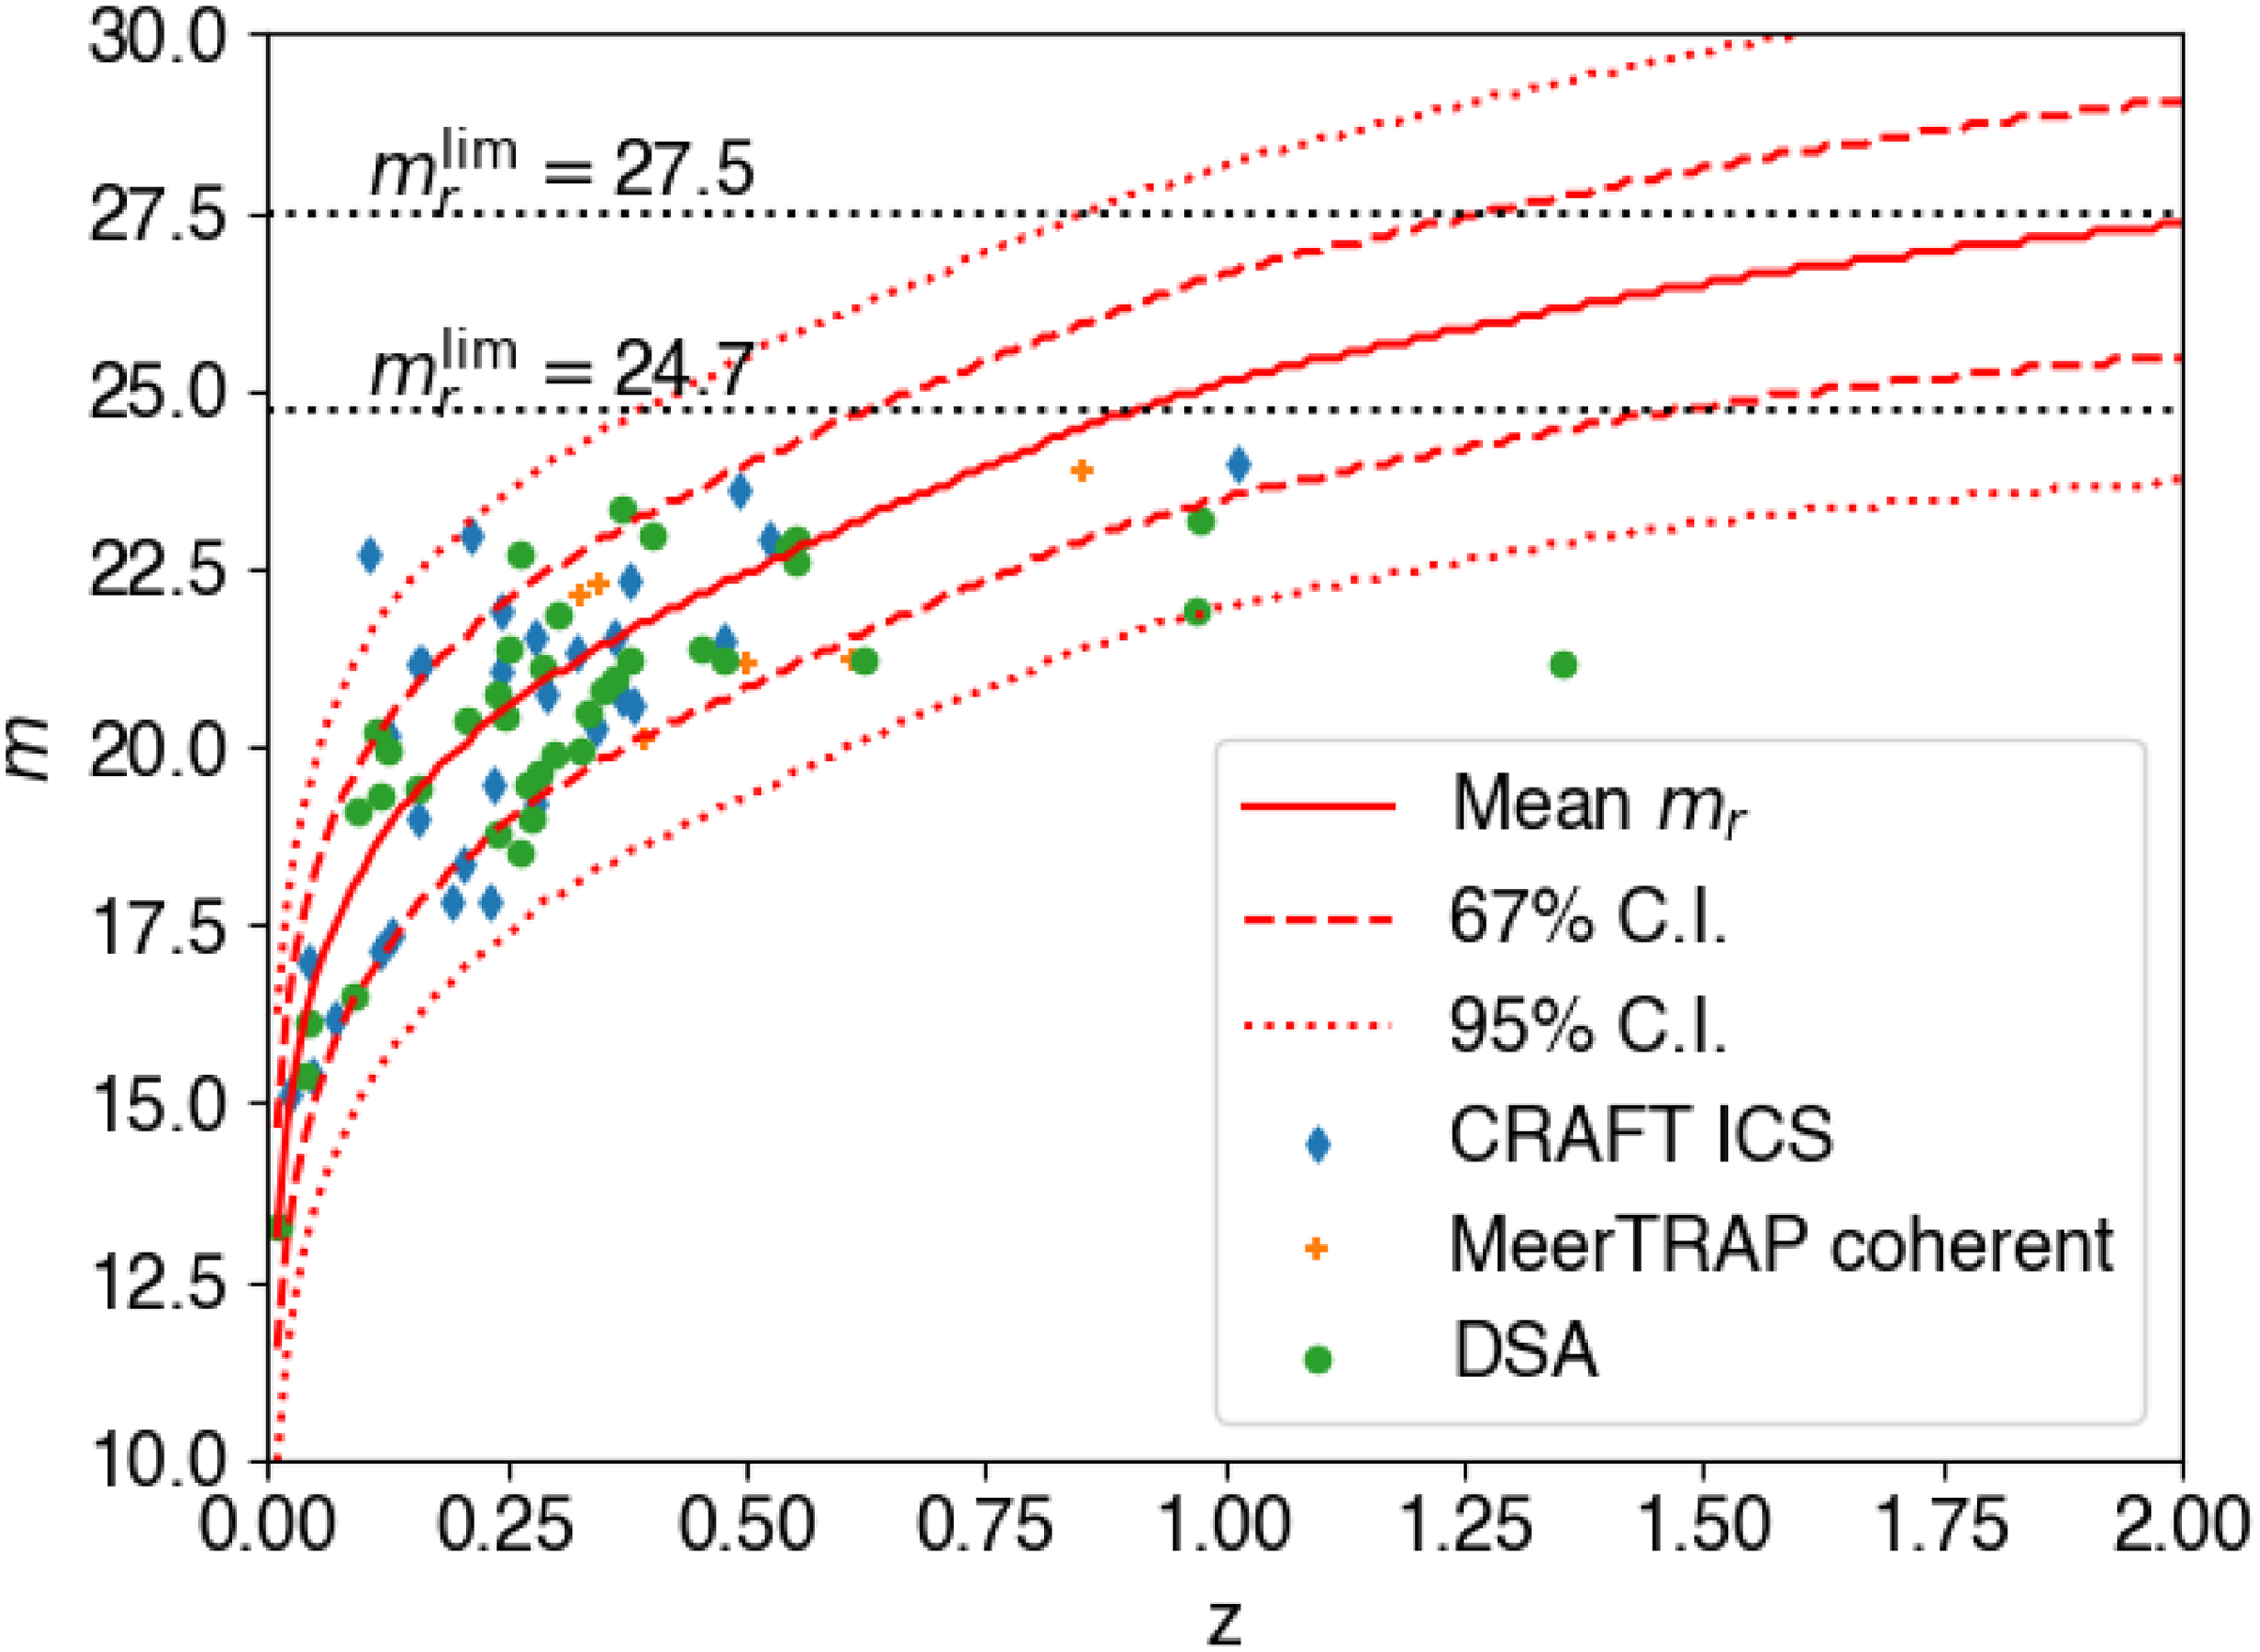
. These values are shown in Figure 1. The limit from a single visit (10 year co-adds) corresponds approximately to the mean FRB host magnitude at
$m_r \sim N(\mu_r,\sigma_r)$
. These values are shown in Figure 1. The limit from a single visit (10 year co-adds) corresponds approximately to the mean FRB host magnitude at $z \sim 1$
(
$z \sim 1$
( $z \sim 2$
). Alternatively, we can also calculate the fraction of FRB hosts visible as a function of redshift. This is given in Figure 2. Note that we will reach
$z \sim 2$
). Alternatively, we can also calculate the fraction of FRB hosts visible as a function of redshift. This is given in Figure 2. Note that we will reach $\sim$
50% completeness at cosmic noon for the 10 yr LSST co-addition.
$\sim$
50% completeness at cosmic noon for the 10 yr LSST co-addition.
Mean, and 67% ( $\pm 1 \sigma$
) and 95% confidence (
$\pm 1 \sigma$
) and 95% confidence ( $\pm 2 \sigma$
) intervals, of the FRB r-band host galaxy magnitude distribution,
$\pm 2 \sigma$
) intervals, of the FRB r-band host galaxy magnitude distribution, $m_r$
, as a function of redshift, using the FRB host galaxies analysed by Marnoch et al. (Reference Marnoch2023). Also shown for comparison are the
$m_r$
, as a function of redshift, using the FRB host galaxies analysed by Marnoch et al. (Reference Marnoch2023). Also shown for comparison are the $m_r$
magnitude limits from LSST single visit and 10 year co-adds, and FRB host galaxies (measured using a variety of filters) detected in CRAFT ICS (Shannon et al. Reference Shannon2025), MeerTRAP coherent (Pastor-Marazuela et al. Reference Pastor-Marazuela2025), and DSA (Sharma et al. Reference Sharma2024; Connor et al. Reference Connor2025) observations.
$m_r$
magnitude limits from LSST single visit and 10 year co-adds, and FRB host galaxies (measured using a variety of filters) detected in CRAFT ICS (Shannon et al. Reference Shannon2025), MeerTRAP coherent (Pastor-Marazuela et al. Reference Pastor-Marazuela2025), and DSA (Sharma et al. Reference Sharma2024; Connor et al. Reference Connor2025) observations.

Fraction of FRB hosts visible to the Rubin Observatory for optical r-band limits corresponding to single visit and 10 year co-adds observations.

Since they can be targeted with follow-up radio observations, a large fraction of repeating FRBs have been localised to their hosts (e.g. Chatterjee et al. Reference Chatterjee2017). However, these may come from a different host population (Bhandari et al. Reference Bhandari2022; Kirsten et al. Reference Kirsten2022), and likely are only observed to repeat because they are nearby (Gardenier et al. Reference Gardenier, Connor, van Leeuwen, Oostrum and Petroff2021; James Reference James2023). Furthermore, publication bias – whereby unique or unexpected results are preferentially published ahead of standard results – can lead to particularly high-redshift FRBs being published ahead of other bursts detected in the same period by the same instrument, with examples being Ryder et al. (Reference Ryder2023) and Caleb et al. (Reference Caleb2025). The most statistically complete catalogues of FRB host galaxies come from interferometers, which are able to routinely localise once-off FRBs to arcsecond precision, enabling a robust host identification (Eftekhari & Berger Reference Eftekhari and Berger2017).
The largest such catalogues are currently those from ASKAP (Shannon et al. Reference Shannon2025), MeerTRAP (Pastor-Marazuela et al. Reference Pastor-Marazuela2025), and DSA (Sharma et al. Reference Sharma2024; Connor et al. Reference Connor2025). While 17 of the 23 FRBs used by Marnoch et al. (Reference Marnoch2023) came from the ASKAP catalogue, the DSA and MeerTRAP catalogues are independent, allowing these to be used to test the reliability of our model. Comparing these host galaxies to our model of $m_r(z)$
in Figure 1, it is clear that these predictions have held for all FRB host galaxies, with the exception of FRB 20230521B at
$m_r(z)$
in Figure 1, it is clear that these predictions have held for all FRB host galaxies, with the exception of FRB 20230521B at $z\sim1.3$
, the redshift of which was identified only via a single emission line (Connor et al. Reference Connor2025). There also appears to be a magnitude limit of
$z\sim1.3$
, the redshift of which was identified only via a single emission line (Connor et al. Reference Connor2025). There also appears to be a magnitude limit of $m_r \sim 24$
, above which no FRB hosts are confidently identified by the typically ground-based, 8 m class optical telescope observations used to identify them. We partially attribute this to the inability of optical observations to observe the host, and primarily to the difficulty in uniquely identifying it amongst field galaxies. Indeed, B. Anderson et al. (in preparation) has shown that, with standard statistical methods (Aggarwal et al. Reference Aggarwal, Budavári, Deller, Eftekhari, James, Xavier Prochaska and Tendulkar2021), requiring a posterior likelihood of at least 90% results in significant bias against hosts with
$m_r \sim 24$
, above which no FRB hosts are confidently identified by the typically ground-based, 8 m class optical telescope observations used to identify them. We partially attribute this to the inability of optical observations to observe the host, and primarily to the difficulty in uniquely identifying it amongst field galaxies. Indeed, B. Anderson et al. (in preparation) has shown that, with standard statistical methods (Aggarwal et al. Reference Aggarwal, Budavári, Deller, Eftekhari, James, Xavier Prochaska and Tendulkar2021), requiring a posterior likelihood of at least 90% results in significant bias against hosts with $m_r \gt 22$
. This similarly suggests that many FRB host catalogues are incomplete above a redshift of
$m_r \gt 22$
. This similarly suggests that many FRB host catalogues are incomplete above a redshift of $\sim0.2$
.
$\sim0.2$
.
2.3. Simulating FRB observations
To estimate the redshift (and hence, magnitude) distribution of FRB host galaxies, we consider FRB observations by ASKAP, MeerKAT, and SKA-Mid. While LSST will have some overlap with the sky viewed by CHIME, and in the future, DSA-2000 (Hallinan et al. Reference Hallinan2019) and CHORD (Vanderlinde et al. Reference Vanderlinde2019), the majority of FRBs discovered by these instruments will not lie within the LSST sky coverage.
For ASKAP, we simulate observations with the CRAFT Coherent Upgrade (CRACO; Wang et al. Reference Wang2025), using a time resolution of 13.8 ms as per recent observations (Yuanming Wang et al. in preparation 2026). Rather than iterate over all ASKAP observing configurations, we choose a characteristic central frequency of 1 300 MHz, 280 MHz real-time bandwidth, and use the square_6x6 beam pattern with a beam separation of 0.9 deg. Assuming 25 ASKAP antennas are used for real-time imaging, we estimate a fluence threshold of 3.7 Jy ms to a burst of duration less than 13.8 ms detected at boresight. We simulate MeerKAT as per Caleb et al. (Reference Caleb2025), using the coherent (tied array beam) mode, with a mean frequency of 1284 MHz, yielding a threshold of 0.069 Jy ms to a 1 ms FRB (Jankowski et al. Reference Jankowski2023). We note that the estimated FRB detection threshold of the AA4 configuration of SKA-Mid in band 2 (L-band) is 0.059 Jy ms, similar to that of MeerKAT (FRB cosmology – SKA science chapter; L. Spitler, E. Keane et al., eds., in preparation 2026). Therefore, we expect that all the results we present here for MeerKAT will likely also apply to that instrument.
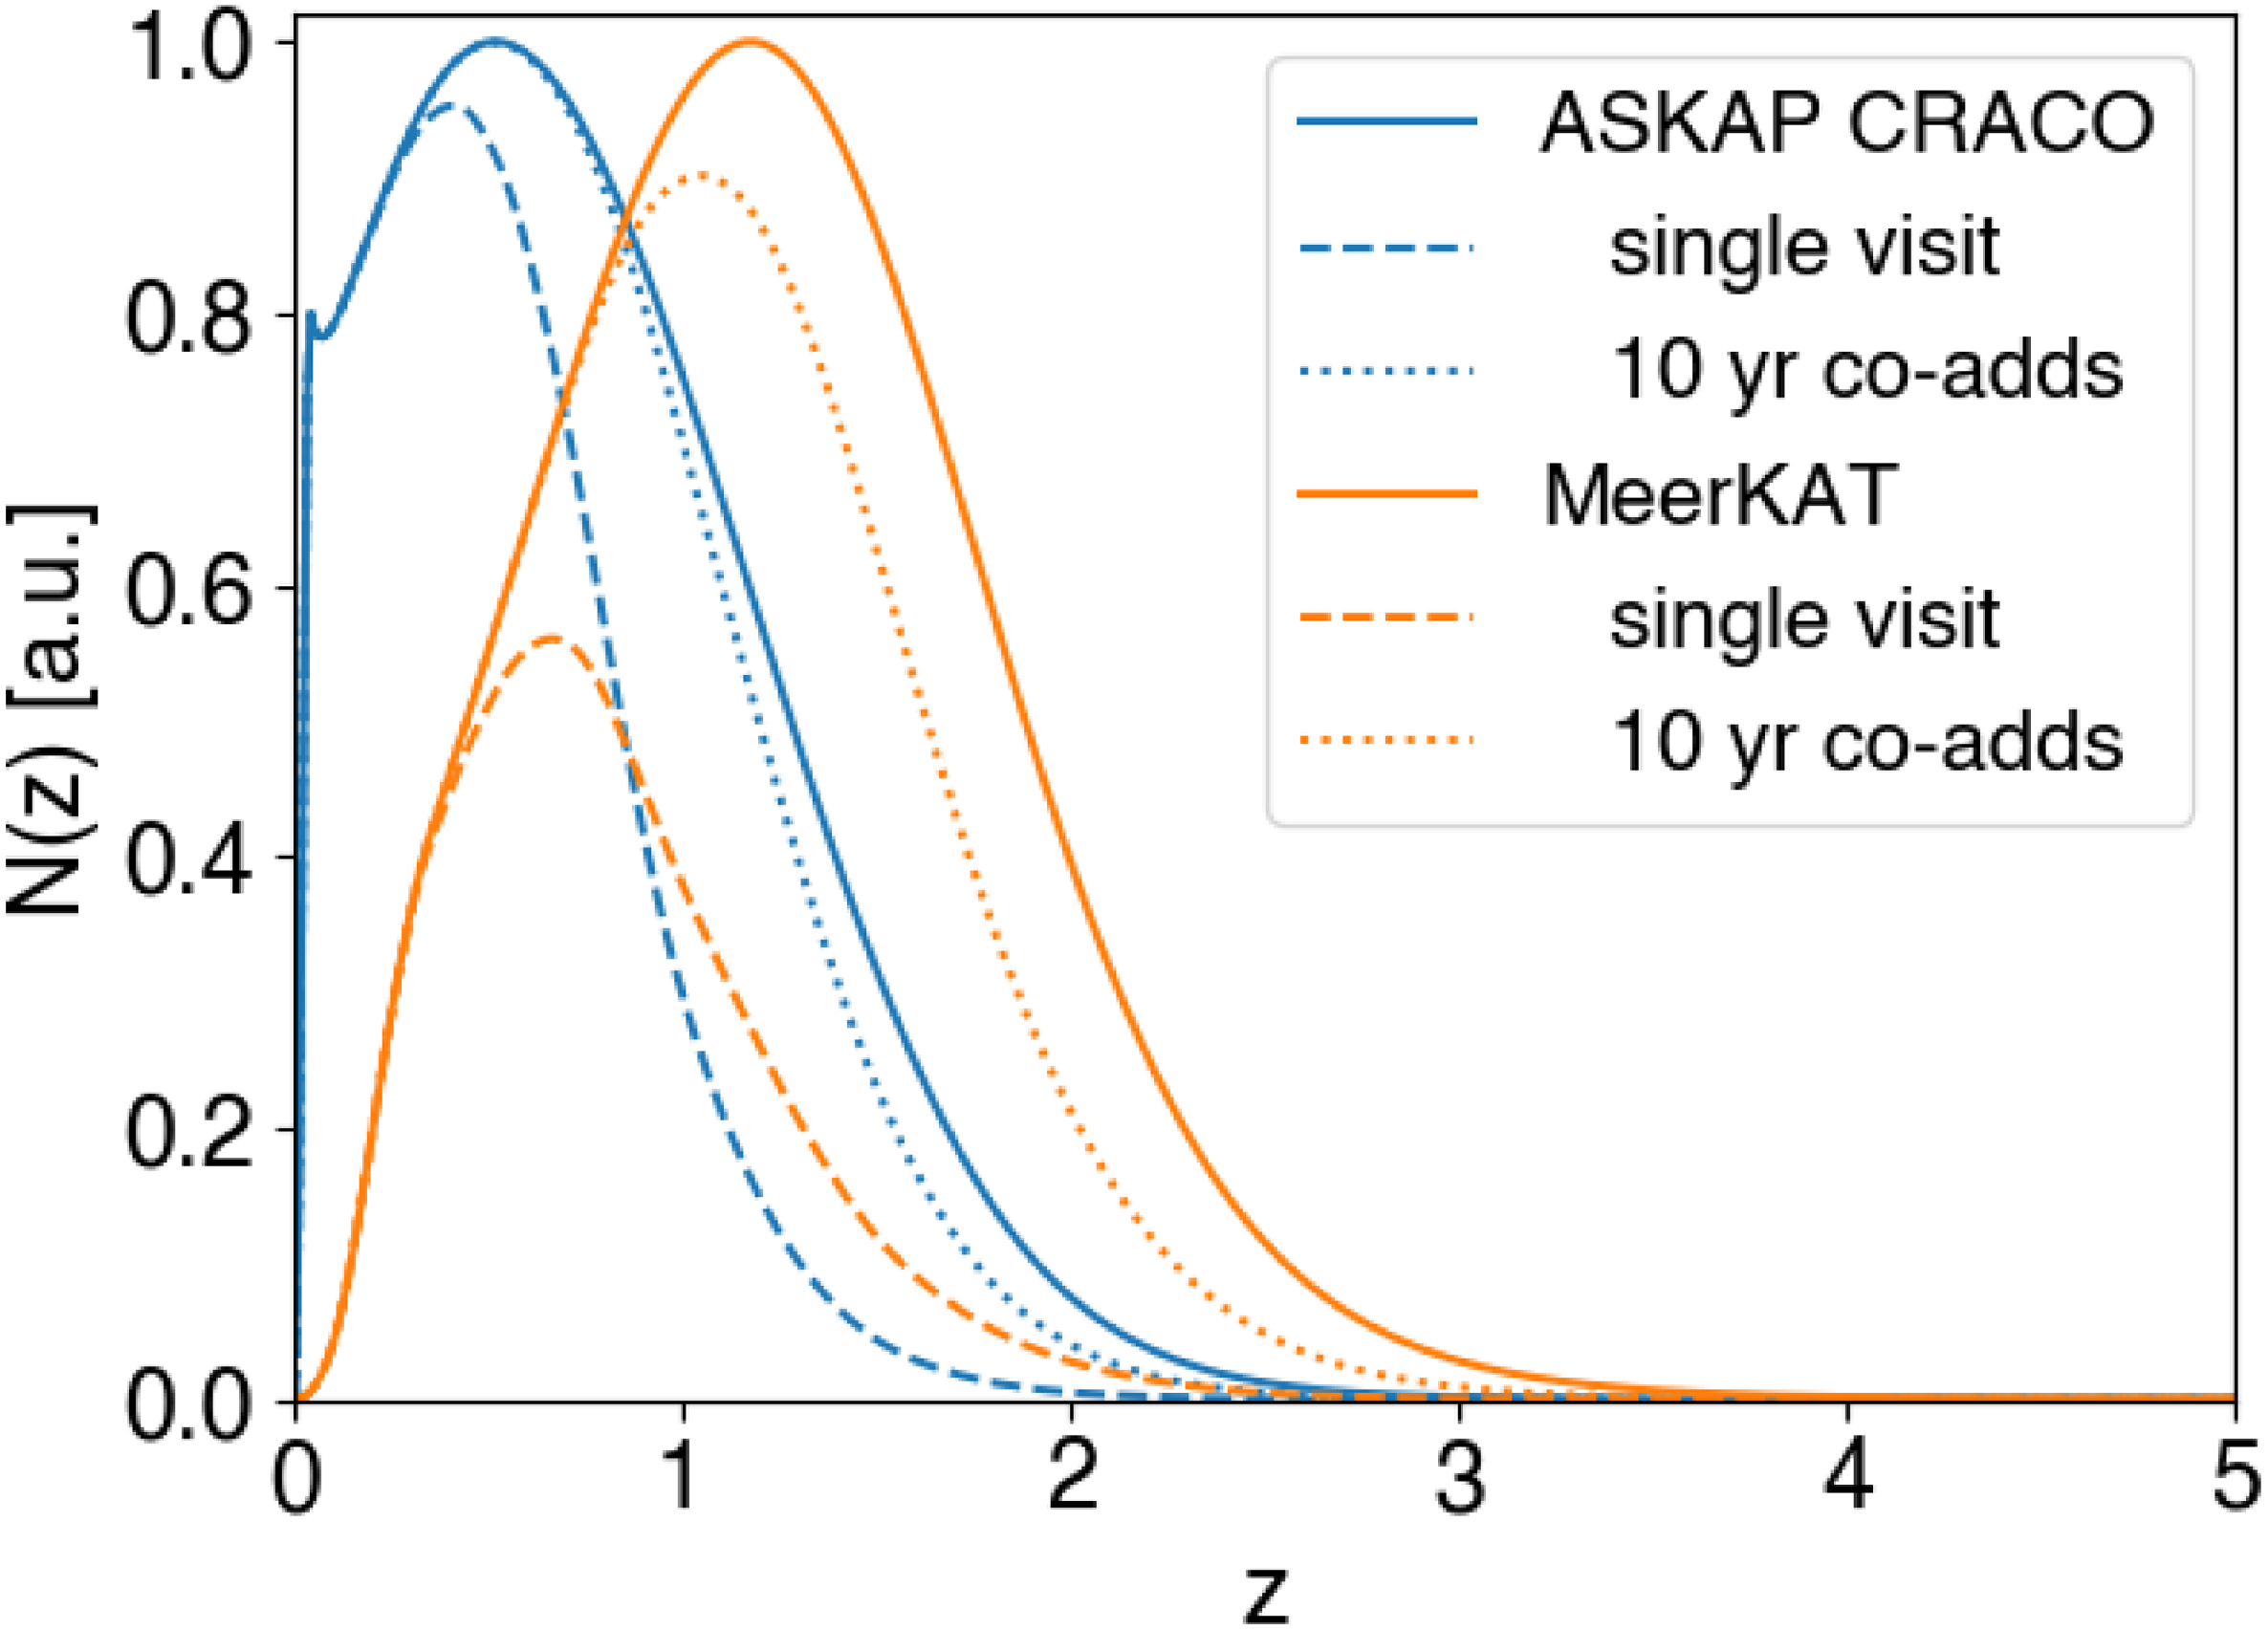
We use standard Planck cosmology (Planck Collaboration et al. Reference Collaboration2016), and take FRB population parameters from Hoffmann et al. (Reference Hoffmann, James, Glowacki, Prochaska, Gordon, Deller, Shannon and Ryder2025). The resulting FRB redshift distributions are shown as the solid curves in Figure 3, normalised to a peak of unity.
Redshift distribution of FRBs, normalised to a peak of unity, for FRBs detected by ASKAP’s CRACO system, and MeerKAT’s coherent MeerTRAP mode. Also shown are the redshift distributions of FRB host galaxies accessible with a single LSST visit (dashed) and 10yr co-adds (dotted).

2.4. Fraction of FRB hosts detectable by LSST
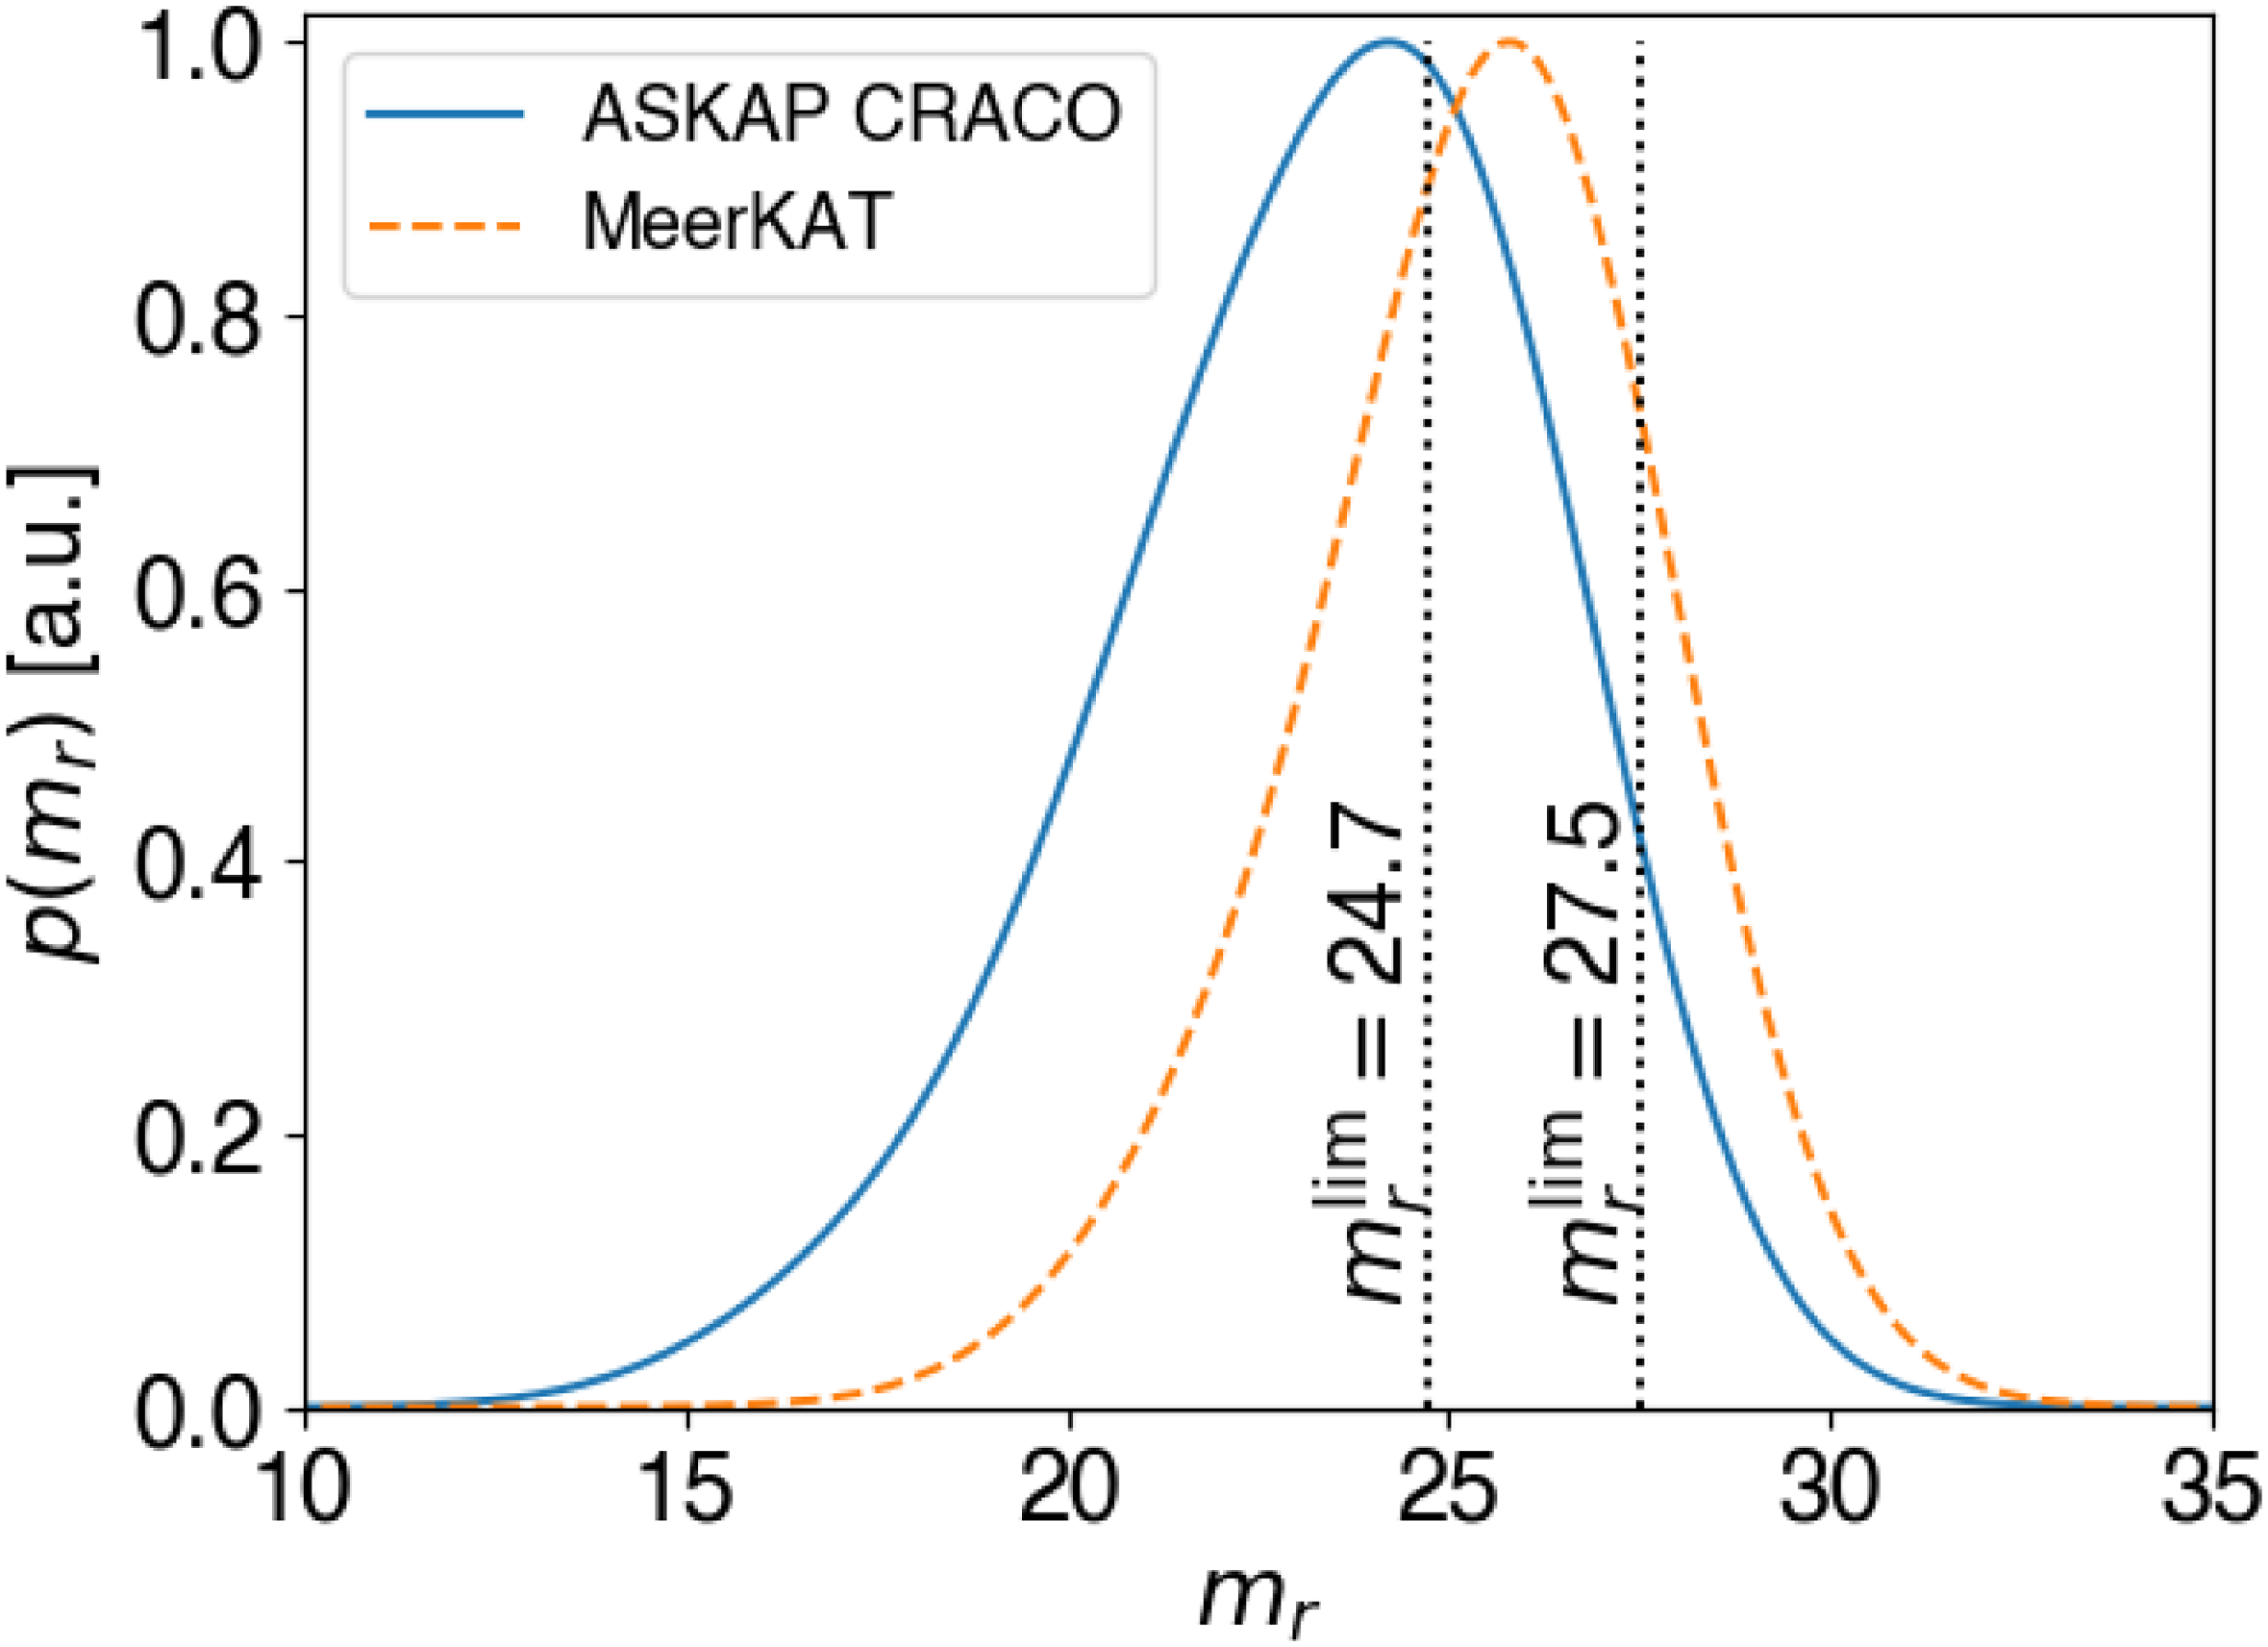
We can now evaluate, for any given survey, the total magnitude dependence of the FRB host galaxy distribution, by convolving the redshift distributions of Figure 3 with the detectable host fractions of Figure 2. The resulting distributions of $m_r$
are given in Figure 4. Coincidentally, the predicted peak in the magnitude distribution of ASKAP CRACO FRB hosts almost coincides with the LSST single visit magnitude limit, resulting in 65% of hosts being visible, while the
$m_r$
are given in Figure 4. Coincidentally, the predicted peak in the magnitude distribution of ASKAP CRACO FRB hosts almost coincides with the LSST single visit magnitude limit, resulting in 65% of hosts being visible, while the $m_r=27.5$
limit for 10 year co-adds is above the predicted peak for MeerTRAP FRB hosts, with 81% of hosts predicted to be detectable. These fractions are summarised in Table 1.
$m_r=27.5$
limit for 10 year co-adds is above the predicted peak for MeerTRAP FRB hosts, with 81% of hosts predicted to be detectable. These fractions are summarised in Table 1.
r-band magnitude distribution of FRB host galaxies expected to be detected by ASKAP’s CRACO system, and MeerKAT. Also shown (as vertical dotted lines) for comparison are the magnitude limits from LSST single visits and 10 year co-adds.

Fractions of FRB hosts detected in two FRB surveys estimated to be visible at LSST single visit and 10 year co-adds r-band magnitude limits of $m_r=24.7$
and
$m_r=24.7$
and $m_r=27.5$
, respectively.
$m_r=27.5$
, respectively.

We also evaluate the redshift-dependent fraction of FRBs visible to each survey given the magnitude limits of LSST single visits and 10 year co-adds – these modified redshift distributions are also shown in Figure 3.
Comparing Figure 3 to Figure 2 also makes it clear that the majority of ASKAP CRACO FRBs are predicted to be detected from a redshift range in which every FRB host galaxy should be visible in the LSST 10 year co-adds, under our current understanding of the FRB host galaxy population. This implies that any limitations in the current models of the intrinsic magnitude distribution of FRB host galaxies (at least at low redshift) would be highlighted by the combination of LSST and CRACO, enabling shortcomings to be quantified and addressed.
2.5 Follow-up strategies
Our predictions for the redshift–magnitude distribution of FRB host galaxies also allow us to make predictions for this distribution in the event that the host galaxy of a particular FRB is undetected. This can then be used to guide follow-up observations. Combining this distribution with the detection sensitivity and available observation time of the follow-up instrument would determine the probability of the host follow-up observation being successful, while the specific science case being analysed would determine the relative importance of finding a particular host galaxy of a given magnitude and redhsift. For instance, FRB host galaxy studies may give equal weighting to each host galaxy, while studies aimed at determining $H_0$
(a toy example of which is presented in Section 3) may value high-redshift bursts more than low-redshift bursts. Rather than attempting to optimise for a particular science case, we illustrate the joint probability
$H_0$
(a toy example of which is presented in Section 3) may value high-redshift bursts more than low-redshift bursts. Rather than attempting to optimise for a particular science case, we illustrate the joint probability $P(z,m_r)$
in the example case of an FRB with
$P(z,m_r)$
in the example case of an FRB with $\mathrm{DM}_\mathrm{EG} = 1\,300\,\mathrm{pc\,cm^{-3}}$
detected with ASKAP/CRACO in Figure 5. Such distributions are specific for each FRB DM, and each follow-up instrument, but can be readily calculated using the zDM code. They also have a similar general shape to that given in Figure 5. Projections onto the
$\mathrm{DM}_\mathrm{EG} = 1\,300\,\mathrm{pc\,cm^{-3}}$
detected with ASKAP/CRACO in Figure 5. Such distributions are specific for each FRB DM, and each follow-up instrument, but can be readily calculated using the zDM code. They also have a similar general shape to that given in Figure 5. Projections onto the $m_r$
or z axes are trivial to calculate, and can be used to estimate the likely redshift range of FRBs with unseen hosts, as performed by Marnoch et al. (Reference Marnoch2023).
$m_r$
or z axes are trivial to calculate, and can be used to estimate the likely redshift range of FRBs with unseen hosts, as performed by Marnoch et al. (Reference Marnoch2023).
Probability distribution $P(z,m_r|\mathrm{DM}_\mathrm{EG} = 1\,300\,\mathrm{pc\,cm^{-3}})$
for an FRB detected by CRACO, assuming the true host is fainter than the Rubin single visit magnitude limit of
$P(z,m_r|\mathrm{DM}_\mathrm{EG} = 1\,300\,\mathrm{pc\,cm^{-3}})$
for an FRB detected by CRACO, assuming the true host is fainter than the Rubin single visit magnitude limit of $24.7$
.
$24.7$
.

2.6 Complementarity of other surveys
Several other wide-field surveys are being planned or conducted on comparable timescales to LSST. The Euclid Wide Survey will cover $\sim14\,500$
deg
$\sim14\,500$
deg $^2$
– most of the sky, except low Galactic and ecliptic latitudes, spread approximately evenly between the Northern and Southern Hemispheres. It will have an AB-limiting magnitude of
$^2$
– most of the sky, except low Galactic and ecliptic latitudes, spread approximately evenly between the Northern and Southern Hemispheres. It will have an AB-limiting magnitude of $m_\mathrm{AB} = 26.2$
, although survey images of a characteristic extended source, with
$m_\mathrm{AB} = 26.2$
, although survey images of a characteristic extended source, with $10\,\sigma$
detection, require
$10\,\sigma$
detection, require $m_\mathrm{AB} \le 24.5$
(Euclid Collaboration et al. Reference Collaboration2022). Euclid photometric redshifts are expected to be more accurate than that of LSST, producing
$m_\mathrm{AB} \le 24.5$
(Euclid Collaboration et al. Reference Collaboration2022). Euclid photometric redshifts are expected to be more accurate than that of LSST, producing $\sigma_z \le 0.002 (1+z)$
(d’Assignies et al. Reference d’Assignies2025). This will be the most relevant survey for identifying FRB host galaxies detected by Northern-hemisphere instruments such as CHORD and DSA.
$\sigma_z \le 0.002 (1+z)$
(d’Assignies et al. Reference d’Assignies2025). This will be the most relevant survey for identifying FRB host galaxies detected by Northern-hemisphere instruments such as CHORD and DSA.
Several spectroscopic surveys with relatively wide fields are also being planned. The Nancy Grace Roman Space Telescope’s 2 400 deg $^2$
High-Latitude Wide-Area Spectroscopic Survey, with additional H-band data over
$^2$
High-Latitude Wide-Area Spectroscopic Survey, with additional H-band data over $2\,700$
deg
$2\,700$
deg $^2$
, will provide redshifts with an accuracy of
$^2$
, will provide redshifts with an accuracy of $\sigma_z \lt 0.001 (1+z)$
for galaxies with magnitudes
$\sigma_z \lt 0.001 (1+z)$
for galaxies with magnitudes $m_\mathrm{AB} \lesssim 24.0$
(depending on the filter), almost exclusively in the Southern Hemisphere (Wang et al. Reference Wang2022).Footnote
c
WAVES-Wide will cover 1 150 deg
$m_\mathrm{AB} \lesssim 24.0$
(depending on the filter), almost exclusively in the Southern Hemisphere (Wang et al. Reference Wang2022).Footnote
c
WAVES-Wide will cover 1 150 deg $^2$
, split between one equatorial and one Southern field, for galaxies with
$^2$
, split between one equatorial and one Southern field, for galaxies with $m_Z \le 21.2$
, and a likely redshift of
$m_Z \le 21.2$
, and a likely redshift of $z \lt 0.2$
(Driver et al. Reference Driver2019). Both will prove crucial for establishing a set of FRBs with high-fidelity redshift measurements against which Rubin data can be calibrated – and providing additional information, such as star-formation histories, which may be important for understanding FRB origins (Gordon et al. Reference Gordon2023).
$z \lt 0.2$
(Driver et al. Reference Driver2019). Both will prove crucial for establishing a set of FRBs with high-fidelity redshift measurements against which Rubin data can be calibrated – and providing additional information, such as star-formation histories, which may be important for understanding FRB origins (Gordon et al. Reference Gordon2023).
The degree to which these latter surveys will overlap with detected FRBs depends significantly on the observation strategies of FRB-hunting instruments. Deep radio surveys naturally target regions with correspondingly deep optical catalogues, producing an excess of FRBs with high-quality optical data. Current examples include the Deep Investigation of Neutral Gas Origins (DINGO; Rhee et al. Reference Rhee2023) survey with ASKAP, and the Looking At the Distant Universe with the MeerKAT Array (LADUMA; Holwerda, Blyth, & Baker Reference Holwerda, Blyth, Baker, Tuffs and Popescu2012) survey – both deep HI surveys that target the GAMA-23 field for 3 200 h, and the Chandra Deep Field South for 5 000 h, respectively.
In this work, we do not explore the full parameter space of different FRB-hunting instruments, and the time at which each spends observing (and hence, discovering FRBs) in the various fields of existing and planned optical surveys. Neither have we considered Galactic extinction, which not only degrades optical images, but is correlated with Galactic scattering, which reduces the FRB rate at low latitudes (Chime/FRB Collaboration et al. 2026), and uncertainties in the Galactic DM budget (see e.g. Ravi et al. Reference Ravi2025), which reduces the utility of low-latitude FRBs for analysing the cosmic distribution of ionised gas (Hoffmann et al. Reference Hoffmann, James, Glowacki, Prochaska, Gordon, Deller, Shannon and Ryder2025). We suggest rather that analyses such as this one be performed when considering specific future proposals.
3. Parameter estimation with photo-z
The majority of cosmological studies with FRB host galaxies utilise spectroscopic redshifts. However, Rubin will provide only photometric redshifts, the estimation of which is currently in development (e.g. RAIL Team et al. Reference Team2026) – however, initial studies with the DP1 data are very promising,Footnote
d
although due to a limited training sample, the photometric redshift estimates are not robust past $z\sim 1.5$
, and we further caution that the magnitude distribution of the DP1 photo-z test is not representative of the full LSST magnitude-limited sample, and due to the limited data volume, the test set was not reweighted to match the test set to the LSST distribution (Zhang et al. Reference Zhang2025). In this DP1 study, six different algorithms for determining photo-zs from Rubin DP1 data, covering the Extended Chandra Deep Field South, are tested against spec-zs. All algorithms tested had broadly similar performance, generating approximately 10–20% outliers with large (
$z\sim 1.5$
, and we further caution that the magnitude distribution of the DP1 photo-z test is not representative of the full LSST magnitude-limited sample, and due to the limited data volume, the test set was not reweighted to match the test set to the LSST distribution (Zhang et al. Reference Zhang2025). In this DP1 study, six different algorithms for determining photo-zs from Rubin DP1 data, covering the Extended Chandra Deep Field South, are tested against spec-zs. All algorithms tested had broadly similar performance, generating approximately 10–20% outliers with large ( $\delta z / (1+z) \gt 0.15$
) redshift errors (Zhang et al. Reference Zhang2025). Here, we arbitrarily use a k nearest neighbour (kNN) algorithm (RAIL Team et al. Reference Team2026), which showed a characteristic rms error in
$\delta z / (1+z) \gt 0.15$
) redshift errors (Zhang et al. Reference Zhang2025). Here, we arbitrarily use a k nearest neighbour (kNN) algorithm (RAIL Team et al. Reference Team2026), which showed a characteristic rms error in $z_\mathrm{photo}-z_\mathrm{spec}$
of
$z_\mathrm{photo}-z_\mathrm{spec}$
of $\sigma_z=0.035$
when excluding outliers, as a typical value. This error is consistent with other studies, e.g. Tanaka et al. (Reference Tanaka2018). However, we note that DP1 has particularly shallow u and y bands, and the increased depth of these bands in full survey should reduce the number of outliers.
$\sigma_z=0.035$
when excluding outliers, as a typical value. This error is consistent with other studies, e.g. Tanaka et al. (Reference Tanaka2018). However, we note that DP1 has particularly shallow u and y bands, and the increased depth of these bands in full survey should reduce the number of outliers.
To determine the effect of such errors on cosmological parameter estimation, we first generate a mock FRB sample, and then use this to estimate Hubble’s Constant, $H_0$
. While this is an overly simplified analysis, we aim only to get a characteristic order-of-magnitude estimate in the uncertainty due to the use of photo-zs rather than spec-zs. In particular, we assume that the magnitude threshold required to estimate a photometric redshift is identical to that required to identify a host galaxy. In reality, it is likely that faint galaxies may not be detected in Rubin’s u-band, increasing
$H_0$
. While this is an overly simplified analysis, we aim only to get a characteristic order-of-magnitude estimate in the uncertainty due to the use of photo-zs rather than spec-zs. In particular, we assume that the magnitude threshold required to estimate a photometric redshift is identical to that required to identify a host galaxy. In reality, it is likely that faint galaxies may not be detected in Rubin’s u-band, increasing $\sigma_z$
for that subset – thus, our analysis should be updated to reflect this once photometric redshift determination with LSST is more mature.
$\sigma_z$
for that subset – thus, our analysis should be updated to reflect this once photometric redshift determination with LSST is more mature.
3.1 Monte Carlo simulation of photometric redshifts
To model errors in photometric redshift, we assume Gaussian errors with a standard deviation, $\sigma_z$
, of
$\sigma_z$
, of $0.035$
, as per the kNN algorithm.Footnote
d
We also consider the fraction of visible hosts using
$0.035$
, as per the kNN algorithm.Footnote
d
We also consider the fraction of visible hosts using $m_r^\mathrm{lim}= 24.7$
from Figure 2. These effects were implemented into the simulation of ASKAP’s coherent (‘CRACO’) observation mode from Wang et al. (Reference Wang2025) for 900 MHz observations described in Section 2.3 to produce modified joint detection probabilities of redshift and dispersion measure,
$m_r^\mathrm{lim}= 24.7$
from Figure 2. These effects were implemented into the simulation of ASKAP’s coherent (‘CRACO’) observation mode from Wang et al. (Reference Wang2025) for 900 MHz observations described in Section 2.3 to produce modified joint detection probabilities of redshift and dispersion measure, $p(z,\mathrm{DM})$
(the redshift distributions shown in Figure 3 are simply these joint
$p(z,\mathrm{DM})$
(the redshift distributions shown in Figure 3 are simply these joint $p(z,\mathrm{DM})$
distributions, summed over the DM axis). A FRB survey of 100 FRBs was generated through Monte Carlo sampling of
$p(z,\mathrm{DM})$
distributions, summed over the DM axis). A FRB survey of 100 FRBs was generated through Monte Carlo sampling of $p(z,\mathrm{DM})$
, both with and without errors from photo-z estimation, and with and without limiting to the observable
$p(z,\mathrm{DM})$
, both with and without errors from photo-z estimation, and with and without limiting to the observable $m_r^\mathrm{lim}$
. This Monte Carlo procedure was first used to estimate the sensitivity of the derived value of
$m_r^\mathrm{lim}$
. This Monte Carlo procedure was first used to estimate the sensitivity of the derived value of $H_0$
to CRACO by James et al. (Reference James2022). Examples of these grids for the unmodified case, and including both
$H_0$
to CRACO by James et al. (Reference James2022). Examples of these grids for the unmodified case, and including both $\sigma_z$
and
$\sigma_z$
and $m_r^\mathrm{lim}=24.7$
, are given in Figure 6. We have also repeated the exercise for MeerTRAP coherent mode, again using the parameters described in Section 2.3, using
$m_r^\mathrm{lim}=24.7$
, are given in Figure 6. We have also repeated the exercise for MeerTRAP coherent mode, again using the parameters described in Section 2.3, using $m_r^\mathrm{lim} = 27.5$
– these examples are shown in Figure 7.
$m_r^\mathrm{lim} = 27.5$
– these examples are shown in Figure 7.
zDM grids and their Monte Carlo FRBs for different LSST parameters: all CRACO FRB host galaxies (top), and including both photo-z errors $\sigma_z$
and host galaxy magnitude limits
$\sigma_z$
and host galaxy magnitude limits $m_r^\mathrm{lim}$
(bottom). The shading indicates the probability density of the simulated truth distribution from which FRBs are sampled, modified in the lower plot by LSST observational effects, while the points indicate the actual sampled FRBs used in this study.
$m_r^\mathrm{lim}$
(bottom). The shading indicates the probability density of the simulated truth distribution from which FRBs are sampled, modified in the lower plot by LSST observational effects, while the points indicate the actual sampled FRBs used in this study.

As per Figure 6, but for MeerKAT coherent, and $m_r^\mathrm{lim}=27.5$
.
$m_r^\mathrm{lim}=27.5$
.

We test the sensitivity of $H_0$
estimation to these photometric adjustments by generating zDM grids for
$H_0$
estimation to these photometric adjustments by generating zDM grids for $H_{0}$
in 91 uniformly spaced increments between 60 and 90 km s
$H_{0}$
in 91 uniformly spaced increments between 60 and 90 km s $^{-1}$
Mpc
$^{-1}$
Mpc $^{-1}$
, and evaluating the likelihood of each fake survey to the resulting predicted z–DM distribution. The likelihood contains terms giving the probability for the total number of FRBs observed compared to expectations, their positions in z–DM space, and the ratio of signal-to-noise to threshold signal-to-noise given that position in the z–DM grid – they are calculated according to James et al. (Reference James2022). Exactly the same Monte Carlo sample was used for all likelihood scans, except for the FRBs removed due to the simulated magnitude limit, so that Monte Carlo variation did not impact the relative precision of
$^{-1}$
, and evaluating the likelihood of each fake survey to the resulting predicted z–DM distribution. The likelihood contains terms giving the probability for the total number of FRBs observed compared to expectations, their positions in z–DM space, and the ratio of signal-to-noise to threshold signal-to-noise given that position in the z–DM grid – they are calculated according to James et al. (Reference James2022). Exactly the same Monte Carlo sample was used for all likelihood scans, except for the FRBs removed due to the simulated magnitude limit, so that Monte Carlo variation did not impact the relative precision of $H_0$
estimation. The resulting likelihoods for all combinations of including/excluding
$H_0$
estimation. The resulting likelihoods for all combinations of including/excluding $\sigma_z$
and
$\sigma_z$
and $m_r^\mathrm{lim}$
effects are given in Figure 8, in the case of CRACO. We characterise the sensitivity to
$m_r^\mathrm{lim}$
effects are given in Figure 8, in the case of CRACO. We characterise the sensitivity to $H_{0}$
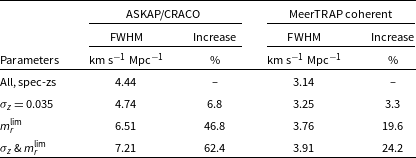
via the full-width half-max of the likelihood function, which is given in Table 2. We note that the accuracy of the measurements are determined by the random sampling of FRBs, and are correlated between all four simulations for the one instrument (CRACO or MeerTRAP), since exactly the same FRB sample was used.
$H_{0}$
via the full-width half-max of the likelihood function, which is given in Table 2. We note that the accuracy of the measurements are determined by the random sampling of FRBs, and are correlated between all four simulations for the one instrument (CRACO or MeerTRAP), since exactly the same FRB sample was used.
Our results show that our simulated photo-z error of $\sigma_z=0.035$
will have little impact on cosmological parameter estimation. This should not be surprising, given that the
$\sigma_z=0.035$
will have little impact on cosmological parameter estimation. This should not be surprising, given that the $p(\mathrm{DM}|z)$
distribution has a spread of
$p(\mathrm{DM}|z)$
distribution has a spread of ${\mathcal O}\sim100\,\mathrm{pc\,cm^{-3}}$
, which corresponds to an uncertainty of approximately
${\mathcal O}\sim100\,\mathrm{pc\,cm^{-3}}$
, which corresponds to an uncertainty of approximately $\pm 0.1$
z given the slope of the Macquart (z–DM) relation (Macquart et al. Reference Macquart2020). Hence, an error of
$\pm 0.1$
z given the slope of the Macquart (z–DM) relation (Macquart et al. Reference Macquart2020). Hence, an error of $0.035$
z, added in quadrature, would naively be expected to reduce sensitivity by
$0.035$
z, added in quadrature, would naively be expected to reduce sensitivity by ${\mathcal O}\sim 6$
% – very close to the 6.8% and 3.3% increases we find for ASKAP/CRACO and MeerTRAP coherent. The effect for MeerTRAP is lower because, due to fluctuations in the cosmological DM, intrinsic variation in the Macquart relation increases with redshift, and this reduces the relative importance of redshift errors. We caution that our results do not include major outliers in photo-zs, which we implicitly assume can be removed by quality cuts. Furthermore, as noted in the Introduction, FRB hosts are not a fully representative sample of field galaxies, so that photo-z estimation for the subcategory of FRB hosts may differ.
${\mathcal O}\sim 6$
% – very close to the 6.8% and 3.3% increases we find for ASKAP/CRACO and MeerTRAP coherent. The effect for MeerTRAP is lower because, due to fluctuations in the cosmological DM, intrinsic variation in the Macquart relation increases with redshift, and this reduces the relative importance of redshift errors. We caution that our results do not include major outliers in photo-zs, which we implicitly assume can be removed by quality cuts. Furthermore, as noted in the Introduction, FRB hosts are not a fully representative sample of field galaxies, so that photo-z estimation for the subcategory of FRB hosts may differ.
A much more significant effect is the reduced fraction of high-redshift FRB host galaxies detectable by Rubin. Our Monte Carlo sampling of the $m_r^\mathrm{lim}=24.7$
(
$m_r^\mathrm{lim}=24.7$
( $27.5$
) criteria for ASKAP/CRACO (MeerTRAP coherent) preserved 74% (78%) of the original FRBs (expected value 65% (81%) from Table 1), which by simple
$27.5$
) criteria for ASKAP/CRACO (MeerTRAP coherent) preserved 74% (78%) of the original FRBs (expected value 65% (81%) from Table 1), which by simple $N^{0.5}$
scaling, should increase the uncertainty on
$N^{0.5}$
scaling, should increase the uncertainty on $H_0$
by 16% (12%). However, this cut instead increased the uncertainty by
$H_0$
by 16% (12%). However, this cut instead increased the uncertainty by $46.8\%$
(
$46.8\%$
( $19.6$
%), implying that the high-redshift hosts have a much greater statistical weight in the analysis. Again, this should not be surprising; in the case of
$19.6$
%), implying that the high-redshift hosts have a much greater statistical weight in the analysis. Again, this should not be surprising; in the case of $H_0$
, which is determined via the slope of the Macquart relation (Macquart et al. Reference Macquart2020; James et al. Reference James2022), high-redshift FRBs give a larger lever arm.
$H_0$
, which is determined via the slope of the Macquart relation (Macquart et al. Reference Macquart2020; James et al. Reference James2022), high-redshift FRBs give a larger lever arm.
Relative sensitivity of $H_{0}$
measurements for ASKAP/CRACO and MeerKAT coherent observations, using all FRB hosts with spec-zs; adjusting for photo-z errors of
$H_{0}$
measurements for ASKAP/CRACO and MeerKAT coherent observations, using all FRB hosts with spec-zs; adjusting for photo-z errors of $\sigma_z=0.035$
; adjusting for a single visit magnitude limit of
$\sigma_z=0.035$
; adjusting for a single visit magnitude limit of $m_r^\mathrm{lim}$
(of
$m_r^\mathrm{lim}$
(of $24.7$
for ASKAPO/CRACO and
$24.7$
for ASKAPO/CRACO and $27.5$
for MeerTRAP coherent); and including both these latter effects. Sensitivity is measured via the FWHM of likelihoods calculated in Figure 8.
$27.5$
for MeerTRAP coherent); and including both these latter effects. Sensitivity is measured via the FWHM of likelihoods calculated in Figure 8.
Normalised scan of likelihoods of $H_{0}$
for 100 simulated FRB detections by ASKAP CRACO, including limitations of LSST photometric z estimates (
$H_{0}$
for 100 simulated FRB detections by ASKAP CRACO, including limitations of LSST photometric z estimates ( $\sigma_z = 0.035$
); magnitude limit of
$\sigma_z = 0.035$
); magnitude limit of $m_r^\mathrm{lim}=24.7$
on host observations; and both together.
$m_r^\mathrm{lim}=24.7$
on host observations; and both together.

We also note two potentially biasing effects not simulated here. Firstly, it is unclear if there will be a bias in host DM contribution depending on galaxy type. While larger and brighter FRB host galaxies are expected to produce larger host DM contributions (e.g. Zhang et al. Reference Zhang, Yu, He and Wang2020), a weak anti-correlation is observed within current small samples (Leung et al. Reference Leung2025). Whatever the true effect, by preferentially selecting bright galaxies for high-redshift FRBs, optical selection effects may bias the host galaxy DM contribution, and hence skew the z–DM relation. Secondly, there is some evidence that strongly repeating FRBs favour dwarf host galaxies, but exhibit a large excess DM, potentially due to ionised media in the vicinity of the progenitor (Michilli et al. Reference Michilli2018; Niu et al. Reference Niu2022), or ionisation of the star-forming gas reservoir. If this is the case, then optically-limited host observations may be biased against strong repeaters. Such effects suggest that targeted follow-up of FRB host galaxies which cannot be identified by Rubin may still be warranted.
4. Discussion and conclusion
We have investigated the apparent magnitude of FRB host galaxies as a function of redshift using the analysis of Marnoch et al. (Reference Marnoch2023), and coupled this to predictions for redshift dependence based on FRB dispersion measure using the zDM code. The resulting model predicts the distribution of FRB host galaxies in z– $m_r$
space, and is generally applicable to any optical follow-up observation.
$m_r$
space, and is generally applicable to any optical follow-up observation.
We apply this model to FRBs detected by the coherent observation modes of ASKAP and MeerKAT, and use LSST limiting optical r-band magnitudes corresponding to both a single visit and 10 year co-adds. We find that the expected sensitivity obtained by a single visit is expected to be sufficient to identify almost all FRB host galaxies out to $z \sim 0.5$
, and a majority out to
$z \sim 0.5$
, and a majority out to $z \sim 1$
, while the 10 year co-adds will identify essentially all hosts to
$z \sim 1$
, while the 10 year co-adds will identify essentially all hosts to $z\sim1$
and the majority to
$z\sim1$
and the majority to $z\sim2$
, reaching up to 50% around cosmic noon (
$z\sim2$
, reaching up to 50% around cosmic noon ( $z\sim2$
). Combined with a survey coverage of the entire Southern Hemisphere, LSST will find the majority of host galaxies from FRBs detected by ASKAP and MeerKAT in their coherent observation modes – and likely the SKA also.
$z\sim2$
). Combined with a survey coverage of the entire Southern Hemisphere, LSST will find the majority of host galaxies from FRBs detected by ASKAP and MeerKAT in their coherent observation modes – and likely the SKA also.
We have also used estimates for the accuracy of Rubin’s photometric redshifts, and included this in a simplified simulation to estimate Hubble’s constant, $H_0$
. We determine that errors introduced by the use of photometric redshifts are expected to be relatively minor – in the case of ASKAP/CRACO FRB hosts detected in a single visit Rubin observation, a 6.8% reduction in statistical precision is expected, while it is only 3.3% for MeerTRAP FRB hosts detected in co-added images at completion of the LSST. However, missing high-z FRBs will have a greater effect, leading to 47% and 24% decreases in precision, respectively.
$H_0$
. We determine that errors introduced by the use of photometric redshifts are expected to be relatively minor – in the case of ASKAP/CRACO FRB hosts detected in a single visit Rubin observation, a 6.8% reduction in statistical precision is expected, while it is only 3.3% for MeerTRAP FRB hosts detected in co-added images at completion of the LSST. However, missing high-z FRBs will have a greater effect, leading to 47% and 24% decreases in precision, respectively.
A potential, even more powerful, application of Rubin data will be field-level inference of the cosmic baryons in the FRB lines of sight, whereby the passage of FRBs through cosmic structures is reconstructed, and the fraction of baryons in circumgalactic (CGM) and intergalactic (IGM) media statistically determined (Lee et al. Reference Lee, Ata, Khrykin, Huang, Xavier Prochaska, Cooke, Zhang and Batten2022). The FLIMFLAM survey used extensive spectroscopic redshift measurements in the direction of eight known FRBs to infer cosmological gas fractions (relative to the critical density) of $f_\mathrm{IGM}=0.59_{-0.10}^{+0.11}$
and
$f_\mathrm{IGM}=0.59_{-0.10}^{+0.11}$
and $f_\mathrm{CGM} = 0.55_{-0.29}^{+0.26}$
, but was very observationally intensive (Khrykin et al. Reference Khrykin2024), highlighting the need to use non-targeted surveys such as LSST. This approach can also self-consistently break degeneracies with respect to FRBs with anomalously high host DMs (Lee et al. Reference Lee2023) or uncertain host associations (Heintz et al. Reference Heintz2020). However, further work will be required to determine whether Rubin’s photometric redshifts will provide sufficient information for such studies. Combining information from other surveys such as Euclid, Roman, and WAVES may significantly improve this issue. Redshift uncertainties tend to rise at low redshifts, as discussed in Newman & Gruen (Reference Newman and Gruen2022). However, it is much more feasible to obtain spectroscopy of lower redshift galaxies via ground-based spectroscopic follow up or the aforementioned surveys, so we ignore this effect here.
$f_\mathrm{CGM} = 0.55_{-0.29}^{+0.26}$
, but was very observationally intensive (Khrykin et al. Reference Khrykin2024), highlighting the need to use non-targeted surveys such as LSST. This approach can also self-consistently break degeneracies with respect to FRBs with anomalously high host DMs (Lee et al. Reference Lee2023) or uncertain host associations (Heintz et al. Reference Heintz2020). However, further work will be required to determine whether Rubin’s photometric redshifts will provide sufficient information for such studies. Combining information from other surveys such as Euclid, Roman, and WAVES may significantly improve this issue. Redshift uncertainties tend to rise at low redshifts, as discussed in Newman & Gruen (Reference Newman and Gruen2022). However, it is much more feasible to obtain spectroscopy of lower redshift galaxies via ground-based spectroscopic follow up or the aforementioned surveys, so we ignore this effect here.
We acknowledge that several aspects of our study are imprecise – particularly in our treatment of photo-z errors – and more sophisticated techniques will need to be used when performing future analyses based on the first, and subsequent, annual LSST data releases. Nonetheless, we conclude that the advent of the Vera C. Rubin Observatory and its Legacy Survey of Space and Time will be a monumental enabler for identifying the host galaxies of FRBs detected in the Southern Hemisphere, and facilitating subsequent cosmological studies. Furthermore, as the next generation of radio telescopes overlapping with LSST is expected to localise more FRBs than is practical to obtain comprehensive spectroscopic followup, photometric redshifts may become a necessity to truly understand FRB hosts as a population.
Acknowledgements
Australian access to LSST data is enabled by funding from the Australian Government through an Australian Research Council Linkage Infrastructure, Equipment and Facilities grant LE220100007, as well as the National Collaborative Research Infrastructure Strategy (NCRIS). CRACO was funded through Australian Research Council (ARC) Linkage Infrastructure Equipment, and Facilities grant LE210100107. RMS acknowledges support through ARC Discovery Project DP220102305.
Data availability statement
The data and results from this work can be obtained from the zDM GitHub codebase (James et al. Reference James, Prochaska and Ghosh2021), at https://github.com/FRBs/zdm.
Funding statement
The authors declare no external sources of funding.
Competing interests
The authors declare no competing interests.
 ±1σ
±1σ ±2σ
±2σ mr
mr mr
mr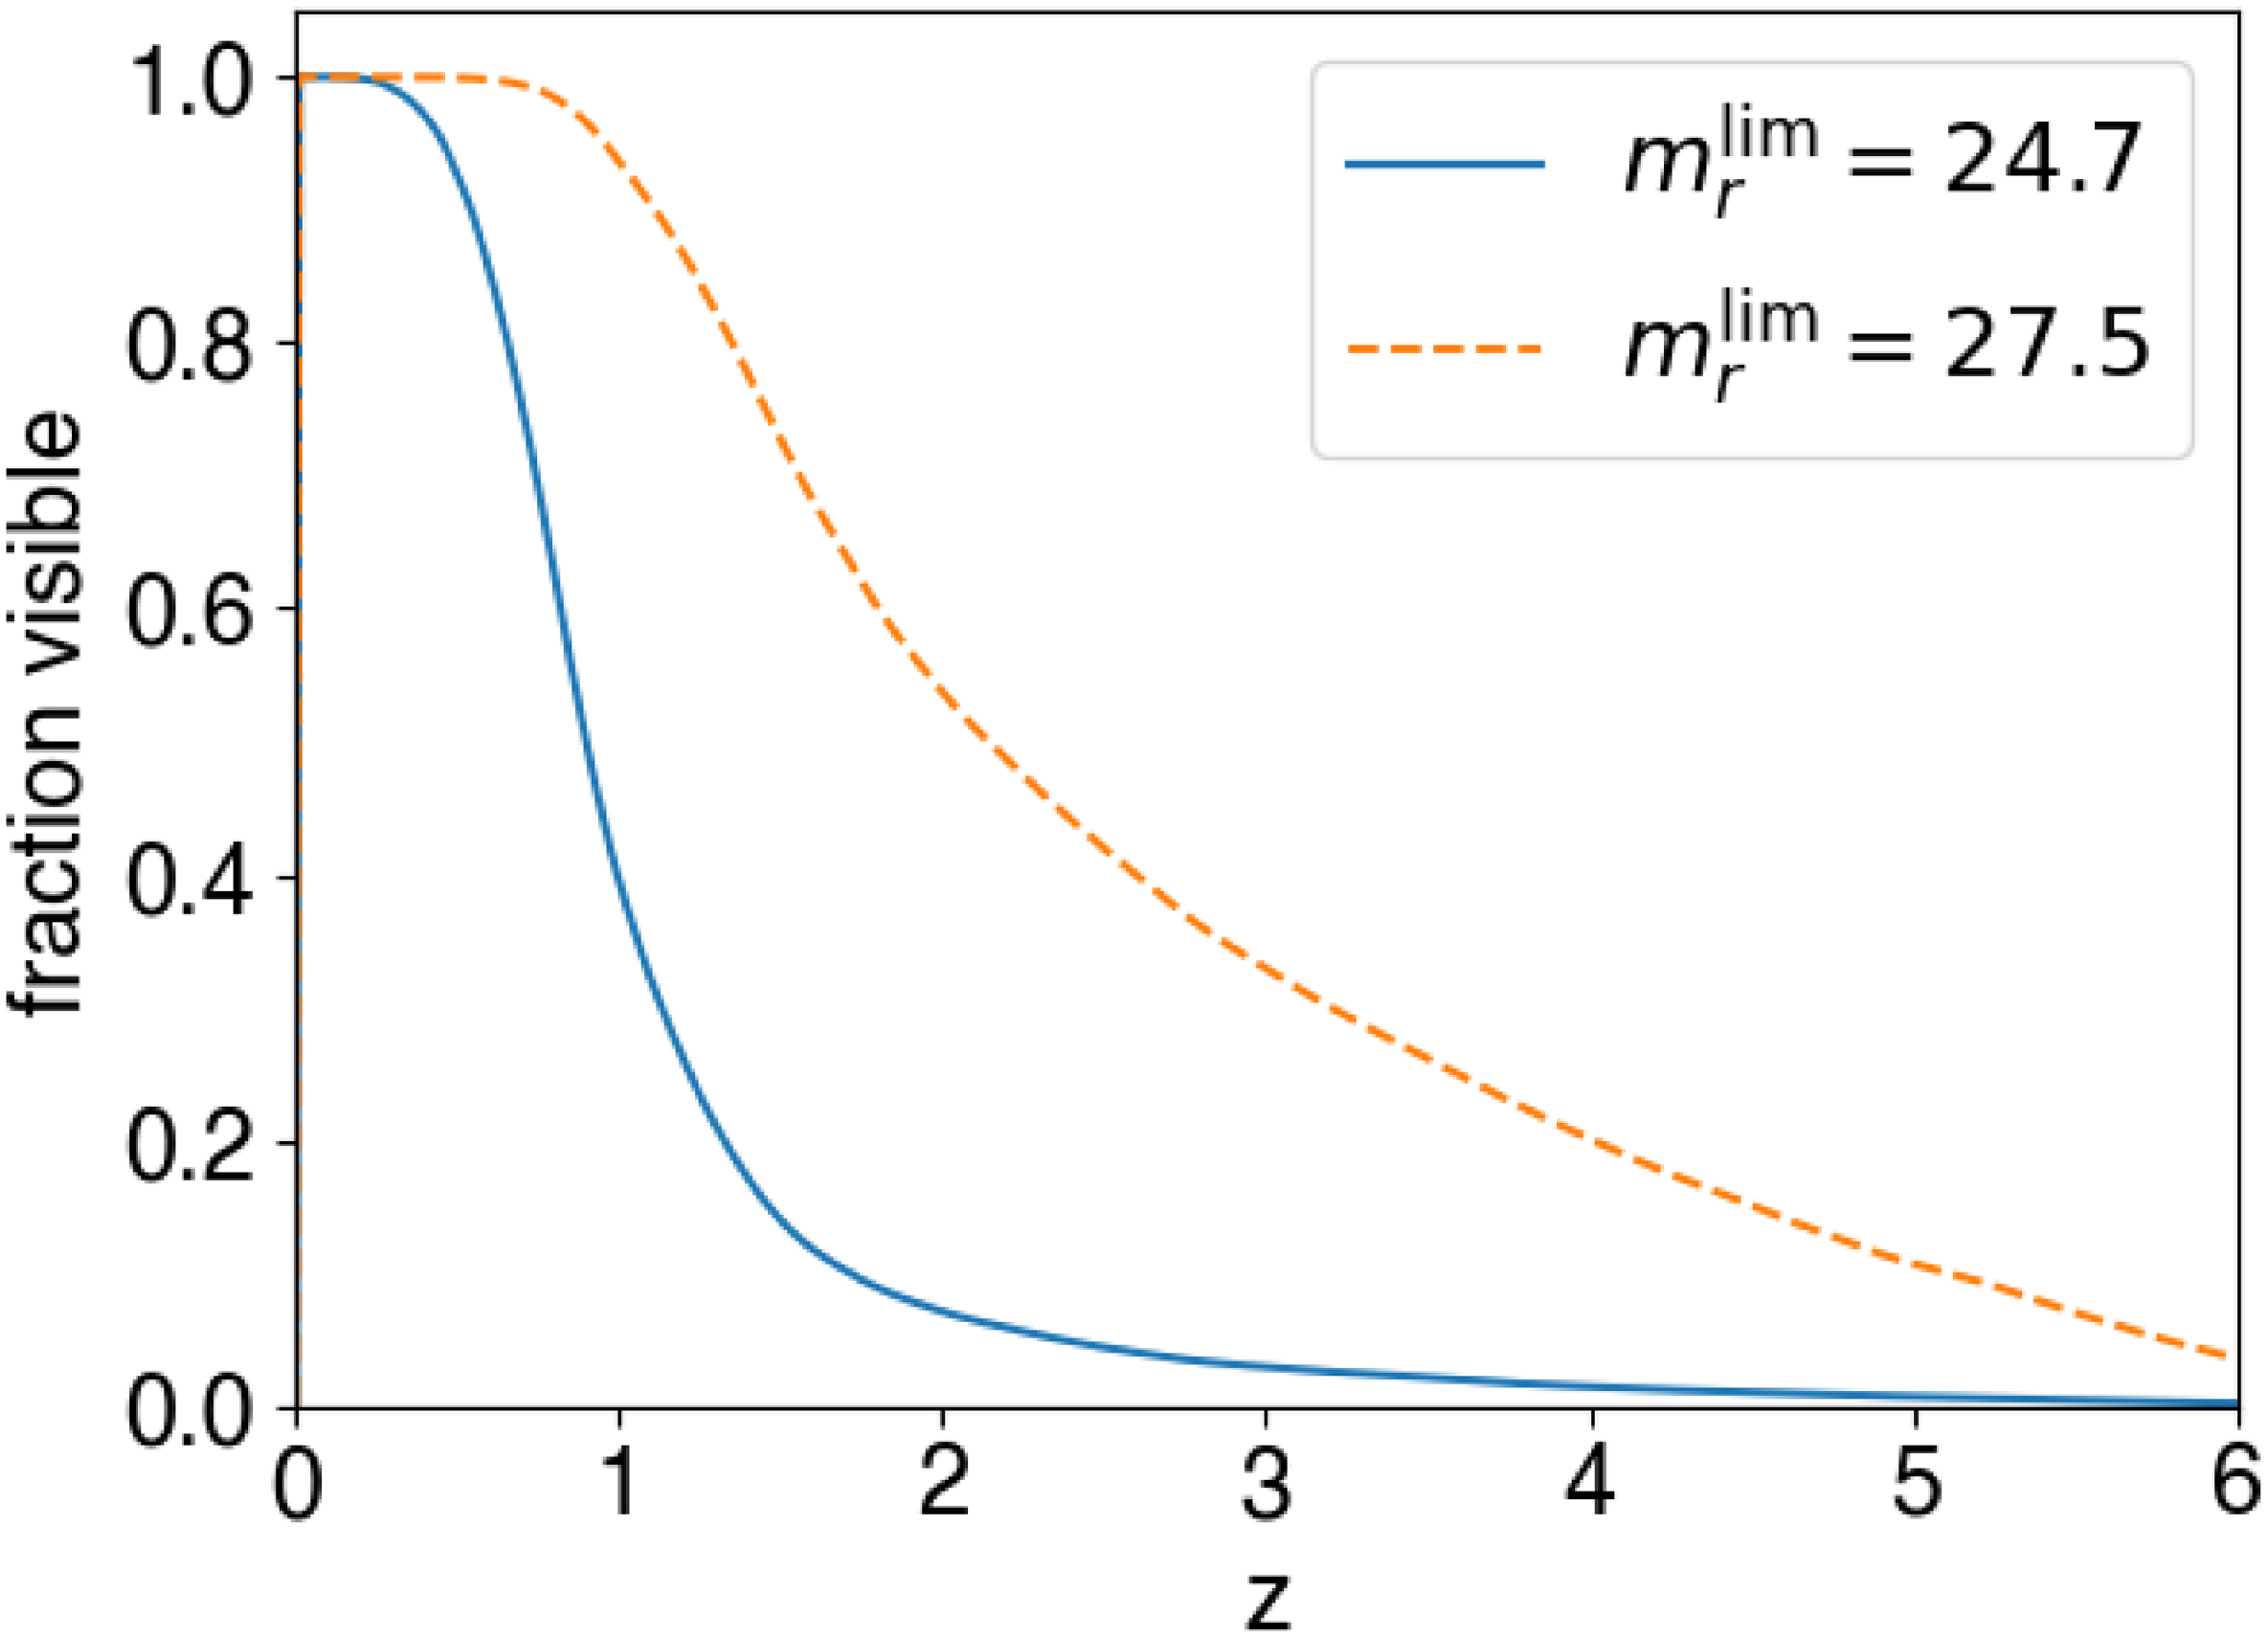

 mr=24.7
 mr=27.5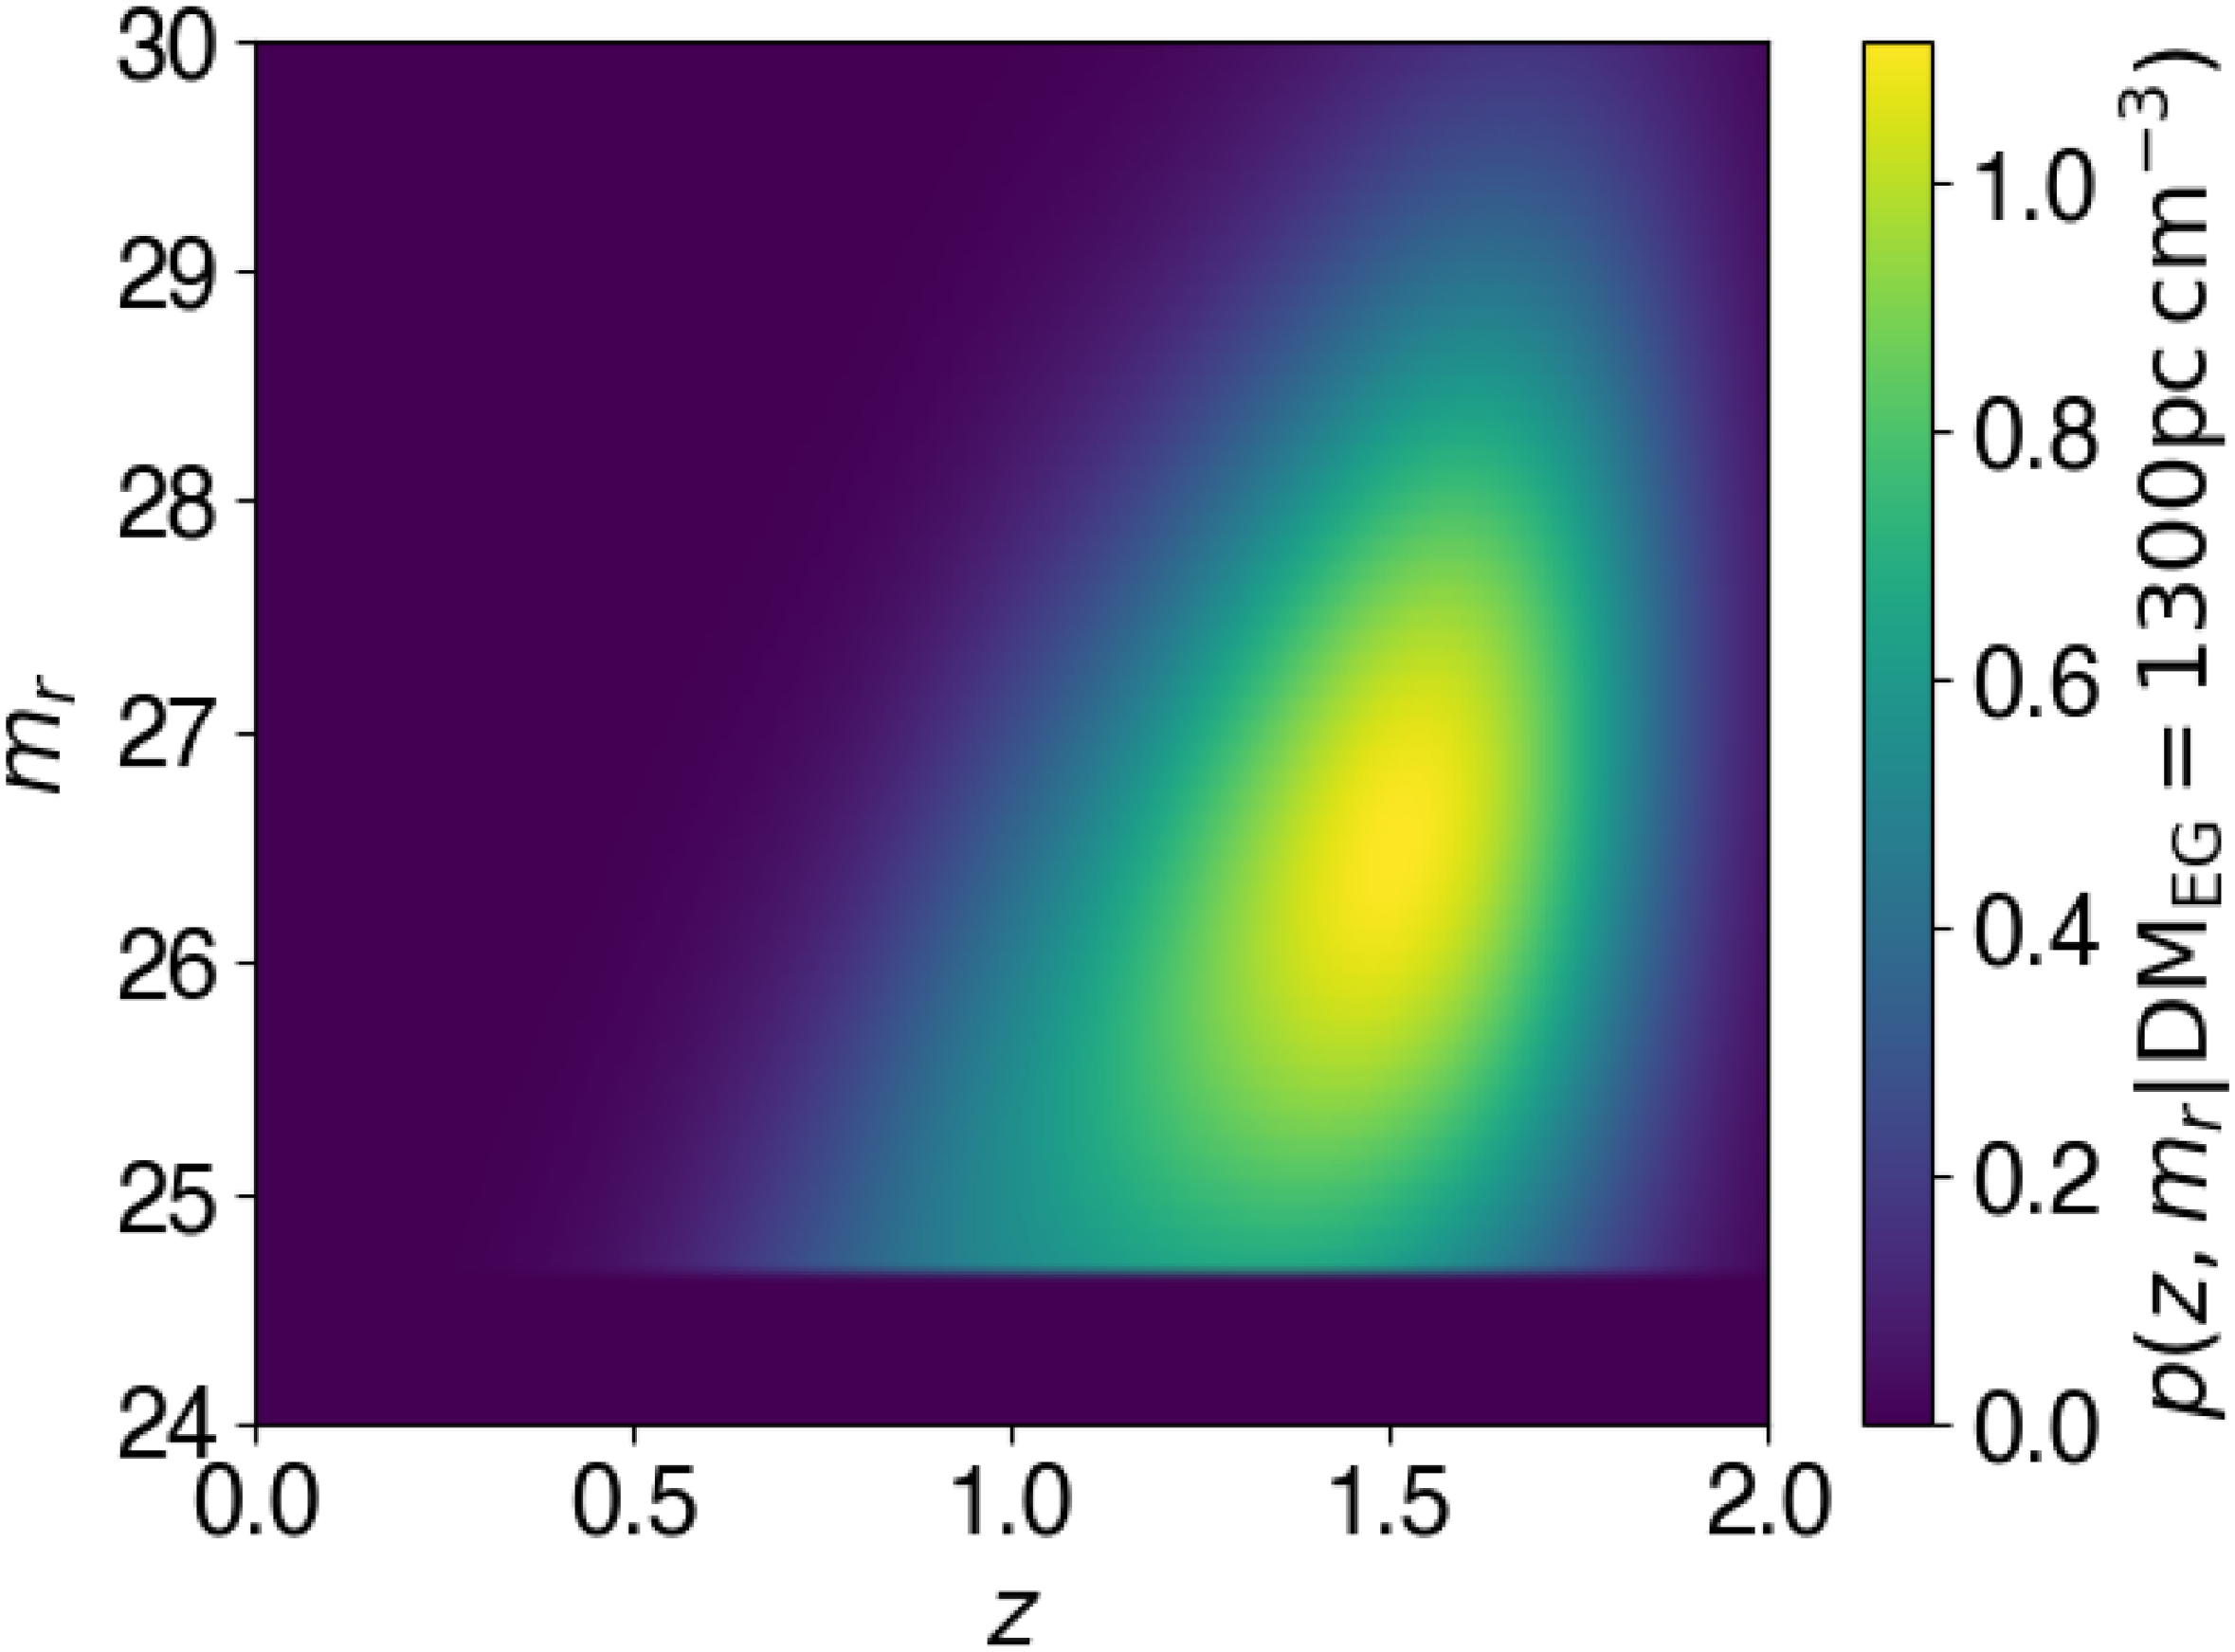
 P(z,mr|DMEG=1300pccm−3)
 24.7
24.7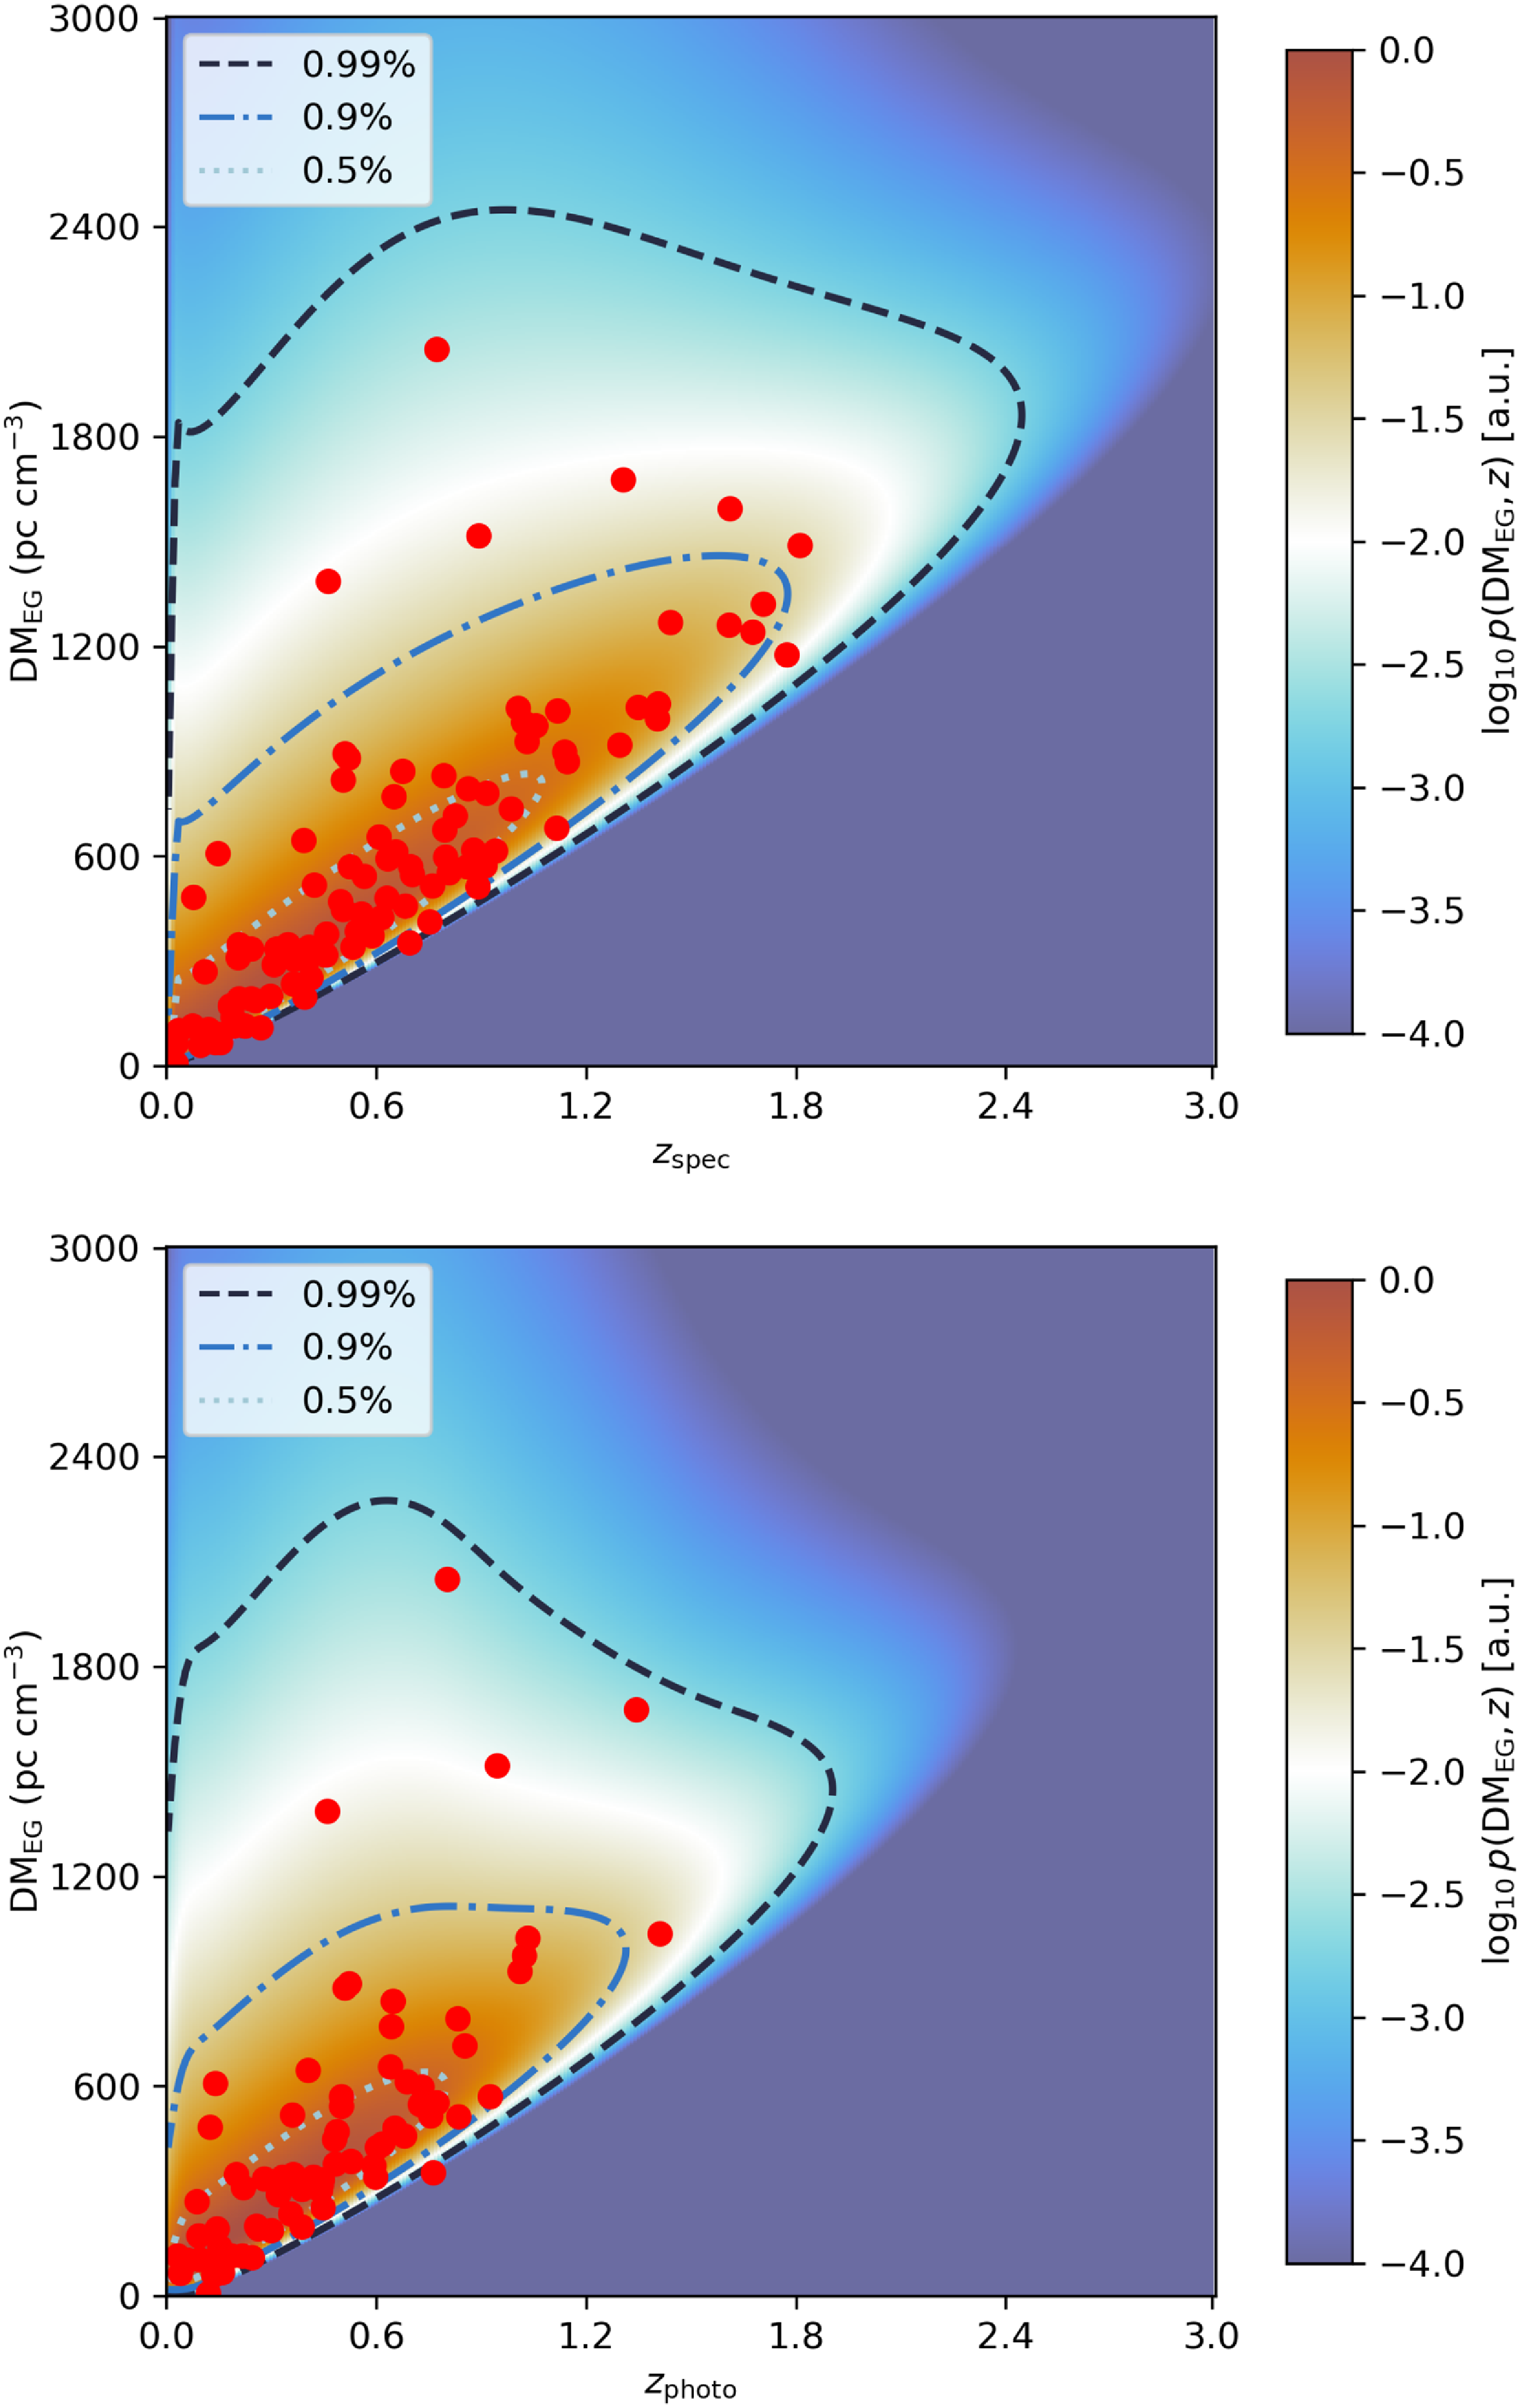
 σz
σz mrlim
mrlim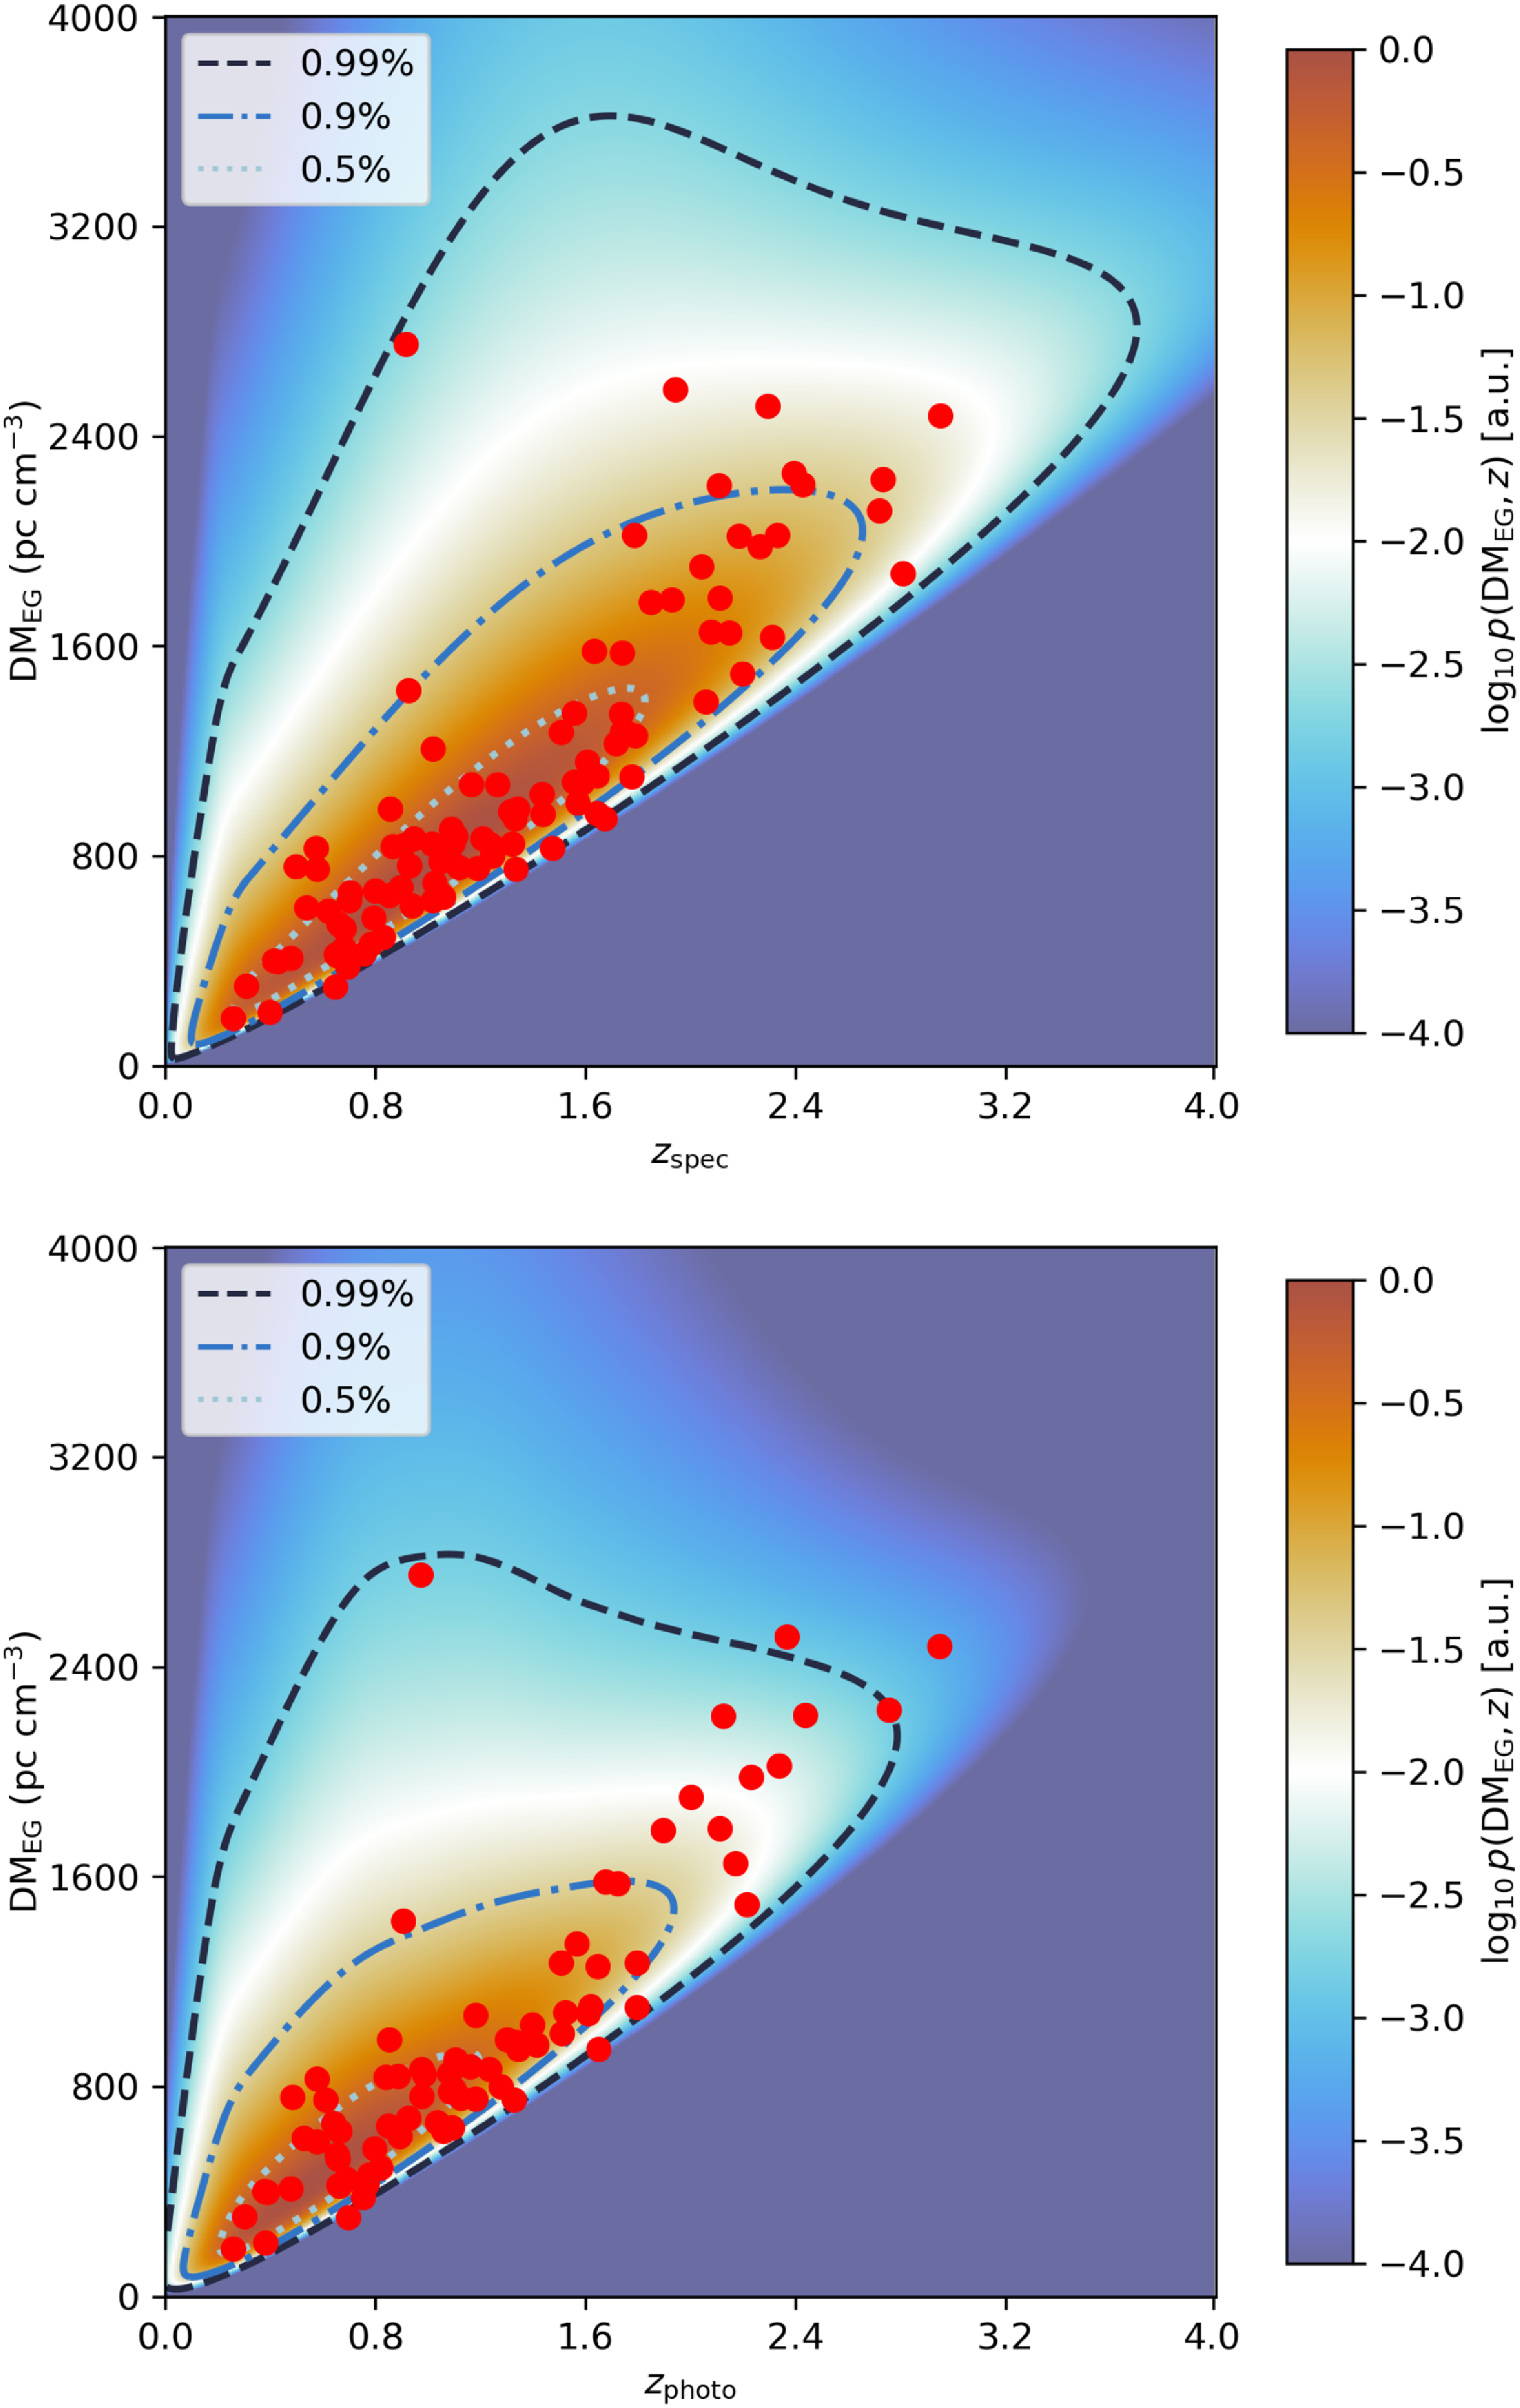
 mrlim=27.5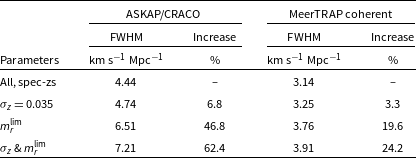
 H0
H0 σz=0.035
 mrlim
mrlim 24.7
24.7 27.5
27.5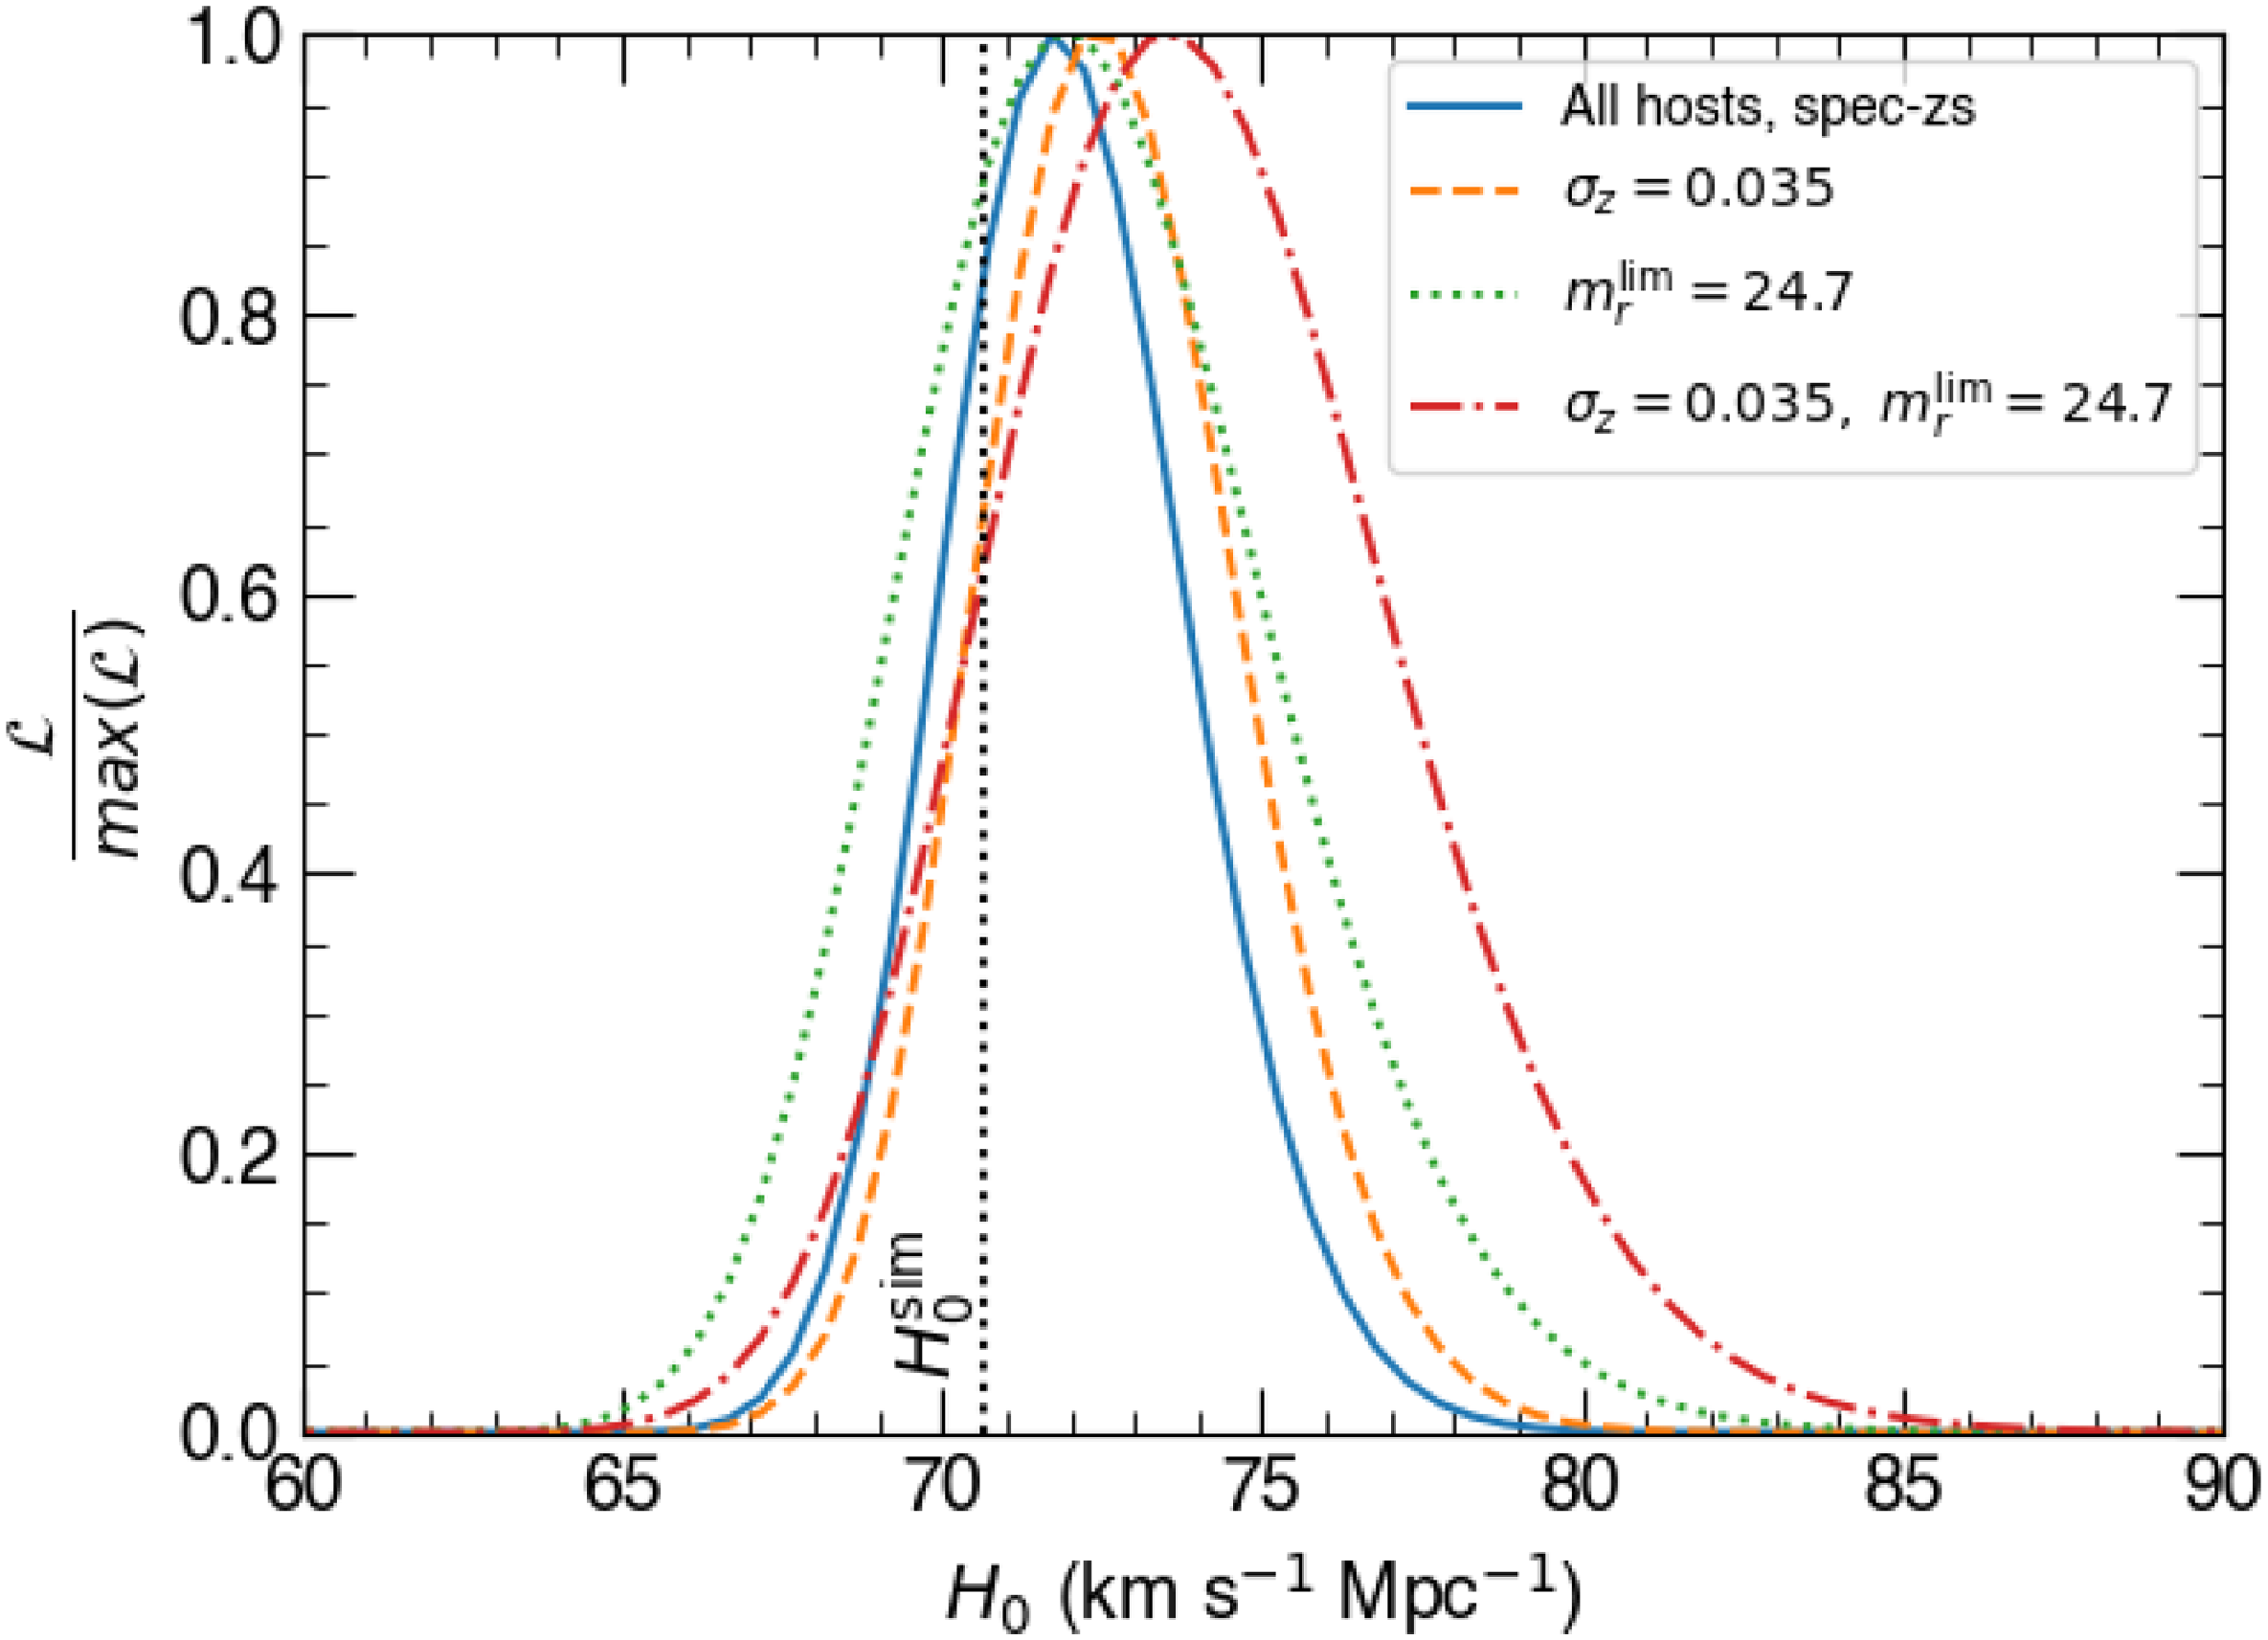
 H0
H0 σz=0.035
 mrlim=24.7
 Open access

