


1. Introduction
The defence mechanisms against pathogens and parasites can be divided into two categories: resistance and tolerance. Resistance is the host trait that reduces the probability of infection or reduces the growth of the pathogen population within a host, both factors reducing pathogen burden within a host individual. Tolerance is defined as the ability of the host to limit the impact of a given pathogen burden on host health, performance and ultimately on fitness (Painter, Reference Painter1958; Simms & Triplett, Reference Simms and Triplett1994). In farm animal science, tolerance is sometimes termed resilience (Clunies-Ross, Reference Clunies-Ross1932; Albers et al., Reference Albers, Gray, Piper, Barker, Le Jambre and Barger1987; Bisset & Morris, Reference Bisset and Morris1996). Resistance and tolerance together define a host's defensive capacity, yet they have very different influences on host−pathogen interactions. Increased host resistance typically induces selection pressure on a pathogen to overcome the resistance mechanisms, causing a continuous arms race between the host and the pathogen. In contrast, increased tolerance makes the pathogen harmless to the host reducing selection imposed on the pathogen. This reduces the arms race co-evolution and may provide an efficient alternative in the fight against pathogens (Mauricio et al., Reference Mauricio, Rausher and Burdick1997; Rausher, Reference Rausher2001; Bishop & MacKenzie, Reference Bishop and MacKenzie2003; Best et al., Reference Best, White and Boots2008). Accordingly, tolerance–resistance genetics is a fundamental component contributing to host−pathogen co-evolution and to practical plant and farm animal production.
Tolerance may be defined as a change in host performance in response to increasing pathogen burden (Simms, Reference Simms2000). Thus, measuring tolerance follows the methodology of the analysis of reaction norms (Via & Lande, Reference Via and Lande1985). Analysing tolerance as a change in host performance from before to after pathogen attack, an approach sometimes applied for ‘resilience’ analysis (Bisset & Morris, Reference Bisset and Morris1996), is unjustified because it includes both natural temporal variation in host performance (e.g. in growth curves) and impact of pathogen burden on host performance. Genetic variance in tolerance can be estimated as genetic variance in regression slopes of host performance along a gradient of increasing pathogen burden (Simms & Triplett, Reference Simms and Triplett1994; Mauricio et al., Reference Mauricio, Rausher and Burdick1997; Simms, Reference Simms2000). Furthermore, a degree of genetic cost of tolerance can be measured as a genetic correlation between tolerance slope and host performance in a pathogen-free environment (i.e. the intercept of the pathogen burden–host performance relationship). A genetic trade-off between the slope and intercept has been suggested to be one potential reason for the maintenance of genetic variation in tolerance (Rausher, Reference Rausher1996; Agrawal et al., Reference Agrawal, Strauss and Stout1999; Tiffin & Rausher, Reference Tiffin and Rausher1999).
Studies on tolerance genetics typically use an analysis of covariance (ANCOVA) to test for genetic variation in tolerance, where a significant F-test for family-by-pathogen burden interaction implies genetic variation for tolerance slopes (Simms & Triplett, Reference Simms and Triplett1994; Mauricio et al., Reference Mauricio, Rausher and Burdick1997; Koskela et al., Reference Koskela, Puustinen, Salonen and Mutikainen2002; Råberg et al., Reference Råberg, Sim and Read2007). Furthermore, genetic relationships between tolerance and other traits are often estimated using correlations between family means for each trait. Family−mean correlations are typically downward-biased estimates of the true genetic correlations (Astles et al., Reference Astles, Moore and Preziosi2006). Thus, these approaches tend to produce biased estimates of genetic variances and genetic correlations for tolerance.
Random regressions allow sophisticated genetic analysis of traits defined as functions (Henderson, Reference Henderson1982; Kirkpatrick et al., Reference Kirkpatrick, Lofsvold and Bulmer1990; Meyer & Hill, Reference Meyer and Hill1997; Schaeffer, Reference Schaeffer2004). Random regressions have been applied to genetic analysis of growth curves, lactation curves and reaction norms in farm animal breeding (Henderson, Reference Henderson1982; Schaeffer, Reference Schaeffer2004), and also more recently in evolutionary genetics (e.g. Kingsolver et al., Reference Kingsolver, Ragland and Shlichta2004). When combined with pedigree information, random regression models allow the estimation of genetic variances for the regression coefficients and of genetic correlations with other traits. Moreover, regression coefficients combined with covariance functions (Kirkpatrick et al., Reference Kirkpatrick, Lofsvold and Bulmer1990) provide a potential novel means to estimate the degree to which pathogen infection induces changes in genetic variance of host performance.
Here I assessed the potential of random regressions for the genetic analysis of tolerance when a host population is under natural pathogen infection. This was done because a significant part of datasets from animal breeding programmes and wild populations come from field studies where natural infections with pathogens, parasitoids or production diseases occur. A simulation was conducted to study the effect of alternative data structures on bias and precision of (1) genetic variance of tolerance slope, (2) estimated breeding values (BVs), (3) genetic correlation between tolerance slope and intercept and (4) genetic variance in host performance along a pathogen burden gradient.
Two challenges likely to be encountered when analysing data from natural infection were considered. Firstly, genetic analysis of tolerance uses within-family information (full-sib and half-sibs, and more distant relatives) to estimate a family's tolerance slope. Thus, family size is a crucial parameter influencing estimation accuracy. Secondly, with natural infection individuals are not randomly allocated to control and infection treatments, as in a controlled experiment. For instance, under natural infection the individuals with the lowest performance (fitness, growth and reproduction) due to environmental or genetic factors may innately also have either the lowest pathogen burden (i.e. the highest resistance) or the highest pathogen burden. Accordingly, estimates of tolerance variance can become biased if pathogen burden within an individual and measures of host performance are innately related.
2. Materials and methods
(i) Terminology used
From hereon, pathogen burden is used as a general term to refer to a pathogen load of an individual, for instance, number or biomass of ecto- or endoparasites, number of pathogens in a blood sample and in plants the number of herbivores or percentage leaf area lost to herbivores. Thus, pathogen burden is the inverse of resistance against infections, parasitoids or production diseases. In a random regression model, pathogen burden of individuals is on the x-axis and varies from zero upwards. Host performance refers to a host's trait value such as growth, reproduction performance or ultimately fitness. Tolerance is the slope of host performance when regressed against individuals' own pathogen burden phenotypes (Simms, Reference Simms2000). The intercept refers to host performance in a pathogen-free environment (pathogen burden and thus x-axis value is zero). Alternatively, the intercept can be interpreted as initial host performance before infection (e.g. initial growth rate), and host performance under infection (corresponding to non-zero x-value) would be final host performance.
(ii) Simulation of data
Full-sib data with 100 families were simulated. Generation 1 consisted of 200 unrelated individuals, 100 sires and 100 dams. To estimate a family's tolerance slope, only within-family information was used. Similar designs are used e.g. in plant sciences, and sire models are common in animal breeding.
In generation 2, phenotypic values (p) of an individual for pathogen burden (PB), tolerance slope (b 1) and intercept (b 0) were simulated as the sum of genetic (a) and environmental effects (e) randomly sampled from a multi-trait distribution. A genetic value of an individual was simulated as the average of parents' genetic values (i.e. BVs) plus a Mendelian sampling term (ms):
![a \equals \left[ {\matrix{ {a_{b_{\setnum{0}} } } \cr {a_{b_{\setnum{1}} } } \cr {a_{\rm PB} } \cr} } \right]_{\rm offspring} \equals {1 \over 2}\left( {\left[ {\matrix{ {a_{b_{\setnum{0}} } } \cr {a_{b_{\setnum{1}} } } \cr {a_{\rm PB} } \cr} } \right]_{\rm sire} \plus \left[ {\matrix{ {a_{b_{\setnum{0}} } } \cr {a_{b_{\setnum{1}} } } \cr {a_{\rm PB} } \cr} } \right]_{\rm dam} } \right) \plus \left[ {\matrix{ {{\rm ms}_{b_{\setnum{0}} } } \cr {{\rm ms}_{b_{\setnum{1}} } } \cr {{\rm ms}_{\rm PB} } \cr} } \right]\comma](https://static.cambridge.org/binary/version/id/urn:cambridge.org:id:binary:20160920235906199-0920:S0016672311000176:S0016672311000176_eqnU1.gif?pub-status=live)
where
![{\rm Var}\lpar a\rpar \equals \left[ {\matrix{ {\sigma _{a\lpar b_{\setnum{0}} \rpar }^{\setnum{2}} } \tab {\sigma _{a\lpar b_{\setnum{0}} b_{\setnum{1}} \rpar } } \tab {\sigma _{a\lpar b_{\setnum{0}} {\rm PB}\rpar } } \cr {} \tab {\sigma _{a\lpar b_{\setnum{1}} \rpar }^{\setnum{2}} } \tab {\sigma _{a\lpar b_{\setnum{1}} {\rm PB}\rpar } } \cr {\rm sym} \tab {} \tab {\sigma _{a\lpar {\rm PB}\rpar }^{\setnum{2}} } \cr} } \right]\comma \quad {\rm ms} \equals \left[ {\matrix{ {{\rm ms}_{b_{\setnum{0}} } } \cr {{\rm ms}_{b\setnum{1}} } \cr {{\rm ms}_{\rm PB} } \cr} } \right],](https://static.cambridge.org/binary/version/id/urn:cambridge.org:id:binary:20160920235906199-0920:S0016672311000176:S0016672311000176_eqnU2.gif?pub-status=live)
var(ms)=1/2 Var(a), and σ2 a and σa are genetic variances and covariances, respectively. Environmental effects and their variances (σ2 e ) and covariances (σe) were defined as
![e \equals \left[ {\matrix{ {e_{b_{\setnum{0}} } } \cr {e_{b_{\setnum{1}} } } \cr {e_{\rm PB} } \cr} } \right]\,{\rm with}\,{\rm Var\lpar }e{\rm \rpar \equals }\left[ {\matrix{ {\sigma _{e\lpar b_{\setnum{0}} \rpar }^{\setnum{2}} } \tab {\sigma _{e\lpar b_{\setnum{0}} b_{\setnum{1}} \rpar } } \tab {\sigma _{e\lpar b_{\setnum{0}} {\rm PB}\rpar } } \cr {} \tab {\sigma _{e\lpar b_{\setnum{1}} \rpar }^{\setnum{2}} } \tab {\sigma _{e \lpar b_{\setnum{1}} {\rm PB}\rpar }} \cr {\rm sym} \tab {} \tab {\sigma _{e\lpar {\rm PB}\rpar }^{\setnum{2}} } \cr} } \right].](https://static.cambridge.org/binary/version/id/urn:cambridge.org:id:binary:20160920235906199-0920:S0016672311000176:S0016672311000176_eqnU3.gif?pub-status=live)
A phenotypic value of host performance (yi
) of an individual i at its own pathogen burden phenotype was calculated as 
The simulated data were based on observations from studies on tolerance and resistance genetics in plants and animals (Mauricio et al., Reference Mauricio, Rausher and Burdick1997; Simms, Reference Simms2000; Koskela et al., Reference Koskela, Puustinen, Salonen and Mutikainen2002; Råberg et al., Reference Råberg, Sim and Read2007; Read et al., Reference Read, Graham and Råberg2008; Schneider & Ayres, Reference Schneider and Ayres2008; Kuukka-Anttila et al., Reference Kuukka-Anttila, Peuhkuri, Kolari, Paananen and Kause2010). In these papers, the relation between pathogen burden and host performance is typically observed to be linear, but non-linear responses are also realistic (see Discussion for the implications of the model assumptions). Heritability (h 2) and phenotypic variance (σ2 p ) of slope were varied because of a lack of data in the literature.
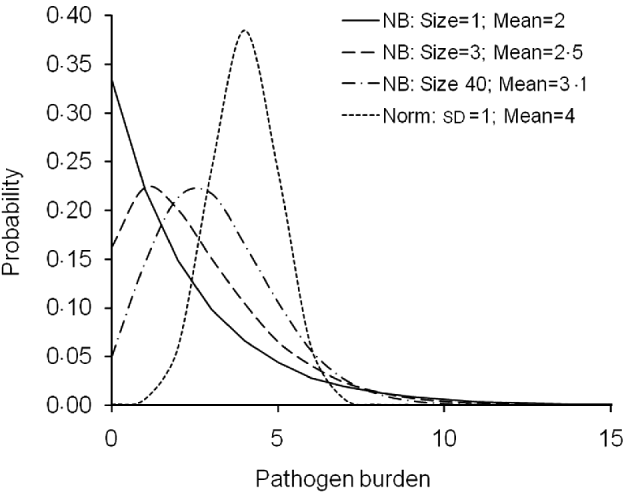
For pathogen burden, both normal and negative binomial distribution scenarios were simulated (Fig. 1). The normal distribution covers burden traits that are normally distributed at least after a transformation, such as log-normally and normally distributed pathogen/parasite counts, production diseases such as mastitis in dairy cows or ascites measured as a heart ratio in broilers (Green et al., Reference Green, Green, Schukken, Bradley, Peeler, Barkema, de Haas, Collis and Medley2004; Zerehdaran et al., Reference Zerehdaran, van Grevehof, van der Waaij and Bovenhuis2006; Kuukka-Anttila et al., Reference Kuukka-Anttila, Peuhkuri, Kolari, Paananen and Kause2010). The negative binomial distribution, in turn, is perhaps the most widely used distribution to describe empirical parasite/parasitoid burdens (Stear et al., Reference Stear, Bairden, Duncan, Gettinby, McKellar, Murray and Wallace1995).
Probability mass functions of the simulated pathogen burden distributions. For negative binomial (NB) and normal (Norm) distributions, alternative distributions were obtained by varying dispersion parameter (size), trait mean (Mean) and standard deviation (SD).
For the normally distributed pathogen burden, genetic and environmental effects were randomly sampled from ~N(4, 0·3) and ~N(4,0·7), respectively. Therefore, h 2 value of 0·3 was simulated. Pathogen burden with h 2 of 0·05 was also simulated but not reported here because the conclusions did not differ from the h 2=0·3 alternative.
Negative binomial distribution of pathogen burden was simulated following the logic of simulating a threshold trait with an underlying normally distributed liability scale. Normally distributed pathogen burden was first simulated, as described above, and then the resulting phenotypic values were transformed to a negative binomial distribution using a link function (R Development Core Team, 2008). Alternative negative binomial distributions including very skewed ones were simulated by changing the pathogen burden mean and the parameter ‘size’ (Fig. 1). Size is a dispersion parameter for the shape of the gamma-mixing distribution (R Development Core Team, 2008). The alternative parameters used for negative binomial distributions were: size=1 and mean=2 (with sd=2·45); size=3 and mean=2·5 (sd=2·14); size=40 and mean=3·1 (sd=1·83) (Fig. 1).
For intercept, genetic and environmental effects were randomly sampled from ~N(100, 120) and ~N(100, 280), respectively, corresponding to a phenotypic coefficient of variation (CVP) of 20% and a h 2 of 0·3 for host performance in a pathogen-free environment. This represents a normal growth-related trait.
For the tolerance slope, a fixed mean of zero was always used, and a phenotypic variance (σ2 p ) of 30 was simulated, but alternative h 2 value scenarios were applied (see below). In the base scenario, environmental and genetic correlations between pathogen burden, slope and intercept were all simulated to be zero.
The simulated values for slope and pathogen burden (both normal and negative binomial distribution) correspond to a CVP of 30% for host performance under pathogen burden, but phenotypic variance increased with increasing pathogen burden. The increased variance is natural because with increasing pathogen burden the tolerance slopes diverge more and more from each other. For slope h 2 of 0·3, host performance h 2 remains constant at 0·3 along the parasite burden gradient. For slope h 2 of 0·05, host performance h 2 is reduced from 0·30 at pathogen-free environment to 0·10 at pathogen burden of 8. For the normally distributed pathogen burden, scenarios with CVP of 25% or 22% for host performance under pathogen burden were also simulated to assess the effect of the increased variance assumption on the results. These were obtained by reducing the slope σ2 p from the original 30 to 15 and 5, respectively.
The simulation was repeated 500 times for each alternative scenario.
(iii) Alternative scenarios studied
The alternative scenarios simulated are summarized in Table 1. Firstly, the effect of family size was assessed. Family size was set to 10, 30, 50, 100 or 200. Given a fixed number of 100 families, population size hence ranged from 1000 up to 20 000. For the normally distributed pathogen burden, scenarios with low and high heritabilities for slope (h 2=0·05 and 0·3, respectively) were simulated by randomly sampling genetic and environment effects of tolerance slope from ~N(0, 30×h 2) and ~N(0, 30×(1−h 2)), respectively. For the negative binomially distributed pathogen burden, only slope h 2 of 0·3 was simulated.
A summary of simulated scenarios
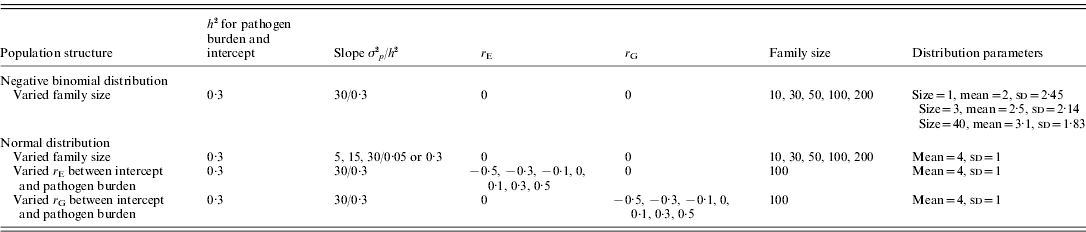
σ2 p, phenotypic variance; h 2, heritability; r E, environmental correlation; r G, genetic correlation.
For the remaining scenarios, normally distributed pathogen burden, family size of 100, population size of 10 000 and tolerance slope h 2 of 0·3 were simulated.
Secondly, the effect of non-zero environmental (r E) and genetic correlation (r G) between intercept and pathogen burden was assessed. The correlations were simulated, separately for r E and r G, to be either −0·5, −0·3, −0·1, 0, 0·1, 0·3 or 0·5 (Table 1). A negative correlation means that low host performance in a pathogen-free environment is related to high pathogen burden.
(iv) Genetic analysis of simulated data
In the genetic analysis, phenotypic data from generation 2 individuals were used. The phenotypic values of pathogen burden and performance value at that burden were analysed. Thus, each individual had only one host performance observation. ASReml software (Gilmour et al., Reference Gilmour, Gogel, Cullis and Thompson2006) was used to fit a full-sib random regression model:

where yij is host performance of an individual i from family j at its pathogen burden, μ is the population mean, b 0j is the random genetic effect of intercept for a family j, b 1j is the random genetic effect of regression slope for a family j, PB ij is pathogen burden of an individual i from family j and ε ij is the random error term. This is a mixed model similar to ANCOVA, the only difference being that the regression terms are now random factors. To avoid heterogeneous error variance inflating genetic variance in slope (Lillehammer et al., Reference Lillehammer, Ødegård and Meuwissen2009), residual variance was estimated within six pathogen burden classes along the x-axis. The six classes were defined as: pathogen burden <2, 2–3, 3–4, 4–5, 5–6 and >6. Genetic correlation between slope and intercept was constrained to be between 0·99 and −0·99.
When non-zero environmental or genetic correlation between intercept and pathogen burden was simulated, an additional genetic model was used to correct for the potential bias. In this case, the phenotypic values of host performance in a pathogen-free environment were added as a regression term (covariate) in the model (1).
These models resulted in estimated genetic variances and EBVs for slope and intercept, genetic correlation between slope and intercept, and six separate error variances along the x-axis. Genetic variance was calculated as two times the full-sib family variance. Because each individual has one observation for the reaction norm, residual variance of slope cannot be estimated, although it was originally simulated into the data. Accuracy (r IH) of EBVs was calculated as a Pearson correlation coefficient between true BVs and EBVs of the families (n=100 families).
The genetic variance in host performance as a function of pathogen burden was calculated as x′PB Gx PB (Kolmodin & Bijma, Reference Kolmodin and Bijma2004), where
![G \equals \left[ {\matrix{ {\sigma _{a\lpar b_{\setnum{0}} \rpar }^{\setnum{2}} } \tab {\sigma _{a\lpar b_{\setnum{0}} \comma b_{\setnum{1}} \rpar } } \cr {\sigma _{a\lpar b_{\setnum{0}} \comma b_{\setnum{1}} \rpar } } \tab {\sigma _{a\lpar b_{\setnum{1}} \rpar }^{\setnum{2}} } \cr} } \right].](https://static.cambridge.org/binary/version/id/urn:cambridge.org:id:binary:20160920235906199-0920:S0016672311000176:S0016672311000176_eqnU5.gif?pub-status=live)
The term x PB is a vector [1 burden]′ in which burden refers to a pathogen burden value on the x-axis. The use of covariance function is demonstrated only for the normally distributed pathogen burden scenario with varied family size and slope h 2 of 0·05.
For the varied family size scenario, a traditional normally distributed trait was also simulated as a control trait whose behaviour is well understood. Genetic and environmental effects were randomly sampled from ~N(100, 120) and ~N(100, 280), creating a trait similar to body weight with h 2 of 0·3 and CVP of 20%. The genetic model used to analyse the simulated data was: yij =μ+fam j +εij, where fam j is a random full-sib family effect used to estimate genetic variance and EBVs.
3. Results
(i) Effect of family size on estimates of slope genetic variance
For the normally distributed pathogen burden, small family size resulted in elevated estimates for tolerance genetic variance (Table 2). For instance, with family size of 10, estimated genetic variances for slope were 7·9 and 2·0 times higher than the simulated value in low- and high-slope h 2 scenarios, respectively. To obtain unbiased estimates for tolerance genetic variance, family sizes of 100 and 200 were needed for low- and high-slope h 2 scenarios, respectively (Table 2). For the negative binomial distribution of pathogen burden, the same pattern was observed but the upward bias was stronger at low family size (Table 3).
Estimated genetic parameters (±sd) for a scenario with normally distributed pathogen burden, varied family size (10–200) and two simulated tolerance slope heritabilities (0·05 and 0·3)
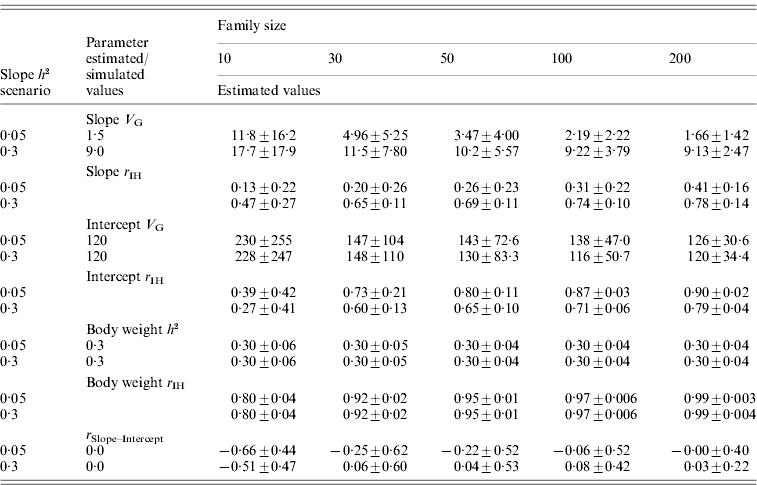
Heritability of pathogen burden, intercept and body weight were simulated to be 0·3.
Slope h 2 and Slope V G, slope heritability and slope genetic variance, respectively. Intercept V G, intercept genetic variance; Body weight h 2, heritability of body weight; r IH, correlation between the true and EBVs (i.e. accuracy); r Slope–Intercept, genetic correlation between slope and intercept.
Estimated genetic parameters (±sd) for a scenario with negative binomial pathogen burden distribution, varied family size (10–200), and tolerance slope heritability of 0·3
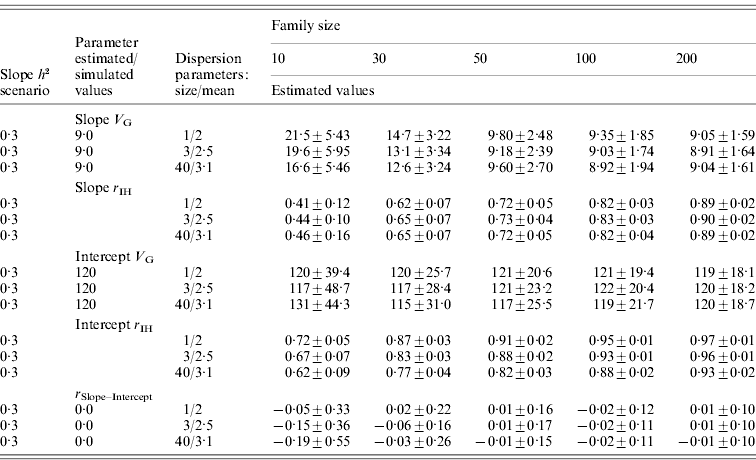
Heritability of pathogen burden and intercept were simulated to be 0·3.
Slope h 2 and Slope V G, slope heritability and slope genetic variance, respectively; Intercept V G, intercept genetic variance; r IH, correlation between the true and EBVs (i.e. accuracy); r Slope–Intercept, genetic correlation between slope and intercept.
For the normally distributed pathogen burden, accuracy of slope EBVs remained low in the low-slope h 2 scenario (r IH=0·13–0·41) but remained moderate to high in the high-slope h 2 scenario (r IH=0·47–0·78); accuracy increased with increasing family size in both cases (Table 2). For the negative binomial distribution of pathogen burden, the accuracies were of similar magnitude or higher (for the larger family sizes) than for the normally distributed pathogen burden scenarios (Table 3).
When CVP of 25% or 22% for host performance under the normally distributed pathogen burden was simulated, the bias for slope variance was even greater and accuracy for slope EBVs lower (results not shown) compared to the scenario with CVP of 30% (Table 2).
In contrast to slope variance, heritability for body weight, which served as a control trait, was estimated without bias even with the smallest family size of 10 (Table 2). Similarly, accuracy for body weight remained high at all family sizes, ranging from 0·80 at family size of 10 to 0·99 at family size of 200. This demonstrates that the estimation of genetic parameters for a slope is a challenge compared to a normal growth trait.
(ii) Effect of family size on estimates of intercept genetic variance
For the normally distributed pathogen burden, the intercept showed a pattern similar to the slope, but with higher average accuracies (r IH=0·27–0·90; Table 2). With family size of 10, estimated genetic variance for intercept was 1·9 times higher than simulated in both low- and high-slope h 2 scenarios. The accuracy of the intercept was higher for the low-slope h 2 scenario. This result can be explained by the fact that increased slope genetic variation makes intercept estimation more prone to errors. This can be demonstrated with mean square errors (MSE) of slope EBVs which quantify the overall estimation error of the EBVs. For slope h 2 of 0·05, MSE for slope EBVs was 2·07, 1·34, 1·07, 0·80 and 0·70 for family sizes of 10, 30, 50, 100 and 200. For slope h 2 of 0·3, MSE for slope EBVs were more than two times higher: 4·75, 3·17, 2·73, 2·18 and 1·82. When slopes were estimated with large absolute error (the scenario with slope h 2 of 0·3), the accuracy of the intercept estimates also declined.
For the negative binomial distribution of pathogen burden, accuracy of intercept estimates was higher (r IH=0·62–0·97; Table 3) than for the respective normally distributed pathogen burden scenarios (r IH=0·27–0·79; Table 2). This occurred because as the distribution is pushed to the left, more observations are close to the intercept (0, x-axis). Thus, with low family size intercept variance was only little or not at all biased (Table 3).
(iii) Effect of family size on estimates of host performance genetic variance
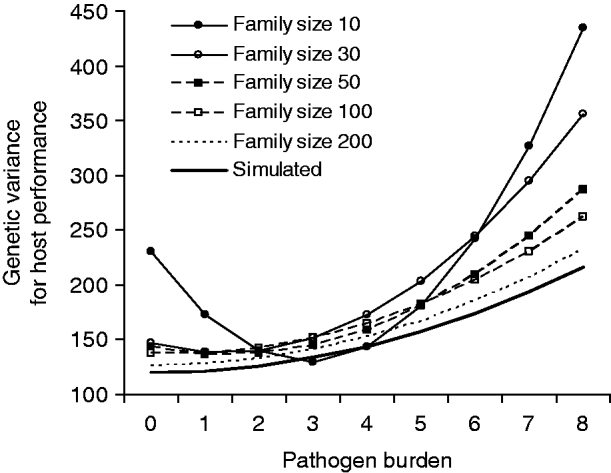
The bias in slope and intercept variances due to low family size led to upward-biased estimates for genetic variance in host performance along the pathogen burden gradient, especially at both ends of the burden spectrum (Fig. 2). Using the six separate environmental variances estimated along the pathogen burden, heritability of host performance can also be calculated. For instance, with slope h 2 of 0·05 and family size of 100, the estimated (simulated) host performance h 2 at pathogen burdens of 1·5, 2·5, 3·5, 4·5, 5·5 and 6·5 were 0·25 (0·26), 0·21 (0·22), 0·18 (0·18), 0·16 (0·15), 0·14 (0·13) and 0·12 (0·11), respectively, implying accurate estimation for large family sizes.
Genetic variance in host performance as a function of pathogen burden. The bold line shows the simulated values, and the other lines are estimates for alternative family sizes predicted by a covariance function using the estimated genetic (co)variances of tolerance slope and intercept (Table 2). Simulated slope h 2 was 0·05.
(iv) Environmental correlation between pathogen burden and host performance
When environmental correlation between pathogen burden and intercept was changed to be either negative or positive, estimated genetic variance for slope increased symmetrically (Table 4). For example, when environmental correlation was −0·5 (or 0·5), estimated genetic variance for slope was 15·6 times higher than the simulated value. This occurred because pathogen burden was non-randomly distributed within a family, and a part of the initial variation in host performance was translated to tolerance variation.
Genetic parameters (±sd) for a scenario with varied environmental correlation (r E) between pathogen burden and intercept estimated with a statistical model either including or excluding host performance in a pathogen-free environment as a covariate
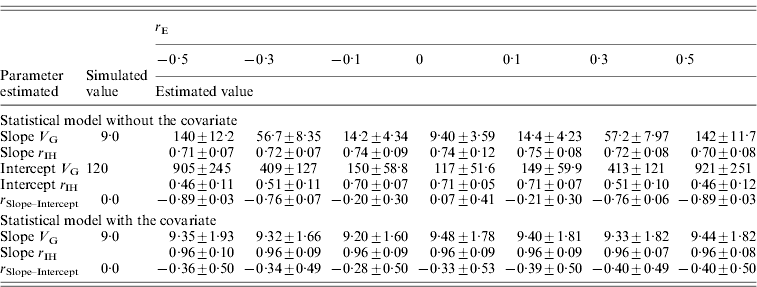
Family size is 100, heritability of pathogen burden, slope and intercept were simulated to be 0·3, genetic correlation between slope and intercept simulated to be 0.
Slope V G, slope genetic variance; Intercept V G, intercept genetic variance; r IH, correlation between the true and EBVs (i.e. accuracy); r Slope–Intercept, genetic correlation between slope and intercept.
The accuracy of the tolerance slope remained high, decreasing only slightly from r IH=0·74 at simulated r E of 0·0 to r IH=0·70 at r E of 0·5 (Table 4). Thus, the family differences in slopes were increased (slope V G increased) but the consistency of the family slope EBVs with the true BVs remained unaffected. In contrast, the accuracy of the intercept decreased from 0·71 at simulated r E of 0·0 to r IH=0·46 at simulated r E of 0·5 (−0·5). Consequently, when family slopes were biased, the intercept EBVs became less consistent with the true BVs. Similar to the slope, increasing or decreasing environmental correlation elevated the estimated genetic variance for intercept (Table 4).
Genetic variance of slope was estimated without bias when host performance in a pathogen-free environment was included as a covariate in the statistical model (Table 4). Moreover, standard deviation of slope variance was reduced (sd=1·60–1·93) compared to the model without the covariate (for r E=0·0, sd=3·59). Similarly, the inclusion of host performance in a pathogen-free environment increased slope accuracy to 0·96 compared to the original 0·71 (Table 4). Accuracy increased because variation in initial host performance made an individual's performance along a pathogen burden axis deviate from its family's average regression line. Thus, including initial host performance did not just reduce bias but also decreased error variance around the family's slope.
The intercept results from the analysis where the covariate was included are not comparable to the simulated intercept values because the covariate removes a major part of the variance from the original simulated intercept. Thus, intercept variance ranged from 2·40 to 3·61 (results not shown) although the simulated value was 120.
(v) Genetic correlation between pathogen burden and host performance
The effect of genetic correlation between pathogen burden and intercept on estimated genetic variance for slope was similar but weaker (Table 5) than the effect of the respective environmental correlation (Table 4). For instance, with a genetic correlation of −0·5 (or 0·5), slope variance was overestimated by a factor of 1·8. Slope accuracy remained high for all r Gs tested, and intercept accuracy was only slightly reduced when r G deviated from zero. Again, using initial host performance as a covariate in the analysis corrected for the fact that pathogen burden was non-randomly distributed within families (Table 5).
Genetic parameters (±sd) for a scenario with varied genetic correlation (r G) between pathogen burden and intercept estimated with a statistical model either including or excluding host performance in pathogen-free environment as a covariate
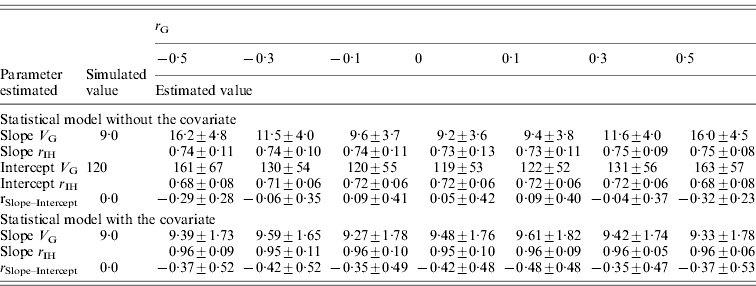
Family size is 100, heritability of pathogen burden, slope and intercept were simulated to be 0·3, environment correlation between slope and intercept simulated to be 0.
Slope V G, slope genetic variance; Intercept V G, intercept genetic variance; r IH, correlation between the true and EBVs (i.e. accuracy); r Slope–Intercept, genetic correlation between slope and intercept.
(vi) Cost of tolerance
In all the above scenarios, zero genetic correlation between intercept and slope was simulated. For the normally distributed pathogen burden, a decrease in family size led to strongly negative genetic correlation between slope and intercept (Table 2). For the negative binomial distribution of pathogen burden, the bias was smaller or almost non-existent when the distribution was much skewed to the right (size=1, mean=2; Table 3). Having observations close to the intercept prevented the intercept from becoming automatically biased by a bias in the slope.
Similarly, with increasing or decreasing environmental (Table 4) or genetic correlation (Table 5) between pathogen burden and performance in a pathogen-free environment, the genetic correlation between slope and intercept became highly negative. The negative correlation occurred because when the slope for a family was overestimated, the intercept for the family decreased (and vice versa). These results imply that the analyses falsely indicated a presence of a genetic trade-off (i.e. cost of tolerance).
When initial host performance was used as a covariance in the scenarios with either environmental or genetic correlation between pathogen burden and intercept, the genetic correlation between the slope and intercept was always moderately negative (range from −0·28 to −0·48; Tables 4 and 5). This downward bias is unfortunate because, on the one hand, genetic variance for the slope was correctly estimated, but on the other hand, the genetic correlation was not.
4. Discussion
(i) Random regression models
The results showed that random regression models can be successfully applied to estimate genetic parameters for tolerance, given suitable data structure. This permits unbiased estimation of genetic (co)variance for both slope (tolerance) and intercept (performance in a pathogen-free environment), which is not possible using the traditional ANCOVA approach. When each animal has several observations, e.g. before and after an infection, the model can include genetic, permanent environmental and environmental effects for the slope, allowing the estimation of heritability for tolerance. Furthermore, random regressions can be combined with covariance functions to calculate genetic variance and heritability for host performance at any point along the pathogen burden x-axis trajectory (Fig. 2). This provides a novel way to increase our understanding of infection-induced changes in genetic variance and evolutionary responses in life histories. Pathogen infections can indeed change heritabilities of performance traits, which then impact genetic responses to selection (e.g. Vehviläinen et al., Reference Vehviläinen, Kause, Quinton, Koskinen and Paananen2008; Lewis et al., Reference Lewis, Torremorell, Galina-Pantoja and Bishop2009). In contrast to pathogen-induced changes, changes in heritabilities due to other biotic (e.g. diet) and abiotic factors have been a focus of active research (Kause & Morin, Reference Kause and Morin2001; Charmantier & Garant, Reference Charmantier and Garant2005).
The focus here was on the analysis of field data, but the statistical method presented is applicable to experimental treatments as well. An experimental manipulation of pathogen burden level is preferred over a natural infection, because of the better control on experimental design.
A linear relationship between pathogen burden and reduction in host performance was simulated here. So far, the genetic analyses of tolerance/resistance to infections have assumed such a linear relationship (e.g. Mauricio et al., Reference Mauricio, Rausher and Burdick1997; Simms, Reference Simms2000; Koskela et al., Reference Koskela, Puustinen, Salonen and Mutikainen2002; Råberg et al., Reference Råberg, Sim and Read2007; Kuukka-Anttila et al., Reference Kuukka-Anttila, Peuhkuri, Kolari, Paananen and Kause2010). However, in reality, the relationship may be non-linear, for example, sigmoidal or plateau-linear. Such non-linear relationships can be analysed with random regressions using the same principles as for a linear regression (Kirkpatrick et al., Reference Kirkpatrick, Lofsvold and Bulmer1990; Schaeffer, Reference Schaeffer2004). Yet, non-linearity makes the tolerance analysis more challenging. Typically, large sample sizes are needed to prove that non-linear regressions fit the data better than the linear ones. Moreover, when reaction norms are non-linear, the position of a family along the pathogen burden x-axis impacts the estimated regression parameters of the family.
(ii) Experimental designs: family size
Tolerance slope is estimated within each family and thus family size is a crucial parameter influencing estimation accuracy. The results implied that decreasing family size leads to upward-biased genetic variance estimates for tolerance slope. With decreasing family size, it is increasingly difficult to accurately estimate the true slope of a family. When a small number of individuals are sampled for each family, the sample is no longer representative of the true distribution and single observations have strong impact on the slope estimate. For some families the slope is underestimated, for others overestimated, and thus genetic variance estimate for slope is artificially increased and selection accuracy decreased.
The family size needed for accurate slope estimation is specific for each dataset. Thus, general recommendations for appropriate sample sizes are difficult to provide.
Knap & Su (Reference Knap and Su2008) applied random regressions on pig litter size data to estimate genetic variance for slopes of reaction norms across North and Latin America, Europe, Asia and Australia. Consistent with our results, they observed that with decreasing sire family size from 146 to 43 (with the number of observations decreasing from 2 97 518 to 33 641), the sire reaction norms became less and less parallel increasing the estimated genetic variance for slopes. A similar result was observed in the simulation by Sae-Lim et al. (Reference Sae-Lim, Komen and Kause2010) who examined optimal population structures for estimating a genetic correlation between two environments, a measure of genotype-by-environment interaction. The smaller the family size in each environment, the less accurately were family means in each environment estimated, and thus the greater the artificially introduced variance for the genotype-by-environment interaction estimate (Sae-Lim et al., Reference Sae-Lim, Komen and Kause2010).
Our results also showed that for the normally distributed pathogen burden, genetic correlation between tolerance slope and intercept was biased downwards when family size was low. An upward (downward) bias in the slope of a family pushes the intercept downwards (upwards), creating an artificial negative genetic correlation. One solution for getting accurate intercept estimates is to have a larger group of uninfected individuals or to maintain a pathogen-free control treatment. Accordingly, the genetic correlation between tolerance slope and intercept was much less biased, or not biased at all, when the negative binomial distribution with pathogen burden observations aggregated around zero was used.
(iii) Experimental designs: correlation between pathogen burden and host performance
The results showed that when initial host performance was related to pathogen burden, indicated either as environmental or genetic correlation between intercept and pathogen burden, estimates for genetic variance for tolerance were upward biased, and an artificial negative genetic correlation between tolerance slope and intercept was easily obtained. It is well established that individuals with initially different growth or life-history trait levels may be differently exposed to infections, parasites and production diseases (Arendt, Reference Arendt1997; Rauw et al., Reference Rauw, Kanis, Noordhuizen-Stassen and Grommers1998; Moghadam et al., Reference Moghadam, McMillan, Chambers and Julian2001; Kause et al., Reference Kause, Ritola, Paananen, Wahlroos and Mäntysaari2005), confounding the cause-and-effect relation between pathogen burden and reduction in host performance in field datasets.
In full-sib and sire models, within-family variation that includes both Mendelian sampling term and environmental (co)variance is not specifically modelled. In an outbred population, the Mendelian sampling term is equal to half of the genetic (co)variance. Thus, half of the genetic covariance between pathogen burden and initial host performance is translated to within-family covariance, and the effect is similar for the respective environmental covariance; upward-biased genetic variance estimates for tolerance slopes appear.
One way of addressing this issue is to include initial host performance as a covariate in the statistical model. This is convenient for traits that can be repeatedly recorded from the same individuals, and for experimental data where timing and amount of pathogen challenge are known. However, in field data, initial host performance under conditions of no infection may be unknown, and individuals may not have experienced a pathogen infection for the same duration.
An eye fluke Diplostomum spp. (Helminth, Trematoda) infecting farmed rainbow trout Oncorhynchus mykiss (Walbaum) is a potential target for applying the method even when individuals are under field conditions. Diplostomum spp. impairs vision by causing cataracts in the lens of the fish eye, reducing fish growth (Kuukka-Anttila et al., Reference Kuukka-Anttila, Peuhkuri, Kolari, Paananen and Kause2010). Number of flukes within an eye (resistance) can be repeatedly counted on live fish using a portable slit-lamp microscope, and fish performance is easily repeatedly recorded from thousands of individuals (Kuukka-Anttila et al., Reference Kuukka-Anttila, Peuhkuri, Kolari, Paananen and Kause2010). The method can be potentially applied also in sheep-breeding programmes, in which the degree of intestinal nematode infection is recorded from faecal worm-egg counts. This can be done under natural infections or after experimentally infecting animals in the field (Albers et al., Reference Albers, Gray, Piper, Barker, Le Jambre and Barger1987; Woolaston & Windon, Reference Woolaston and Windon2001).
In plant–herbivore interaction studies with naturally occurring leaf damage, the concern has been that microenvironment that affects plant fitness can also affect herbivore density and thus amount of leaf damage experienced by the plant (Tiffin & Inouye, Reference Tiffin and Inouye2000). For example, if both plant fitness and herbivore abundance are greater in more sunny microclimates, then estimates of tolerance may be artificially inflated. Such microclimate effects are challenging to correct for in the statistical analysis.
However, in the present study, selection accuracy remained moderate for all the simulated correlation scenarios, confirming that artificial selection based on family slope EBVs would be effective means for genetic improvement. This is beneficial for practical breeding attempts. Currently the major pig, poultry, dairy cattle and aquaculture breeding programmes are not selecting for tolerance to infections or production diseases.
An additional recording challenge is that many pathogen-induced infections in animals are most easily recorded as binary traits (e.g. 0=healthy individual, 1=infected). Yet, it is likely that infected individuals differ in the degree of pathogen burden, or that some seemingly healthy individuals are in fact mildly infected, i.e. they have a subclinical infection. Coding a normally distributed burden as a binary trait can easily lead to over- or underestimation of slope genetic variance. This artefact occurs because in case of binary scale pathogen burden the x-axis scale for tolerance regression ranges from 0 to 1, and burden variance is always p(1−p), where p is prevalence of infected individuals. However, the real unrecorded continuous scale pathogen burden can have low or high variance depending on a disease, time and environment. Changing the x-axis scale while holding host performance observations unchanged artificially changes the steepness of tolerance slopes and thus alters slope variance.
Genetic variance for slopes becomes artificially underestimated when the liability scale variance in burden is low compared to the binary scale variance. This makes family slopes more parallel, reducing slope variance. In contrast, coding a liability scale burden with high variance to be a binary trait with lower variance makes family slopes artificially more diverged, creating overestimated slope genetic variance. For instance, x-axis scale can be changed from a range of ‘0 to 1000’ pathogens to ‘0 to 1’. In this way, tolerance slopes become artificially steeper with high genetic variance. Consequently, recording a normally distributed pathogen burden as a threshold trait is not a realistic way to obtain unbiased estimates for tolerance genetic variance.
In conclusion, sufficiently large family sizes, accurate pathogen burden recording and control over the relation between initial host performance and pathogen burden are needed for unbiased and precise genetic analysis of tolerance. These are challenges especially for field studies, but realistic designs can be obtained by means of carefully planned experimentation and data collection.
Two referees, Cheryl Quinton and the staff at the Animal Breeding and Genomics Centre are acknowledged for constructive comments. The study was funded by the Wageningen University and Research Centre.



