


1. Introduction
The aneutronic fusion reaction based on the synthesis of a proton with a Boron-11 nucleus [Reference Oliphant and Rutherford1–Reference Belyaev, Krainov, Matafonov and Zagreev3] has attracted the interest of both researchers and investors [4, 5]. Indeed, despite the lower cross section, the 11B(p, α)2α fusion reaction presents some non-negligible advantages with respect to the more studied deuterium-tritium one, such as the abundance of the reactant, the use of nonradioactive fuel, and the lack of neutrons as products. Even though fusion reactors based on p+11B reaction are still a long-term goal, the study of this process is relevant both for astrophysics research [Reference Clayton6] and for its possible employment as high brightness source of α particles for important applications, such as medicine [Reference Cirrone, Manti and Margarone7, Reference Giuffrida, Margarone, Cirrone, Picciotto, Cuttone and Korn8]. To trigger the reaction, two main schemes involving high energy and intensity lasers have been studied: the “in target” scheme [Reference Belyaev, Matafonov and Vinogradov2, Reference Margarone, Bonvalet and Giuffrida9–Reference Bonasera, Caruso and Strangio13], where a high-intensity laser pulse is focused on an hydrogenated boron target, and the “pitcher-catcher” scheme, where a beam of laser-accelerated protons is directed onto a boron target or a preformed boron plasma [Reference Labaune, Baccou and Depierreux14–Reference Ingenito, Andreoli, Batani, Torrisi and Cutroneo18]. Both geometries showed a progressive increment in the yield of p+11B fusion reactions along the experiments that were carried out during the last years [Reference Belyaev, Matafonov and Vinogradov2, Reference Picciotto, Margarone and Velyhan10, Reference Giuffrida, Belloni and Margarone11, Reference Labaune, Baccou and Depierreux14]. Nevertheless, aiming at further progresses in this field, the understanding of the process needs to be deepened. To pursuit this objective, a detailed characterization of the laser-matter interaction and of the fusion products must be achieved. Given the environment in which these experiments are conducted, the latter is anything but a simple task [Reference Consoli, De Angelis and Andreoli19]. Indeed, along with the fusion reactions, several other processes are triggered inducing electromagnetic ionizing radiation spanning over a broad spectrum, particle radiation, and radiofrequency-microwave emission [Reference Daido, Nishiuchi and Pirozhkov20–Reference Nelissen, Liszi and Marco22]. Hence, a non-negligible background is produced, hindering the detection of the fusion products characterized by a low yield. Moreover, the emitted electromagnetic pulses (EMPs) in the radiofrequency-microwave regime can lead to the malfunctioning of some of the deployed diagnostic systems, especially when located near the interaction point [Reference Consoli, Tikhonchuk and Bardon21, Reference De Marco, Volpe and Gatti23].
The diagnostic techniques commonly used in this field are solid state nuclear track detectors (SSNTDs) [Reference Szydlowski, Badziak and Fuchs24, Reference Baccou, Yahia and Depierreux25], time-of-flight method [Reference Cameron and Eggers26] and Thomson spectrometers [Reference Thomson27]. Each of these presents some specific advantages and drawbacks for this context [Reference Consoli, De Angelis and Andreoli19].
In the SSNTD, the impinging radiation damages the film in localized spots and an etching procedure is used to reveal the tracks. A detailed analysis of the track characteristics allows to infer information on the impinging radiation [Reference Ingenito, Andreoli, Batani, Torrisi and Cutroneo18, Reference Séguin, Frenje and Li28, Reference Fews and Henshaw29]. However, the background due to the detection of all other emitted radiation produced during the laser-matter interaction hinders the effective discrimination of α particles. Thus, the film is usually covered by a thin plastic or metal foil to cut the contribution of low energy and heavy ions while allowing for α-particle detection. Nevertheless, protons are more penetrant than alphas; hence, the presence of the filter does not cut their contribution from the signal [Reference Consoli, De Angelis and Andreoli19].
The time-of-flight technique is an efficient way to obtain information on the energy of the detected particles once their type is known. Its working principle relies on the measurement of the time needed by the particle to travel through a known distance, i.e., from the source to the detector. The arrival time of the particle must be detected together with the reference of the laser-matter interaction time, which is usually retrieved by the detection of the emitted UV and X-rays. The main issue in this kind of diagnostic system is the simultaneous detection of alphas and other ions. As for SSNTD, the contribution coming from low energy and heavier ions can be cut by the employment of filters of proper material and thickness. However, also in this case, the use of filters is not effective in excluding the proton contribution [Reference Consoli, De Angelis and Andreoli19].
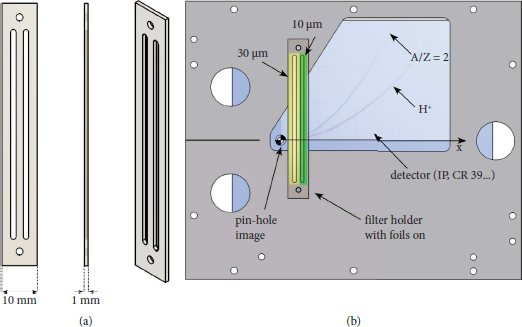
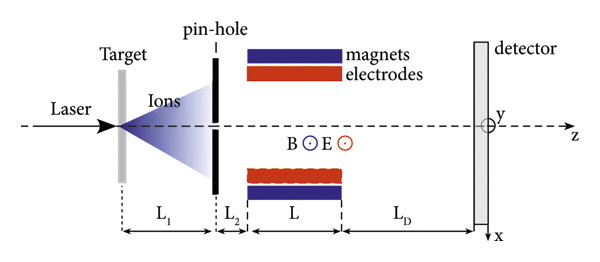
The discrimination of particles having different mass-to-charge ratios can be achieved by employing Thomson spectrometers. These devices exploit the action of parallel electric and magnetic fields, both orthogonal to the direction of propagation of the incoming charged particles. As a result, particles reaching the detector plane leave different parabolic traces, each associated to a specific mass-over-charge ratio. As shown in Figure 1, ions entering a Thomson spectrometer will first traverse an entrance pinhole, whose dimension determines the energy resolution as well as the capability of discriminating the different ion traces. Then, there is a region where both an electric and magnetic field are applied. Here, the charged particles are deflected and afterwards they travel over a proper drift space, while increasing their mutual separation until they reach the detector site. This could either be a passive detector [Reference Freeman, Fiksel and Stoeckl30], such as imaging plates [Reference Miyahara, Tateno, Iinuma and Takano31] and SSNTDs, or an active one to allow on-line measurement [Reference Harres, Schollmeier and Brambrink32].
A schematic representation of the Thomson spectrometer main components. The entrance pinhole, the magnets, and the electrodes providing the binding fields and eventually the drift space before reaching the detector for the imaging.

A strong effort has been required to design Thomson spectrometers resistant to the electromagnetic pulses (EMPs) produced during the interaction and being thus capable to work near the interaction point, for enhancing the device sensitivity by the increase of the solid angle covered. This allows to employ a small entrance pinhole while maintaining a high signal-to-noise ratio even for the products of low-rate nuclear fusion reactions. For this purpose, it was necessary to have an optimized shielding for EMPs otherwise they can couple to the spectrometer and cause an unwanted modulation, and thus superimposition, of the traces [Reference Giuffrida, Belloni and Margarone11, Reference Giorgio, Consoli and Angelis33, Reference Scisciò, Consoli and Salvadori34]. An optimal EMP resistance was achieved by keeping the deflector compact, the spectrometer has indeed only one deflecting unit providing both electric and magnetic deflection. This grants that the residual EMPs entering the device act on the particles only for a limited amount of time. The employment of a single deflecting unit also reduces the overall spectrometer dimension allowing to place it near the interaction point without blocking the line of view of other diagnostics.
The main advantage of Thomson spectrometers is that the proton trace is well separated from all the others. Hence, using this diagnostic, the issue related to the superimposition of proton to alpha particle signal is solved, easing the procedure for alphas univocal discrimination. However, the limitations in employing this technique come from the fact that the trace due to α particles is superimposed to those left by all other ion species with the same mass over charge ratio such as C6+, N7+, or O8+, that are routinely detected during laser-matter interaction experiments [Reference Consoli, De Angelis and Andreoli19, Reference Daido, Nishiuchi and Pirozhkov20].
One possibility in achieving the univocal characterization of the produced α particles consists in the simultaneous characterization of the interaction by means of several different diagnostics placed in close proximity and providing complementary information [Reference Consoli, De Angelis and Andreoli19, Reference Bonvalet, Nicolaï and Raffestin35]. Nevertheless, this is not always a viable solution due to space limitation in the experimental chamber.
In this article, we intend to analyse in detail the possibility of employing a Thomson spectrometer with an adequate differential filtering system [Reference Alejo, Kar and Ahmed36] to obtain univocal identification of alphas produced by the fusion reaction. We will also investigate the feasibility of using a TOF line coupled to a Thomson spectrometer to discriminate carbon ions from alpha particles for the energy ranges where the differential filtering methods cannot be used.
2. Differential Filtering Method
The motion of a charged particle moving along the z direction with velocity vz entering a Thomson spectrometer characterized by an electric field
 and a magnetic field
 applied for region of length L followed by a drift space of length LD can be described by the following equations (Reference Consoli, Angelis and Bonasera37):

where Z is the atomic number, qe is the electronic charge expressed in Coulomb, A is the atomic mass, mp is the proton mass expressed in kg, and Ek is the ion energy expressed in Joule. AB and AE are the integral coefficients of the magnetic and electric field along the longitudinal direction z that includes the nonuniform field. They include both the field integral IB and IE [Reference Ducret, Batani and Boutoux38] as well as all the dependences from the distances as follows:
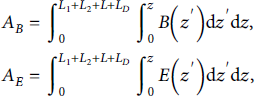
where L 1 is the distance from the target to the pinhole and L 2 is the distance from the pinhole to the electrodes and magnets, as labelled in Figure 1. AB and AE are thus expressed in Tm2 and Vm, respectively. From these relations, the following equation of the parabolic traces detected by the chosen imaging system can be retrieved:

These expressions do not consider relativistic effects of the particle motion, assumption which is reasonable for the typical energies of laser-accelerated ions (in the range of a few tens of MeV at most). The equations also assume the case where
 (being L the length of the dipole and R the bending radius of the particles travelling through it) condition that is often satisfied given the dimensions of the dipoles implemented in TS devices (usually a few centimetres long). As expected, the traces have a parabolic shape: each parabola is related to a specific mass over charge ratio and each point on the parabola corresponds to a different ion energy. The capability of resolving different traces and energies is related to the strength of deflection of the magnetic and electric field, as well as to the pinhole projection size [Reference Harres, Schollmeier and Brambrink32, Reference Schneider, Luo and Rhee39]. In general terms, to improve both the energy and the charge resolution, small pinhole sizes and large deflecting fields are preferred, according to the specific energy ranges of interest and the expected ion fluxes [Reference Schneider, Luo and Rhee39]. Identifying the size of the pinhole projection on the detector plane as s, the energy resolution along a parabolic trace for any A/Z can be expressed as follows [Reference Jung, Hörlein and Kiefer40]:

where the A and Z appear in the expression of x, from equation (1). The charge resolution is limited by the capability of separating the traces left by ions having different mass over charge ratios on the imaging system. In general, the separation between the different traces decreases as the ion energy increases, i.e., getting closer to the pinhole image projection. For each couple of parabolic traces, it is possible to identify their merging point and the corresponding energy here, it is called merging energy. This is the maximum energy over which ion specie discrimination is no more achievable due to the intersection of the traces. The mentioned merging energy Em is strongly related to the electric field deflection as well as to the pinhole image size. For a pair of two ion species, it is possible to write the following equation:
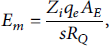
Where
 with
with
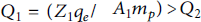 , the subscripts “1” and “2” are two generic indexes referring to the two different ionic species considered, and Em defines the merging energy of the ion with charge
 [Reference Jung, Hörlein and Kiefer40].
For instance, taking as reference the parameters of the Thomson spectrometer labelled as “BIG” described in Giorgio et al. [Reference Giorgio, Consoli and Angelis33] and assuming to have s = 1.5 mm the superimposition of the alpha trace with the one of protons happens for
 MeV, whereas the superimposition of the alpha trace with the one of C5+ happens for
 MeV.
MeV.
As mentioned in the introduction, the trace of the α particles will be superimposed to those of other fully stripped ions such as carbon, oxygen, and nitrogen, each having
 . In each point (x, y) of this specific parabolic trace, from equation (1), it results that all ions contributing to the signal have the same velocity, thus the same energy per nucleon. Being E α the energy of α particles, for each (x, y) point, it is possible to write
 ,
,
 , and
, and
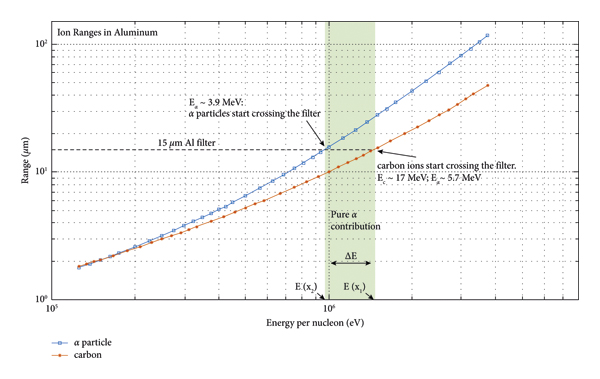
 . Because of the higher stopping power of heavier ions, the action of a foil of suitable thickness placed in front of the imaging system can be exploited to cut out the contribution of heavier ions from the trace, while allowing alphas to pass through it. Nevertheless, given the expected broad spectrum of the emitted alphas, the employment of a single filter is not suitable to recover a complete information since it would be too thin to cut the contribution coming from heavier ions having higher energies or too thick for the alphas of lower energy. For instance, according to simulations performed with the Montecarlo code SRIM [Reference Ziegler, Ziegler and Biersack41], a 15 μm of aluminium foil allows to detect alphas free from any other ion contribution in the energy range (3.9–5.7) MeV. But for
 3.9 MeV, the filter is too thick, and alphas are not able to cross it, whereas for
 5.7 MeV, carbon ions of 17.1 MeV start to pass through the filter contributing to the trace generation, as highlighted in Figure 2 where the ranges of alphas and carbon ions are depicted as a function of energy per nucleon.
The ranges of carbon and alpha particles in aluminium are compared. The horizontal dotted line highlights the 15 μm range and the intercept with the alpha and carbon curves identifies the energy needed by the two types of ions to cross a filter of the mentioned thickness. Since the graph is plotted as a function of energy per nucleon, the ∆E where only alphas can cross the filter will correspond to a certain ∆x on the parabola trace where only the alpha particles are contributing to the signal.
A similar issue has been discussed and addressed by Alejo et al. [Reference Alejo, Kar and Ahmed36] for the univocal characterization of deuteron ions emitted during the irradiation of a deuterated plastic. The author suggests the possibility of employing a set of different filters along the energy dispersion axis, tailoring the material and the thickness of each to cut the contributions of all other ions but deuterons. A similar approach can be used for our purpose: for each energy interval, delimited by (
 ) coordinates, the chosen filter must cut the contribution coming from heavier ions while allowing alphas with energies within the range
 to reach the detector.
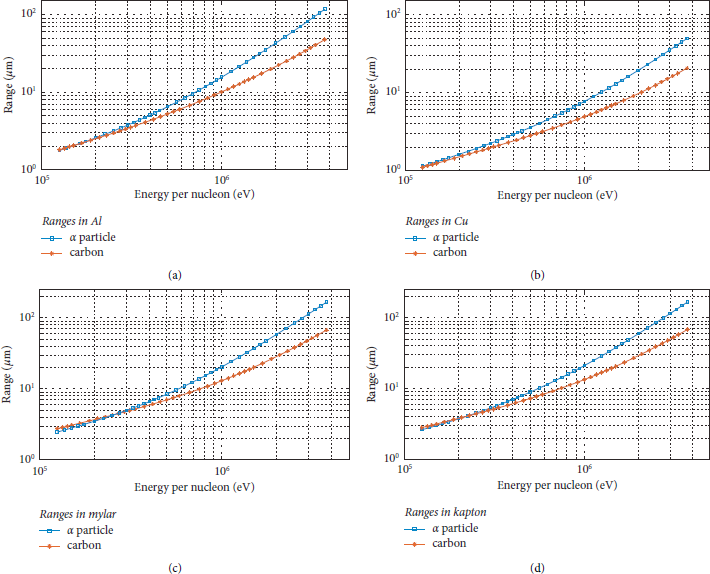
In Figures 3(a)–3(d)), the ranges of alphas and carbons for different foil materials are reported as a function of the energy per nucleon. The data are obtained from the SRIM [Reference Ziegler, Ziegler and Biersack41] tables.
The ranges of carbon ions and alpha particles are depicted as a function of the energy per nucleon in different materials: (a) aluminium, (b) copper, (c) mylar, and (d) kapton.

Therefore, it is possible to determine the proper filter thickness to use in each energy region just by comparing the ranges of the ions.
Once the ideal filter material and thickness has been found, it is necessary to translate the energy interval into the corresponding spatial region where the filter has to be placed. This can be performed by exploiting equation (1), which allows to calculate the spatial range (along the horizontal direction x) that corresponds to a given energy range.
The discussed methodology is now applied taking as reference the Thomson spectrometer labelled as “BIG,” described in detail in Giorgio et al. [Reference Giorgio, Consoli and Angelis33]. The mentioned spectrometer was expressly designed to detect low-rate fusion reaction products. It is supplied with a double entrance pinhole drilled in lead with the smaller one having a 0.35 mm diameter. The spectrometer works with magnetic field
 kG and electrostatic potential V = 7 kV. The length of the electrodes and magnets is of 25 mm. The gap between the magnets is 5 mm and the drift space before reaching the imaging system (either an imaging plate or a CR-39) is 197 mm long.
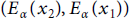
The values reported in Table 1 have been retrieved according to the ion ranges provided by the SRIM tables and depicted in Figure 3 by applying equation (1). The value of AB was evaluated from both measurements and numerical simulations of the magnetic field of our Thomson spectrometer. Except for α energies below 3 MeV, the set of aluminium filters of 10, 15, and 30 microns would allow to cover the whole alpha spectrum expected from p+11B reaction when triggered at the energy of the maximum cross section, as reported in Kimura et al. [Reference Kimura, Anzalone and Bonasera42], and also to investigate if alphas of slightly higher energies are detected.
x 1 and x 2 are the coordinates on the detector plane corresponding to the maximum and minimum alpha energy able to cross the filter (x = 0 corresponds to the pinhole image position).
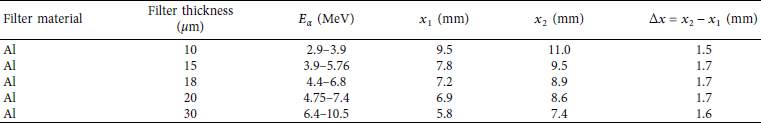
From Table 1, the ∆x values for the specific configuration of the TS in use appear to be rather small. To guarantee the stability and precision in mounting such thin stripes of few μm thick filters avoiding issues related to their disruption as well as to their jagged sides (originated by the cutting procedure), an ad hoc holding structure made of stainless steel was designed and it is here shown in Figure 4. The physical dimension of the holder although, does not allow to use the set of the three mentioned filters, since the width of the structure will be covering a portion of the imaging system. The set of filters is thus reduced to two and we found convenient the employment of the 10 μm and 30 μm one. These will allow to investigate the energy region where the maximum alphas yield is expected and to explore what happens for energies higher than 6.4 MeV, beyond the current alpha energy cut-off.
(a) The mounting of the filters with the two openings for the chosen filters. (b) The holder with the filters placed in front of the imaging system where it is possible to see a raw sketch of the expected parabolic traces.
2.1. Thomson Spectrometer Integrated with Time-Resolved Detector
As it is possible to see from the graphs in Figure 2, the differential filter method cannot be used for low energy particles. Indeed, for energies/nucleon lower than ∼300 keV (i.e.,
 MeV), the spatial extension of the energetic region free from ions contribution would either be too small or cannot be defined. For this energy region, we need to find some other method. We here investigate the possibility of integrating a time-of-flight (ToF) methodology in the Thomson spectrometer assembly. The general idea is to discriminate the different species according to their different time of arrival by placing a time-resolved detector after the region where the particles are subjected to the electric and magnetic field of the Thomson spectrometer. The detector will be placed along the trajectory of the particles having an A/Z = 2, so to exclude the contribution of protons and other ions to the signal generation. Since the ions contributing to each (x, y) point in this parabola trace have the same velocity, the simple TOF technique does not work for particle discrimination. Nevertheless, if a thin metal or plastic foil is placed in the particle path, the different species may undergo to a different energy attenuation and thus to a different variation of their velocities, according to the different stopping range of the various species for the used material. Then, if a time-resolved detector is placed at a proper distance, it would be possible to recognize the contribution of the various populations, as schematically shown in Figures 5(a) and 5(b). The method would be applied by punching one hole in the imaging system used for the parabolic traces detection, allowing for ions to pass through it and reach the time-resolved detector. This would allow to simultaneously obtain information on the alphas from the Thomson spectrometer (for higher energies) and the ToF methodology (for lower energies).
(a) Thomson spectrometer assembly integrated with the time-of-flight detector. (b) A simplified scheme of the working principle of the diagnostic.
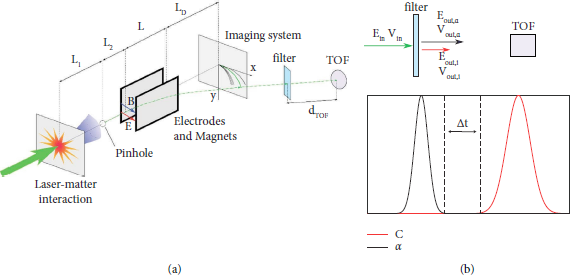
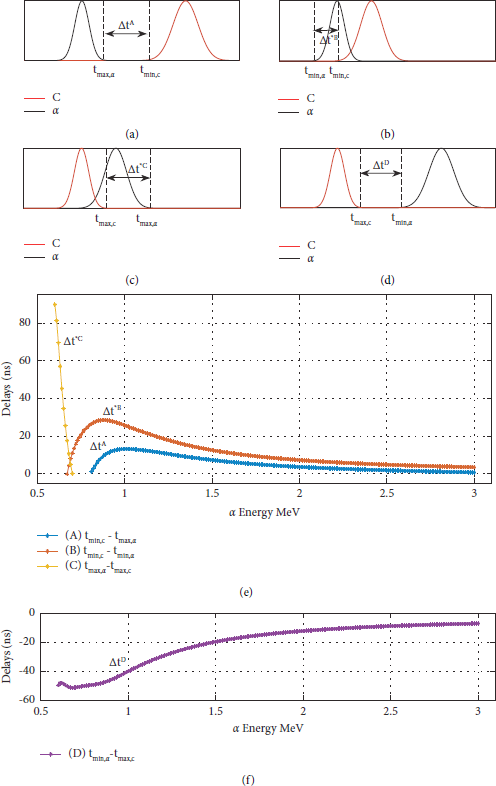
As discussed, in each position of the A/Z = 2 trace, only particles with a certain energy per nucleon will be detected. For a generic position in this trace, we now consider a simplified model of a δ-like Dirac distribution of the energies. In the basic scheme shown in Figure 5(b), particles with energy and velocity E in and v in, respectively, will pass through a foil filter and those with enough energy will emerge on the other side with E out and v out. In particular, it will be
 [Reference Salvadori, Consoli and Verona43] with
 the attenuation coefficient depending on the type of the incoming particle, its energy, and the filter characteristics (material and thickness, here labelled as f). This attenuation can be determined by SRIM [Reference Ziegler, Ziegler and Biersack41] simulations. The time of detection ti of each ion can be determined by knowing at which distance from the filter the time-resolved detector is placed d TOF, the type of filter used, and the energy of the incoming particle
 , as follows:

where
 is the velocity of the ion after crossing the filter and mi is the ion mass. The temporal interval between the detection of an alpha particle and a carbon ion can be written as follows:

where mp and mn are the proton and neutron mass, respectively, and the relation
 was exploited. For a fixed energy, determined by the positioning of the ToF detector behind a certain (x, y) point of the imaging plane, and a given d TOF, the delay would depend only on the material and thickness of the filter, represented by the attenuation coefficient
 and can thus be used to discriminate the ion species by comparing the arrival times.
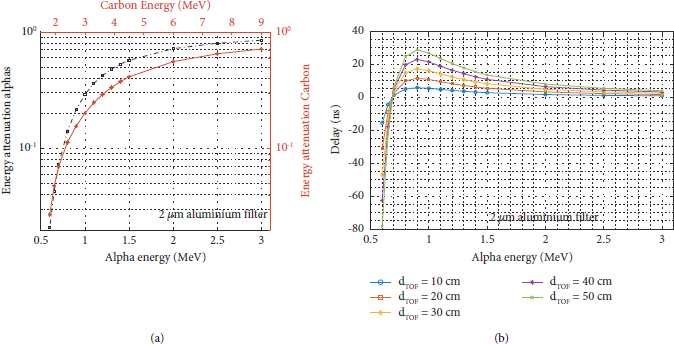
Equation (7) was applied to compute the delays, supposing to use a 2 μm aluminium foil as filter along the particle path. The attenuation coefficients for alphas and carbon ions, depicted in Figure 6(a), were computed by means of SRIM simulations [Reference Ziegler, Ziegler and Biersack41] in the energy range of interest (0.6 MeV < E alpha < 3 MeV). In Figure 6(b), the delays for different TOF line lengths are reported.
(a) The attenuation coefficients for alphas and carbon ions crossing 2 μm aluminium. (b) The delays
 obtained for different length of the time-of-flight line applying equation (5).

It is possible to see that two different regimes exist. For alphas energies lower than ≃0.7 MeV, the computed delays result to be lower than zero. Since, from equation (6), the temporal distance is defined as
 , this means that
 , hence carbon ions would reach the detector before alphas. For higher energies, on the other hand, alphas arrive first on the detector and, for a TOF line length of 50 cm, delays up to several tens of nanoseconds are obtained, which are well in the range of efficient ToF detection by fast diamond detectors [Reference Sussmann44].
Nevertheless, some remarks are necessary. Even in case of an ideal δ-like distribution, the alignment of a diagnostic based on this scheme is not trivial since a displacement of a few millimetres of the ToF line can lead to the blinding of the diagnostic. Moreover, for many of the energies shown in Figure 6, the obtained delays are of a few nanoseconds. Therefore, a detector with high temporal resolution is needed. In the case of chemical-vapor-deposition diamond detectors, often used in time-of-flight measurements [Reference Salvadori, Consoli and Verona43, Reference Scuderi, Milluzzo and Doria45], this is usually achieved by single crystal structures, having temporal resolution better than ∼0.8 ns and high charge collection efficiency. On the other hand, this kind of structures can be grown up to a surface of a few square millimetres resulting in a small solid angle covered worsening the alignment issue.
Moreover, in a realistic scenario, the energy distribution for each detected ion species is not a δ-like distribution but will have a certain width. Hence, each point of the parabolic trace will correspond to an energy span and not to a single energy value. The amplitude of the energy span to consider in each point can be related to the size of the pinhole image on the detector plane [Reference Consoli, De Angelis and Andreoli19, Reference Jung, Hörlein and Kiefer40]. The latter defines the energy resolution of the spectrometers along the parabola trace, and this will correspond to the FWHM of the Gaussian distribution of the energies to be considered in our computations. As a result, instead of a single time of arrival for each species, there will be a temporal window where α particles will be detected and a temporal window where carbon and other ions will arrive (see Figure 5(b)). To be still able to use the ToF technique to discriminate the various contributions, it is thus necessary for the fastest carbon ion to be slower than the slowest alpha particle. Alternatively, if this condition is not satisfied, it is possible to compute the time interval where the two populations overlap and define the portion of the alpha time window free from other ions, here in after labelled
 .
.
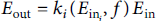
Taking into account the energy distribution due to the finite pinhole extension, the requirements for the energy resolution become even more strict. Indeed, by applying equation (4) with the parameters of the considered Thomson spectrometer and assuming a pinhole image size ranging from 0.5 mm to 1.5 mm, the obtained ∆E for alphas and carbon ions is reported in Figures 7(a) and 7(b), respectively. Assuming a ToF line length of 0.5 m and a pinhole image size of 0.5 mm, the temporal duration of the α and carbon bunches has been also computed and is reported in Figure 7(c).
The ∆E computed for different size of the pinhole image according to equation (6) for (a) alpha particles and (b) carbon ions. (c) The bunch duration of alphas and carbon ions at the detector site for s = 0.5 mm and d TOF = 0.5 m.
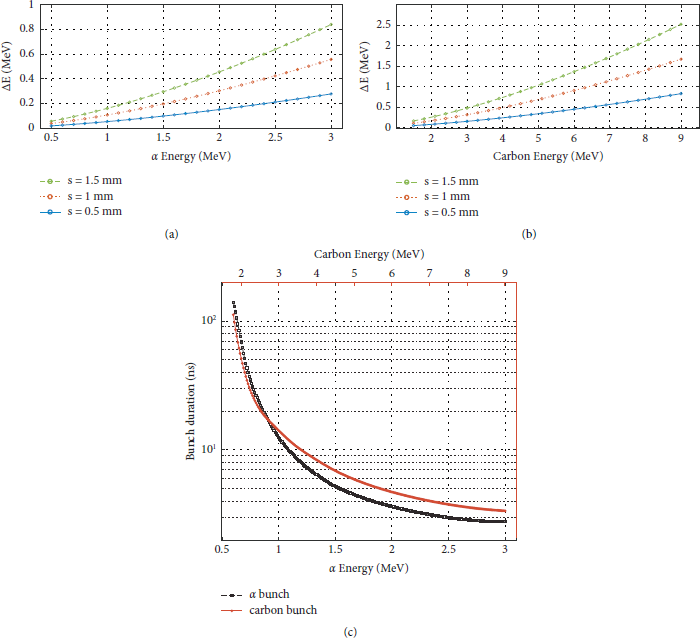
Taking these values as the width of the energy distribution to consider for each particle energy, it is possible to compute the temporal interval ∆t where the signal generated by the alphas is free from the carbon ions contribution (see Figures 8(a)–8(d)). We then chose the favourable case of a pinhole image of 0.5 mm size, and the resulting ∆t and
 are reported in Figures 8(e) and 8(f) for a TOF line of 50 cm length. Notice that in Figure 8(e), for each of the depicted cases, only positive values of ∆t and
 are considered because when the delay becomes negative, it means that the examined energy falls into one of the other cases. This also clarifies Figure 8(f), where only negative delays are present, indeed the situation depicted in Figure 8(d) never occurs for the parameters examined here and, for each energy, the behaviour of the two bunches is described by one of the cases a–c.
(a)–(d) Schematic representation of the possible reciprocal positions of carbon ions and alphas arriving on the ToF detector. The ∆t highlights the temporal separation between the signal generated by the alphas and carbon ions,
 points out the interval where the signal is generated by the contribution of alphas only when partial superimposition occurs. (e) The amplitude of ∆t and
 intervals for different energies and d TOF = 0.5 m each curve corresponds to one of the situations depicted in (A)–(C). (f) The amplitude of ∆t corresponding to case (D) and the negative amplitude points out that this particular situation never occurs for our conditions.
It is possible to see that, even considering a broad energy distribution, an appreciable ∆t can still be defined. In this case, it is useful to consider not only the whole separation of the traces but also their partial overlapping, defining
 the temporal interval where only alphas are detected. By doing so, the methodology can still be applied. Nevertheless, for bigger pinhole sizes, the width of the energy distribution increases causing a decrement in ∆t, issue that can be partially solved by extending the TOF line length.
In this scheme, it is also necessary to assess the effect of the filter on the particle motion. It is indeed well known that particles traversing a material undergo a modification of their trajectory. This effect is more severe for particles energies in a range comparable with the thickness of the material used as filter. In these conditions a broadening of the energy distribution is also experienced. The latter will, in turn, cause a broadening of the temporal interval interested by a certain energy during TOF measurements. Namely, alpha particles having energies ≃600 keV can be detected at a certain time
 . SRIM simulations were performed to quantitatively estimate this effect for the scheme considered here i.e., alphas with energies≥600 keV up to 3 MeV impinging on 2 μm thick aluminium. The range covered by the energy distribution of the alphas entering in the filter with 600 keV is ≃25 keV, within the ∆E already considered due to the spectrometer energy resolution (see Figure 7(a)). The trajectories of the particles, though, are strongly affected by the presence of the filter and the beam outcoming from it is strongly divergent. Nevertheless, this effect rapidly decreases for increasing particle energies.
Another effect to consider is the one given by the electrostatic-magnetostatic deflector which also produces a clear increase on the tangential (both horizontal and vertical) components of the particle velocity, due to the effect of both magnetic and electric fields. This increases the beam radius and makes it dependent on the distance from the deflector. Therefore, the beam section on the detector plane will be much larger than that on the filter plane, according to the filter-detector distance. So, on one side, larger distances ease the separation of the particle bunches. On the other side, the requirement for large-area detectors increases, and on the other hand, large area detectors mean low temporal resolution. Therefore, for a specific alpha energy, an optimum value for the ToF line length has to be found.
A way to deal with this issue may be the employment of suitable electric-magnetic lenses, capable to correct the beam divergence given by the spectrometer, and to keep the detector diameter small also at large flight distances. However, this is of course at the expenses of the detector complexity.
3. Conclusions
The differential filter method seems to be a viable solution for the univocal detection of α-particles in low-rate fusion reactions. An optimal implementation of this methodology, able to give characterization of a wide portion of the broad alpha spectrum, requires the spectrometer to be designed trying to obtain a large spatial dispersion of incoming particles, so large fields, and large drift distances are needed. This would ease the optimal filter placement along the whole parabola trace, but gives problems in case compact spectrometers are needed, as required for high sensitivity devices useful for diagnostics of proton-11B fusion reactions [Reference Consoli, De Angelis and Andreoli19]. The prototype presented in this article is planned to be used soon in tailored p-11B experimental campaigns.
The discussed methodology of differential filtering can be applied not only in the context of the proton-boron fusion reactions but also to monitor the alphas produced during the deuterium-deuterium fusion reaction and the deuterium-tritium one. In this case, the parabolic trace of the fully stripped alpha particles is not useful since the deuterium will also contribute to the signal on the very same A/Z = 2 trace and, being more penetrant with respect to alpha particles, the differential filtering method is not capable of excluding its contribution. Nevertheless, if we consider the parabolic trace having A/Z = 4, the deuterium will not contribute to the signal whereas the 4He+ may be detected instead. On this trace, an approach similar to what discussed earlier can thus be applied for their characterization.
The methodology that foresees the integration of a time-resolved detector in the Thomson spectrometer could, in principle, provide very interesting results for the univocal discrimination of low energy alpha particles. Nevertheless, the technique presents some significant technical issues concerning the TP-TOF assembly alignment, and the need for high temporal resolution, high sensitivity, and large area detectors. All this points need to be faced and assessed for the technique to be successfully applied in a real-case scenario. The use of an electric-magnetic lens to correct the beam divergence can be very useful to highly improve the detector requirements, but at the expenses of the whole device complexity.
The methodologies here shown are of primary interest for the univocal identification of alpha products in experiments of laser-generated fusion reactions. Especially in cases of low yields, the simultaneous presence of a large number of laser-accelerated ions different from fusion products very often makes their actual characterization technically impossible by common diagnostic methodologies [Reference Consoli, De Angelis and Andreoli19].
Data Availability
The data used in this study are available from the author upon reasonable request.
Disclosure
Views and opinions expressed are however those of the authors only and do not necessarily reflect those of the European Union or the European Commission. Neither the European Union nor the European Commission can be held responsible for them. The involved teams have operated within the framework of the Enabling Research Project: ENR-IFE.01.CEA “Advancing shock ignition for direct-drive inertial fusion.”
Conflicts of Interest
The authors declare that they have no conflicts of interest.
Acknowledgments
This work has been carried out within the framework of the EUROfusion Consortium, funded by the European Union via the Euratom Research and Training Programme (Grant Agreement no. 101052200—EUROfusion).


 Open access