

1. INTRODUCTION
Ice cores are excellent archives for documenting paleoclimatic conditions and for gaining a better understanding of recent climatic and environmental variability affecting wide regions of the Earth (Delmas, Reference Delmas1992; Alley, Reference Alley2000). Polar ice cores, such as those extracted from Greenland and Antarctica, allow to reconstruct glacial and interglacial cycles through global or hemispheric signals of past temperature, precipitation, aerosol concentration, greenhouse gases and so on (Andersen and others, Reference Andersen2004; Epica, Reference Epica2004, Reference Epica2006; Kawamura and others, Reference Kawamura2007; Orombelli and others, Reference Orombelli, Maggi and Delmonte2010; Faria and others, Reference Faria, Weikusat and Azuma2014). However, polar ice cores have limited value for studying local climatic variability because they are far from low- and mid-latitude regions where most of the Earth's population lives.
On the other hand, ice cores recovered from mid-latitude mountain glaciers offer excellent archives for understanding recent climatic variability due to both natural and anthropogenic factors. Such ice cores present several advantages for studying climate changes (Thompson, Reference Thompson, Jones, Bradley and Jouzel1996, Reference Thompson2010; Schwikowski and others, Reference Schwikowski, Döscher, Gäggeler and Schotterer1999; Vimeux and others, Reference Vimeux2009; Thompson and others, Reference Thompson, Mosley-Thompson, Davis and Brecher2011, Reference Thompson2013). First, mountain ice cores provide the opportunity to investigate the dynamics of atmospheric short-lived species emitted from populated and industrialized areas often surrounding mountain glaciers (Döscher and others, Reference Döscher, Göggeler, Schotterer and Schwikowski1995; Preunkert and others, Reference Preunkert, Wagenbach, Legrand and Vincent2000; Schuster and others, Reference Schuster2002; Schwikowski and others, Reference Schwikowski2004; Buffen and others, Reference Buffen, Hastings, Thompson and Mosley-Thompson2014). Secondly, long-term, high-quality instrumental records are often available in the proximity of mountain glaciers. This allows a detailed characterization of the transfer processes and the deposition rates of various atmospheric constituents through the comparison between direct measurements and ice-core data (Schotterer and others, Reference Schotterer, Fröhlich, Gäggeler, Sandjordj and Stichler1997; Tian and others, Reference Tian2003; Mariani and others, Reference Mariani2014). Furthermore, mid-latitude areas are generally characterized by high precipitation rates allowing the creation of records with higher temporal resolution (Thompson and others, Reference Thompson2003, Reference Thompson2005; Kaspari and others, Reference Kaspari2007; Neff and others, Reference Neff2012) than the ones extracted from ice sheets (Petit and others, Reference Petit1999; Svensson and others, Reference Svensson2008; Jouzel and Masson-Delmotte, Reference Jouzel and Masson-Delmotte2010). Finally, mountain ice cores allow the analysis of specific meteorological processes, as the Saharan dust depositions in the Alps (Jenk and others, Reference Jenk2006; Thevenon and others, Reference Thevenon, Anselmetti, Bernasconi and Schwikowski2009) and Himalaya (Kaspari and others, Reference Kaspari2009a, Reference Kasparib) or the intensity fluctuations of the South Asian Monsoon in the Tibetan Plateau (Thompson and others, Reference Thompson2000; Davis and Thompson, Reference Davis and Thompson2005).
In addition, as a result of recent global warming, low- and mid-latitude glaciers are retreating with an increased trend in recent years (Lowell, Reference Lowell2000; Beniston, Reference Beniston2005; Vincent and others, Reference Vincent2005; Bolch and others, Reference Bolch2012). Glacier melting could lead to a dramatic loss of important paleoclimatic records (Thompson, Reference Thompson2000; Zhang and others, Reference Zhang, Kang, Gabrielli, Loewen and Schwikowski2015). For this reason, it is necessary to identify new areas of mountain glaciers where to collect new ice cores in the next years.
A fundamental contribution in the reconstruction and interpretation of environmental changes can arise from the selection of new potential drilling sites primarily located in unexploited mountain ranges. Among those, the Asian High Mountains are a very interesting region. Asia, in fact, is mainly affected by two regional weather systems (the westerlies and the Indian monsoon) and Asian glaciers are located adjacent to densely inhabited regions and their emerging economies. It is well known that ice cores from Asian mountains (e.g. Himalaya, Tibetan Plateau, Karakoram, Tien Shan) can provide useful data for understanding variability of both regional and global circulation (Aizen and others, Reference Aizen2006; Yang and others, Reference Yang, Joswiak and Yao2014; Du and others, Reference Du, Kang, Qin, Cui and Sun2016) as well as the effect of anthropogenic activities on natural conditions (Zhao and others, Reference Zhao, Xu, Yao, Tian and Li2011; Grigholm and others, Reference Grigholm2016). The importance of the Asian High Mountains is also motivated by the fact that a large number of potential unexplored drilling sites are present in these remote areas and could be exploited.
One common feature of mountain ranges is the complexity of their topography and atmospheric dynamics. Atmospheric conditions (e.g. precipitation, temperature) and glacier topography (e.g. elevation, slope, aspect) play a key role in defining the location of an ice-core drilling site. Selecting an area suitable for ice-core drilling can therefore be challenging, especially in remote areas where little information is available. Some authors have investigated the relation between the quality of the stratigraphy and the glacier's features (Wagenbach and Geis, Reference Wagenbach, Geis, Leinen and Sarnthein1989; Welch and others, Reference Welch, Pfeffer, Harper and Humphrey1998; Campbell and others, Reference Campbell2012). This specific issue is typically examined for a glacier site based on ground explorations (Copland and Sharp, Reference Copland and Sharp2001; Schwikowski and others, Reference Schwikowski, Brütsch, Casassa and Rivera2006; Gabrielli and others, Reference Gabrielli2010). Traditional methods are impossible to perform at large scale for mapping potential drilling sites in remote areas such as the Asian High Mountains. However, gathering site-specific geophysical information at any specific site is critical both for identifying the best drill site and for interpretation of the ice-core records. In this context, the criteria governing the choice of a drilling site and the environmental factors that affect the possibility to drill a mountain glacier are poorly formalized in the available scientific literature. Accordingly, the development of a methodology to map potential sites, using simple, globally and spatially distributed variables, is relevant for the identification of new drilling sites.
The goal of this study is to develop a novel methodology to identify suitable areas for non-polar ice-core drilling that can be applied in unexplored areas for a preliminary identification of potential drilling sites. For this purpose, we first identify the morphometric and climatic variables associated to glacier suitability for ice-core drilling (SICD) based on the characteristics of already drilled sites in Alpine and Asian High Mountain glaciers. Then, we develop a statistical approach to map the SICD for these areas. Assuming that in the European Alps all available drilling sites have been already exploited, we use this area to create and evaluate the model. Finally, we apply the model in the Asian High Mountains, and several new drilling sites are proposed and discussed providing important constraints in this poorly explored area.
2. REVIEW OF SICD
When snow accumulates on the glacier surface, the climatic signal is stored in the ice. Glaciers preserve, in each layer, differences in the chemistry and structure of ice, related to climatic and environmental conditions at the time of snow depositions. The morphological and physical features of the site (e.g. slope, glacier dynamics, flow velocity, ice thickness, melting), as well as the climatic variables (e.g. snow accumulation rate, wind exposure, temperature), determine snow and firn metamorphism, thus influencing the quality of the stratigraphy. For example, insolation and temperature gradients produce snow melting, recrystallization and densification, while the ice flow can mix the layers causing stratigraphic disturbance (Thompson, Reference Thompson2000; Schotterer and others, Reference Schotterer, Stichler, Ginot, Dewayne Cecil, Green and Thompson2004; Cuffey and Paterson, Reference Cuffey and Paterson2010; Faria and others, Reference Faria, Freitag and Kipfstuhl2010). In addition, surface processes such as drifting and selective removal or accumulation by wind (Faria and others, Reference Faria2009; Birnbaum and others, Reference Birnbaum2010) can modify seasonal depositions of snow crystals, dust, aerosol and trace compounds.
Wagenbach and Geis (Reference Wagenbach, Geis, Leinen and Sarnthein1989) summarized the glacio-meteorological and topographical criteria leaning towards the preservation of ice-core stratigraphy as follows: (i) high elevation, corresponding to low temperatures, to prevent water percolation; (ii) sufficient glacier thickness and reasonable snow accumulation rate to ensure long-term records and temporal resolution; (iii) large extension and relatively flat surface topography to minimize the influence of glacier flow. However, a physical model able to support the definition of new drilling areas is not available, whereas a series of ground exploration techniques (e.g. meltwater percolation studies, mass-balance reconstructions, geophysical thickness investigations, ice flow models, glacio-chemical analyses) are generally applied to individual glaciers to evaluate their SICD (Preunkert and others, Reference Preunkert, Wagenbach, Legrand and Vincent2000; Schwikowski and others, Reference Schwikowski, Brütsch, Casassa and Rivera2006; Campbell and others, Reference Campbell2012; Wagenbach and others, Reference Wagenbach, Bohleber and Preunkert2012).
The most important requirement when selecting a drilling site is the quality of the glacio-chemical signal stored in the ice. Table 1 summarizes the most relevant climatic and environmental variables affecting the quality of the glacio-chemical stratigraphy that should be considered in the selection of a new drilling site.
Variables that affect the preservation of the ice-core stratigraphy
Another important criterion is the temporal resolution of the stratigraphy. It depends on the accumulation and distribution of snow precipitations and glacier thickness. An ice core can cover a long time span reaching back thousands of years or fewer decades with a high sub-seasonal detail. Generally, higher annual accumulation is associated with high resolved seasonal stratigraphy, while low accumulation rates preserve ice cores with a long time history. Seasonal signals can be useful for evaluating inter-annual variability (e.g. warmer summers, precipitation and extreme events, dust depositions, etc.) and calibrating climatic models (e.g. integration of climatic records with weather stations).
In the selection of a drilling site, its climatic relevance can be evaluated according to the research focus (e.g. relevance of the geographic location with respect to the investigated processes). Individual glaciers, in fact, can store specific information as a function of their location; and the proximity of important sources (e.g. city, desert, volcano) can strongly influence other signals stored in the glacier.
All these requirements are difficult to formalize and many parameters are nearly impossible to obtain spatially distributed at the global scale. We chose to focus the proposed model only on the quality of the stratigraphy because of its importance in determining the potential of a drilling site. The rationale of this study is to combine a limited subset of relevant variables, identified through literature research, to propose a SICD index able to map the potential drilling sites of non-polar mountain glaciers.
3. DATA COLLECTION AND METHODOLOGY
In this study, we focused on non-polar mountain glaciers in the European Alps and in the Asian High Mountains due to the abundance of already drilled sites. The overall study area is shown in Figure 1. The European Alps are a complex mountain system that extends ~1000 km (from East to West) throughout south-central Europe, reaching a maximum elevation of 4800 m (at the Mont Blanc summit). The Alps are affected by different climatological regimes and can be divided into three geographical regions with different characteristics. The Western Alps are the most elevated and they are primarily influenced by air masses that flow from the Atlantic Ocean. This region presents several drilled sites (e.g. in the Monte Bianco and Monte Rosa massifs). The glaciers of the Central Alps are less elevated compared with those in the Western Alps and they are threatened by rapid melting. In this region, drilled sites are limited in the area of the Ortles massif. Although the eastern part of the Alpine chain is influenced by cold air from Siberia, the presence of drilled sites is very low.
Study area: the European Alps (a) and the Asian High Mountains (b). The yellow polygons show the extent of glaciers, with the position of the ice-core drilled sites (red triangles) retrieved from the Ice Core Database (IDB).

The Asian High Mountains correspond to the regions of Himalaya, Karakoram, Tibet, Pamir, Tien Shan and Altay Shan. The maximum elevation is the Mount Everest (8848 m) located at the border between China and Nepal. The main weather systems that influence the Asian High Mountains are the westerlies and the Indian monsoon. These systems produce regional climate patterns affecting glacier behaviour differently across the Asian High Mountains (Kääb and others, Reference Kääb, Berthier, Nuth, Gardelle and Arnaud2012; Yao and others, Reference Yao2012; Mölg and others, Reference Mölg, Maussion and Scherer2013). The Indian monsoon supplies high amounts of precipitation from the Indian Ocean over the Himalaya (Gadgil, Reference Gadgil2003). The westerlies system becomes more important in the Western Himalaya and the Karakoram. The northern and western air masses that flow from Siberia and Central Asia to the Tien Shan and Pamir Mountains dictate the continental climate of these regions.
3.1. Data harmonization and variable selection
3.1.1. Ice-Core Database
The Ice-Core Database (IDB) was created collecting ice-core data from the Tropical Ice cores Paleoclimatology database (National Oceanic and Atmospheric Administration, http://www.ncdc.noaa.gov/paleo/icgate.html), the US National Ice Core Laboratory (http://www.icecores.org), and through a detailed review of the scientific literature (Mattavelli and others, Reference Mattavelli2016). IDB was used for this study because it was the most complete archive of data from non-polar ice cores. We employed 24 drilled sites in the Alps and 42 in the Asian High Mountains (Table 2), where a total of 114 ice cores were collected.
Ice-core drilling sites used in this study

3.1.2. Glacier outlines
The Randolph Glacier Inventory (RGI 4.0; Pfeffer and others, Reference Pfeffer2014) was used to define glacier outlines within the study area. This inventory is a globally complete collection of glacier outlines supplemental to the Global Land Ice Measurements from Space (Kargel and others, Reference Kargel, Leonard, Bishop, Kääb and Raup2014). The European Alps contain 3812 glaciers, covering a total surface area of ~2052 km2, with a vertical altitudinal range from ~1500 to 4800 m. The Asian High Mountains include 85492 glaciers covering ~120 070 km2, with an elevation range from 2500 to 8800 m.
3.1.3. Digital elevation model
The Advanced Spaceborne Thermal Emission and Reflection Radiometer (ASTER) Global Digital Elevation Model (ASTER G-DEM), characterized by 30 m spatial resolution (~1 arc-second) and ~15–30 m vertical accuracy (Tachikawa and others, Reference Tachikawa2011), was chosen in order to obtain global coverage with a homogeneous spatial resolution. This digital elevation model offers great geomorphologic detail in areas with a complex topography (Bolch and others, Reference Bolch, Kamp and Olsenholler2005; Hayakawa and others, Reference Hayakawa, Oguchi and Lin2008).
3.1.4. Climate data
Climate data were sourced from the WorldClim database. WorldClim is a set of global climatic data layers, with a spatial resolution of ~1 km2, generated through interpolation of average monthly data from weather stations (1960–90 period; Hijmans and others, Reference Hijmans, Cameron, Parra, Jones and Jarvis2005). The most relevant variables for this study are monthly and annual precipitation, monthly mean, minimum and maximum temperature and some derived variables (e.g. mean diurnal range, mean temperature of warmest season, precipitation seasonality, precipitation of warmest season).
3.1.5. Selected morphometric and climatic variables
The most relevant morphometric and climatic variables to be used as input of the SICD model were identified based on a literature review combined with a preliminary analysis of the cumulative distribution functions (CDF) of the variables characterising the drilled sites present in the IDB. The values of each variable map were extracted from drilled sites (area of 5 × 5 pixels around the drilled point, ~150 m × 150 m) and from RGI glacier polygons. Differences between the CDF of already drilled sites and the CDF of the whole glacier area were evaluated to characterize drilled sites. The following variables were selected:
-
• Slope (°). Degree of surface inclination from the horizontal plane generated from DEM using a GIS (Geographic Information System) function (Hofierka and others, Reference Hofierka, Mitášová, Neteler, Hengl and Reuter2009). In areas with lower slope gradients, the preserved stratigraphy shows parallel layers that can easily refer to climate history. These sites are also suitable for technical drilling operations (e.g. location of drilling camp, drill requirements).
-
• Local relief (m). Vertical difference in elevation between the highest and lowest points of a land surface within a specified horizontal distance (computational window of 9×9 pixels; Wilson and Gallant, Reference Wilson and Gallant2000). Higher values indicate the presence of steepest slopes that correspond to a major glacier flow velocity. These areas do not favour ice-core drillings because these elements can modify the original stratigraphy. In addition, steep slopes are also predisposing factors for avalanches, which disrupt the layers and constitute a risk for the technical operations.
-
• Mean temperature of warmest season (°C). Average temperature of the three warmest months. The suitable areas for ice-core drilling are characterized by below freezing temperature throughout most of the year. As temperature is inversely correlated with elevation, drilling sites are generally chosen in more elevated areas. Conversely, positive temperatures (higher than 0°C) favour snow melting that can modify the ice-core stratigraphy. The mean temperature of warmest season was chosen from the WorldClim dataset in order to evaluate the mean higher temperature at the site.
-
• Direct solar radiation (W m−2 d−1). A raster map of solar direct radiation was calculated using the GIS software Geographic Resources Analysis Support System (GRASS) for a given day, latitude, surface and atmospheric condition (i.e. r.sun function; Hofierka and Šúri, Reference Hofierka and Šúri2002). This variable was computed considering topographic exposure and shadows and allows evaluation of temperature difference at local scale. The function was evaluated on 15 August. In this period, the mean temperatures are usually high in both study areas, and heat accumulation in the glacier body causes ice melting. Suitable areas for ice-core drilling are ideally those that are less exposed to high-intensity solar radiation.
3.2. Weight of evidence and derivation of the SICD index
The SICD of mountain glaciers was defined here as the possibility of extracting an ice core with preserved stratigraphy suitable for reconstructing past climate conditions. SICD index was derived from a combination of the environmental variables described in Section 3.1.5 based on a Spatial Multi-criteria Analysis (Karnatak and others, Reference Karnatak, Saran, Bhatia and Roy2007). Assuming that areas suitable for future drilling have similar conditions (i.e. combination of variables) to already drilled areas, the Weight of Evidence (WoE) method was proposed for analysing the drilling suitability of different sites. In order to apply the spatial analysis, each variable was divided into eight uniform intervals on the basis of the CDF (Table 3).
Model parameters for the study areas of the European Alps and Asia. The table reports the positive and negative weights (W + and W −) and the total weight (W t) assigned to each interval of the selected variables (slope, local relief, mean temperature of warmest season, direct solar radiation) with the WoE method
3.2.1. WoE method
A quantitative WoE scoring system was developed in this research to assign a weight to every interval of each variable used in the model and to spatially combine variables into a single value referred to as the SICD index. Similar approaches have been used mainly in geology to identify mineral potential (Bonham-Carter and others, Reference Bonham-Carter, Agterberg, Wright, Agterberg and Bonham-Carter1989; Agterberg and others, Reference Agterberg, Bonham-Carter, Wright, Gàal and Merriam1990) and for landslide susceptibility mapping (Thiery and others, Reference Thiery, Malet, Sterlacchini, Puissant and Maquaire2007; Regmi and others, Reference Regmi, Giardino and Vitek2010). With this method, the spatial relationship between a variable and SICD is evaluated using a statistical approach based on the Bayesian probability theorem as follows:
 $$P\{ D \vert B\} = \displaystyle{{P\{ B \vert D\} \times P\{ D\}} \over {P\{ B\}}}. $$
In this formula, the posterior probability P{D|B} of locating a drilling site D within a specific variable interval B is equal to the product between the likelihood P{B|D} of observing the variable interval B in a given drilling site D and the prior probability P{D} of finding a drilling site, divided by the prior probability P{B} of observing the variable interval (Regmi and others, Reference Regmi, Giardino and Vitek2010). Our model is based on the calculation of positive (W +) and negative (W −) weights for each variable interval as follows:
 $$W^ + = \log _{\rm e}{\textstyle{{P\{ B \vert D\}} \over {P\{ B \vert \bar D\}}}} \quad W^ - = \log _{\rm e}{\textstyle{{P\{ \bar B \vert D\}} \over {P\{ \bar B \vert \bar D\}}}}, $$
where $\bar D$
denotes the absence of an observed drilling site and
$\bar D$
denotes the absence of an observed drilling site and $\bar B$
indicates that the value of the variable is outside the considered interval. The difference between positive and negative weights is the total weight W
t = W
+ − W
−, which provides a measure of the spatial association between variable intervals and observed drilling sites.
$\bar B$
indicates that the value of the variable is outside the considered interval. The difference between positive and negative weights is the total weight W
t = W
+ − W
−, which provides a measure of the spatial association between variable intervals and observed drilling sites.
The WoE method was applied treating separately the two areas of study. Drilled sites (i.e. area of 5 × 5 pixels around the drilled point) were overlapped with variable maps, and only the area of glacier extension was considered as total area of study.
3.2.2 SICD index derivation
The SICD index was calculated using a linear combination of weights defined for the selected variables:
 $${SIC}{D}_{{WoE}} = S_{W^t} + R_{W^t} + T_{W^t} + D_{W^t},$$
where S,R,T,D are the four variables (Slope, local Relief, Temperature, Direct radiation) and W t is the total weight corresponding to the variable interval calculated using the WoE method. All variable maps were combined in a GIS environment (i.e. GRASS). The SICD index maps were created for the European Alps and for the Asian High Mountain glaciers. Higher values of SICD indicate a better site for ice-core drilling. Normalization (between 0 and 1) was performed for the maps of SICD to evaluate the model. Finally, the first indications of potential glaciers suitable for ice-core drilling were established by ranking the sum of pixels with values of SICD >0.7 of a glacier.
3.3 Model evaluation
The root-mean-square error (RMSE) was computed to evaluate the generated maps. It was calculated using the values of SICD estimated at the drilled sites and considering 1 the expected value of SICD at these points. Furthermore, the ability of the proposed method to indicate suitable areas for ice-core drilling was verified using the success rate curve to evaluate the goodness of fit of the model (Pradhan and others, Reference Pradhan, Oh and Buchroithner2010; Sterlacchini and others, Reference Sterlacchini, Ballabio, Blahut, Masetti and Sorichetta2011). The success rate curve indicates how well the model fits the occurrences by calculating the percentage of drilled sites that occur in the areas classified with higher values of SICD. If the curve and the diagonal coincide, the model should be deemed equivalent to a totally random model. Likewise, greater slope in the first part of the curve indicates higher model quality. The curve was created by cross-checking the distribution of the total set of drilled sites with the SICD maps: after sorting SICD values of each pixel in descending order, the cumulative percentage of drilled sites was plotted against the cumulative percentage of the total study area. The area under the curve (AUC) represents the quality of the model to reliably fit the occurrence: the larger the area, the greater is the goodness of fit of the model. The AUC allows the comparison of different success rate curves. A total area equal to 100 denotes perfect accuracy, whereas values below 50 represent a random fit.
4. RESULTS AND DISCUSSION
4.1. Spatial variability of the selected variables
The spatial variability of the selected variables is shown in Figure 2, focusing on the Monte Rosa massif (European Alps). Low slope values (0–20°) are present in glacier tongues but also in more elevated areas in the accumulation basins suitable for ice-core drilling (Fig. 2a). High local relief values (higher than 70 m) are found along the mountain ridges and in the vicinity of northern sides (Fig. 2b). Those steep slopes are generally associated with stratigraphic deformation of seasonal depositions. The mean temperature of the warmest season (Fig. 2c) shows an inverse relation with elevation, with negative temperatures in the more elevated summit areas. The local variability typical of complex mountain ranges is better resolved in the direct solar radiation map (Fig. 2d, 30 m spatial resolution) with respect to the temperature map (Fig. 2c, 1 km spatial resolution). The highest values of solar radiation are observed on elevated flat areas and southern slopes because they are not shielded by the effect of topography (i.e. prevailing exposure and shadows).
Environmental variables included in the model: (a) slope; (b) local relief; (c) mean temperature of warmest season; (d) direct solar radiation. Example for the Monte Rosa massif, European Alps.

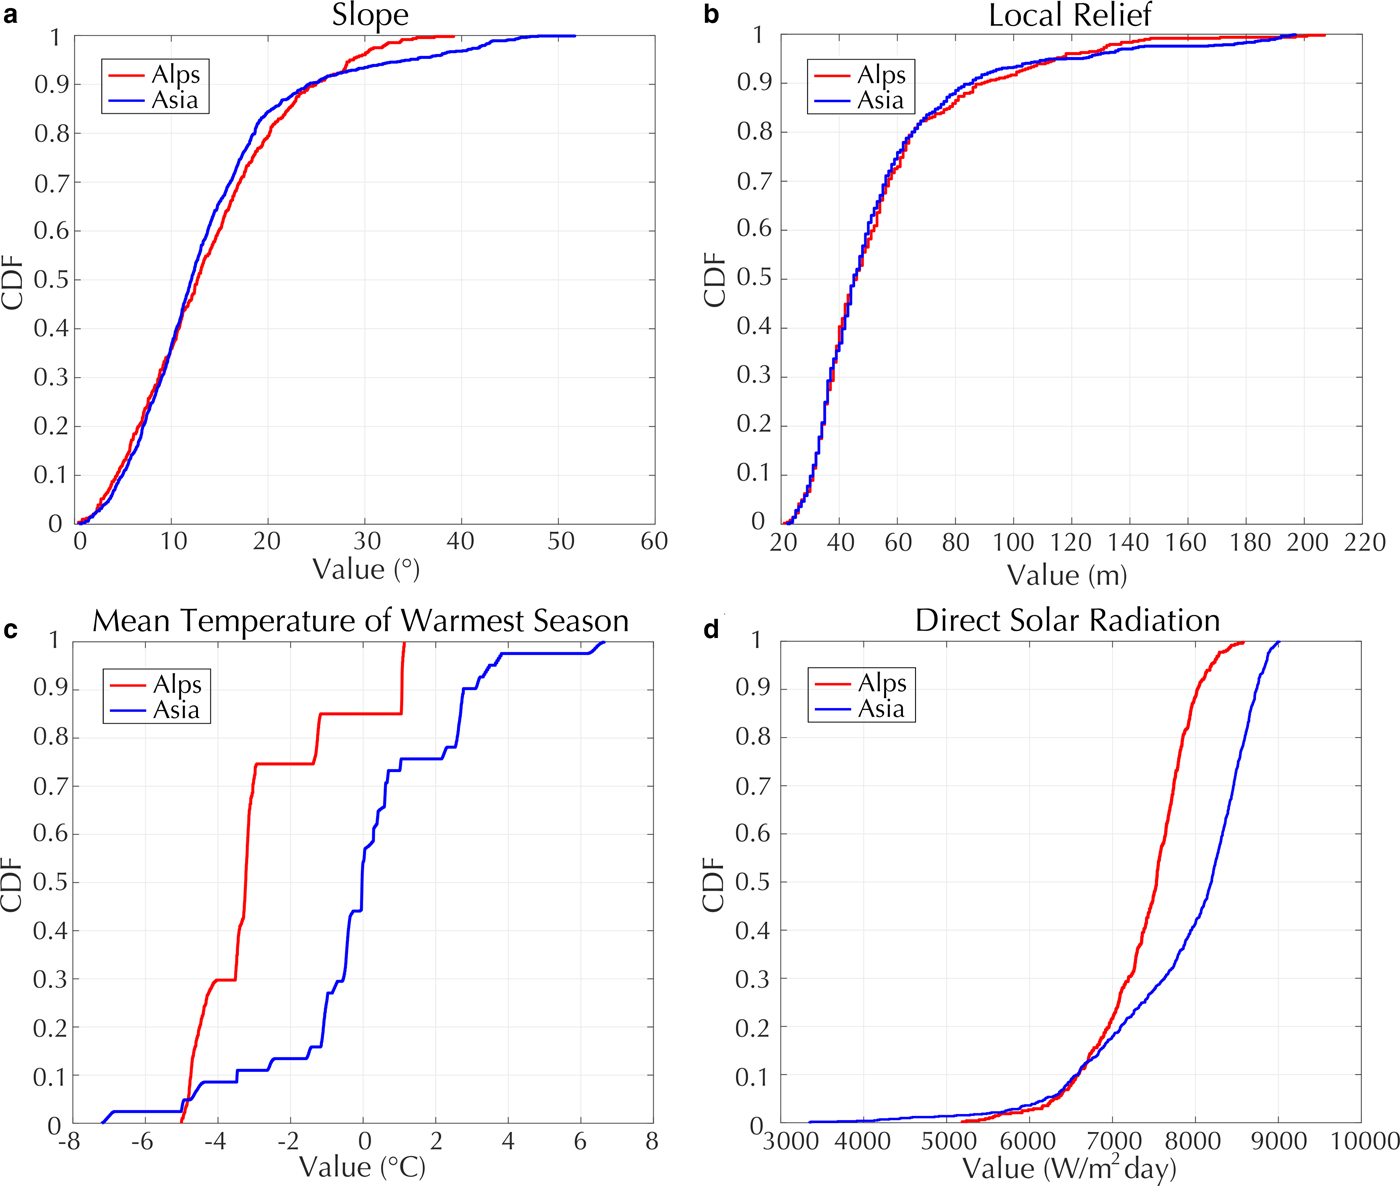
Figure 3 shows the CDF of each variable at the drilled sites. The curve enables us to determine which values characterize the drilled sites. Based on the CDF, each variable was divided into the same uniform intervals used in the WoE model (Table 3). CDF plots of slope and local relief show similar behaviour between the Alps and the Asian High Mountains, whereas some differences are present for mean temperature and direct solar radiation. Regarding the slope, we observe that 80% of the drilling sites are characterized by values lower than 20° (Fig. 3a). Local relief CDF shows that the drilled sites are mainly characterized by low values of local relief (Fig. 3b). Mean temperature of warmest season (Fig. 3c) in the drilled Alpine sites ranges from −4°C to 2°C, with 85% of the sites having a mean temperature lower than 0°C, while for the Asian glaciers the temperature CDF shifts to higher values ranging from −2°C to 4°C. Similar differences can be observed for direct radiation (Fig. 4d). These can be ascribed to geomorphological differences between the Alps and the Asian High Mountains. The latter, in fact, cover a broader altitudinal and latitudinal range, resulting in higher temperature and direct radiation than in the European Alps. These differences were considered in order to adjust the intervals used for these variables in the two study areas.
Cumulative distribution functions (CDF) of selected variables for Alps (red line) and Asia (blue line). The curves show the distribution of values of each variable at all the available drilling sites. (a) slope; (b) local relief; (c) mean temperature of warmest season; (d) direct solar radiation.
Focus of true colour Landsat 8 images (left column) and related suitability for ice-core drilling maps (right column) in Alpine and Asian regions. (a) Focus on Monte Rosa Massif (Col du Lys and Colle Gnifetti drilling site) in the European Alps; (b) WoE SICD map of Monte Rosa Massif; (c) Focus on Dasuopu and Yala glaciers in Himalaya; (d) WoE SICD map of Dasuopu and Yala glaciers. Green is associated with areas unsuitable for ice-core drilling, yellow and orange colours show moderate SICD, and red indicates potential drilling sites, corresponding to high values of suitability for ice-core drilling (0.7–1). Blue triangles show the locations of already drilled sites.

4.2. Weight definition
The results of the WoE are shown in Table 3. Variable intervals with negative weights are negatively associated with SICD, while positive values indicate that the identification of variables within the specified intervals favours ice-core drilling. Weights close to zero reveal a slight relation between the interval and SICD. Weight values between the Alps and the Asian region show good agreement. Low slope values (0–15°) have positive weights, indicating that these intervals are suitable for ice-core drilling, whereas values above 25° are negatively related with SICD. Local relief shows that values from 30 to 50 m are positively associated with SICD while high values (>70 m) are less favourable (negative weights) to ice-core drilling. The WoE model shows that areas more exposed to solar radiation evidence a positive relation with SICD. Finally, temperature is the most important variable with the highest weights for low-temperature values.
4.3. SICD maps and model evaluation
Figure 4 shows a focus of the SICD map on the Monte Rosa Massif (Central Alps) and on Dasuopu and Yala glaciers (Central Himalaya). Green colour indicates areas not suitable for ice-core drilling; yellow and orange colours evidence sites with moderate SICD; red indicates potential drilling sites corresponding to high values of SICD (i.e. 0.7–1). Blue triangles in the maps show the locations of already drilled sites.
Areas suitable for ice-core drilling, identified with red colour on the map, are mostly located in elevated flat areas, whereas southern-exposed glaciers and steep northern slopes are usually characterized by lower SICD values.
The evaluation of model performances was separately conducted for the two study areas. The mean values of SICD in the already drilled sites are equal to 0.75 and 0.70 in the Alps and in Asia, respectively. The RMSE values are 0.29 for the Alps and 0.35 for Asia. The AUC, representing the quality of the model to reliably fit the occurrence, assumes values of 95.86 in the Alps and 89.77 in the Asian region. More in detail, the success rate curve (Fig. 5) shows that 13% of the study area classified as more suitable for ice-core drilling (i.e. higher SICD values) contains 90% of the already drilled sites (red line) in the Alps, while, for the Asian High Mountains, 21% of the most suitable area contains 90% of the drilled sites (blue line).
Success-rate curves, area under the curve (AUC) values and root-mean-square error computed for the Alps (red line) and the Asian High Mountains (blue line).
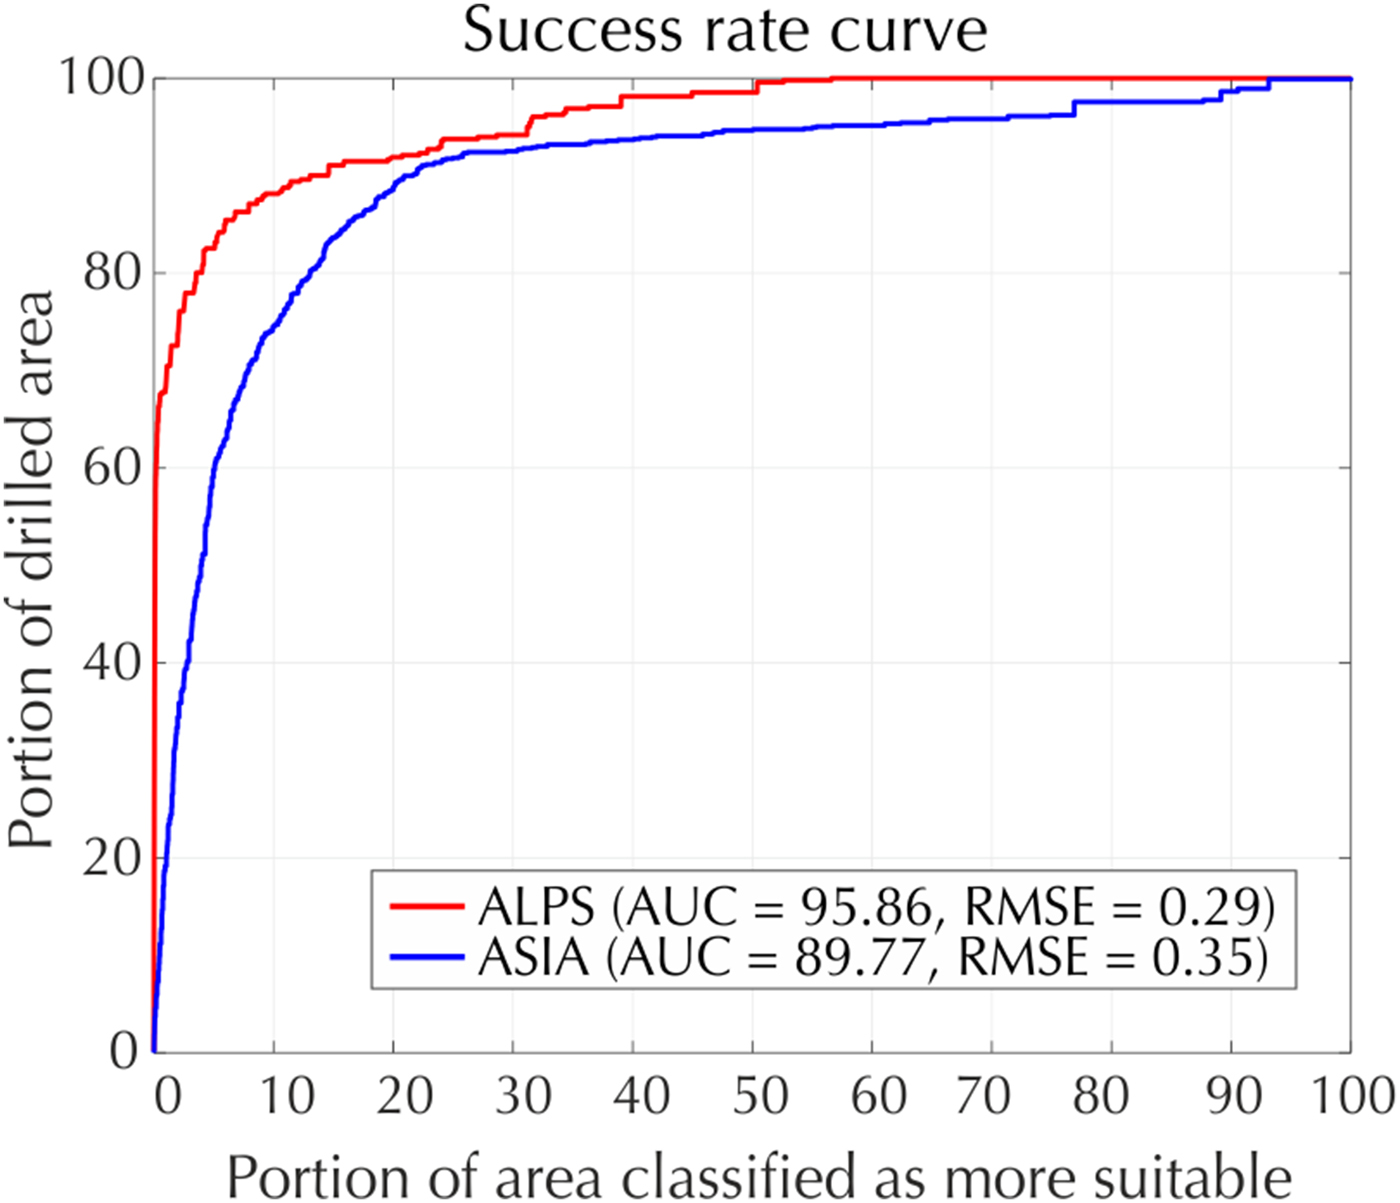
All these results suggest that the model performs well in both study areas, with slightly better performances in the Alps compared with the Asian mountains. In the European Alps, hotspots of high SICD values correspond to the areas where the already drilled sites are located. This result confirms that all the potential drilling sites have been already exploited in the Alps and allows to verify the reliability of the proposed method in providing SICD maps. In contrast, in the Asian region, hotspots of high SICD values are located both in correspondence to already drilled sites and in still unexplored areas, suggesting that several new potential drilling sites can be identified in the High Asian Mountains using the model proposed in this study.
As examples of potential drilling areas in the Asian High Mountains, Figure 6 shows true colour Landsat 8 images and the SICD map zoomed, respectively, in Central Himalaya (Fig. 6a), Karakoram (Fig. 6b) and Altay mountains in Tien Shan (Fig. 6c). Red colours indicate SICD values ranging from 0.7 to 1 and represent most suitable drilling areas.
True colour Landsat 8 images (left column) and maps of suitability for ice-core drilling (SICD) (right column) for the Asian High Mountains glaciers: (a) Central Himalaya, (b) Karakoram region and (c) Altay mountains in Tien Shan. The areas with drilling potential (blue dots) correspond to high values of SICD (red colours).

The proposed methodology combines morphometric and climatic variables that are globally and freely distributed from online repositories. Some limitations of the model could be caused by the accuracy of the ASTER G-DEM and RGI glacier outlines. ASTER G-DEM shows a vertical accuracy of ~15–30 m that can introduce errors in the morphometric variables. This product was chosen in order to have a global DEM with high spatial resolution. DEM artefacts (e.g. spikes, holes, etc.) can in principle affect the SICD analysis. We overcome this issue by considering an area of 9 × 9 pixels when calculating morphometric variables. Furthermore, when evaluating SICD maps, we considered as potential drilling sites only parts of the glacier characterized by a cluster of high SICD values.
Model inaccuracies can arise also from the use of the RGI dataset to define glacier outlines. Artefacts such as internal rocks or snow-covered bedrock are included in the RGI dataset. However, despite this limitation, the RGI was chosen because it is the most complete database of glacier outlines. Another limitation of our model is the possibility of identifying high SICD values in large ablation zones (e.g. see Fig. 6a for the Central Himalaya). To overcome these issues, the selection of potential drilling sites was supported by the inspection of optical satellite images.
Other variables, such as glacier thickness, snow accumulation, wind erosion and warming trend, can also have an effect on the SICD definition. They are not included in the model because they are not globally distributed. These variables should be further investigated at regional or local scale to support the accurate location of a drilling site within a suitable area. For example, glacier thickness is a very important variable because it is directly related to the stratigraphic resolution and it is traditionally explored using ground-penetrating radar soundings or with physical methods based on surface slope and driving stress (Hoelzle and others, Reference Hoelzle2007; Cuffey and Paterson, Reference Cuffey and Paterson2010).
4.4. Discussion of potential drilling sites
Glaciers with most potential for ice-core drilling were identified by summing SICD values higher than 0.7 for glacier polygons in the following geographic regions (Table 4): Central Himalaya, Hengduan Shan, East Himalaya, Hindu Kush, West Himalaya, Central Himalaya, Karakoram, Pamir, South and Est Tibet, Inner Tibet, East Kun Lun, East Tien Shan, West Kun Lun, West Tien Shan, Alps (Mt. Rosa), Alps (Bernina), Alps (Aletsch), Alps (Mt. Bianco) and Alps (Grossfiescherhorn). Table 4 shows also that our model performs well in the Alps, in fact the locations of potential drilling areas identified by the model reflect the position of already drilled sites.
Asian High Mountains and European Alps glaciers suitable for ice-core drilling as identified by summing SICD values higher than 0.7 within the RGI glacier polygons. Glaciers are ranked according to the sum of the SICD values

The SICD map highlights the presence of unexplored glaciers suitable for ice-core drilling in the Asian High Mountains that should be exploited in the next years for collecting fundamental climatic and environmental data. Figure 7 shows the location of the most suitable glaciers (blue dots) and the already drilled sites (red triangles) for each geographic region of the Asian High Mountains as defined in the RGI dataset.
Glaciers with the highest potential for ice-core drilling (blue dots), and position of the already drilled sites (red triangles) for each geographic region of the Asian High Mountains as defined in the RGI dataset.

Hereafter, we illustrate the usefulness of this approach by highlighting some specific areas in Asia evidenced by the SICD map (Fig. 7), which are expected to provide valuable scientific information. First of all, the realization of new drilling sites in the Himalayan glaciers could provide further insights on the activity of the Indian monsoon system (Benn and Owen, Reference Benn and Owen1998). This system showed a variation over the last decades corresponding to a decreasing trend in precipitation and snowfall and an increasing trend of temperatures over the Himalayan mountain ranges (Bhutiyani and others, Reference Bhutiyani, Kale and Pawar2007; Shekhar and others, Reference Shekhar, Chand, Kumar, Srinivasan and Ganju2010; Singh and Mal, Reference Singh and Mal2014). These variations are recorded in the ice-core stratigraphy (Zhisheng and others, Reference Zhisheng, Kutzbach, Prell and Porter2001; Kaspari and others, Reference Kaspari2007; Sinha and others, Reference Sinha2015). Some drillings have been performed in the Himalaya, but many sites should be exploited in the coming years. The glaciers are rapidly shrinking with an expected higher trend in the next years (Bolch and others, Reference Bolch2012; Kang and others, Reference Kang2015). Consequently, potential sites have the highest drilling priority if compared with the other Asian regions.
In easternmost parts of the Himalaya, other glaciers with drilling potential receive the contribution of the Southeast Asian air masses influenced by densely inhabited areas (i.e. China, India). New drilling sites in this region could thus provide valuable information on the effects of anthropogenic activities (i.e. emission of pollutants, aerosol, black carbon, soluble ions) and their impacts on the environment (e.g. glacier retreat and corresponding variation of seasonal fresh water supplies; Hong and others, Reference Hong2009; Xu and others, Reference Xu2009; Zhao and others, Reference Zhao, Xu, Yao, Tian and Li2011). These new climatic and environmental archives could be exploited to compare the anthropogenic emissions due to Asian emerging economies with the emissions coming from other industrialized regions (e.g. Europe or America; Duan and others, Reference Duan, Thompson, Yao, Davis and Mosley-Thompson2007; Kaspari and others, Reference Kaspari2009a, Reference Kasparib).
The western region of the Karakoram is poorly explored and, to date, only shallow ice cores (Wake, Reference Wake1989) and snow pits (Mayer and others, Reference Mayer2014) have been studied. In contrast to the Himalaya, the Karakoram range shows great potential in studying variations of winter precipitation in relation with the North Atlantic Oscillation (NAO) and the El Niño–Southern Oscillation (ENSO; Filippi and others, Reference Filippi2014; Cannon and others, Reference Cannon2016). NAO and ENSO were already detected from isotopic composition in several Tibetan Plateau ice cores (Joswiak and others, Reference Joswiak, Yao, Wu, Tian and Xu2013; Yang and others, Reference Yang, Joswiak and Yao2014; Du and others, Reference Du, Kang, Qin, Cui and Sun2016). In this context, ice-core records are fundamental for modelling the impacts of NAO and ENSO on regional and global circulation patterns (Kumar and others, Reference Kumar2015; Dixit and Tandon, Reference Dixit and Tandon2016). This is important because NAO and ENSO have strong effects on mid-latitude circulation patterns that impact large regions of the planet (Brönnimann and others, Reference Brönnimann, Xoplaki, Casty, Pauling and Luterbacher2006; Müller and Roeckner, Reference Müller and Roeckner2006; Donat and others, Reference Donat2014; Whan and Zwiers, Reference Whan and Zwiers2017). In addition, the Karakoram region shows a decreasing trend in maximum and minimum temperatures, together with an increase in winter precipitations. Glaciers exhibit evidences of expansion (i.e. the ‘Karakoram anomaly’) in contrast to a worldwide decline (Fowler and others, Reference Fowler, Archer, Fowler and Archer2006; Bolch and others, Reference Bolch2012; Gardelle and others, Reference Gardelle, Berthier and Arnaud2012). For this reason, they are less threatened by warming and they can provide more seasonal resolved records.
The climate of the Tibetan Plateau is dry and isolated from the other Asian regions (Kang and others, Reference Kang2010). This wide region is recognized to be a heat source during the summer season that drives both regional and general circulation (Ye and Wu, Reference Ye and Wu1998; Duan and Wu, Reference Duan and Wu2005). New ice cores can be useful for studying the regional recent warming (An and others, Reference An2016), or the mineral dust transport and deposition (Kang and others, Reference Kang2003). For example, atmospheric depositions of impurities (such as black carbon and mineral dust) can decrease the albedo of snow and ice promoting the melt (Qu and others, Reference Qu2014; Di Mauro and others, Reference Di Mauro2015). This process can be studied using ice cores to evaluate the possible impact on glacier albedo reduction (Xu and others, Reference Xu2009, Kaspari and others, Reference Kaspari2009a, Reference Kasparib).
Finally, air masses that flow from Siberia and Central Asia to the Tien Shan and Pamir Mountains characterize the continental climate of these northern regions (Aizen and others, Reference Aizen2006; Papina and others, Reference Papina2013). The glaciers with drilling potential in the Altay mountains and Tien Shan could be investigated in order to understand regional and large-scale transports of dust or pollutants related to regional economic activities (Kreutz and others, Reference Kreutz, Aizen, Cecil and Wake2001; Lee and others, Reference Lee, Qin, Jiang, Duan and Zhou2003; Grigholm and others, Reference Grigholm2016). The Pamirs Plateau is dominated by a relatively simple atmospheric circulation system (i.e. the westerlies); therefore, it can show remarkable differences compared with southern Tibetan Plateau or Himalaya (i.e. combined effects of westerlies and monsoon). This region can be an ideal location for obtaining robust proxy reconstructions of differences in past temperatures and circulation dynamics between the Asian regions (Aizen and others, Reference Aizen2006; Yu and others, Reference Yu2016).
5. CONCLUSIONS
Ice cores recovered from mid-latitude mountain glaciers are excellent archives for understanding recent climatic and environmental variability related to anthropogenic factors. From this point of view, they offer advantages if compared with polar ice cores. Documented rapid glacier retreat makes urgent the identification of new potential drilling sites. To date, the criteria for identifying suitable areas and choosing drilling sites have not been addressed quantitatively in the scientific literature.
In this work, we proposed a first step towards developing a methodology to assess the suitability of mountain glaciers for ice-core drilling, in order to collect ice cores with preserved stratigraphy. We optimized the WoE method for mapping the SICD of glaciers in unexplored areas. First, we created and evaluated the model in the European Alps, then we applied the methodology in the Asian High Mountains. The first maps of SICD were thus proposed. Useful indications for the selection of the next drilling sites were provided for the Asian High Mountains, underlining their scientific potential in studying regional climate variability, anthropogenic impacts and global climate circulations. Our results could be especially relevant in this unexplored area where little information is available and many potential drilling sites are still to be exploited. Our results also pave the way to the development of automatic classification methods to map the SICD in other poorly explored mountain ranges. In the future, the incorporation of other variables (e.g. glacier thickness, snow accumulation, wind erosion and warming trend) in the model will allow improving SICD estimations.
ACKNOWLEDGEMENTS
The present study was performed in the framework of the Project of Interest NextData: a national system devoted to assessing the effects of climate and environmental change in mountain areas. We thank G. Orombelli, B. Delmonte, G. Baccolo, M. Filipazzi, M. Mattavelli, M. Moretti (DISAT-UNIMIB, Italy) and all the Cryolist members that kindly compiled the questionnaire we created to initiate this research. We thank the anonymous reviewers and the Scientific Editor for their work and their useful comments and suggestions that helped us in improving the quality of the manuscript. The complete map of SICD map is accessible upon the request to the corresponding author.
AUTHOR CONTRIBUTIONS
RG and BDM performed the data analysis, developed the methodology and wrote the paper with the contribution of all the authors. MR and RC contributed to the interpretation of results. DS and MDA developed the Ice-Core Database and GIS implementations. VM was the project coordinator.


 Open access