

Introduction
The outcome of psychosis varies from recovery with minimal symptoms to persistent psychosis with substantial cognitive and functional deficits. Unfortunately, there is no predictor that identifies, at illness onset, which patients will subsequently develop a more severe illness course. Therefore, compared to other areas of medicine, psychiatry lags behind in terms of risk quantification that could guide patients' and clinicians' choices.
In the past decades, brain structure has been investigated using magnetic resonance imaging (MRI) as a potential predictor of outcome in psychosis (van Haren et al. Reference van Haren, Cahn, Hulshoff Pol, Schnack, Caspers, Lemstra, Sitskoorn, Wiersma, van den Bosch, Dingemans, Schene and Kahn2003, Reference van Haren, Hulshoff Pol, Schnack, Cahn, Brans, Carati, Rais and Kahn2008). However, neuroanatomical changes in psychosis are subtle and spatially distributed, although possibly more marked in the advanced illness stages (Ellison-Wright et al. Reference Ellison-Wright, Glahn, Laird, Thelen and Bullmore2008; Bloemen et al. Reference Bloemen, de Koning, Schmitz, Nieman, Becker, de Haan, Dingemans, Linszen and van Amelsvoort2010). As a result, the use of imaging has made little impact in clinical practice on the diagnosis and monitoring of psychoses in individual patients (Matthews et al. Reference Matthews, Honey and Bullmore2006).
More recently, classification methods have been applied to structural imaging data with encouraging results (Davatzikos et al. Reference Davatzikos, Fan, Wu, Shen and Resnick2008; Kloppel et al. Reference Kloppel, Stonnington, Chu, Draganski, Scahill, Rohrer, Fox, Jack, Ashburner and Frackowiak2008; Vemuri et al. Reference Vemuri, Gunter, Senjem, Whitwell, Kantarci, Knopman, Boeve, Petersen and Jack2008; Koutsouleris et al. Reference Koutsouleris, Meisenzahl, Davatzikos, Bottlender, Frodl, Scheuerecker, Schmitt, Zetzsche, Decker, Reiser, Moller and Gaser2009; Karageorgiou et al. Reference Karageorgiou, Schulz, Gollub, Andreasen, Ho, Lauriello, Calhoun, Bockholt, Sponheim and Georgopoulos2011; Kasparek et al. Reference Kasparek, Thomaz, Sato, Schwarz, Janousova, Marecek, Prikryl, Vanicek, Fujita and Ceskova2011). Among pattern-based classification algorithms, the support vector machine (SVM) is a pattern recognition technique that identifies multivariate statistical properties of the data that discriminate between groups of subjects, and has shown accuracies up to 86–91% in the correct distinction between patients with established schizophrenia and healthy controls (Fan et al. Reference Fan, Gur, Gur, Wu, Shen, Calkins and Davatzikos2008; Sun et al. Reference Sun, van Erp, Thompson, Bearden, Daley, Kushan, Hardt, Nuechterlein, Toga and Cannon2009). Although the application of SVM to the classification of patients and healthy controls has validity in research, it has limited clinical utility because the same or even better accuracy can be achieved through clinical interview alone. A more meaningful clinical application of these methods is in helping the identification of predictors of outcome. These could help direct, to more vulnerable individuals, the early implementation of targeted interventions that have been shown to reduce relapse rates, such as optimized pharmacological treatment, assertive case-management or family interventions, resulting in better clinical and functional outcomes (Malla et al. Reference Malla, Norman, Bechard-Evans, Schmitz, Manchanda and Cassidy2008; Larsen et al. Reference Larsen, Melle, Auestad, Haahr, Joa, Johannessen, Opjordsmoen, Rund, Rossberg, Simonsen, Vaglum, Friis and McGlashan2011).
In this study, we applied SVM methods to MRI data obtained at the first episode of psychosis, and related them to subsequent illness course type, to provide novel, methodologically sound, proof of concept that MRI can be used at illness onset to predict clinical outcome. Outcome was evaluated on the basis of having achieved symptom control, an important target in the treatment of schizophrenia (Selten et al. Reference Selten, Veen, Hoek, Laan, Schols, van der Tweel, Feller and Kahn2007).
To our knowledge, this is not only the first time that SVM has been used in patients with psychosis to predict clinical outcome but also the first time that it has been applied to MRI scans obtained at the first episode of psychosis, and using a straightforward processing pipeline of promise for application in clinical practice. This application is challenging for classification, as the differences observed at the first episode of psychosis are likely to be much more subtle then those observed in established schizophrenia (Ellison-Wright et al. Reference Ellison-Wright, Glahn, Laird, Thelen and Bullmore2008). We predicted that patients with the poorest course (continuously psychotic) could be distinguished both from those with the best course (episodic) and from healthy individuals, with a significant accuracy. In a secondary, exploratory analysis we investigated whether the pattern that best distinguished patients with a continuous course from those with an episodic course could also correctly predict which of the patients with an intermediate course would have developed further illness episodes after the first one.
Method
We recruited a cohort of 100 patients at their first presentation to psychiatric services with a functional psychotic illness (DSM-IV 295–298 psychotic codings; APA, 1994) and 91 healthy individuals with the same socio-economic background. The methods have been extensively described elsewhere (Dazzan et al. Reference Dazzan, Morgan, Orr, Hutchinson, Chitnis, Suckling, Fearon, Salvo, McGuire, Mallett, Jones, Leff and Murray2004, Reference Dazzan, Lloyd, Morgan, Zanelli, Morgan, Orr, Hutchinson, Fearon, Allin, Rifkin, McGuire, Doody, Holloway, Leff, Harrison, Jones and Murray2008). Written informed consent was obtained from all patients, and the study was approved by the local research ethics committee. At first presentation, we interviewed patients using the World Health Organization (WHO) Schedules for Clinical Assessment in Neuropsychiatry (SCAN) and made a diagnosis according to ICD-10 criteria (WHO, 1992a, b) by consensus in meetings with senior clinicians from the Institute of Psychiatry, in which all clinical information was presented. A total symptomatology score was obtained by summing the SCAN's individual symptom item scores according to the Wing & Sturt (Reference Wing and Sturt1978) procedure for the Present State Examination (PSE; Wing et al. Reference Wing, Cooper and Sartorius1974; Wing & Sturt, Reference Wing and Sturt1978). This was an appropriate model to adopt as the SCAN incorporates the 10th edition of the PSE. Information on antipsychotic drug dose (in chlorpromazine equivalents) and duration of exposure to antipsychotics was collected during face-to-face interviews, from clinical notes and from interviews with the clinical team.
Evaluation of outcome
Patients were re-evaluated 6.2 (s.d.=2.3) years later. Information on illness course was obtained using an amended version of the WHO Life Chart (Harrison et al. Reference Harrison, Hopper, Craig, Laska, Siegel, Wanderling, Dube, Ganev, Giel, an der Heiden, Holmberg, Janca, Lee, Leon, Malhotra, Marsella, Nakane, Sartorius, Shen, Skoda, Thara, Tsirkin, Varma, Walsh and Wiersma2001). This measure has been used successfully in previous long-term follow-up studies, and has been shown to be reliable in the assessment of clinical ratings (Susser et al. Reference Susser, Finnerty, Mojtabai, Yale, Conover, Goetz and Amador2000). We used the SCAN (WHO, 1992b) criteria to establish absence of psychotic symptoms during the follow-up period, in accordance with WHO and other long-term outcome studies (Jablensky et al. Reference Jablensky, Sartorius, Ernberg, Anker, Korten, Cooper, Day and Bertelsen1992). In line with Andreasen et al. (Reference Andreasen, Carpenter, Kane, Lasser, Marder and Weinberger2005), we used a 6-month period for establishing remission. The operational criteria used in the study to define a psychotic episode and remission are presented in the Appendix. From the Life Chart, we used illness course type as our primary clinical outcome measure. This was defined as either: continuous (no remission of symptoms of greater than 6 months); episodic (one or more period of remission of at least 6 months, and no episode of psychosis, including the first one, that lasted for 6 months or more); or intermediate (never achieved sustained periods of remission, but also never experienced psychotic symptoms for prolonged periods). We used a conservative approach for the identification of the pattern that best predicted outcome, and only included in the first stage of the SVM analyses patients with either an episodic or a continuous course, thought to best reflect good and poor clinical outcome respectively. In the second stage, we used this pattern to classify the intermediate patients and establish whether the pattern correctly predicted the occurrence of further episodes in this group, during the follow-up period.
Image processing
Images were acquired using a 1.5-T GE scanner (General Electric Medical Systems, USA), at the Maudsley Hospital, London. Tissue maps were produced from T1-weighted coronal images [1.5 mm slice thickness, in-plane resolution 0.9374×0.9374 mm2, repetition time (TR) 13.8 ms, inversion time (TI) 450 ms, echo time (TE) 2.8 ms, and flip angle 20°] using SPM5 (Wellcome Department of Cognitive Neurology, London, UK). Modulated plus warped [spatially normalized to Montreal Neurological Institute (MNI) space] gray-matter segments were created with a resliced final voxel size of 2×2×2 mm3, and finally smoothed with an 8-mm isotropic full-width at half-maximum (FWHM) Gaussian kernel.
Pattern classification analysis
Data representation
The modulated, warped and smoothed gray-matter images (probability maps) were used as input to the SVM classifier. A mask was applied including only gray-matter voxels in common for all subjects (healthy controls and patients with episodic, continuous or intermediate course). To create a common mask, we excluded voxels in the image that had a gray-matter probability value equal to zero for at least one subject.
SVM classification
The SVM is a pattern recognition approach that finds a decision function or boundary that enables classification. It is based on statistical learning theory (Vapnik, Reference Vapnik1995) and has emerged as a powerful classification tool. The SVM classifier is trained by providing examples of the form <x,c>where x represents a spatial pattern (e.g. gray-matter image) and c is the class label (e.g. c=+1 for patients and c=−1 for healthy controls). In the context of pattern classification, each brain image corresponds to a point in the input space, and each voxel in the image represents one dimension of this space. A hypothetical example of a classification problem in two-dimensional space is displayed in Fig. 1 a. The gray circles represent images of patients and the black circles represent images of healthy controls. The dashed lines represent possible separating hyperplanes. During the training phase, the SVM finds the hyperplane or decision function that separates the examples in the input space according to the group label (e.g. patient versus controls). Once the decision function is determined from the training data, it can be used to predict the group membership of a new test example (e.g. white squares, Fig. 1 b). The optimal hyperplane is described by a weight vector and an off-set. The weight vector is orthogonal to the hyperplane and corresponds to the most discriminating direction between the groups. The weight vector can be plotted as a brain image showing the relative importance of the voxels in discriminating the classes.
The support vector machine (SVM) classifier. (a) Illustration of a classification problem between two groups (patients versus controls) for the simplified case of only two voxels. Each brain image (e.g. gray-matter map) corresponds to a point in the input space and each voxel in the image represents one dimension of this space. The gray circles represent the images of patients and the black circles images of healthy controls. The dashed lines represent hyperplanes or decision boundaries that separate the groups. (b) Illustration of the optimal hyperplane determined by the SVM algorithm. The optimal hyperplane (dashed line) is the one with the largest margin of separation between the two classes or groups. The symbols at the margin (circled) are the support vectors. During the training phase the SVM finds the optimal hyperplane or decision boundary. During the test phase the decision boundary can be applied to classify new examples (white squares). The optimal hyperplane is described by a weight vector and an off-set.
In this study we exclusively used a linear kernel SVM to reduce the risk of overfitting the data and to allow direct extraction of the weight vector as an image (the SVM discrimination map). The linear SVM has only one parameter (C) that controls the trade-off between having zero training errors and allowing misclassifications. This was fixed at C=1 for all cases (default value). It has been shown previously that the SVM performance for whole-brain classification does not change for a large range of C values and only degrades with very small C values (LaConte et al. Reference LaConte, Strother, Cherkassky, Anderson and Hu2005). This is because there are more dimensions than examples (i.e. more voxels than brain scans). However, in cases where the dimensionality of the data is smaller than the number of examples (e.g. classification based on small regions of interest), it is necessary to use a cross-validation procedure to find the optimal C value. The pattern classification analyses were performed using the PROBID toolbox (www.brainmap.co.uk/probid.htm).
Cross-validation
We trained each classifier independently (continuous versus episodic, continuous versus healthy controls, episodic versus healthy controls). Therefore, each contrast had a different classifier, only used in that contrast. The performance of each classifier was then validated with the commonly used leave-two-out cross-validation approach, which provides a relatively unbiased estimate of the true generalization performance (Ecker et al. Reference Ecker, Rocha-Rego, Johnston, Mourao-Miranda, Marquand, Daly, Brammer, Murphy and Murphy2010). In each trial, observations from all but one subject from each group were used to train the classifier. Subsequently, the class assignment of the test subjects was calculated during the test phase. This procedure was repeated S times (S=number of subjects per group), each time leaving out observations from a different subject from each group. The accuracy of the classifier was estimated from the proportion of images correctly classified in both groups, and calculated as the average value of sensitivity and specificity (percentage of test examples from both classes correctly classified). The sensitivity and specificity of the classifier were defined as: sensitivity=TP/(TP+FN) and specificity=TN/(TN+FP), where TP=true positives (proportion of images of group 1 correctly classified); TN=true negatives (proportion of images of group 2 correctly classified); FP=false positives (proportion of images of group 2 classified as group 1); and FN=false negatives (proportion of images of group 1 classified as group 2).
Permutation test
Permutation testing was used to derive a p value for the accuracy of each classifier. Here, we permuted the class labels 1000 times (randomly assigning continuous and episodic labels to the training subjects) and repeated the cross-validation procedure. We then calculated the number of times in which the specificity (percentage of true negative) and sensitivity (percentage of true positive) for the permuted labels were higher than those obtained for the real labels. Dividing this number by 1000 we derived a p value for the classification accuracies.
Applying the SVM classifier to a new sample
In the second stage, the classifier obtained in the continuous versus episodic classification was used to classify patients with the intermediate course. In this phase we explored whether these patients were classified as continuous if they had developed further episodes of illness after the first one, or episodic if they had not developed additional episodes.
Discriminating maps (SVM weight vector)
The SVM weight vector is a linear combination or weighted average of the support vectors, that is the training examples that are the most difficult to separate. The weight vector is therefore a spatial representation of the decision boundary. Every voxel contributes with a certain weight to the decision boundary or classification function. Given a positive and a negative class (e.g. +1=episodic group, −1=continuous group), a positive weight for a voxel would indicate that the weighted average in that voxel was higher, for example, for the episodic group, whereas a negative weight would indicate that the weighted average was higher for the continuous group (Mourao-Miranda et al. Reference Mourao-Miranda, Bokde, Born, Hampel and Stetter2005).
The SVM classifiers are multivariate techniques (therefore, they take into account spatial correlations in the data) and because the discrimination is based on the whole brain pattern, rather than on individual regions, all voxels contribute to the classification and no local inferences based on these approaches should be made. We present a list of regions with relatively higher contributions to the decision function or classification. We selected the peaks of the SVM weight vector for each classifier, setting the threshold value to 30% of the maximum (absolute) weight value, and estimated the anatomical regions (cluster peaks) that most contributed to the classifier in the discrimination between groups.
Results
From the original cohort, 30 patients developed a continuous course, 35 an episodic course, and 35 an intermediate course. We excluded nine scans because of poor image acquisition and/or motion artifact. In the first stage of the SVM analysis, we compared 28 subjects with a continuous course, 28 with an episodic course, and 28 healthy volunteers [mean age 25.7 (s.d.=5.6) years; 14 males] of similar age. We then included in the analysis 32 subjects with an intermediate illness course type. Sociodemographic and clinical characteristics of the patient groups are described in Table 1. The mean duration of follow-up was 6.2 (s.d.=2.3) years. There were more subjects with a baseline diagnosis of schizophrenia spectrum psychosis (schizophrenia, schizophreniform disorder, schizo-affective disorder) in the continuous (71%) and intermediate (66%) groups than in the episodic group (43%, p=0.07). The difference increased further when diagnosis was confirmed at follow-up (continuous 86%, intermediate 75%, episodic 25%, p<0.01).
Sociodemographic and clinical characteristics of the patients included in the analyses

MRI, Magnetic resonance imaging; n.s., not significant.
Values given as percentage or mean ± standard deviation.
a Change in diagnosis over follow-up does not simply reflect an increase in one diagnostic group and a decrease in another one, but a change in both directions, with approximately 45% of patients changing diagnosis at follow-up.
b Information missing for nine subjects.
c Information missing for 10 subjects.
The first stage of the SVM analysis showed that, at baseline, patients with a future continuous course could already be distinguished, with accuracies above chance level, both from patients with a future episodic course (accuracy=70%; 71% correctly classified as continuous; p=0.004) and from healthy individuals (accuracy=67%; 71% correctly classified as continuous; p=0.01) (Table 2). By contrast, patients with an episodic course were not significantly distinguished from healthy individuals (accuracy=54%).
Results of the support vector machine (SVM) classification
The results are give for the SVM classification in two classes: ratio of true positive (sensitivity), true negative (specificity), accuracy and statistical probability. The first column shows the groups of subjects considered in each classification. The second column shows the percentage of subjects in the first group correctly classified as pertaining to it (sensitivity). The third column shows the percentage of subjects in the second group correctly classified as non-pertaining to the first group (specificity). The fourth column shows the accuracy (arithmetic mean between sensitivity and specificity). The last column shows the statistical probability that the result has been obtained by chance. It was obtained after 1000 permutations within the subjects. The number of subjects considered in each classification was 56 (28 in each group).
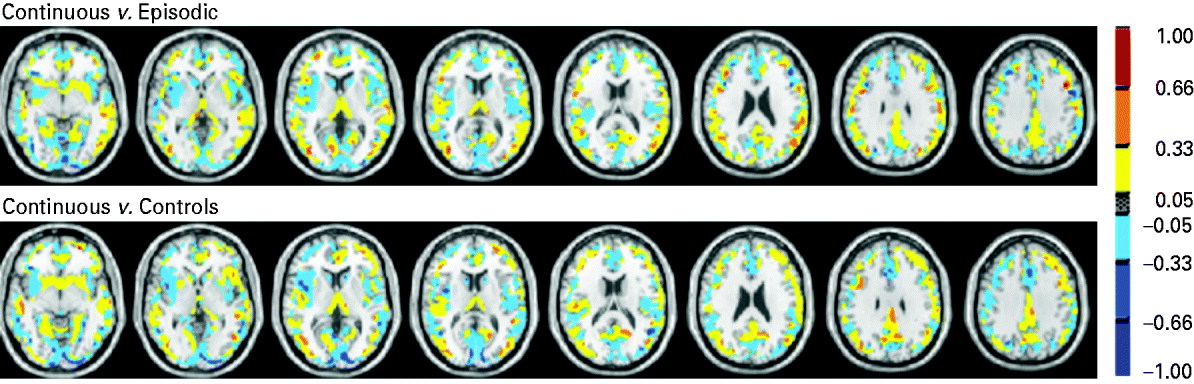
The anatomical regions with the highest contribution to the discrimination of the continuous group from the episodic and the healthy control groups included the cingulate and parahippocampal gyri, basal ganglia and thalami (Fig. 2, Tables 3 and 4).
List of the most discriminating regions (cluster peaks) for the classifier episodic versus continuous
x, y, z are Talairach coordinates of the cluster peaks selected using 3Dclust in AFNI (http://afni.nimh.nih.gov/afni). The regions were estimated using the software Talairach Client (www.talairach.org/).
List of the most discriminating regions (cluster peaks) for the classifier continuous versus healthy individuals
x, y, z are Talairach coordinates of the cluster peaks selected using 3Dclust in AFNI (http://afni.nimh.nih.gov/afni). The regions were estimated using the software Talairach Client (www.talairach.org/).
In the second and final stage of the analysis we classified patients with an intermediate course according to the discriminating pattern obtained in the episodic versus continuous analysis. We found that 78% of those who did not go on to develop other episodes were classified as episodic, and 65% of those who developed further episodes were classified as continuous (sensitivity=65; specificity=78; accuracy=72%; p=0.035). These results indicate that, as expected, training the classifier to discriminate the two ‘extreme’ groups (continuous versus episodic) identifies a pattern that provides information useful to classify the remaining patients.
Discrimination map or support vector machine (SVM) weight vector: continuous versus episodic course (top), continuous course versus healthy individuals (bottom). The colours represent the weight of each voxel in the classification function (the red scale represents positive weights and the blue scale represents negative weights). The SVM weight vector is a linear combination or weighted average of the support vectors, that is the training examples that are most difficult to separate and define the decision boundary. The weight vector is therefore a spatial representation of the decision boundary. Every voxel contributes with a certain weight to the decision boundary or classification function. Given a positive and a negative class (e.g. +1=episodic group; −1=continuous group), a positive weight for a voxel means the weighted average in that voxel was higher for the episodic group, and a negative weight means the weighted average was higher for the continuous group. Because the classifier is multivariate by nature, the combination of all voxels as a whole is identified as a global spatial pattern by which the groups differ (the discriminating pattern). Therefore, the discrimination map should not be interpreted as a standard statistical parametric map resulting from a mass-univariate statistical test to find group differences, and no local inferences should be made based on the SVM weights.
Discussion
To our knowledge, this is the first study to investigate whether spatially distributed information in brain tissue data, obtained at the first presentation of psychosis, can potentially be used to predict subsequent illness course type at the individual level. The study provides proof of concept that MRI can be used as a tool for the prediction of illness course. Our findings suggest that at the time of first presentation, patients who will subsequently develop a continuous illness course may be already distinguished, above chance level, from those who will develop an episodic course, using a classifier trained only on patient groups. By contrast, patients with a future episodic course cannot be distinguished from healthy individuals. Finally, our findings provide preliminary evidence that, even for patients with a ‘less extreme’ (or intermediate) type of outcome, it is possible to predict, to a certain extent, who will develop further episodes and who will be less likely to do so.
Although significant, the accuracy with which we have correctly classified patients is lower than that reported in other studies that have used SVM (Fan et al. Reference Fan, Gur, Gur, Wu, Shen, Calkins and Davatzikos2008; Sun et al. Reference Sun, van Erp, Thompson, Bearden, Daley, Kushan, Hardt, Nuechterlein, Toga and Cannon2009). Of note, these studies have applied SVM to patients with an established illness, rather than at first episode, and have used SVM to define subject status (patient versus control) rather than future illness course. It is possible that, as more marked and distributed brain changes occur with illness progression (Ellison-Wright et al. Reference Ellison-Wright, Glahn, Laird, Thelen and Bullmore2008), the classification and distinction between patients and healthy individuals becomes more accurate in later illness stages. Interestingly, a study that applied SVM to the early detection of different at-risk mental states for subthreshold psychotic symptoms reported accuracies lower than those reported in patients with established schizophrenia (Koutsouleris et al. Reference Koutsouleris, Meisenzahl, Davatzikos, Bottlender, Frodl, Scheuerecker, Schmitt, Zetzsche, Decker, Reiser, Moller and Gaser2009). Consistent with our finding, a study that used a different classification approach to predict 1-year outcome in first-episode psychosis patients also reported an accuracy similar to the one we observed (Kasparek et al. Reference Kasparek, Thomaz, Sato, Schwarz, Janousova, Marecek, Prikryl, Vanicek, Fujita and Ceskova2011). Nevertheless, the better classification we found in individuals destined to develop a continuous illness course suggests that significant brain changes have already occurred by the time of first contact in this subgroup.
Although, with these methods, it is not possible to make local inferences on the discriminating regions, it is noteworthy that the anatomical regions with the highest contribution to the discrimination between groups include the cingulate and parahippocampal gyri, the basal ganglia and the thalami, which have been consistently reported as important in the pathophysiology of schizophrenia (Ellison-Wright et al. Reference Ellison-Wright, Glahn, Laird, Thelen and Bullmore2008).
Our study should be taken as preliminary, but it proposes a promising approach for the future translation of imaging into patient benefit. Although our approach requires replication and validation in a larger sample, it provides initial evidence of an easy and accessible methodology that could potentially enable rapid clinical decisions. We believe that future development should consider that, although a better classification accuracy could potentially be achieved with feature selection approaches preceding the SVM classifier, this would involve applying cross-validation pipelines that are time-consuming, calculation intensive and/or methodologically challenging. Such approaches can be useful in the research setting but might not enable a rapid and user-friendly assessment of patients' prognosis. Furthermore, there is at present no conclusive evidence that feature selection increases the accuracy for MRI-based diagnosis, while substantially increasing computation time without improving classification performance (Cuingnet et al. Reference Cuingnet, Gerardin, Tessieras, Auzias, Lehericy, Habert, Chupin, Benali and Colliot2011). Therefore, we have preferred here a whole brain approach, which has stronger potential for future applicability in the clinical setting. Once the SVM classifier is trained and a decision function is generated, a new example could be classified in minutes. The pipeline we used includes pre-processing of the structural images using standard neuroimaging software (SPM), extraction of a feature vector containing gray-matter values, and application of the SVM decision function to the feature vector. Moreover, the greater the complexity of the method (i.e. the number of steps in the pipeline), the greater the danger of overfitting the data. By contrast, maintaining a simple pipeline improves the translational potential of the method, as such a technique will be more likely to be incorporated into routine clinical investigations, because a structural MRI can be obtained in 10 minutes.
In psychiatry, clinicians do not have algorithms to quantify the risk of, for example, occurrence of further episodes, which could help in guiding clinical decisions. Such algorithms are of common use in other areas of medicine, such as heart medicine and oncology. Our results offer preliminary evidence that, once further developed and validated, an SVM approach could in the future be used by a psychiatrist to say, for example, that on the basis of the MRI scan, a patient may have 88% probability of having more illness episodes (positive predictive value: in this example, it is calculated as the proportion of intermediate subjects who went on to experience repeated episodes and who were classified as continuous by the SVM classifier), thus providing more information on which to base therapeutic decisions. This would imply applying risk quantification in psychiatry, something that has not yet been achieved. Furthermore, the quantification could improve even further and be refined if other factors related to outcome, such as duration of untreated psychosis, were taken into account in a decision tree.
As mentioned earlier, our study is preliminary and the findings should be considered with caution. An important limitation is the relatively small sample size. In addition, future work should consider validating the accuracy of our classifier with an independent larger sample of patients classified according to the same illness course criteria. Finally, as this study used data from a single site, it remains unclear to what extent differences in acquisition protocol or scanners affect the accuracy of the classifier. Nevertheless, it is encouraging that the classifier trained in using the two extremes groups of patients (i.e. episodic versus continuous) could be successfully applied to classify the intermediate group of patients. Future studies with multi-site images will allow an investigation of the extendibility of the approach to images from different sites.
Ultimately, once developed, these methods could allow a patient to be assigned to targeted assertive case-management at first presentation to services, with optimized pharmacological treatment, cognitive and family interventions, which have been shown to improve treatment adherence and reduce relapse rates (Malla et al. Reference Malla, Norman, Bechard-Evans, Schmitz, Manchanda and Cassidy2008; Eack et al. Reference Eack, Pogue-Geile, Greenwald, Hogarty and Keshavan2010), eventually improving outcome. At the same time, those patients most likely to have a good remitting illness after their first episode could avoid long-term exposure to antipsychotic medication. We propose that, with further development and validation on larger datasets, a simple and automated SVM pipeline offers a promising approach to help rapid and early clinical decisions based on imaging data, which will eventually benefit patient care and reduce health-care costs.
Appendix
The operational definition of a ‘psychotic episode’
A psychotic episode is a period of symptomatology in which the presence of at least one of the following symptoms can be ascertained:
Group A
1. Hallucinations or pseudo-hallucinations in any modality.
2. Delusions.
3. Marked thought and speech disorder (e.g. incoherence, irrelevance, thought blocking, neologisms, incomprehensibility of speech) other than simple retardation or acceleration.
4. Marked psychomotor disorder (e.g. negativism, mutism or stupor, catatonic excitement, constrained attitudes or unnatural postures maintained for long periods) other than simple retardation or acceleration.
5. Emergence or marked exacerbation of bizarre and grossly inappropriate behavior (e.g. talking or giggling to self, acts incomprehensible to others, loss of social constraints, etc.).
A psychotic episode may be considered as present also in the absence of the manifest symptoms listed in Group A if at least two of the following behaviors have emerged or become markedly exacerbated:
Group B
1. Marked reduction or loss of interest, initiative and drive, leading to serious deterioration of the performance of usual activities and tasks.
2. Emergence or marked exacerbation of social withdrawal (active avoidance of communication with other people).
3. Severe excitement, purposeless destructiveness or aggression.
4. Episodic or persistent states of overwhelming fear or severe anxiety.
5. Gross and persistent self-neglect.
The operational definition of a ‘remission’
A remission is a state following a psychotic episode, in which none of the symptoms listed as characteristics of a psychotic episode are present. During a remission a patient may exhibit a variety of non-psychotic symptoms (e.g. depressed mood, neurotic manifestations) or some of the so-called negative symptoms, or be entirely symptom free (incomplete or complete remission). A rating of remission (and also a rating of a psychotic episode) should be based only on the ascertainable absence (or presence) of psychotic symptoms and not on whether or not the patient is taking any psychotropic medication or whether or not he/she is hospitalized. The absence of psychotic symptomatology would qualify as a remission only if it lasts for 6 months.
Acknowledgements
We acknowledge the contributions of the entire ÆSOP study team. This study was partially funded by the National Institute for Health Research (NIHR) Biomedical Research Centre for Mental Health at the South London and Maudsley National Health Service (NHS) Foundation Trust and the Institute of Psychiatry, King's College London. Funding was also provided by the UK Medical Research Council and a National Alliance for Research on Schizophrenia and Depression (NARSAD) Young Investigator Award to P. Dazzan. We thank the Stanley Medical Research Institute for their support. P. Dazzan's research is also supported by the BIAL Foundation. J. Mourao-Miranda is funded by a Wellcome Trust Career Development Fellowship. A. A. T. S. Reinders is supported by the Netherlands Organization for Scientific Research (www.nwo.nl), NWO-VENI grant no. 451-07-009.
Declaration of Interest
None.


 Open access