




Introduction
In 2024, an estimated 255.9 million antibiotics were prescribed for outpatients in the United States, including more than 50 million prescriptions to children. 1 The frequent and sometimes inappropriate use of antibiotics leads to antibiotic resistance, which is now considered a top threat to global health and contributes to millions of deaths worldwide each year. Reference Naghavi, Ikuta and Swetschinski2 In addition, antibiotics are often associated with adverse events, including Clostridioides difficile infection, gastrointestinal distress, allergic reactions, acute kidney injury, and the need for further healthcare. Reference Tamma, Avdic, Li, Dzintars and Cosgrove3
A core principle of antibiotic stewardship is reducing unnecessary antibiotic prescribing. Reference Barlam4 Antibiotic stewardship programs review antibiotic prescribing to inform quality improvement efforts. Tools leveraging electronic health records have the potential to efficiently review large data sets and supplement (or replace) more traditional, manual stewardship tasks. An influential study using billing codes from a large administrative database concluded that 30% of outpatient antibiotic prescribing in the United States was inappropriate. Reference Fleming-Dutra, Hersh and Shapiro5 This study divided diagnosis codes into “tiers” to classify antibiotic prescribing for both adults and children based on expert opinion: Tier 1 indicating conditions for which antibiotic use was almost always appropriate; Tier 2 where antibiotic use is sometimes appropriate; and Tier 3 where antibiotic use is almost never appropriate. This algorithm generation and estimation of appropriate antibiotic prescribing based on national guidelines was done by 24 experts specializing in antibiotic use across a range of settings including pediatric and adult infectious diseases, primary care, emergency department, otolaryngology, clinical pharmacy, epidemiology, public health, and antibiotic stewardship. Reference Fleming-Dutra, Hersh and Shapiro5 This classification schema has been used in dozens of studies across the age spectrum to quantify inappropriate antibiotic prescribing and assess the effectiveness of antibiotic stewardship initiatives, typically based on the rate of antibiotic prescribing for Tier 3 encounters. Reference Blanco, DePorre and Mayne6–Reference Hannan, Draper, Uecker-Bezdicek, Gomez-Urena and Jensen10 However, this code-based algorithm has not been validated. This study aimed to evaluate the performance of the Tier 3-based algorithm in pediatric patients cared for in the outpatient setting.
Methods
Study design and setting
This retrospective validation study utilized encounters between January 1 and December 31, 2024 in the Children’s Hospital of Philadelphia (CHOP) Care Network, which contains 32 academic and community-based primary care practices, 4 urgent care centers, and 2 emergency departments serving a diverse population of more than 300,000 children with more than 1 million annual encounters. 11 All practices use the EpiCare electronic health record (EHR) for all documentation and antibiotic prescribing. The CHOP institutional review board approved this study and granted a waiver of consent.
Study population
Primary care sick visits, urgent care, and emergency department encounters that did not result in admission were included in this study if they occurred between January 1, 2024, and December 31, 2024. Encounters that occurred within 30 days of a subject previously receiving antibiotics were excluded to capture the initial decision point for antibiotic prescriptions and avoid bias from treatment failure/switching antibiotics (Figure 1).
Flow diagram for cohort development, tier classification and sampling for manual chart review.

Figure 1. Long description
The flowchart begins with total encounters of 596270. It then splits into qualified encounters of 272698 and excluded encounters of 323572 due to prior antibiotics prescription within 30 days. Qualified encounters are further divided into Tier 1 with 30663 encounters, Tier 2 with 111054 encounters, and Tier 3 with 130981 encounters. Each tier shows encounters with antibiotics: Tier 1 has 26996, Tier 2 has 78142, and Tier 3 has 10370. Tier 3 encounters with antibiotics undergo chart review, resulting in 171 appropriate and 129 inappropriate antibiotic prescriptions.
Data source and variables
Data were extracted on July 8th, 2025, and collected and managed using the Arcus platform maintained by CHOP. 12 For each qualifying encounter, all associated International Classification of Diseases, Tenth Edition (ICD-10) codes were abstracted as were all systemic antibiotics administered enterally or through the intramuscular route. Encounter location was classified as primary care, urgent care, or emergency department. Basic demographic information including sex, race, ethnicity, age, and insurance payer type (public or private) was abstracted for each patient encounter. Patient-specific geocodes were used to calculate child opportunity index. Reference Noelke, McArdle, DeVoe, Leonardos, Lu, Ressler and Acevedo-Garcia13 Data were analyzed from July to September 2025.
Validation strategy
Using the previously described algorithm, each encounter was assigned an antibiotic tier classification of 1 (almost always appropriate), 2 (sometimes appropriate), or 3 (almost never appropriate) based on ICD-10 codes. Reference Fleming-Dutra, Hersh and Shapiro5,Reference Noelke, McArdle, DeVoe, Leonardos, Lu, Ressler and Acevedo-Garcia13 Encounters with more than one ICD-10 code were assigned to the highest tier level present to justify antibiotic prescribing. For example, if a code for pneumonia (Tier 1) was assigned together with a code for headache (Tier 3), the encounter would be assigned to Tier 1. Encounters in each tier were then sub-categorized based on whether an antibiotic was prescribed. Manual chart review focused on Tier 3 encounters associated with antibiotic prescriptions to reflect typical use of the algorithm in published studies, which used the prevalence of antibiotic prescribing for Tier 3 conditions as a measure of inappropriate antibiotic prescribing.
To validate the performance of the algorithm, manual chart review, the gold standard for determining appropriateness, was conducted on a random sample of Tier 3 encounters associated with antibiotic prescriptions using standardized criteria (Supplementary Table 1). Diagnostic categories for performance evaluation were generated by identifying the most common diagnoses (ICD-10 codes) observed in the study cohort (e.g., pneumonia, UTI, injury). EHR data elements used for determination of prescribing appropriateness included the History of Present Illness, Physical Exam, and Assessment and Plan sections of clinician notes, as well as laboratory studies and imaging reports. A sample subset of charts in each category was assessed to standardize the chart review process across 3 reviewers (SR, JG, TJ). Finally, criteria for assessing antibiotic appropriateness were created for each disease guided by CHOP Care Pathways and clinical practice guidelines from the American Academy of Pediatrics, the Infectious Diseases Society of America, the American Academy of Family Physicians, and/or the Centers for Disease Control and Prevention (Supplemental Table 1). Reference King, Lovegrove and Shehab14–Reference Wellbery33 All criteria were reviewed by 2 pediatric infectious diseases attending physicians (JG, TJ).
A stratified random sample of 300 Tier 3 encounters with antibiotic prescriptions was selected: 100 each from primary care (PC), urgent care (UC), and emergency department (ED) settings. For each encounter, manual chart review was performed to determine whether the antibiotics were inappropriate based on the disease-specific criteria outlined above or if the encounter would be more accurately classified as Tier 1 or 2 (indicating misclassification of the original Tier 3 coding). The results of this chart review were recorded in a REDCap database. All encounters were independently reviewed by the lead author (SR) and an infectious diseases clinician (TJ). Any discrepancies were evaluated by an additional infectious diseases clinician (JG) for final determination.
To determine which criteria to utilize for evaluating antibiotic appropriateness for a specific encounter, we used a multi-step approach (Figure 2). First, if a clinician documented a stated diagnosis that warranted antibiotics (e.g., pneumonia), the encounter was evaluated based on the criteria for that diagnosis. However, if the clinician specified a diagnosis that, by local and national guidelines, did not warrant antibiotics (e.g., bronchitis), it was considered inappropriate. If there was no stated indication, we reviewed the History of Present Illness, Physical Exam, Assessment and Plan, laboratory studies, and imaging reports to determine if the encounter fit into a diagnosis (or multiple diagnoses) for which antibiotics were warranted. For example, if the ICD-10 code for an encounter was R05.9 (cough), it would be evaluated using pneumonia criteria if (1) the clinician specified they were treating for pneumonia or (2) there was no stated indication but other data elements of the note had findings consistent with predetermined pneumonia criteria (i.e., 2 or more of the following: positive chest x-ray, cough or fever, tachypnea or shortness of breath, crackles or rhonchi on exam). Therefore, if this manual chart review determined that the encounter met pneumonia criteria (a Tier 1 diagnosis), antibiotics for this encounter were assigned as appropriate. Some encounters were evaluated using multiple sets of criteria (pneumonia and pertussis) to provide the opportunity for a complete assessment of all possible indications for antibiotic prescribing that might not be reflected in a billing code. After chart review data were collected, we analyzed the number of encounters and the percent appropriateness for each age group overall and for the most common diagnoses in each tier.
Overall sequence of procedures for validation of appropriateness of antibiotic prescribing for tier 3 encounters.

Figure 2. Long description
The flowchart begins with an encounter and checks if there is a stated reason for antibiotics. If yes, it compares the stated reason to national clinical practice guidelines. If the stated reason warrants antibiotics, it is considered appropriate; otherwise, it is considered inappropriate. If there is no stated reason, the chart is reviewed to identify the most appropriate criteria. If the encounter meets these criteria, it is considered appropriate; otherwise, it is considered inappropriate.
Watchful waiting is a stewardship initiative involving waiting 48–72 hours before starting antibiotics to see if the infection improves on its own. As a secondary analysis, watchful waiting was tracked during chart review based on either using the term “watchful waiting” or describing this process in the note. This analysis was conducted independent of which criteria were used and whether the antibiotics were considered appropriate.
Statistical methods
We first described the demographic characteristics of all qualified encounters in the study cohort across health care settings (primary care, urgent care, and emergency department). Subsequently, 300 encounters were selected as specified above, after which we estimated the proportion of appropriate antibiotic prescriptions overall, as well as by age group and by health care setting.
Inter-rater agreement between two independent reviewers in classifying antibiotic appropriateness was evaluated using Cohen’s Kappa with a corresponding 95% confidence interval. Because the validation sample was obtained using stratified random sampling with equal allocation of 100 encounters per care setting, we used survey-weighted methods for analyses that required estimates representative of the underlying cohort of Tier 3 encounters with an antibiotic prescription (e.g., overall and subgroup estimates of antibiotic appropriateness and positive predictive value (PPV)). The survey methods incorporated design weights to account for differential probabilities of selection and stratification by care setting. Design weights were defined as the number of eligible encounters in each setting divided by the number of reviewed charts in that setting, and survey procedures (e.g., the svydesign and svymean functions in the survey package in R software) were used to incorporate these weights and the stratified design.
For descriptive summaries of the 300-chart validation sample (e.g., diagnosis distributions and watchful waiting patterns), we reported unweighted counts and percentages.
Because antibiotic prescribing for Tier 3 encounters has been widely used as a test for inappropriate antibiotic prescribing, we also calculated the PPV of the Tier 3 classification for identifying an antibiotic-inappropriate encounter among those with antibiotic prescriptions [(Tier 3 encounters without indications for antibiotics by chart review/)(Tier 3 encounters without indications for antibiotics by chart review + Tier 3 encounters with indications for antibiotics by chart review)]. All analyses were conducted using R software (R version 4.5.1; R Foundation for Statistical Computing, Vienna, Austria).
Results
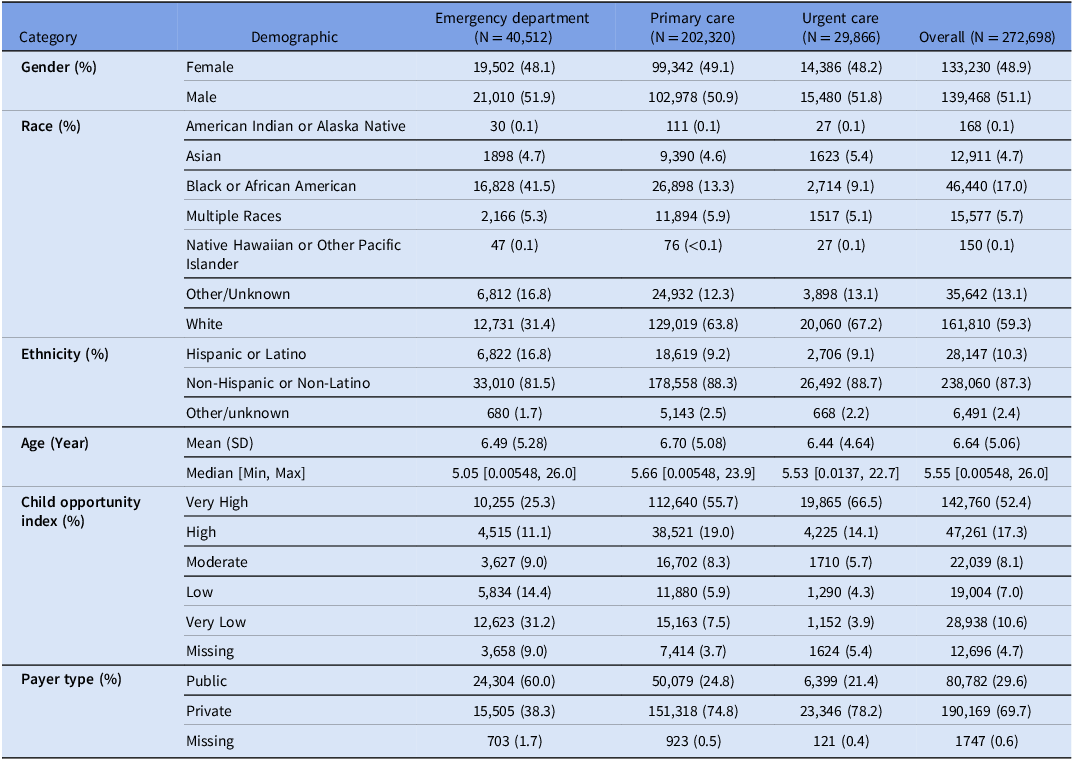
There were 272,698 primary care sick visits, urgent care, and emergency department encounters (without inpatient admission) during the study period without an antibiotic prescription within the prior 30 days. Demographics of the cohort are shown in Table 1. Of these encounters, 115,508 (42%) were associated with an antibiotic prescription; 9% of encounters with antibiotics were classified as Tier 3 and 68% were classified as Tier 2 (Figure 1).
Patient demographics for eligible encounters across ambulatory care network, January 1 2024 to December 31 2024

Table 1. Long description
A table comparing patient demographics across emergency department, primary care, urgent care, and overall for January 1, 2024, to December 31, 2024. The table includes categories such as gender, race, ethnicity, age, child opportunity index, and payer type. It provides percentages and counts for each demographic category. For gender, the table shows a nearly equal distribution between female and male across all care settings. For race, the majority of patients are white, followed by black or African American, and other unknown races. Hispanic or Latino patients make up a smaller percentage compared to non-Hispanic or non-Latino patients. The mean age of patients ranges from 6.44 to 6.70 years. The child opportunity index varies, with the highest percentage of patients falling into the very high category. The payer type shows a higher percentage of public payers in the emergency department and a higher percentage of private payers in primary care and urgent care.
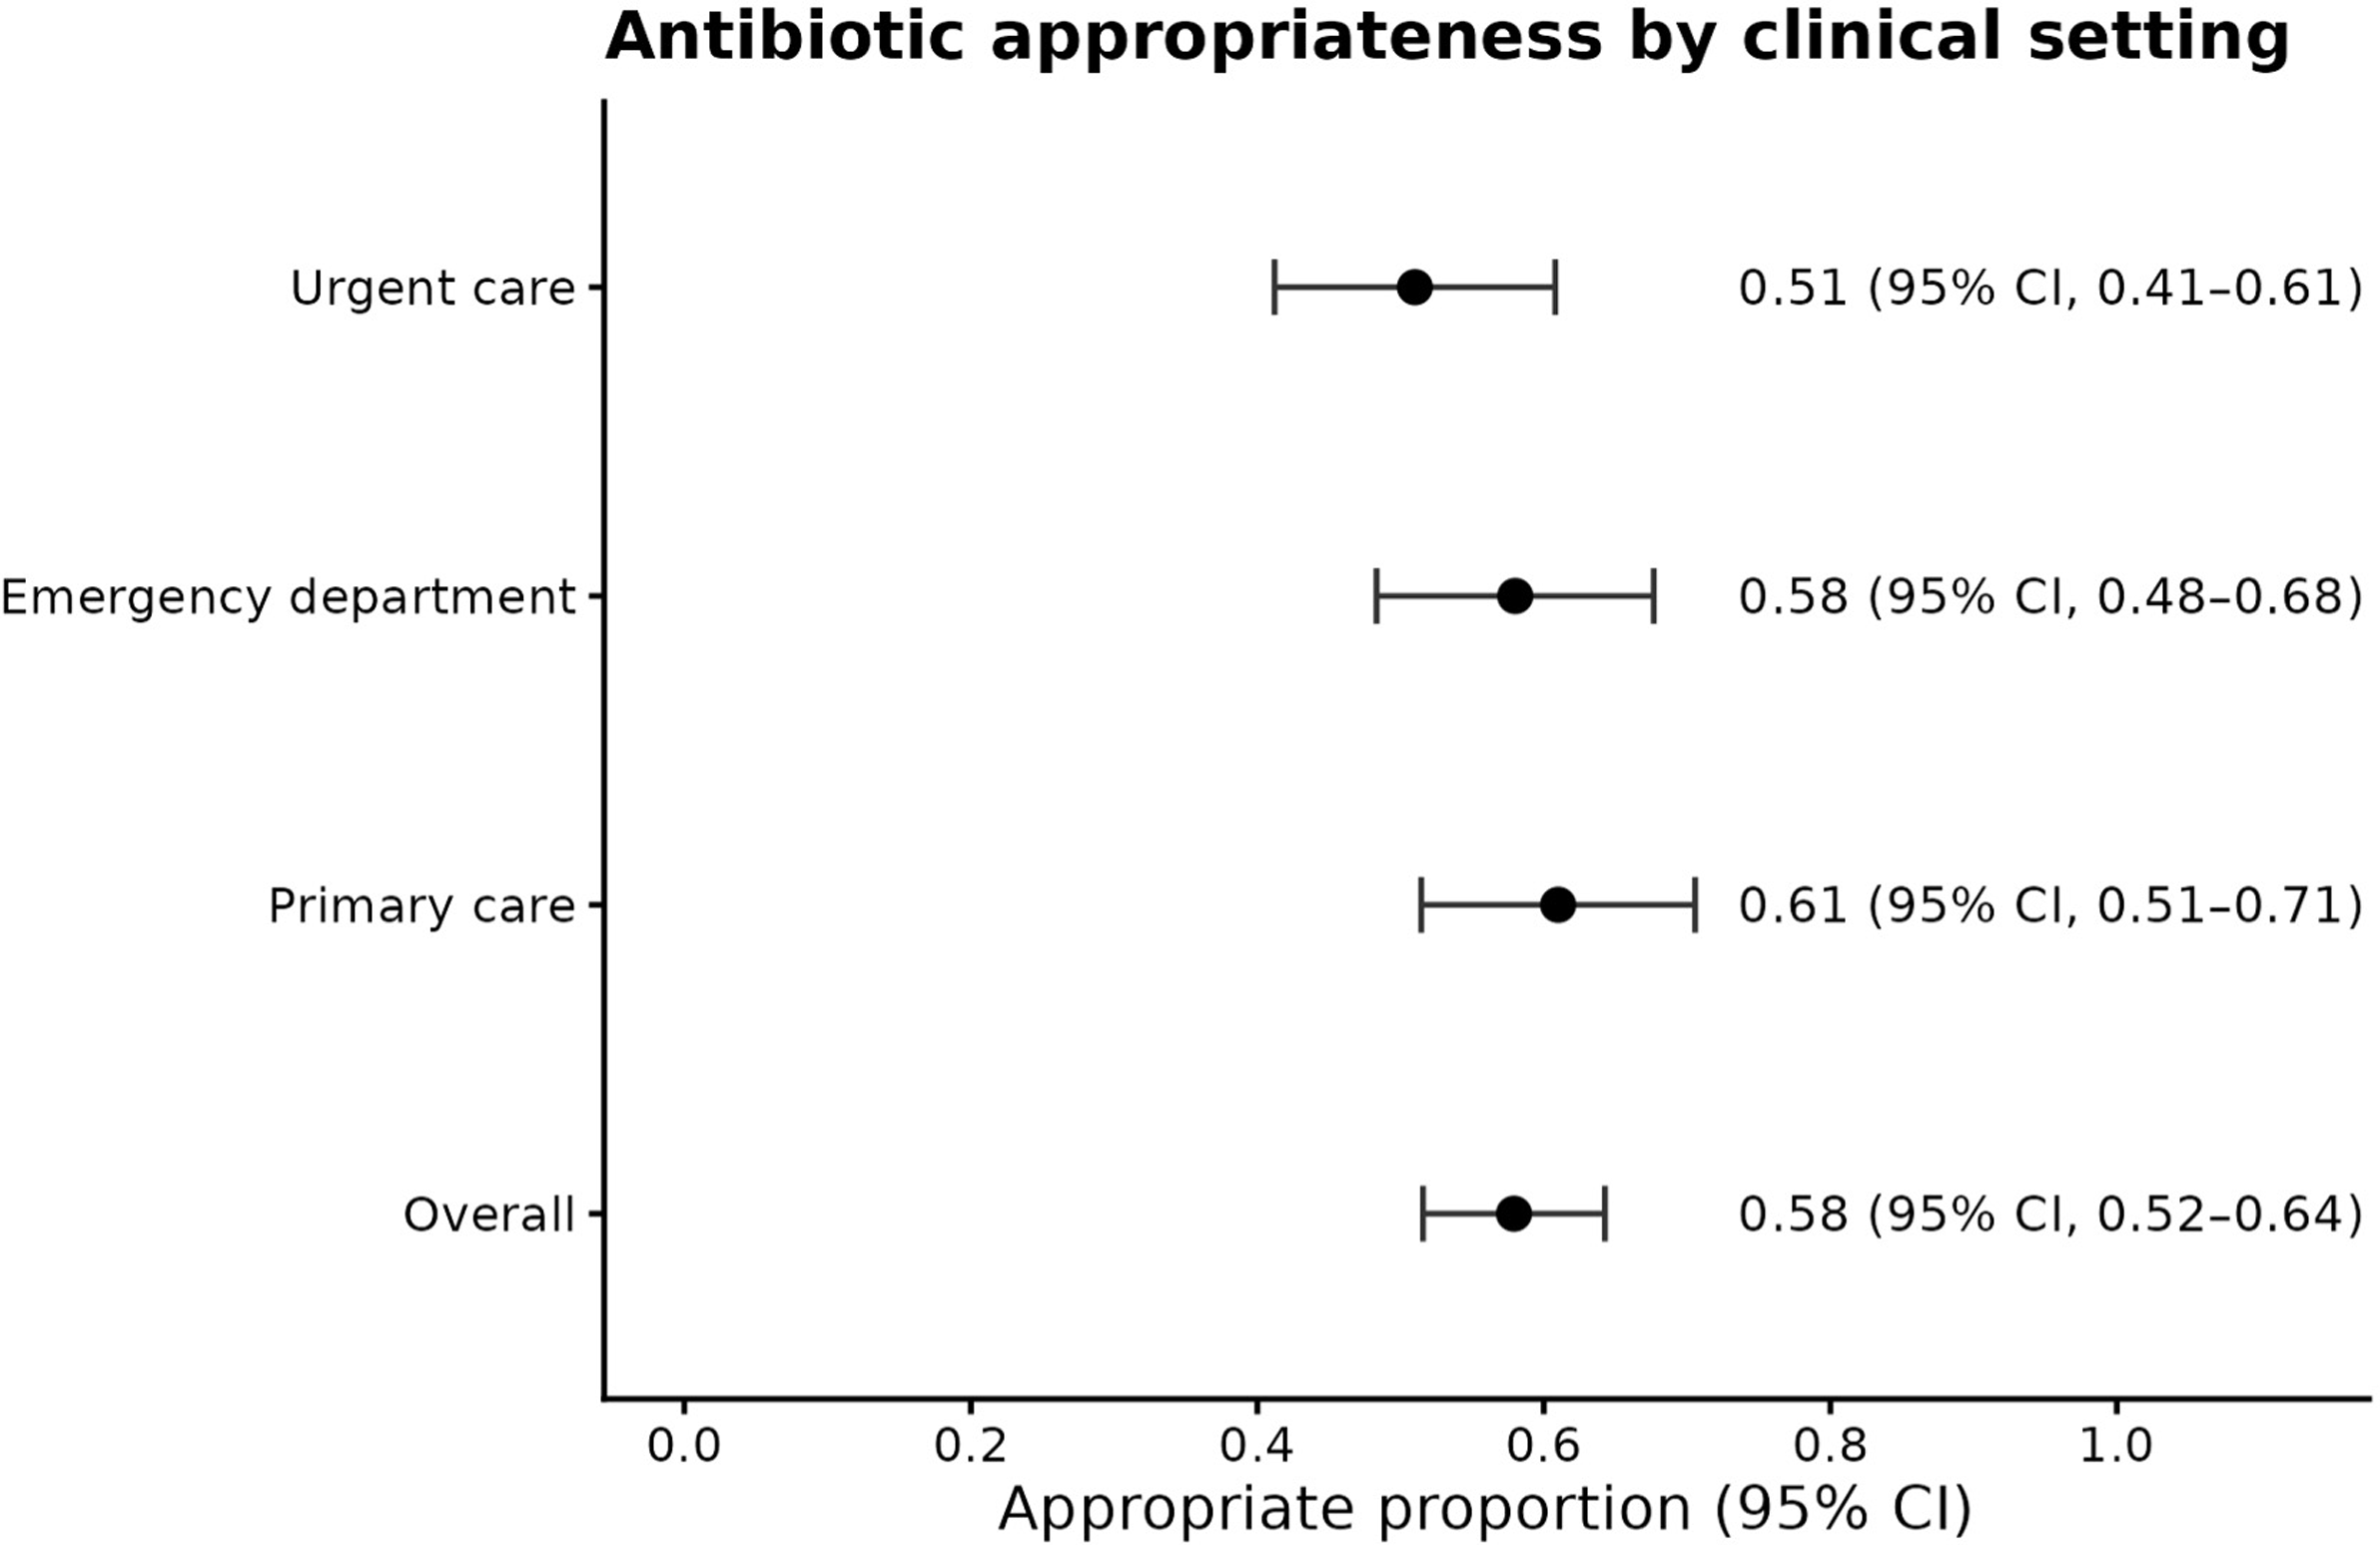
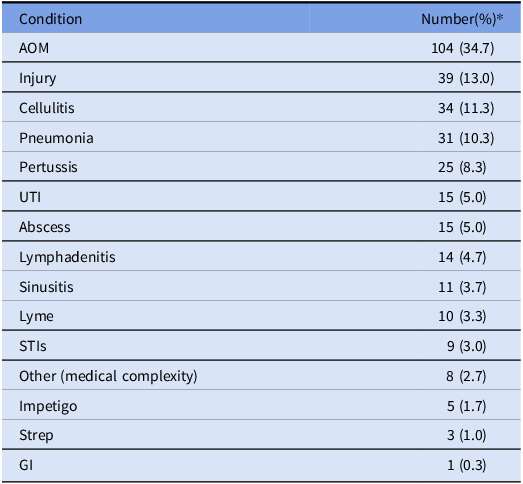
Inter-rater agreement between the two primary reviewers revealed an observed agreement of 93% and a Cohen’s Kappa of 0.93 (95% CI, 0.89–0.97). Of the 300 randomly sampled Tier 3 encounters with an antibiotic prescription evaluated by chart review, the most common disease criteria used to evaluate encounters were AOM, injury, and cellulitis Table 2. These varied by age, with AOM being most common among subjects 0–4 and 5–12 years of age, while sexually transmitted infections were the most common in the 13–17-year age group. Because all encounters sampled were classified as Tier 3, the expected (per ICD-10 algorithm) appropriateness for all care settings and age groups was 0%. Based on our chart review of Tier 3 encounters, 170/300 (57%, unweighted) were classified as appropriate and 130 (43%, unweighted) were inappropriate based on manual chart review. In survey-weighted analysis representing all Tier 3 encounters with an antibiotic prescription in the cohort, 58% (95% CI 52%–64%) of prescriptions were classified as appropriate and 42% as inappropriate. Thus, the ICD 10-based algorithm for Tier 3 diagnoses had an estimated PPV of 42% for identifying inappropriate antibiotic use. Although weighted estimates of antibiotic appropriateness varied by care setting (Figure 3) and age group (Table 3), antibiotic prescriptions for Tier 3 diagnoses were deemed to be appropriate in more than half of all encounters in each of these subgroups.
Appropriateness of antibiotic prescribing for tier 3 diagnoses per manual chart review, by location.

Figure 3. Long description
The dot plot illustrates the appropriate proportion of antibiotic prescribing for tier 3 diagnoses across different clinical settings. The x-axis represents the appropriate proportion with a range from 0.0 to 1.0, while the y-axis lists the clinical settings: Urgent care, Emergency department, Primary care, and Overall. Each dot represents the appropriate proportion for a specific setting, with error bars indicating the 95% confidence interval. Urgent care has an appropriate proportion of 0.51 with a 95% confidence interval of 0.41 to 0.61. The Emergency department shows an appropriate proportion of 0.58 with a 95% confidence interval of 0.48 to 0.68. Primary care has the highest appropriate proportion at 0.61 with a 95% confidence interval of 0.51 to 0.71. The overall appropriate proportion is 0.58 with a 95% confidence interval of 0.52 to 0.64. The plot highlights variations in antibiotic prescribing appropriateness across different clinical settings.
Frequency of condition specific categories for validation of tier 3 encounters

Table 2. Long description
The table presents the frequency of various medical conditions as a percentage of total cases. It includes conditions such as AOM, injury, cellulitis, pneumonia, pertussis, UTI, abscess, lymphadenitis, sinusitis, Lyme, STIs, other medical complexity, impetigo, strep, and GI. The table has two columns: Condition and Number (percentage). AOM has the highest frequency at 34.7 percent, followed by injury at 13 percent, and cellulitis at 11.3 percent. The conditions are listed in descending order of their frequency. The table provides a clear comparison of the prevalence of these conditions.
* Because some encounters were evaluated for multiple infections total infections exceeds 300.
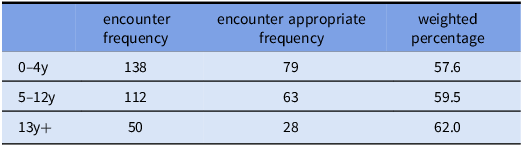
Location-weighted antibiotic appropriateness, stratified by age

Table 3. Long description
The table presents data on antibiotic appropriateness stratified by age groups. It contains three columns: encounter frequency, encounter appropriate frequency, and weighted percentage. The rows are labeled by age groups: 0-4 years, 5-12 years, and 13 years and older. For the 0-4 year age group, there are 138 encounters with 79 being appropriate, resulting in a weighted percentage of 57.6 percent. For the 5-12 year age group, there are 112 encounters with 63 being appropriate, resulting in a weighted percentage of 59.5 percent. For the 13 years and older age group, there are 50 encounters with 28 being appropriate, resulting in a weighted percentage of 62.0 percent.
In a secondary analysis, of the 300 charts included in our manual review, 64 encounters (21.3%, unweighted) described a watchful waiting approach, 41 (64%) of which were for AOM. Watchful waiting prescriptions accounted for 35 of the 130 (27%, unweighted) encounters that were classified as inappropriate in our chart review (Figure 4).
Appropriateness for antibiotic prescribing for tier 3 diagnoses for watchful waiting encounters.

Figure 4. Long description
A pie chart titled ‘Antibiotic Appropriateness’ displays the distribution of antibiotic prescribing for tier 3 diagnoses. The chart is divided into three main segments: appropriate, inappropriate, and watchful waiting. The largest segment, representing 57 percent, is labeled ‘Appropriate’ and is colored in dark blue. The second largest segment, representing 43 percent, is labeled ‘Inappropriate’ and is colored in orange. The chart further breaks down the ‘Appropriate’ segment into two sub-segments: 83 percent appropriate and 17 percent appropriate watchful waiting. The ‘Inappropriate’ segment is also divided into two sub-segments: 73 percent inappropriate and 27 percent inappropriate watchful waiting. The chart uses arrows to connect the main segments to their respective sub-segments, indicating the distribution of watchful waiting within each category.
Discussion
Using a large, diverse pediatric ambulatory healthcare network, we attempted to validate a previously established and widely used tier-based algorithm for assessing antibiotic appropriateness for outpatient encounters. In this context, the algorithm performed poorly, with more than half of encounters designated by the ICD10-based classification as “antibiotics almost never indicated” (Tier 3) having potentially appropriate antibiotic prescriptions when using detailed information obtained by manual chart review. These data suggest that this commonly used algorithm might not be an accurate tool for benchmarking and measuring the impact of pediatric outpatient antibiotic stewardship interventions and supports its potential modification to improve its performance.
The original work serving as the basis for this validation remains important as a high-level summary of U.S. ambulatory antibiotic prescribing. Reference Fleming-Dutra, Hersh and Shapiro5 Despite imperfect specificity, its use of billing codes for common conditions provides a consistent benchmark for antibiotic use, helping target outpatient antibiotic stewardship initiatives to high use settings and conditions. Reference Blanco, DePorre and Mayne6–Reference Hannan, Draper, Uecker-Bezdicek, Gomez-Urena and Jensen10 Its primary data source, however, precluded the ability to perform chart validation, and our study suggests this algorithm would benefit from incorporating additional data elements to more accurately reflect the precise indication for antibiotic prescribing at the encounter level. Thus, generation of a true EHR-based indicator of antibiotic appropriateness likely requires a more nuanced approach.
Based on our manual chart review, more than half of antibiotic prescriptions associated with Tier 3 (i.e., antibiotic inappropriate) encounters were likely appropriate. Among possible reasons for this misclassification, our chart review revealed (not surprisingly) that billing codes assigned to an encounter were often nonspecific or inaccurate. For example, more than 40% of encounters coded as “cough” fit our standardized criteria for pertussis or pneumonia, and numerous encounters were assigned a serous otitis media code (Tier 3) when the chart described AOM (Tier 2), a diagnosis for which antibiotics are often indicated. Efforts should be made to improve the accuracy of coding to increase the utility of algorithms that rely on ICD-10 codes.
Also of note, the original algorithm does not account for the use of watchful waiting in antibiotic prescribing. This practice is an important antibiotic stewardship tool, especially for acute otitis media. Reference King, Lovegrove and Shehab14,Reference Smith, Kuckel and Recidoro15 However, despite the algorithm’s inability to capture potentially appropriate watchful waiting prescriptions, this vulnerability does not account for the majority of its inaccuracy. Future editions of ICD codes might benefit from additional codes for watchful waiting as this recommended practice expands. Furthermore, although not part of our chart validation, most antibiotics prescribed (68%) were associated with Tier 2 (sometimes appropriate) encounters. Several of the most common indications for antibiotic use in children are classified as Tier 2, including AOM and streptococcal pharyngitis, which may contribute to the high percentage of Tier 2 encounters in our sample. Thus, classifying only Tier 3 encounters as inappropriate might be an insufficient target for pediatric antibiotic stewardship initiatives.
The discrepancies observed between the tier-based algorithm and our manual chart review are likely not specific to pediatric populations. If AOM or other pediatric-predominant conditions were driving these differences, the algorithm would be expected to perform better in older age groups. AOM accounted for more than one third of encounters in our review but only 6% of encounters in the 13+ age group, and the percentage of appropriate antibiotics for Tier 3 encounters was consistent across age groups (weighted 58%–63%), despite differences in case mix. Thus, analogous misclassification of antibiotic appropriateness is likely to occur when this algorithm is applied to adult populations but should be confirmed in future studies.
This study has several strengths. The CHOP Care Network is large and diverse, and the sample targeted for chart review included a range of ages and settings (ED, urgent care, and primary care) to extend its generalizability. Most importantly, instead of relying on coding or discharge diagnoses, we evaluated antibiotic appropriateness using both health system-level data and detailed chart review of specific encounters. Furthermore, the chart review was enhanced by generating criteria based on established national guidelines and review of the criteria by two pediatric infectious disease physicians and with high inter-rater reliability.
This study had several limitations. We assessed Tier 3 encounters associated with antibiotic prescriptions and did not investigate the performance of Tiers 1 and 2. However, consistent with its use to date, the utility of the algorithm is generally limited by its Tier 3 performance. Even if the other tiers performed well, the algorithm would still not effectively predict the rate of inappropriate antibiotic prescribing based on Tier 3 encounters. Despite the size and diversity of the population, this study was conducted in a single health system and, therefore, the results may not be fully generalizable to other settings or populations. Despite the creation of specific, structured criteria for classifying encounters, occasional ambiguity (which was adjudicated by 2 additional reviewers) remained. We excluded encounters in which the patient had received an antibiotic in the prior 30 days, which cut our sample in half. While important to ensure each antibiotic prescription could be appropriately evaluated, this may have reduced its generalizability to medically complex children who receive more frequent antibiotics and children on prophylactic antibiotics.
The established billing code-based algorithm did not reliably predict antibiotic appropriateness for Tier 3 encounters in our pediatric outpatient population. Future studies could investigate the validity of this algorithm in additional populations as well as determine if the algorithm could be modified to improve its performance through integration of supplementary data elements.
Supplementary material
The supplementary material for this article can be found at https://doi.org/10.1017/ice.2026.10474.
Acknowledgements
This work was supported by the PIDS Summer Research Scholars Award (to S.R.).
Competing interests
All authors declare that they have no conflicts of interest.




 Open access

