


1. Introduction
Understanding how much we care about the impact of our behavior on others is fundamental to understanding human decision-making and addressing social and global challenges. From individual environmental preservation to income redistribution, differing perspectives on fairness and concern for others often shape individual behavior and societal outcomes. These distributional concerns, commonly referred to as social preferences or Social Value Orientation (SVO), provide valuable insights into the motivations behind individual decision-making and collective action. In particular, the SVO Slider Measure (SLM hereafter; Murphy et al., Reference Murphy, Ackermann and Handgraaf2011) has become a widely used incentivizable tool for assessing these distributional preferences. However, while prior research has established its short-term reliability, key questions about its long-term reliability, comparative standing to other measures, and demographic influences remain unanswered. In this article, we present findings from a 4-year panel study that explores these facets, focusing on the reliability of the SLM over time, the demographic influences on its fluctuations, and its position within the broader landscape of prosociality measures.
The SLM is an incentive-compatible measure of distributional preferences, involving several decisions on allocating points or real money between oneself and another person, typically a stranger. To date, only a handful of studies have explicitly examined the test–retest reliability of the SLM. Murphy et al. (Reference Murphy, Ackermann and Handgraaf2011) conducted three sessions 1 week apart, finding a high test–retest correlation (Pearson’s $r = 0.915$
), particularly when compared to other popular measures of prosociality like the Ring Measure (RM) (
$r = 0.915$
), particularly when compared to other popular measures of prosociality like the Ring Measure (RM) ( $r = 0.599$
, Liebrand, Reference Liebrand1984) and the Triple Dominance Measure (TDM) (Goodman and Kruskal’s
$r = 0.599$
, Liebrand, Reference Liebrand1984) and the Triple Dominance Measure (TDM) (Goodman and Kruskal’s $\gamma = 0.391$
, Van Lange et al., Reference Van Lange, De Bruin, Otten and Joireman1997). However, studies on the SLM over longer time frames are rare. One exception is Bakker and Dijkstra (Reference Bakker and Dijkstra2021), who employed a 4-wave design spanning 16 months to assess the temporal reliability of SVO and compare it with the RM and TDM. Due to the limited sample size of individuals participating in all 4 waves, their analysis focused mainly on the first 2 waves, 3 months apart, which included 89 respondents. Results showed high consistency, with 77.9% of participants remaining in the same distributional category, and a moderate correlation between waves (r = 0.698). Similarly, de Matos Fernandes et al. (Reference de Matos Fernandes, Bakker and Dijkstra2022) investigated the test–retest reliability of prosociality among 495 participants in a Dutch sample over six months. They assessed the consistency of the SLM in monthly intervals, finding that continuous social preferences were moderately correlated (r
$\gamma = 0.391$
, Van Lange et al., Reference Van Lange, De Bruin, Otten and Joireman1997). However, studies on the SLM over longer time frames are rare. One exception is Bakker and Dijkstra (Reference Bakker and Dijkstra2021), who employed a 4-wave design spanning 16 months to assess the temporal reliability of SVO and compare it with the RM and TDM. Due to the limited sample size of individuals participating in all 4 waves, their analysis focused mainly on the first 2 waves, 3 months apart, which included 89 respondents. Results showed high consistency, with 77.9% of participants remaining in the same distributional category, and a moderate correlation between waves (r = 0.698). Similarly, de Matos Fernandes et al. (Reference de Matos Fernandes, Bakker and Dijkstra2022) investigated the test–retest reliability of prosociality among 495 participants in a Dutch sample over six months. They assessed the consistency of the SLM in monthly intervals, finding that continuous social preferences were moderately correlated (r $\geq $
0.66) across waves. Höglinger and Wehrli (Reference Höglinger and Wehrli2016) use the first 2 waves of the present study to show that social preferences elicited with the SVO-Slider on MTurk have a similar distribution to those found in laboratory settings with a high test–retest reliability over 1 week (Pearson’s r = 0.79). However, the SVO measure correlates only weakly with self-reported prosocial behavior items but, interestingly, considerably with the survey response time.
$\geq $
0.66) across waves. Höglinger and Wehrli (Reference Höglinger and Wehrli2016) use the first 2 waves of the present study to show that social preferences elicited with the SVO-Slider on MTurk have a similar distribution to those found in laboratory settings with a high test–retest reliability over 1 week (Pearson’s r = 0.79). However, the SVO measure correlates only weakly with self-reported prosocial behavior items but, interestingly, considerably with the survey response time.
We extend the previous literature in three ways: First, we are able to report results on various aspects of the test–retest stability of the SLM over a much longer time period than in previous studies. Second, we contextualize our findings on SLM stability within the broader field of personality measurement by comparing our results with data from other measures of prosociality. Specifically, we collected behavioral measures, such as the Dictator Game (DG) and the Prisoner’s Dilemma (PD), data on various self-reported behaviors, and a shortened version of the Big-Five Inventory (BFI–10). Furthermore, we compare our results with those of other studies using established personality measures, including the full Big-Five Inventory (Specht et al., Reference Specht, Egloff and Schmukle2011), the HEXACO model (Dunlop et al., Reference Dunlop, Bharadwaj and Parker2021), and the Dark Factor of Personality (D, Zettler et al., Reference Zettler, Moshagen and Hilbig2021). Third, we contribute to the literature by not only reporting the test–retest reliabilities of the SLM across our entire sample, but by disaggregating the results to examine (i) differences in prosociality by age and gender, (ii) differences in stability by age and gender, and (iii) differences in the stability of individual items.
Our results indicate that on an individual level, behavior tends to become more self-serving over the six waves, yet older individuals are slightly more prosocial. This might suggest that different effects play a role, such as exposure vs. cohort effects, differing in size and direction. Moreover, women display consistently higher prosocial tendencies than men. When comparing measurement methods, personality scales like the Big-Five, HEXACO or the Dark Factor D, their relevant aspects exhibit higher stability than the SLM. However, comparable experimental games that focus on prosocial and cooperative behavior like the DG and PD capture more variable, context-dependent behavior. Thus, the SLM occupies a distinct position between these approaches, measuring incentivizable behaviors with greater reliability than single-game setups while reflecting specific behavioral tendencies rather than broad traits. This makes it a valuable tool for studying prosociality in a behavioral setting over time.
2. Methodology
2.1. Sample
We collected our data using the online labor market Amazon Mechanical Turk (MTurk) in six waves between November 2015 and December 2019 (see Höglinger and Wehrli, Reference Höglinger and Wehrli2016 for more details on specifics of the implementation and further assessed constructs, and Table 1 for demographics of our sample). For our study, we posted a HIT (Human Intelligence Task) open to US-residents asking for participation in a ‘Study on Decision Making’ that required completing 2 online surveys—one immediately, the other 1 week later. A base payment of $2 (USD) was offered for completing the 2 surveys, with the possibility of earning up to an extra $3 on various decision tasks (see Höglinger and Wehrli (Reference Höglinger and Wehrli2017) for an analysis of the first 2 waves). Participation in later waves was achieved by re-inviting participants at comparable incentives via the platform’s personalized invitation system.
Sample description
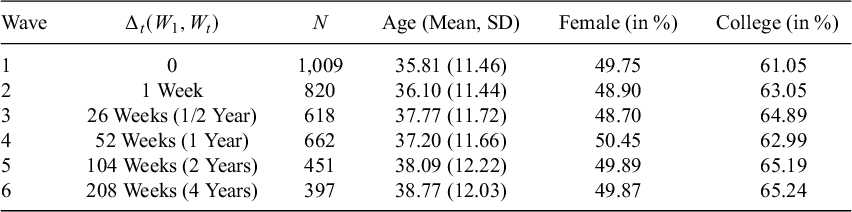
Note: Descriptive data for each wave. College in % is percentage with college education.
We collected data over 4 years across six waves, with increasing intervals between each wave. Starting with N=1,009 participants in wave 1, we observed a gradual decline in participation over time, accompanied by slight shifts in the distributions of age, gender, and education. Specifically, being in college significantly reduced the likelihood of dropout in waves 2 and 3, while older individuals were more likely to drop out between waves 3 and 6 (see Table A10 in the Appendix). This is not unusual in longitudinal studies of this duration. Importantly, although the mean SVO angle decreases over time (see Table A4), we found no evidence of systematic dropout based on the SVO ( $p>$
0.05 in all waves), ensuring the validity of our key variable of interest. This is corroborated when looking at the group means of all those individuals who participated in all six waves, where we also find a slight decrease in group means (see Table A9). Table 1 gives an overview of the sample. All data, methods and materials are publicly available at https://osf.io/ygfwt.
$p>$
0.05 in all waves), ensuring the validity of our key variable of interest. This is corroborated when looking at the group means of all those individuals who participated in all six waves, where we also find a slight decrease in group means (see Table A9). Table 1 gives an overview of the sample. All data, methods and materials are publicly available at https://osf.io/ygfwt.
2.2. Measures
2.2.1. SVO SLM
The SLM measures a person’s social preferences based on a series of six primary allocation decisions that lead to an individual SVO angle ( $\operatorname {SVO}^\circ $
). In each decision, participants have to allocate points between themselves and another unknown individual (see Figure 1a). For example, in Item 5, the decision maker has to choose an amount between 50 and 100 points the other person receives, while their own payoff decreases by 1 point for every point the other’s payoff rises. They thus have to make a trade-off between their own welfare and that of the other person.
$\operatorname {SVO}^\circ $
). In each decision, participants have to allocate points between themselves and another unknown individual (see Figure 1a). For example, in Item 5, the decision maker has to choose an amount between 50 and 100 points the other person receives, while their own payoff decreases by 1 point for every point the other’s payoff rises. They thus have to make a trade-off between their own welfare and that of the other person.
SVO Slider Measure (quoted from Murphy & Ackermann (2014)).
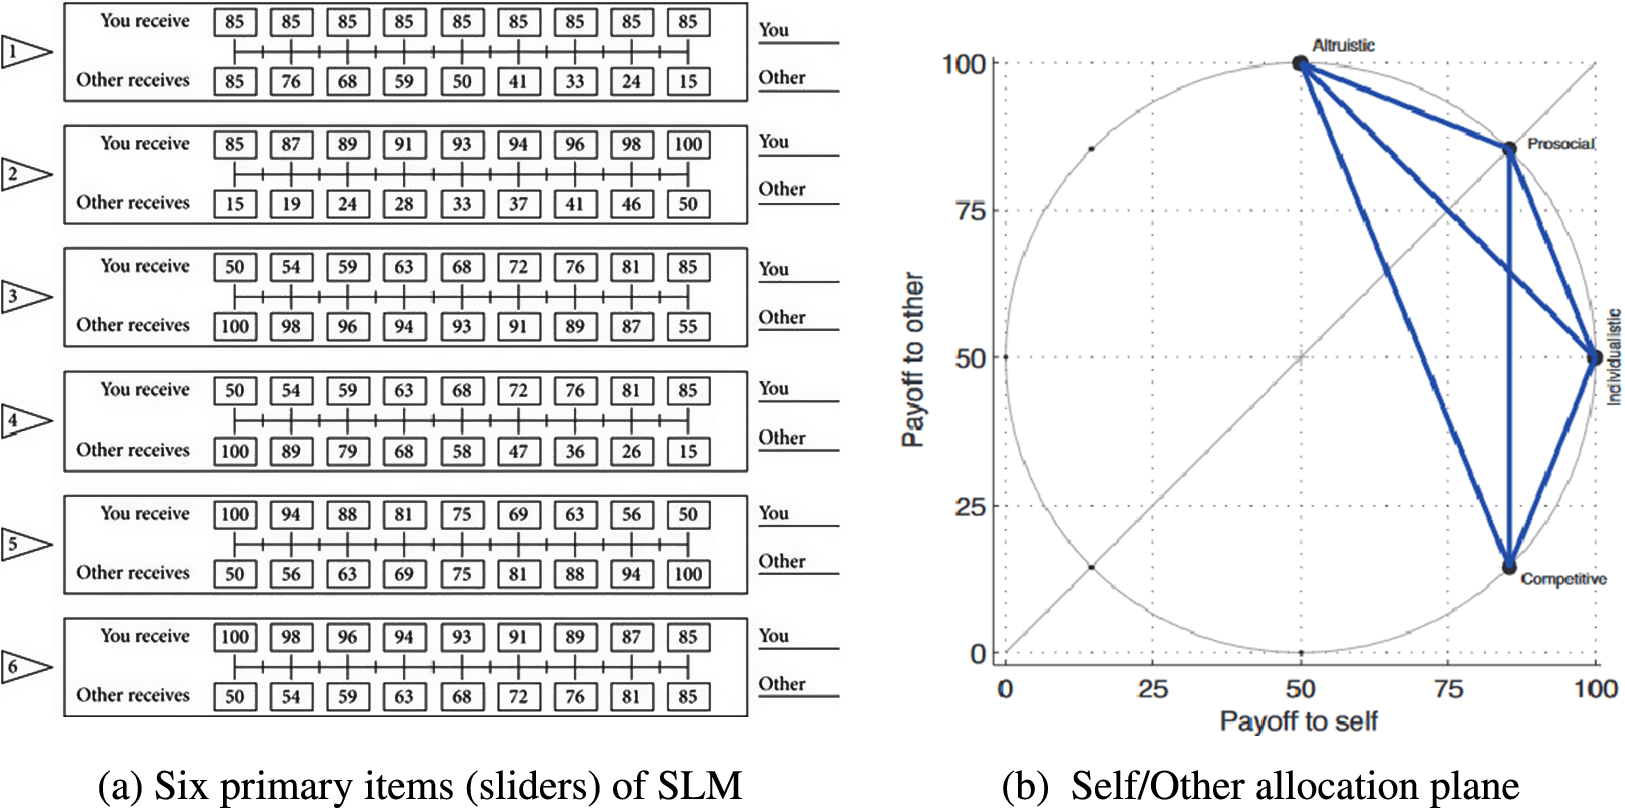
Figure 1b shows the six items and their specific payoff possibilities in a self/other allocation plane. The six connecting lines depict the payoff combinations that emerge when comparing the 4 idealized SVOs competitive, individualistic, prosocial, and altruistic with each other. The assessment of the six allocation decisions allows for the calculation of the individual SVO score ( $\operatorname {SVO}^\circ $
) and thus for a fine-grained differentiation of the SVOs. Geometrically,
$\operatorname {SVO}^\circ $
) and thus for a fine-grained differentiation of the SVOs. Geometrically, $\operatorname {SVO}^\circ $
denotes the angle between a horizontal line and a line connecting the midpoint of the circle (50,50) and a point somewhere on the outer circle.
$\operatorname {SVO}^\circ $
denotes the angle between a horizontal line and a line connecting the midpoint of the circle (50,50) and a point somewhere on the outer circle. $\operatorname {SVO}^\circ $
thus indicates where someone’s social preferences fall on the altruism-competitiveness spectrum.Footnote
1
$\operatorname {SVO}^\circ $
thus indicates where someone’s social preferences fall on the altruism-competitiveness spectrum.Footnote
1
During our study, participants were randomly matched with anonymous partners and presented with the six allocation questions. At the end of the study, we randomly selected one decision that determined how much participants would be paid, with 100 points equal to $0.50.
2.2.2. The PD
The PD is a measure of cooperativeness in mixed-motive situations (Rapoport and Chammah, Reference Rapoport and Chammah1965). Conceptually, it is closely related to the SVO, which is considered a good predictor of cooperative behavior (Balliet et al., Reference Balliet, Parks and Joireman2009; Bogaert et al., Reference Bogaert, Boone and Declerck2008). In our implementation of the PD, two individuals independently decide whether to cooperate or not. If both cooperate, they both receive a moderate reward (60 each). If only one person cooperates, the cooperator receives nothing (0), while the defector receives a large reward (100). If both defect, they both receive a smaller reward than if they had cooperated (20 each). The PD was employed in waves 1, 2, 5, and 6.
2.2.3. DG
The DG is a measure of prosociality within a resource allocation scenario. In our implementation of the DG, one participant (the ‘dictator’) is given 100 points. The dictators can divide these points in 10-point increments between themselves and the receiver. The receiver has no say in how the points are allocated and must accept the offer made by the dictator. The DG was employed in waves 2 to 6.
2.2.4. Survey questions on altruistic behavior
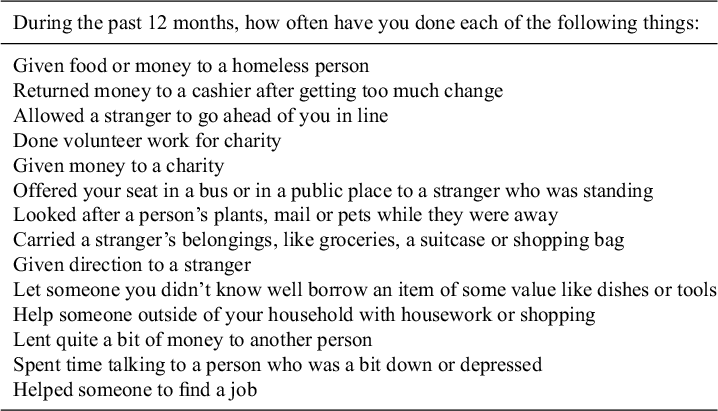
As a fourth measure of prosociality, we employed survey questions on self-reported acts of altruism using a 14-item altruism scale from the 2002 General Social Survey (Smith et al., Reference Smith, Marsden, Hout and Kim2012). In the survey, participants were requested to report how frequently they have engaged in a particular altruistic behavior within the previous year, ranging from ‘never’ to ‘more than once a week’. For example, one of the survey items was ‘During the past 12 months, how often have you given food or money to a homeless person?’ (see complete survey questions in Table A1 in the Appendix). We evaluated the self-reported acts of altruism in all six waves.
2.2.5. A reduced version of the Big-Five Inventory (BFI–10)
Finally, we deployed a 10-item Big-Five Inventory (BFI–10, Rammstedt and John, Reference Rammstedt and John2007). Due to time restrictions, we chose this largely reduced version of the Big-Five instead of the more comprehensive Big-Five inventory by John et al. (Reference John, Donahue and Kentle1991). The BFI–10 is designed and validated to assess five important personality traits: Openness, Conscientiousness, Extraversion, Agreeableness, and Neuroticism on a Likert-scale from 1 to 5 (see complete survey questions in Table A2 in the Appendix). We used the BFI-10 as a benchmark for a well-established measurement method of personality with good psychometric properties (Rammstedt et al., Reference Rammstedt, Kemper, Klein, Beierlein and Kovaleva2013; Rammstedt et al., Reference Rammstedt, Roemer and Lechner2023). The BFI–10 questions were evaluated in waves 3 to 6.
3. Results
In order to verify the quality of the SLM as a valid measure of SVOs, we first examine general distributional findings and continue with the discussion of the test–retest reliability of the SLM as a whole and by specific items. We then compare the reliability of the SLM with other personality measures from our survey and the literature. Finally, we assess socio-demographic differences in the SLM’s test–retest reliability and substantive developments of SVO by age and gender in more detail.
3.1. Distribution of $\operatorname {SVO}^\circ $

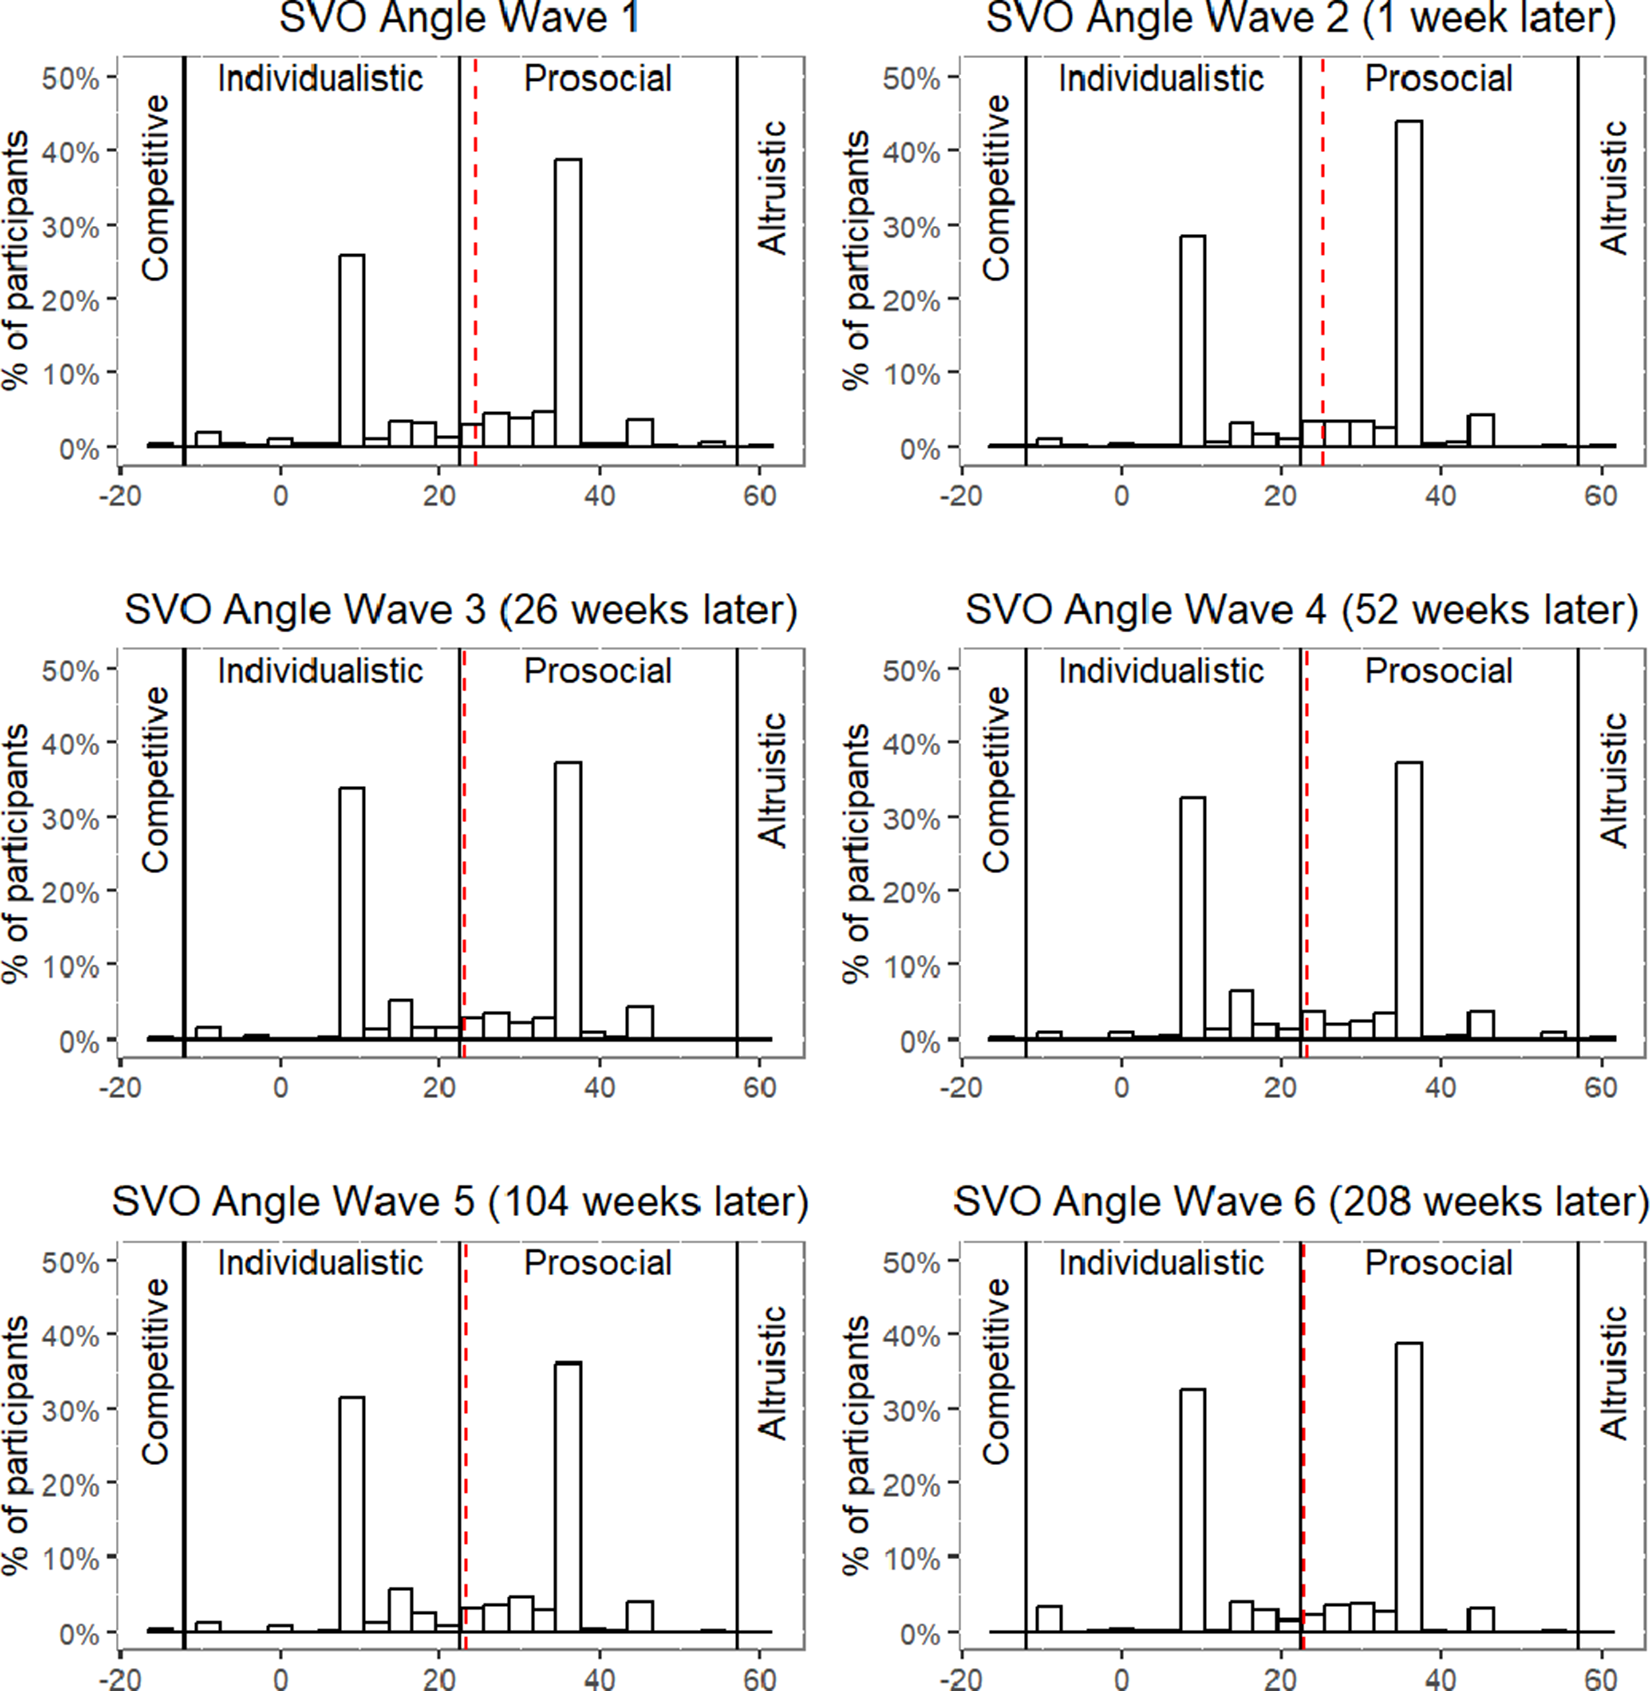
When looking at the distribution of $\operatorname {SVO}^\circ $
(see Figure 2), we find a wide range of SVO angles between
$\operatorname {SVO}^\circ $
(see Figure 2), we find a wide range of SVO angles between $-$
16.26
$-$
16.26 $^{\circ }$
(competitive) and 61.39
$^{\circ }$
(competitive) and 61.39 $^{\circ }$
(altruistic) with an average SVO angle across all waves and participants of M(3957) = 23.86
$^{\circ }$
(altruistic) with an average SVO angle across all waves and participants of M(3957) = 23.86 $^{\circ }$
(SD = 13.96). Thus, on average, individuals have prosocial preferences. Across the six waves, most participants exhibit either individualistic or prosocial preferences, with only a few showing competitive tendencies and only one participant in 1 wave showing altruistic preferences. Notably, we observe two distinct spikes in the distribution of SVO angles near 10
$^{\circ }$
(SD = 13.96). Thus, on average, individuals have prosocial preferences. Across the six waves, most participants exhibit either individualistic or prosocial preferences, with only a few showing competitive tendencies and only one participant in 1 wave showing altruistic preferences. Notably, we observe two distinct spikes in the distribution of SVO angles near 10 $^{\circ }$
and near 35
$^{\circ }$
and near 35 $^{\circ }$
, indicating that there were consistently sized subsets of participants who exhibited either almost perfectly individualistic or prosocial preferences (i.e., maximized own or joint payoffs). Overall, fluctuations between the 4 ‘ideal types’ are minimal and range between 13.66% and 22.44% (see Table A3 for all percentage changes). All these findings replicate central findings of earlier studies on the SLM (de Matos Fernandes et al., Reference de Matos Fernandes, Bakker and Dijkstra2022; Ehlert et al., Reference Ehlert, Böhm, Fleiß, Rauhut, Rybnicek and Winter2021; Liu et al., Reference Liu, Stivers, Murphy, Van Doesum, Joireman, Gallucci, Aharonov-Majar, Athenstaedt, Bai and Böhm2024; Van Doesum et al., Reference Van Doesum, Murphy, Gallucci, Aharonov-Majar, Athenstaedt, Au, Bai, Böhm, Bovina, Buchan, Chen, Dumont, Engelmann, Eriksson, Euh, Fiedler, Friesen, Gächter, Garcia and Van Lange2021).
$^{\circ }$
, indicating that there were consistently sized subsets of participants who exhibited either almost perfectly individualistic or prosocial preferences (i.e., maximized own or joint payoffs). Overall, fluctuations between the 4 ‘ideal types’ are minimal and range between 13.66% and 22.44% (see Table A3 for all percentage changes). All these findings replicate central findings of earlier studies on the SLM (de Matos Fernandes et al., Reference de Matos Fernandes, Bakker and Dijkstra2022; Ehlert et al., Reference Ehlert, Böhm, Fleiß, Rauhut, Rybnicek and Winter2021; Liu et al., Reference Liu, Stivers, Murphy, Van Doesum, Joireman, Gallucci, Aharonov-Majar, Athenstaedt, Bai and Böhm2024; Van Doesum et al., Reference Van Doesum, Murphy, Gallucci, Aharonov-Majar, Athenstaedt, Au, Bai, Böhm, Bovina, Buchan, Chen, Dumont, Engelmann, Eriksson, Euh, Fiedler, Friesen, Gächter, Garcia and Van Lange2021).
When focusing on the mean level consistency (Roberts et al., Reference Roberts, Walton and Viechtbauer2006), we find that the mean angle decreases slightly over the six waves, indicating a slight shift toward more selfish scores. When examining wave by wave, we observe an increase in the mean SVO angle between waves 1 and 2, but this trend is not sustained, as we find that the mean SVO angle between waves 2 and 3 decreases significantly ( $t(556) = 3.30$
,
$t(556) = 3.30$
, $p<$
0.01) and decreases afterwards even further. However, the effect sizes, i.e., Cohen’s d’s, are rather small (all
$p<$
0.01) and decreases afterwards even further. However, the effect sizes, i.e., Cohen’s d’s, are rather small (all $d<0.125$
), so we can conclude that the group remains mostly at the same level and tends to become only slightly more selfish over time (see Table A4).
$d<0.125$
), so we can conclude that the group remains mostly at the same level and tends to become only slightly more selfish over time (see Table A4).
Histogram of SVO angles per wave (Mean is shown as red, dotted line).
3.2. Test–retest reliability of
$\operatorname {SVO}^\circ $
and the individual sliders

3.2.1. General
$\operatorname {SVO}^\circ $

To assess the test–retest reliability of the SLM over time, we leverage our extensive longitudinal data set by analyzing the rank-order stability of $\operatorname {SVO}^\circ $
. The rank-order stability, or Spearman’s r, assesses the extent to which individuals maintain their relative standing in comparison to others with regard to their
$\operatorname {SVO}^\circ $
. The rank-order stability, or Spearman’s r, assesses the extent to which individuals maintain their relative standing in comparison to others with regard to their $\operatorname {SVO}^\circ $
between 2 waves (Roberts et al., Reference Roberts, Walton and Viechtbauer2006). As shown in Table 2, there exists a strong positive correlation between
$\operatorname {SVO}^\circ $
between 2 waves (Roberts et al., Reference Roberts, Walton and Viechtbauer2006). As shown in Table 2, there exists a strong positive correlation between $\operatorname {SVO}^\circ $
across successive waves with all correlation coefficients above
$\operatorname {SVO}^\circ $
across successive waves with all correlation coefficients above $r = 0.7$
(all correlations are statistically significant with
$r = 0.7$
(all correlations are statistically significant with $p<.01$
).
$p<.01$
).
Rank-order stability between waves

Note: Spearman’s r between waves $(^{*}p<0.1;\ ^{**}\!p<0.05;\ ^{***}\!p<0.01)$
.
$(^{*}p<0.1;\ ^{**}\!p<0.05;\ ^{***}\!p<0.01)$
. $^{\dagger }$
Bonferroni-adjusted p-values
$^{\dagger }$
Bonferroni-adjusted p-values $p_{B} <0.05$
.
$p_{B} <0.05$
.
To integrate our findings with other studies and emphasize long-term effects, we next focus on changes within the 2-year and 4-year intervals, enabling us to specifically explore patterns and transformations over the longer term. Thus, the rank-order stability between waves 1 and 5 (2 years) is $r_{2y}=0.64$
and
$r_{2y}=0.64$
and $r_{4y}=0.58$
between waves 1 and 6 (4 years). These findings suggest that individuals tend to maintain their relative rank in the sample compared to other participants over time.
$r_{4y}=0.58$
between waves 1 and 6 (4 years). These findings suggest that individuals tend to maintain their relative rank in the sample compared to other participants over time.
3.2.2. Individual sliders
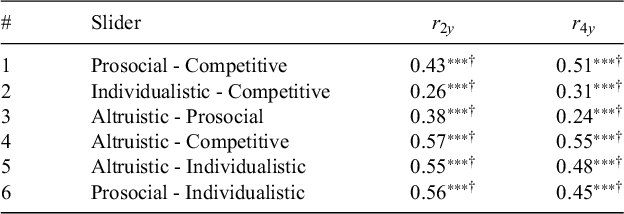
Looking more closely at the six sliders that constitute the SVO (i.e., the trade-off between each combination of orientations), we find that the slider that considers the trade-off between altruism and competitiveness exhibits the highest rank-order stability for the 2- and 4-year comparison ( $r_{2y}=0.57$
,
$r_{2y}=0.57$
, $N=451$
,
$N=451$
, $p<0.01$
;
$p<0.01$
; $r_{4y}=0.55$
,
$r_{4y}=0.55$
, $N=397$
,
$N=397$
, $p<0.01$
) (see Table A7 for all rank-order stabilities). In fact, all sliders in which one has the choice of whether or not to take the other’s benefit into account (i.e., the slider, Prosociality-Individualism, Altruism-Individualism, Prosociality-Competitiveness) show a high test–retest reliability over time. This suggests that people are quite stable in their decisions about whether or not to consider the benefit of another person. However, when having to choose the actual degree of consideration (behaving prosocially vs. altruistically, or individualistically vs. competitively), people fluctuate more (
$p<0.01$
) (see Table A7 for all rank-order stabilities). In fact, all sliders in which one has the choice of whether or not to take the other’s benefit into account (i.e., the slider, Prosociality-Individualism, Altruism-Individualism, Prosociality-Competitiveness) show a high test–retest reliability over time. This suggests that people are quite stable in their decisions about whether or not to consider the benefit of another person. However, when having to choose the actual degree of consideration (behaving prosocially vs. altruistically, or individualistically vs. competitively), people fluctuate more ( $r_{2y}=0.38$
,
$r_{2y}=0.38$
, $N=451$
,
$N=451$
, $p<0.01$
;
$p<0.01$
; $r_{4y}=0.24$
,
$r_{4y}=0.24$
, $N=397$
,
$N=397$
, $p<0.01$
and
$p<0.01$
and $r_{2y}=0.26$
,
$r_{2y}=0.26$
, $N=451$
,
$N=451$
, $p<0.01$
;
$p<0.01$
; $r_{4y}=0.31$
,
$r_{4y}=0.31$
, $N=397$
,
$N=397$
, $p<0.01$
). Hence, the decision whether to consider the benefit of others at all seems to be an underlying, stable tendency, while the exact form it takes is more variable and thus more situational.
$p<0.01$
). Hence, the decision whether to consider the benefit of others at all seems to be an underlying, stable tendency, while the exact form it takes is more variable and thus more situational.
3.3. Comparison with other prosociality measures and psychometric constructs
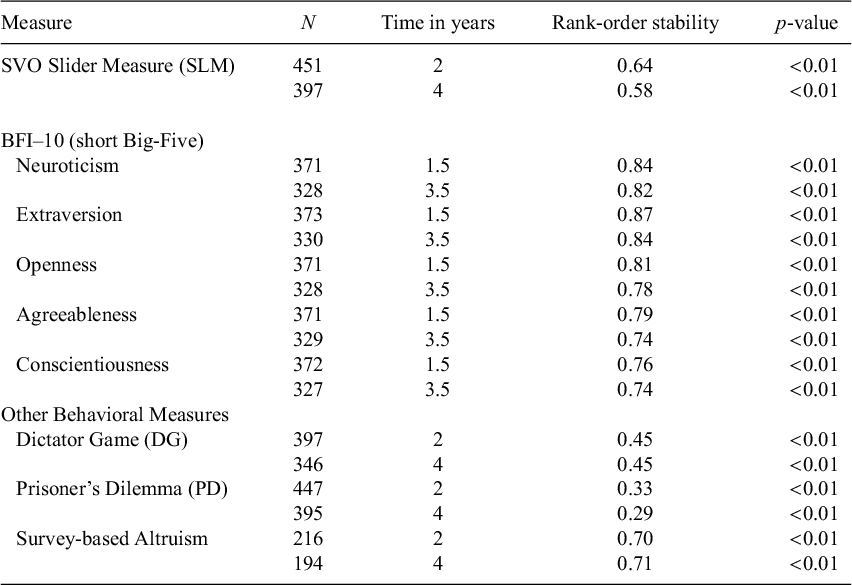
To contextualize the test–retest reliability of SVO, we first compare our findings about the SLM to several incentivized and unincentivized measures of altruism and cooperation in our data. When taking into account all rank-order stabilities, we find that on average, the BFI–10 items show a substantially higher rank-order stability than the SLM. This is consistent with the literature, in which the short version of the Big-Five is considered as very consistent over time (Rammstedt et al., Reference Rammstedt, Roemer and Lechner2023; Rieger et al., Reference Rieger, Göllner, Spengler, Trautwein, Nagengast and Roberts2017; Robinson, Reference Robinson2009). Compared to the other cooperation measurement methods, we find that the SLM’s rank-order stability is substantially higher than the DG and PD and comparable to the Survey-measured Altruism method (see Figure 3).Footnote 2
Fisher-z corrected ROS of different measures including BFI–10 (4 waves, short version of Big-Five), SLM (6 waves, SVO Angle), DG (5 waves), Survey-measured altruism (6 waves, Survey Altr.) and Prisoner’s Dilemma (4 waves, PD).
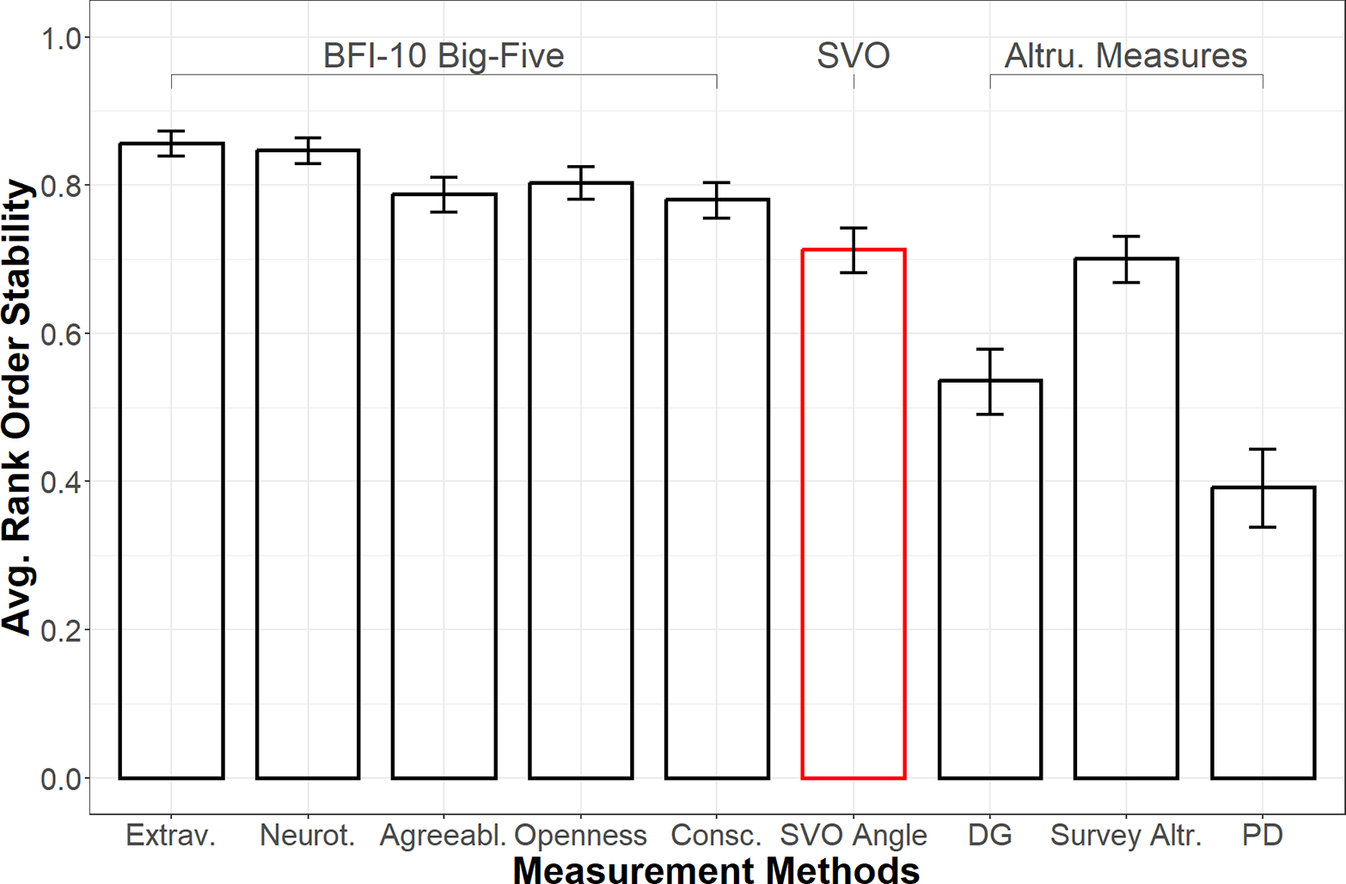
When only taking the 2- and 4-year time frames into account, we find a similar picture regarding the rank-order stability of the BFI–10, the DG and the PD (see Table 3). As we assessed the BFI–10 starting from wave 3, the time spans are reduced by half a year. All five components of the Big-Five exhibit high reliability across the 6 waves, with nearly all rank order stabilities exceeding the 0.75 threshold and thus showing very good reliability, despite the reduced version of the Big-Five we used in our study (see also Table 3). This is consistent with previous results and trait assessments of the Big-Five (Cobb-Clark and Schurer, Reference Cobb-Clark and Schurer2011). Notably, the 2 dimensions of the BFI–10 most closely related to the SLM, Agreeableness and Conscientiousness, show reliabilities between the SLM and the BFI–10’s most stable dimensions Extraversion and Neuroticism. This suggests that preferences related to ‘social’ traits might be more malleable than more personality-centered traits. Thus, compared to the BFI–10, the SLM is more variable over the course of 4 years. The altruism-survey questions exhibit a slightly higher rank-order stability than the SVO score for comparisons of 2 and 4 years.
Rank-order stability: SVO vs. BFI–10 and other cooperation measurements
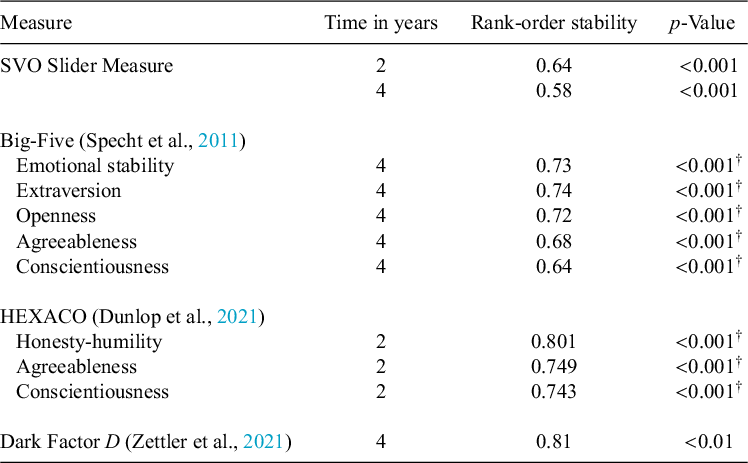
While the informative value of the BFI–10 is limited due to its brevity, a comparison of our data with other long-term studies shows a similar picture. Table 4 contrasts our results on the SLM ( $r_{2y} = 0.64$
, and
$r_{2y} = 0.64$
, and $r_{4y} = 0.58$
) with three well-established personality trait measures closely related to the concepts measured in the SLM. A comparison to the full inventory of the Big-Five is based on data by Specht et al. (Reference Specht, Egloff and Schmukle2011) collected over 4 years. They find test–retest reliability scores between
$r_{4y} = 0.58$
) with three well-established personality trait measures closely related to the concepts measured in the SLM. A comparison to the full inventory of the Big-Five is based on data by Specht et al. (Reference Specht, Egloff and Schmukle2011) collected over 4 years. They find test–retest reliability scores between $r_{4y}=0.64 (p <0.001)$
for Conscientiousness and
$r_{4y}=0.64 (p <0.001)$
for Conscientiousness and $r_{4y}=0.74$
(
$r_{4y}=0.74$
( $p <0.001$
) for Extraversion. Agreeableness, the arguably most closely related construct to the SLM, shows
$p <0.001$
) for Extraversion. Agreeableness, the arguably most closely related construct to the SLM, shows $r_{4y} = 0.68$
(
$r_{4y} = 0.68$
( $p <0.001$
). Dunlop et al. (Reference Dunlop, Bharadwaj and Parker2021) tested the test–retest reliability of the Honesty-humility, Agreeableness, and Conscientiousness scales from the HEXACO inventory over a period of 2 years among young adults and found
$p <0.001$
). Dunlop et al. (Reference Dunlop, Bharadwaj and Parker2021) tested the test–retest reliability of the Honesty-humility, Agreeableness, and Conscientiousness scales from the HEXACO inventory over a period of 2 years among young adults and found $r_{2y}>0.74$
for all 3 dimensions (see Table 4). Finally, Zettler et al. (Reference Zettler, Moshagen and Hilbig2021) report the test–retest reliability of the Dark factor D over a period of 4 years with
$r_{2y}>0.74$
for all 3 dimensions (see Table 4). Finally, Zettler et al. (Reference Zettler, Moshagen and Hilbig2021) report the test–retest reliability of the Dark factor D over a period of 4 years with $r_{4y} = 0.81 (p<0.01)$
, an excellent degree or reliability. Taken together, these instruments designed to measure personality traits have considerably higher test–retest reliability than the already fairly reliable SLM.
$r_{4y} = 0.81 (p<0.01)$
, an excellent degree or reliability. Taken together, these instruments designed to measure personality traits have considerably higher test–retest reliability than the already fairly reliable SLM.
Rank-order stability: Comparison of SVO with measurements of other studies
Note: $^{\dagger }$
Bonferroni-adjusted p-values
$^{\dagger }$
Bonferroni-adjusted p-values $p_{B} <0.05$
.
$p_{B} <0.05$
.
3.4. Age and gender differences in stability of SLM
To assess how SVO angles vary with time, gender and age at wave 1, we employ a linear mixed-effects model with random intercepts and random slopes for time (see Table A5). The inclusion of random intercepts allows each individual to have a unique baseline SVO angle, capturing the inherent variability in starting levels. Additionally, by incorporating random slopes for time, we account for the heterogeneity in individual trajectories, and, thus, the rate at which SVO angles change over time. The fixed effects include baseline age (i.e., age at wave 1), the time interval since the first wave (in years), and gender. A preliminary analysis on whether nonlinear effects of age might improve model fit was conducted by testing quadratic and cubic specifications. However, both AIC and BIC were lowest for the linear model, and likelihood ratio tests indicated that adding quadratic or cubic terms did not significantly improve model fit (all p > 0.05). Therefore, we retained the linear specification for age in our final model.
When assessing the random effects, we find substantial variability between individuals in both their starting SVO levels (Intercept variance = 142.95, SD = 11.96) and their trajectories over time (TimeInterval variance = 4.66, SD = 2.16, corr = $-$
0.25). The negative correlation between the random intercept and slope suggests that, throughout the sample, those individuals with initially higher SVO angles tend to experience a steeper decline in SVO angles over time.
$-$
0.25). The negative correlation between the random intercept and slope suggests that, throughout the sample, those individuals with initially higher SVO angles tend to experience a steeper decline in SVO angles over time.
When assessing the fixed effects, we observe two counteracting effects of time: a negative longitudinal effect (waves) and a positive cross-sectional effect (age). On the one hand, participants become more egoistic over the 4 years of the study, highlighted by the significant decline in the SVO angles over time (TimeIntervalYears = $-$
0.577, SE = 0.140, p < 0.001). This could be considered a longitudinal effect, potentially driven by exposure to the task or short term changes beyond the measurement procedure.
$-$
0.577, SE = 0.140, p < 0.001). This could be considered a longitudinal effect, potentially driven by exposure to the task or short term changes beyond the measurement procedure.
On the other hand, older individuals have slightly higher SVO scores (Age in 10-year steps = 1.05, SE = 0.48, p = 0.029). This cross-sectional effect could indicate a cohort effect. It is worth noting that the longitudinal effect is 5 times bigger than the cross-sectional effect, but both effects are substantively small (0.5 resp. 0.1 degrees per year). These two effects, however, are also diminishing with age: we find that age moderates the overall decline in SVO scores over time (Time Interval * Age = 0.218, SE = 0.115, p = 0.0582). Therefore, the negative effect of time on the SVO angle is less pronounced in older individuals, which also contributes to their higher SVO angle. Regarding gender differences, women have higher SVO scores than men (Female = 2.55, SE = 0.78, p < 0.001), suggesting greater prosocial behavior among women. However, we find no gender differences in the age-related increase in SVO (Age*Female = $-$
0.77, SE = 0.66, p = 0.242). Similarly, Figure 4a shows no gender differences in the older age categories except for the youngest cohort. Thus, both genders show similar trajectories over time.
$-$
0.77, SE = 0.66, p = 0.242). Similarly, Figure 4a shows no gender differences in the older age categories except for the youngest cohort. Thus, both genders show similar trajectories over time.
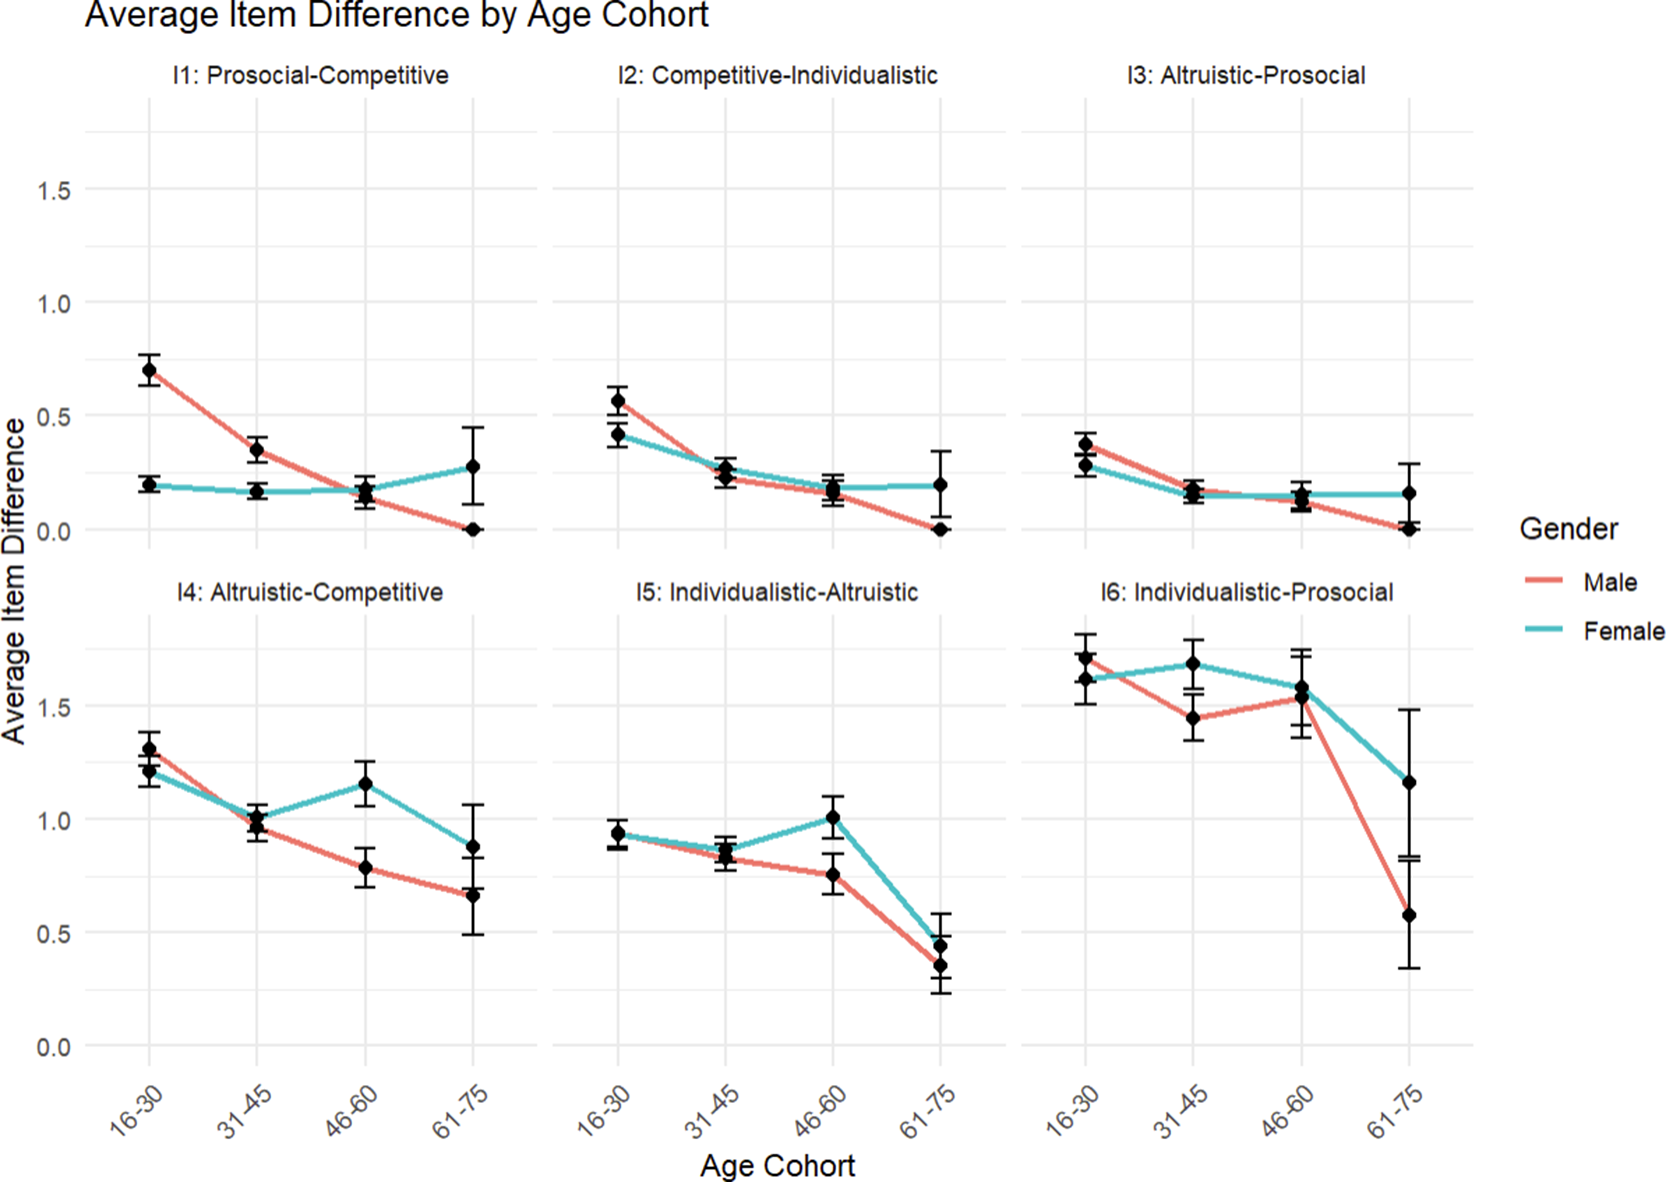
(a) Average SVO angles by age and gender across all waves and (b) average rank order stability by age cohort and gender (Fisher z corrected).
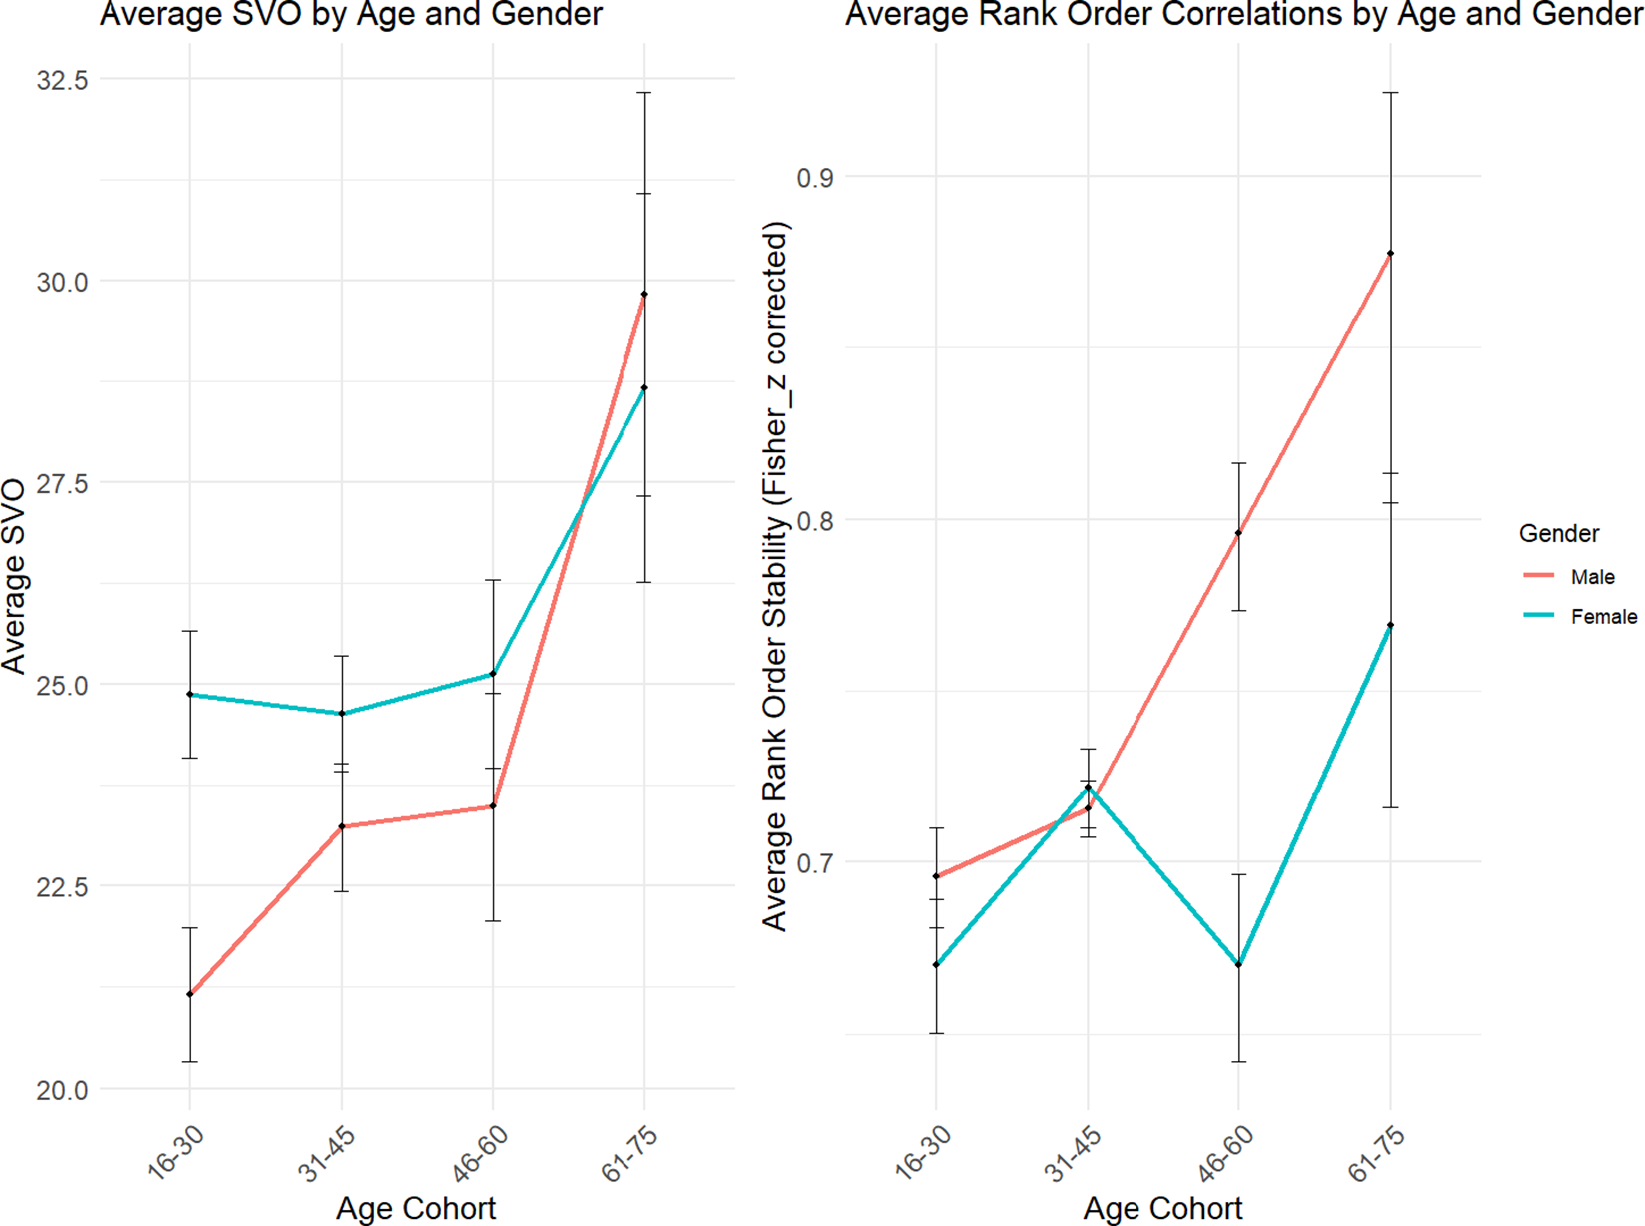
To further evaluate SVO stability of participants over time, we calculate the SVO Change. This variable represents the change in each participant’s SVO angle for each wave combination. Thus, we use a multilevel model to examine whether these changes are influenced by the time interval between assessments, as well as by the participants’ age and gender (see Table A6 Model 2). As expected, longer intervals between assessments are associated with greater variability in SVO (Time Interval: 0.532, p < 0.001). Furthermore, older participants change their SVO angles less (Age: $-$
0.453, p = 0.0336). On the other hand, gender does not play a role regarding the stability of SVO scores (
$-$
0.453, p = 0.0336). On the other hand, gender does not play a role regarding the stability of SVO scores ( $p>$
0.05; see also Figure 4b for a visualization). Thus we can conclude that age is not only relevant for the level of prosociality but also for its stability.
$p>$
0.05; see also Figure 4b for a visualization). Thus we can conclude that age is not only relevant for the level of prosociality but also for its stability.
4. Discussion
The importance of investigating prosocial behavior and attitudes has grown over the past decades, particularly in the context of recent discussions on environmental protection, climate change and migration (Van Lange and Rand, Reference Van Lange and Rand2022). The need to study prosociality is driven by the fact that many goods and resources are becoming increasingly scarce and distributional decisions and compromises have to be made, which are often affected by the different prosocial preferences of individuals. Despite a plethora of tools for measuring distributional preferences as an expression of prosociality, the reliability of these instruments remains uncertain, and determining the most effective among them is a pressing challenge. Notably, few of these tools have been tested over a long period but rather in very short time frames. We, therefore, conducted a 4-year-long comprehensive analysis, gathering data in 6 waves on various metrics of prosociality.
Overall, we observe a slight overall decrease in the sample mean of prosociality. Furthermore, we observed characteristic distributional spikes formed by large groups of individualists and prosocials across the waves. This corresponds to the results of most other studies using the SLM, which also find two large groups within the individualists and prosocials and hardly categorize any individual as competitive or altruistic (Murphy and Ackermann, Reference Murphy and Ackermann2014; Murphy et al., Reference Murphy, Ackermann and Handgraaf2011; Rahal et al., Reference Rahal, Fiedler and De Dreu2020; Van Doesum et al., Reference Van Doesum, Murphy, Gallucci, Aharonov-Majar, Athenstaedt, Au, Bai, Böhm, Bovina, Buchan, Chen, Dumont, Engelmann, Eriksson, Euh, Fiedler, Friesen, Gächter, Garcia and Van Lange2021).
On the individual level, the SLM shows high reliability, both in the short and in the long term, indicated by the high rank-order stability across all waves. The findings underscore the reliability of the SLM as a measure of distributional preferences and are consistent with previous studies (e.g., de Matos Fernandes et al., Reference de Matos Fernandes, Bakker and Dijkstra2022; Murphy et al., Reference Murphy, Ackermann and Handgraaf2011).
When positioning the SLM in the landscape of different measures (behavioral expressions) of prosociality, we find that the reliabilities of measures such as the BFI–10, the Big-Five or HEXACO are clearly higher than the reliability of the SLM. On the other hand, other incentivized games that measure cooperation or prosociality, such as the frequently employed DG or the Prisoner’s Dilemma (PD), exhibit a markedly higher fluctuation over time. This suggests that the SLM can assess prosociality (regarding distributional preferences) more reliably than single-choice games such as the DG or the PD. Regarding the survey-based measurement of altruism, some variation in answers was expected, as the questions refer to very specific behaviors that may change depending on specific life situations. For example, certain behaviors such as ‘watering someone’s plants’ or ‘helping someone to find a job’ depend very much on whether the current life situation in terms of time, circumstances, and opportunity allows it and if one can keep track of such events. The fact that the individuals nevertheless answered quite consistently indicates the reliability of the survey measure and its possibility of capturing altruism not only on a situational basis.
Interestingly, we find two counteracting effects associated with time. On average, our participants become (slightly) more egoistic with each wave of participation over up to 2 years. This effect could be due to some form of task familiarity or external effects (e.g., changes in the economy or shifts in social discourses over fairness). On the other hand, older people are somewhat more prosocial than younger participants. While we cannot experimentally test for these effects, they could for instance be driven by cohort effects.
Finally, we find that age plays a significant role in SVO stability, with older individuals displaying more consistent orientations compared to younger cohorts, who show greater variability. This variability in younger cohorts could hint at their ongoing identity development during early adulthood, where social contexts and experiences play a major role (Roberts and DelVecchio, Reference Roberts and DelVecchio2000). Gender differences are minor, with women being more prosocial in general but not significantly more variable overall. Item-specific analyses indicate that individuals are particularly stable in deciding whether or not to consider another’s benefit, compared to decisions about the actual magnitude of the other’s benefit. Overall, our results suggest that SVO stability is shaped by demographic factors and specific thematic characteristics. Future studies focusing on younger populations or life transitions could provide further insight into when and how SVOs stabilize (e.g., Ehlert et al., Reference Ehlert, Kindschi, Algesheimer and Rauhut2020).
The study is subject to some limitations. The sample is composed exclusively of US-American individuals. Although several population groups are represented, such as South Americans and individuals from the Asia-Pacificregion, the US still mainly reflects a highly individualistic culture (Hofstede et al., Reference Hofstede, Hofstede and Minkov2010). A cross-cultural study could be beneficial at this point and better capture the idiosyncrasies of different cultures. Furthermore, long-term assessments often suffer from the fact that many participants leave the study between waves, and dropping-out might correlate with the dependent variable. In our study, however, we find only very limited evidence for selective non-participation. Accordingly, our study clarifies and contributes to the question of the reliable measurement of social preferences and provides the possibility to use this construct more effectively in research and hopefully to help address pressing social and economic issues.
Our results indicate that it might be most fruitful to think of the SLM as a reliable instrument for the measurement of a specific behavioral tendency that bears significant implications, particularly in incentivized contexts. In contradistinction to comprehensive traits, which encompass consistent patterns of thought, emotion, and behavior (Funder and Fast, Reference Funder and Fast2010), the SLM focuses exclusively on behavior. It has been shown to offer higher reliability than single games such as the DG or the PD. It is imperative to recognize the SLM as a behavioral manifestation of a trait (e.g., Agreeableness, the D factor, etc.), characterized by its high reliability. However, it is crucial to note that the SLM captures only a single facet of that trait. Other behavioral expressions, such as dishonesty, cheating, or vengeance, are not intentionally measured by the SLM. Given its narrow focus on a specific behavioral expression, the SLM is not expected to match the stability of the underlying trait itself. Nevertheless, it provides a significantly more stable measure of behavior compared to many alternative methods. For instance, typical games have shown test–retest correlations of $r_{2y}$
= .45 for the DG and
$r_{2y}$
= .45 for the DG and $r_{2y}$
= .33 for the PD, whereas the SLM demonstrates considerably greater stability.
$r_{2y}$
= .33 for the PD, whereas the SLM demonstrates considerably greater stability.
Data availability statement
Please retrieve the data from the following link: https://osf.io/ygfwt/.
Acknowledgements
We are very grateful for the extensive and helpful feedback from Antonia Velicu, Julia Jerke, Justus Rathmann, Nico Mutzner and Vincent Oberhauser and the fruitful discussion with participants from the course Advanced Topics in Social Theory and Quantitative Methods.
Funding statement
This work was supported by Grants BSSGIO_155981 and 10001A_176333 from the Swiss National Science Foundation.
Competing interests
We declare that this research was conducted in the absence of any commercial and financial relationship that could be construed as a potential conflict of interest.
Ethical standards
This research meets all ethical guidelines, including adherence to the legal requirements of the studied countries.
A. Appendix
A.1 Survey items: Altruism, BIG5
Past altruistic behavior
Answer categories: ‘Never’, ‘Once (year)’, ‘At least 2-3x (year)’, ‘Once (month)’, ‘Once (week)’, ‘More than once (week)’.
Big-Five Inventory questions
Note: Items containing an (R) are reversed coded.
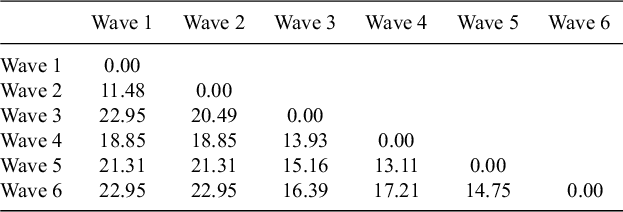
A.2 Additional analyses: Group change and multilevel analyses
Percentage change of group membership between waves
Note: % of participants that changed their SVO group between waves.
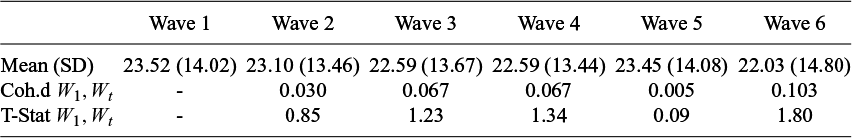
SVO angle means

Note: Pairwise t-tests $^{*}p<0.05;\ ^{**}\!p<0.01;\ ^{***}\!p<0.001$
.
$^{*}p<0.05;\ ^{**}\!p<0.01;\ ^{***}\!p<0.001$
. $^{\dagger }$
Bonferroni-adjusted p-values
$^{\dagger }$
Bonferroni-adjusted p-values $p_{B} <0.05$
.
$p_{B} <0.05$
.
The following Tables A5 and A6 depict multilevel-models assessing the influence of time interval, gender and age on the SVO angle and on the difference of the SVO angle between waves.
SVO Scores: Influence of age, gender, and time
Note: $ p<0.1;\ ^{*}\!p<0.05;\ ^{**}\!p<0.01;\ ^{***}\!p<0.001$
; Time interval depicts the time (in years) passed since first wave; Age is centered and depicts 10 year steps.
$ p<0.1;\ ^{*}\!p<0.05;\ ^{**}\!p<0.01;\ ^{***}\!p<0.001$
; Time interval depicts the time (in years) passed since first wave; Age is centered and depicts 10 year steps.
Stability of SVO scores: Influence of age, gender, and time
Note: $^{*}p<0.05;\ ^{**}\!p<0.01;\ ^{***}\!p<0.001$
; Time interval depicts the time (in years) passed since first wave; Age is centered and depicts 10 year steps.
$^{*}p<0.05;\ ^{**}\!p<0.01;\ ^{***}\!p<0.001$
; Time interval depicts the time (in years) passed since first wave; Age is centered and depicts 10 year steps.
A.3 Item specific analysis of stability
Rank-order stability of 6 sliders
Note: Spearman’s r between waves ( $^{*}p<0.1;\ ^{**}\!p<0.05;\ ^{***}\!p<0.01$
);
$^{*}p<0.1;\ ^{**}\!p<0.05;\ ^{***}\!p<0.01$
); $^{\dagger }$
Bonferroni-adjusted p-values
$^{\dagger }$
Bonferroni-adjusted p-values $p_{B} <0.05$
.
$p_{B} <0.05$
.
To assess influences of other factors such as age or gender, we build individual linear mixed models for each item with absolute differences between assessment intervals as the dependent variable and age, gender, interval length, and their interaction as fixed effects. Each model includes a random intercept for participants to account for individual differences in baseline stability. As expected, interval length has a strong influence on nearly all items, with longer intervals between assessments leading to reduced stability. Only the comparison Altruism-Prosociality is unaffected by interval length (coef. = $-$
0.0001, p>0.1), suggesting that this comparison may capture a behavior that remains stable over time.
$-$
0.0001, p>0.1), suggesting that this comparison may capture a behavior that remains stable over time.
Age emerges as a significant stabilizing factor for the comparison between Competitiveness and any other value orientation. Older participants showed less difference between assessments (coef. (Comp-Prosoc) = $-$
0.019; coef. (Comp-Indiv) =
$-$
0.019; coef. (Comp-Indiv) = $-$
0.015; coef. (Comp-Altru) =
$-$
0.015; coef. (Comp-Altru) = $-0.015$
, p<0.001). This suggests that younger people vary more in their decisions about whether or not to engage in competitive behavior. Thus, age seems to have a stabilizing effect on competitiveness.
$-0.015$
, p<0.001). This suggests that younger people vary more in their decisions about whether or not to engage in competitive behavior. Thus, age seems to have a stabilizing effect on competitiveness.
Gender differences are most prominent for the comparison Prosociality-Competitiveness, where females demonstrate significantly greater stability than males (coef. = $-$
0.989, p<0.001). For this comparison, also a significant age-gender interaction is found (coef. = 0.021, p<0.001), indicating that age has a stabilizing effect for men regarding the choice between prosociality and competitiveness (see Figure A1).
$-$
0.989, p<0.001). For this comparison, also a significant age-gender interaction is found (coef. = 0.021, p<0.001), indicating that age has a stabilizing effect for men regarding the choice between prosociality and competitiveness (see Figure A1).
Itemwise assessment of stability according to age cohort and gender.
A.4 Analysis for full participants
Group change: Percentage change of group membership between waves
Note: % of participants (participating in all 6 waves) that changed their SVO group between waves.
SVO angle: Means per wave for full participants.
Note: Pairwise t-tests $^{*}p<0.05;\ ^{**}\!p<0.01;\ ^{***}\!p<0.001$
.
$^{*}p<0.05;\ ^{**}\!p<0.01;\ ^{***}\!p<0.001$
. $^{\dagger }$
Bonferroni-adjusted p-values
$^{\dagger }$
Bonferroni-adjusted p-values $p_{B} <0.05$
.
$p_{B} <0.05$
.
A.5 Additional data on sample
Drop out: Influence of age, gender, college, and SVO angle
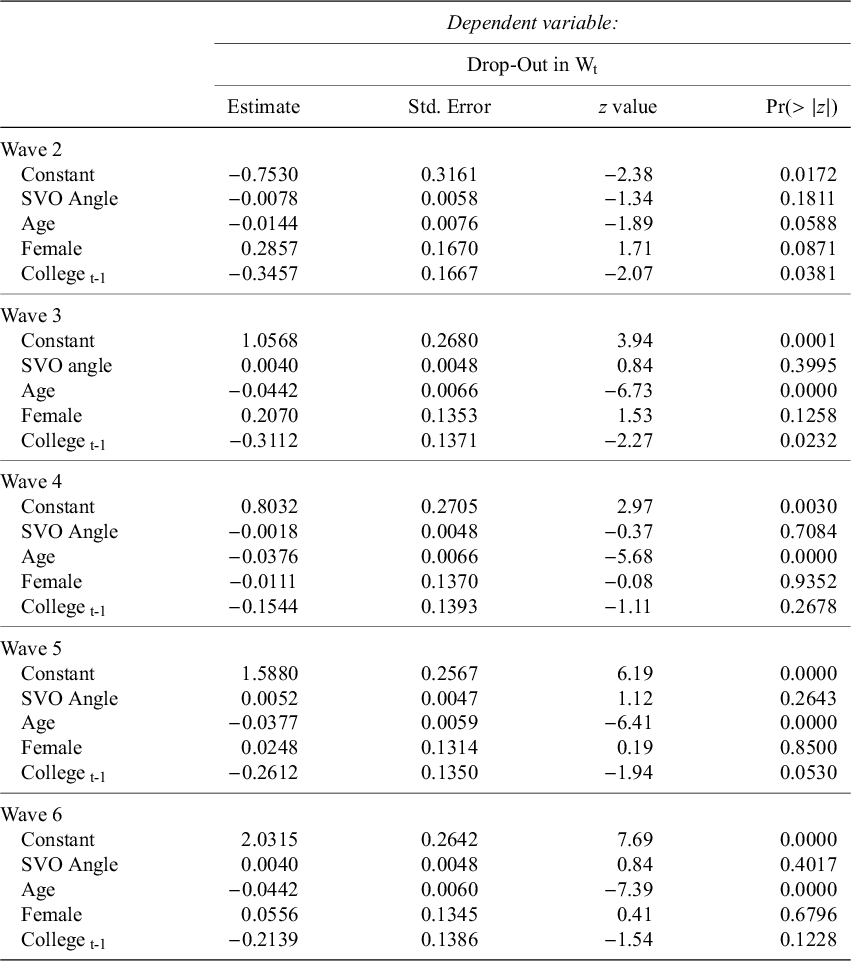
Note: Influence of sociodemographic variables and SVO angle on probability to drop out.
Sample description (including dropouts)
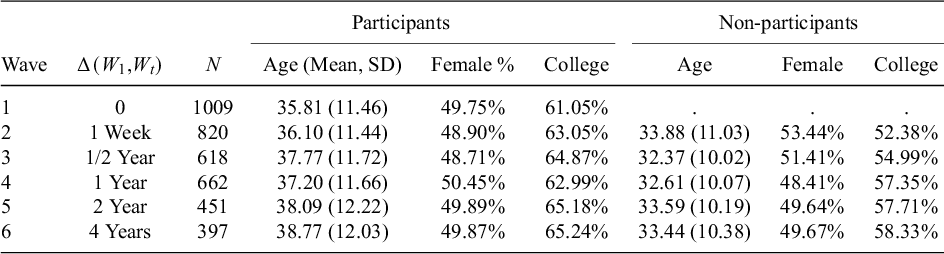
Note: Descriptive variables for each wave. College in % depict the percentage with college education.


 Open access