


Introduction
Right-wing beliefs function as a salve for people who are chronically anxious and fearful, at least according to one of the oldest and most influential theories in political psychology (Fromm Reference Fromm1947; Jost et al. Reference Jost, Glaser, Kruglanski and Sulloway2003; McClosky Reference McClosky1958; Reich Reference Reich1946[Reference Reich1933]; Wilson Reference Wilson1973). Yet recent research shows that liberals, not conservatives, are more prone to negative emotions (Gimbrone et al. Reference Gimbrone, Bates, Prins and Keyes2022; Helminen, Elovainio, and Jokela Reference Helminen, Elovainio and Jokela2022). The link between mental health and ideology has generated much interest, sending journalists and pundits scrambling to figure out why liberals are so ‘depressed, anxious, or otherwise neurotic compared to conservatives’ (al Gharbi Reference al Gharbi2023). Between January 2021 and January 2024, research on this topic was summarized and debated over thirty times in newspapers, magazines, and blogs (Table A1). The New York Times alone published four op-eds debating the significance of liberal distress, drawing passionate rejoinders from its readers (New York Times 2023).
While media coverage of the link between left-wing ideology and distress is new, the finding itself is not. For nearly two decades, researchers have consistently found that people high in neuroticism – a personality trait characterized by anxiety and emotional volatility – are more likely to support left-wing economic policies and to vote for parties that advocate redistribution (Aidt and Rauh Reference Aidt and Rauh2018; Bakker Reference Bakker2017; Bakker and Lelkes Reference Bakker and Lelkes2018; Barbaranelli et al. Reference Barbaranelli, Caprara, Vecchione and Fraley2007; Fatke Reference Fatke2017; Gerber et al. Reference Gerber, Huber, Doherty, Dowling and Ha2010, Reference Gerber, Huber, Doherty and Dowling2011, Reference Gerber, Huber, Doherty and Dowling2012; Mondak Reference Mondak2010; Mondak and Halperin Reference Mondak and Halperin2008; Morton, Tyran, and Wengström Reference Morton, Tyran and Wengström2011; Tepe and Vanhuysse Reference Tepe and Vanhuysse2020, see also Helminen, Elovainio, and Jokela Reference Helminen, Elovainio and Jokela2022). In fact, political scientists observed this link in semi-structured interviews as early as the 1960s, leading some to propose that left-wing politics helps to satisfy people’s psychological needs (Lane Reference Lane1965; Rothman and Lichter Reference Rothman and Lichter1978). Yet, although political scientists have long observed this link, there is little consensus on why it exists.
Given renewed interest in the link between ideology and negative emotions, we think the time is right to refine our understanding of what drives this relationship. We propose the social support hypothesis, which argues that one reason neuroticism is linked to politics is because neurotic people are more sensitive to social exclusion and, therefore, more likely to feel needy and vulnerable. These feelings, in turn, cause people to favour policies associated with care and provisioning, such as redistribution. Notably, the social support hypothesis runs counter to the influential motivated social cognition theory of ideology, which predicts that fearful people should gravitate toward right-wing ideology in capitalist societies (Jost et al. Reference Jost, Glaser, Kruglanski and Sulloway2003). Despite this theory’s popularity, we argue that the social support hypothesis is better able to explain observed relationships between personality and economic attitudes.
Our hypothesis helps to address another surprising finding: despite facing very different sets of risks and incentives, rich people and poor people both tend to embrace redistribution when they are high in neuroticism and reject it when they are low in neuroticism (Bakker Reference Bakker2017). This equivalence is difficult to reconcile with models of redistribution from political economy, which suggest that poorer people should generally want more redistribution (Meltzer and Richard Reference Meltzer and Richard1981; Romer Reference Romer1975; Rueda and Stegmueller Reference Rueda and Stegmueller2019). However, the disconnect makes sense if we acknowledge that modern citizens interpret politics using intuitions that evolved for the small-scale world of our foraging ancestors (Aarøe and Petersen Reference Aarøe and Petersen2013; Aarøe and Petersen Reference Aarøe and Petersen2014; Hansen Reference Hansen2019). Humans have traditionally relied on our communities to survive health crises and food shortages, and this history has attuned our minds to social threats like exclusion and rejection (Bailey Reference Bailey1991; Kaplan et al. Reference Kaplan, Hill, Lancaster and Hurtado2000; Sugiyama Reference Sugiyama2004a; Sugiyama Reference Sugiyama and Alvard2004b; Sugiyama and Chacon Reference Sugiyama, Chacon, Cronk, Chagnon and Irons2000). As a result, people living in modern environments often use social cues rather than finances to infer whether they will benefit from redistribution – especially when they are high in neuroticism.
Below we connect the politics of redistribution to theories about personality, evolution, and politics (Bakker Reference Bakker, Huddy, Sears, Levy and Jerit2023; Petersen Reference Petersen, Huddy, Sears, Levy and Jerit2023). First, although neuroticism captures both anxiety and emotional volatility, we show that it is primarily anxiety that predicts support for left-wing economic policies (but not for most social policies). This is because anxiety, but not volatility, is related to concerns about exclusion. Second, we show that anxiety’s predictive power is on par with, if not greater than, measures of respondents’ material security. Third, we show that the link between anxiety and left-wing economics is strongest among people who currently feel excluded or have little social support. Our results come from four representative surveys in the US and the Netherlands and two original experiments, totalling nearly 18,000 people.
In closing, we discuss how our findings may help explain mental health trends among liberals. We also discuss what our findings mean for two long-running debates in political science: how anxiety shapes political attitudes, and how, if at all, self-interest shapes voters’ support for redistribution. Lastly, we explain how our approach can be used to unravel other relationships between personality traits and political behaviours.
What is Neuroticism For?
Neuroticism is a stable individual difference defined by ‘negative emotionality, such as feeling anxious, nervous, sad, and tense’ (John and Srivastava Reference John and Srivastava1999, 121). It is often measured by asking people whether they would characterize themselves as ‘anxious’ and ‘easily upset’. But what is neuroticism, beyond differences in how people respond to surveys? By understanding the underlying psychology, we can make better predictions about how personality shapes people’s political behaviour (Lukaszewski Reference Lukaszewski and Rauthmann2021; Lukaszewski et al. Reference Lukaszewski, Lewis, Durkee, Sell, Sznycer and Buss2020). An initial answer comes from work on personality in political science (Gerber et al. Reference Gerber, Huber, Doherty, Dowling and Ha2010). These authors argue that neurotic people are ‘more anxious and worry-prone’, which explains why they are ‘more likely to embrace liberal economic policies’ that would soften the blow of a job loss and other economic vicissitudes (Gerber et al. Reference Gerber, Huber, Doherty, Dowling and Ha2010, 114). But if neurotic people are generally worry-prone, one might also expect them to favour specific policies related to military threats and terrorism – obvious topics of worry. In fact, neuroticism does not consistently predict people’s views on national security (Gravelle, Reifler, and Scotto Reference Gravelle, Reifler and Scotto2020; Mondak Reference Mondak2010). This suggests that something more specific than worry is driving the link between neuroticism and economic attitudes. One clue comes from the finding that neurotic people are especially attuned to social threats, especially social exclusion – that is being rejected or shunned (Denissen and Penke Reference Denissen and Penke2008; Gunthert, Cohen, and Armeli Reference Gunthert, Cohen and Armeli1999; Nezlek et al. Reference Nezlek, Wesselmann, Wheeler and William2012).
It is not obvious that people who are prone to negative emotions should be especially sensitive to social exclusion. There are many kinds of threats – natural disasters, wild animals, food poisoning – that are deadlier for modern humans than rejection. To understand why rejection hurts so much, we must understand our species’ evolution. All animals possess neural systems for managing threats, and humans experience the activation of this system as anxiety (Gray and McNaughton Reference Gray and McNaughton2000). But humans differ from other animals in the threats we have typically faced. More than other mammals, humans evolved to live in complex groups (Dunbar Reference Dunbar1996). A major benefit of this is that in times of need, we could turn to our communities for help. Yet our reliance on our communities also made us uniquely vulnerable to social exclusion. Our species evolved in small bands of foragers with little ability to store resources for emergencies (Kelly Reference Kelly1995). When our ancestors suffered misfortune – injury, illness, or just bad luck foraging – they could not go to the fridge or an ATM. They relied on their communities for care. If group members were unwilling to help, a broken bone or a fever could spell death.
Studies of contemporary foraging groups illustrate the challenges that our species faced during its evolution. Among the Shiwiar, a forager-horticulturalist group in the Ecuadorian Amazon, about 65 per cent of the adults would have already died had they not been supported by the community during hardships (Sugiyama Reference Sugiyama2004a; Sugiyama Reference Sugiyama and Alvard2004b). Heavy reliance on social support to survive health emergencies is also documented among the Ache foragers of Paraguay (Kaplan et al. Reference Kaplan, Hill, Lancaster and Hurtado2000). Among the Efe of Africa, temporary disability prevented the men from foraging so often it would be like a modern office worker calling in sick one day a week, every week (Bailey Reference Bailey1991). The same is true of the Yora of Peru, where men were unable to hunt due to disability on 10 per cent of days (Sugiyama and Chacon Reference Sugiyama, Chacon, Cronk, Chagnon and Irons2000). Without aid from the community, these men and their families would have had difficulty surviving.
Given that social support was the difference between life and death for our ancestors, our minds likely evolved psychological abilities to maintain support and avoid exclusion. Consistent with this expectation, psychologists have found that our minds possess an early-warning system that looks for cues of rejection and responds by activating parts of the brain’s pain network associated with anxiety and distress (Eisenberger Reference Eisenberger and DeWall2013; Kross et al. Reference Kross, Berman, Mischel, Smith and Wager2011; MacDonald and Leary Reference MacDonald and Leary2005). The outputs of this system – feelings like helplessness, vulnerability, and impending harm – are unpleasant, but they would have helped our ancestors by warning them of potential exclusion and driving them to recruit support (Leary and Baumeister Reference Leary, Baumeister and Zanna2000; Spoor and Williams Reference Spoor, Williams, Forgas, Haselton and von Hippel2007). This early-warning system is especially reactive and intense in neurotic people, making them particularly likely to feel helpless and needy when they think they have been rejected (Denissen and Penke Reference Denissen and Penke2008; Gunthert, Cohen, and Armeli Reference Gunthert, Cohen and Armeli1999; Nezlek et al. Reference Nezlek, Wesselmann, Wheeler and William2012).
Importantly for our hypothesis, the overall trait of neuroticism, as traditionally measured, is composed of at least two distinct facets (which likely derive from two related but somewhat independent brain systems: DeYoung Reference DeYoung2010; Gray and McNaughton Reference Gray and McNaughton2000). One major facet of neuroticism picks up on differences in the system that generates anxiety and distress; this facet, called anxiety, shapes whether people feel vulnerable when threatened and is implicated in the social support hypothesis (Bainbridge, Ludeke, and Smillie Reference Bainbridge, Ludeke and Smillie2022). The other facet picks up on differences in reactive anger and mood swings; this facet, called emotional volatility, is unrelated to whether people feel vulnerable (DeYoung Reference DeYoung2010). Because anxiety, but not volatility, indexes how easily people feel insecure and needy in response to social exclusion, we expect the anxiety facet but not the volatility facet to predict people’s views about economics.
Above, we took for granted that the tuning of evolved psychological systems can differ from person to person, producing stable traits like neuroticism and its facets of anxiety and volatility. But why, if managing social threats was so important for survival, is this system so much more reactive in some people than others (Bleidorn et al. Reference Bleidorn, Schwaba, Zheng, Hopwood, Sosa, Roberts and Briley2022)? There might initially appear to be a tension between describing anxiety as a universal, evolved psychological mechanism and as a heritable individual difference. However, such tension is likely illusory (Lopez and McDermott Reference Lopez and McDermott2012). People differ genetically on most traits because our genomes are constantly mutating. These mutations introduce small, probabilistic differences in how people’s brains develop, which may then be inherited by their children (Kondrashov Reference Kondrashov2017). Beyond genes, randomness in development is also important. Even animals with identical genomes raised in identical environments develop differently due to inherent randomness in how cells translate the genetic code. The resulting differences are often just as stable as differences attributable to genes (Mitchell Reference Mitchell2018). For neuroticism specifically, studies of adoptees, twins, and their families find that variation in the trait is mostly due to genetic differences and randomness (Boomsma et al. Reference Boomsma, Helmer, Nieuwboer, Hottenga, de Moor, van den Berg, Davies, Vink, Schouten, Dolan, Willemsen, Bartels, van Beijsterveldt, Ligthart and de Geus2018; Matteson, McGue, and Iacono Reference Matteson, McGue and Iacono2013). Thus, even traits that were important for human survival – including feeling vulnerable when excluded – develop differently in different people (Tooby and Cosmides Reference Tooby and Cosmides1990).
Connecting Neuroticism to the Politics of Redistribution
This psychology of inclusion and exclusion evolved to operate in a world few modern humans inhabit. For our ancestors, exclusion meant that you would soon be needy and helpless. With the inventions of the refrigerator and the ATM, exclusion no longer carries such severe consequences. Yet, as Aarøe and Petersen explain, ‘“individuals” representations of many culturally modern phenomena are shaped by mental programmes that evolved to process evolutionarily recurrent equivalents’ (2013, 2551). This leads to a key premise of our hypothesis: when modern people reason about economic policy, they often use intuitions designed for reasoning about care and sharing within small foraging bands (Delton et al. Reference Delton, Petersen, DeScioli and Robertson2018). Consider the finding that people argue for more redistribution when they are hungry (Aarøe and Petersen Reference Aarøe and Petersen2013; Petersen et al. Reference Petersen, Aarøe, Jensen and Curry2014). If you live in a foraging community with friends and family, it makes sense to advocate for sharing when hungry – your arguments might actually get you more food. Such an intuition seems irrational in a modern state – your individual opinion is largely irrelevant and, regardless, policies change too slowly to solve your momentary hunger. Nonetheless, evolved intuitions may lead neurotic people to respond to cues of exclusion by supporting government policies that provide care and resources.
A countervailing force, however, is that debates over economic policy are often technical and dry compared to debates over social policies like abortion and same-sex marriage. Because of this complexity, citizens may have difficulty connecting economic policy to their own needs and predispositions – laypeople may not always interpret these debates using evolved intuitions about mutual aid. Indeed, people who are politically engaged can more easily connect their interests and values to economic policy (Federico and Malka Reference Federico and Malka2018). Thus, a lack of political engagement may limit the extent to which feeling vulnerable pushes people to the left on economic policy; people may need to be familiar with the way that politicians talk about redistribution and welfare before they begin to perceive these programmes as ‘evolutionarily recurrent equivalents’ of caring and sharing in small groups (Aarøe and Petersen Reference Aarøe and Petersen2013).
In sum, the social support hypothesis explains when and why neurotic people prefer redistribution according to the following logic:
-
1. When anxious, people feel needy and try to secure care and provisioning.
-
2. Because humans evolved in ecologies where social support and not money was a key source of material security, our anxiety system is selectively triggered by cues of exclusion.
-
3. Because people often interpret modern politics with evolved intuitions, people with sensitive systems for managing social threats – those high in neuroticism, specifically its anxiety facet – will advocate for government policies that provide care and provisioning for the vulnerable, particularly when they feel excluded.
-
4. The link between anxiety and left-wing economics might be limited to people who are politically engaged.
We test the social support hypothesis using four representative datasets from the US and the Netherlands and two original experiments. First, we show that dispositionally anxious people express more support for redistribution and social welfare programmes, but not for left-wing policies with less connection to care and resources, like legalizing same-sex marriage and easing restrictions on immigration. We also expand on previous analyses, which did not consider other sources of vulnerability. We do so by controlling for multiple sources of material security, including income, wealth (proxied by homeownership), job loss, and health insurance. We then compare the predictive power of these variables with anxiety. These controls help to rule out the possibility that anxiety is confounded with economic hardship. They also allow us to see how anxiety compares with variables that are often thought to shape economic attitudes.
Second, we directly compare the power of neuroticism’s facets of anxiety and volatility to predict people’s views on redistribution. According to the social support hypothesis, of the two facets anxiety should primarily drive whether people support left-wing economic policy because only anxiety reflects how sensitive people are to exclusion.
Third, we test whether it is specifically anxious people who currently feel excluded who support left-wing economic policy. Remember that anxiety is triggered by an early-warning system that scans for threats, especially exclusion and injury. For anxious people, this alarm is more easily triggered. But being more easily triggered does not mean that it is always on and blaring. Consider that if a fire alarm is sensitive, it’s not that its siren is continuously ringing. Instead, it takes fewer smoke particles to set it off. Similarly, neurotic people do not feel anxiety continuously. Instead, their anxiety should be more easily triggered by signs of exclusion. We test this in two ways. As one method, we use existing datasets to test whether it is people who are both anxious and who have little social support who want more redistribution. As another method, we use original experiments. While we cannot manipulate people’s personalities, we can manipulate social exclusion (Wolf et al. Reference Wolf, Levordashka, Ruff, Kraaijeveld, Lueckmann and Williams2015). We simulate exclusion by having subjects write a brief profile that is posted in a (fake) online group. We then manipulate the number of likes their profile receives from other group members. It should be among rejected people – those who receive few likes – that anxiety most matters for predicting whether they support redistribution.
Finally, we test whether any links between anxiety and redistribution were confined to the politically engaged. Unlike the other predictions derived from the social support hypothesis, which were robustly supported in our results, the effect of political engagement was inconsistent across datasets. This suggests that if engagement matters for the anxiety-redistribution link, the real effect is not large. This points to the power of evolved intuitions involving exclusion, vulnerability, and care: regardless of their political engagement, people easily connect these ideas to what might seem to be sterile economic policy.
Data and methods
Samples
We used data from four nationally representative surveys: the American National Election Studies (ANES); the Cooperative Election Study (CES; formerly the Cooperative Congressional Election Study [CCES]); The American Panel Survey (TAPS); and the Longitudinal Internet Studies for the Social Sciences (LISS). The first three are US samples; LISS is a Dutch sample. We searched for surveys having measures of personality, political attitudes, personal economic security, and perceptions of social exclusion. Most had all four; the ANES is missing only perceptions of exclusion. We also ran original experiments with two online convenience samples in the US using CloudResearch (Litman, Robinson, and Abberbock Reference Litman, Robinson and Abberbock2017). See Table 1 and Appendix B for information on each sample.Footnote 1
Overview of datasets

Note: In TAPS, we average anxiety items from two back-to-back administrations of the TIPI to increase reliability (r = 0.57, p < 0.001). Sample sizes reflect the number of complete cases in the regressions reported in Figs 2 and 3. Note we drop additional cases when the social exclusion variables are included (see Appendix C).
Measuring Personality and Economic Preferences
To measure personality, we used scales based on the Big Five taxonomy, which organizes personality into traits of neuroticism, agreeableness, extraversion, conscientiousness, and openness to experience (John and Srivastava Reference John and Srivastava1999). These scales ask respondents to rate how well a series of adjectives and phrases describe themselves (see Table 2 and Appendix B). In the ANES, CES, and TAPS, we used the Ten Item Personality Inventory (TIPI; Gosling, Rentfrow, and Swann Reference Gosling, Rentfrow and Swann2003); in LISS, we used the International Personality Item Pool inventory (IPIP; Goldberg et al. Reference Goldberg, Johnson, Eber, Hogan, Ashton, Cloninger and Gough2006); and in the CloudResearch samples, we used the Big Five Aspects Scale (BFAS; DeYoung, Quilty, and Peterson Reference DeYoung, Quilty and Peterson2007). These inventories were not designed to measure specific facets of the Big Five traits like anxiety. However, the IPIP and BFAS both draw from a group of items that psychologists have validated for measuring these facets (Goldberg Reference Goldberg, Mervielde, Deary, Fruyt and Ostendorf1999; Johnson Reference Johnson2014; Maples et al. Reference Maples, Guan, Carter and Miller2014). Therefore, we constructed anxiety and volatility scales in LISS and CloudResearch following the assignment of items to facets recommended in these studies (see Table 2).Footnote 2 The remaining datasets used the TIPI, which has only two total items for measuring neuroticism (as with the other four traits). This precluded constructing scales for each facet. Instead, in these samples, anxiety and volatility were each measured by a single, face-valid item (see Table 2). In TAPS, we averaged the same anxiety items from two back-to-back administrations of the TIPI to increase reliability (r = 0.57, p < 0.001). We reverse-scored items where necessary, averaged them, and then rescaled them to create measures of anxiety, volatility, and each of the other Big Five personality traits that each ranged from 0 to 1.
Items used to measure neuroticism’s facets

Note: Italicized items are reverse-coded. The assignment of items to anxiety and volatility facets is based on Johnson (Reference Johnson2014) and Maples et al. (Reference Maples, Guan, Carter and Miller2014).
To measure political attitudes, we used a variety of economic and non-economic policy items, as well as items that ask about symbolic ideology. In the US samples, we measured symbolic ideology using respondents’ self-placement on a 7-point scale ranging from ‘extremely liberal’ to ‘extremely conservative’; in the Dutch sample, we used an 11-point scale ranging from ‘left’ to ‘right’. We coded all items so that higher values correspond to more liberal/left-wing attitudes and rescaled them to range from 0 to 1.
Although we initially look at individual policy attitudes, we later use summary measures of economic attitudes by averaging across the items shown in Fig. 1 (Ansolabehere, Rodden, and Snyder Reference Ansolabehere, Rodden and Snyder2008). In TAPS, we used only the May 2013 items (marked with asterisks) to construct our measure of economic ideology; because TAPS’s items are spread across two waves (May and July), using them all would force us to drop over a hundred respondents. Complete wordings are in Appendix B, and short descriptions are in Fig. 1.
Anxiety Predicts Economic, but Not Social, Attitudes in the US and the Netherlands.
Note: The figure displays unstandardized regression coefficients with 95 per cent confidence intervals. All ANES, CES, TAPS, and LISS models control for demographic variables, socioeconomic variables, and personality traits. Full regression tables and alternative specifications are in Tables C1 to C9. For TAPS policies, an asterisk indicates that the item is included in the economic attitudes scale.

Analysis Strategy
In the ANES, CES, and CloudResearch samples, the same items are used to measure key variables across multiple waves. Therefore, within each survey, we analyzed the data of respondents from all waves simultaneously using hierarchical linear models with random intercepts for the survey wave. This increases the precision of our estimates while allowing for differences in means between waves. We estimated ordinary least squares (OLS) models for the LISS and TAPS datasets.
All models estimated on the four representative datasets included the following variables as predictors: age, sex, race, education, income, homeownership, employment status, health insurance, the Big Five personality traits (openness, conscientiousness, extraversion, agreeableness), and the anxiety and volatility facets of neuroticism. Models estimated on the CloudResearch data did not include homeownership, employment status, health insurance, or the other Big Five traits; due to space constraints, we only asked about basic demographics, political engagement, and neuroticism in our experiments. In all analyses, positive coefficients indicate that a variable is associated with more liberal/left-wing attitudes, and negative coefficients indicate that a variable is associated with more conservative/right-wing attitudes. Unless otherwise noted, we report unstandardized regression coefficients.
Results
Do Anxious People Lean to the Left on Economic Policy?
The social support hypothesis predicts that, on average, anxiety-prone people will support policies that provide care and resources – namely, left-wing economic policies like social welfare programmes and redistribution. In Fig. 1, we show results for economic policies as dots, non-economic policies as x’s, and symbolic ideology as empty squares. Across all five datasets, anxious people voiced greater support for left-wing economic policies. These include having the government provide jobs and a good standard of living; increasing spending on welfare, healthcare, and unemployment insurance; raising taxes on the wealthy; and reducing income inequality. Meanwhile, the evidence that anxiety is related to conservative attitudes is weak and inconsistent. While anxiety is related to anti-abortion attitudes in the ANES, this result fails to replicate in CES and TAPS. Overall, these results are consistent with much of the existing literature on personality and politics, which finds that neuroticism is generally related to economic attitudes (Bakker Reference Bakker2017; Bakker and Lelkes Reference Bakker and Lelkes2018; Gerber et al. Reference Gerber, Huber, Doherty and Dowling2011).
Contrary to expectations, Fig. 1 also shows that anxiety is consistently related to left-wing stances on three non-economic issues – gun control, affirmative action, and the death penalty. In hindsight, the fact that anxious people support gun control should not be surprising; shootings are a highly salient harm often inflicted on vulnerable people, so it makes sense that anxious people would support policies designed to prevent them. A general squeamishness and aversion to harm could also explain why anxious people oppose capital punishment (Perkins et al. Reference Perkins, Leonard, Weaver, Dalton, Mehta, Kumari, Williams and Ettinger2013). However, we do not have an equally straightforward explanation for why anxious people support affirmative action. It may be that any policies that aim to nurture vulnerable groups sound appealing to anxious people, even when they are not able to benefit from them. Notably, the idea that anxious people view gun control, affirmative action, and capital punishment through the same lens of harm and care that they apply to redistribution could help to explain why these three issues cluster with economic attitudes and not social attitudes in factor analytic studies (Everett Reference Everett2013; Treier and Hillygus Reference Treier and Hillygus2009; Weeden and Kurzban Reference Weeden and Kurzban2016).
Also, contrary to our expectations, anxious people take significantly more liberal stances on all four non-economic policies in the CloudResearch dataset – though the strongest results are nonetheless for public healthcare and government-guaranteed jobs, consistent with our hypothesis. Given that this result is unique to our CloudResearch data, we suspected that it may be because online convenience samples tend to exhibit unusually high levels of ideological consistency (Kalmoe Reference Kalmoe2020). In Appendix C, we test this hunch by controlling for a potential cause of ideological sorting and partisan identification (Layman and Carsey Reference Layman and Carsey2002). As expected, anxiety remains a strong predictor of support for public healthcare and government-guaranteed jobs when we control for partisan identification, whereas point estimates for three of the four non-economic attitudes drop to zero and become nonsignificant (Table C9).
Overall, the most consistent associations across all datasets and countries are between anxiety and support for policies that provide care and resources to vulnerable people. And interestingly, anxiety always has a stronger relationship with at least some specific welfare state policies than with respondents’ symbolic identification as a liberal versus conservative or as left-wing versus right-wing.
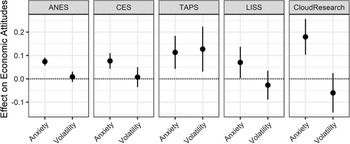
Do Anxious, but not Volatile, People Support Redistribution?
According to the social support hypothesis, neurotic people are drawn to left-wing economic policy because they are prone to anxiety; their tendency toward emotional volatility is irrelevant to this relationship because volatility is unrelated to how people think about care and sharing. While the effects of anxiety reported in Fig. 1 already account for the effects of volatility, they do not show how important these traits are relative to each other. In Fig. 2, we plot the marginal effects of anxiety and volatility from models predicting people’s overall economic ideology. As these results show, anxiety matters more than volatility in 4 of our 5 datasets. Relative to the least anxious people, the most anxious are 7 to 18 points more left-wing on a 100-point scale (shifts of 0.26 to 0.68 SDs, respectively). Meanwhile, only one dataset shows a statistically significant effect of volatility, and its effect is negative in two others. Overall, the relationship between anxiety and economic attitudes is consistent and positive, whereas the relationship between volatility and economic attitudes is at best inconsistent.Footnote 3
Anxiety, but Not Volatility, Predicts Economic Attitudes.
Note: The figure displays unstandardized regression coefficients with 95 per cent confidence intervals. All ANES, CES, TAPS, and LISS models control for demographic variables, socioeconomic variables, and personality traits. Full regression tables are in Table C10.

How Does Anxiety Compare to Material Insecurity?
Conventional wisdom holds that people’s economic status should loom largest when they decide whether to support redistribution (Meltzer and Richard Reference Meltzer and Richard1981; Romer Reference Romer1975; Rueda and Stegmueller Reference Rueda and Stegmueller2019). In the models reported above, we included controls for income, home ownership, unemployment, and health insurance. To get a sense of how anxiety stacks up against these economic factors, we plot their marginal effects in Fig. 3. As shown by the filled dots, anxiety’s predictive power is generally as strong as or stronger than homeownership, unemployment, and insurance, and is as strong as or slightly weaker than income. To put this in perspective, this means that a person’s answer to a single question about whether they are ‘anxious, easily upset’ tells you as much about their economic attitudes as the amount of money they earn each year – a shocking equivalence.
Anxiety Is Rivals Material Security in Predicting Economic Attitudes.
Note: The figure displays unstandardized regression coefficients with 95 per cent confidence intervals. All ANES, CES, TAPS, and LISS models control for demographic variables, socioeconomic variables, and personality traits. Full regression tables are in Table C10.

When Do Anxious People Support Redistribution?
We showed above that anxious people lean to the left on economic policy. According to the social support hypothesis, it is primarily when people are excluded that being predisposed to anxiety should predict whether they support redistribution and social welfare. We tested this prediction in LISS, TAPS, and CES. As shown in Fig. 4, this was the case: it was primarily among people who felt they had poor social support or who had fewer (online) friends that anxiety predicted left-wing economic attitudes.
Anxiety Predicts Economic Attitudes but Only Among People Who Feel Excluded.
Note: The figure displays predicted values with 95 per cent confidence intervals. All models control for demographic variables, socioeconomic variables, personality traits, and interactions between each personality trait and social exclusion or social network size. Full regression tables and alternative specifications are in Tables C11 and C12.

Figure 4 was generated in the following way. To measure social exclusion in LISS, we reverse-scored and averaged two items: ‘There are enough people I can count on in case of a misfortune’ and ‘I know a lot of people that I can fully rely on’ (r = 0.51, p < 0.001). To measure social exclusion in TAPS, we reverse-scored the following item: ‘I have a good support system (family and friends)’. In the CES, we measured social exclusion using the number of friends that respondents have on Facebook. Respondents who use Facebook (about 80 per cent of the sample) chose from four options: 1–100 friends, 101–250 friends, 251–500 friends, and more than 500 friends. Although Facebook friends are not the same as actual friends and family, people’s sense of inclusion is strongly influenced by social media (Cingel, Carter, and Krause Reference Cingel, Carter and Krause2022). Moreover, a recent meta-analysis finds that people with fewer Facebook friends report lower self-esteem (Liu and Baumeister Reference Liu and Baumeister2016), which is known to track people’s feelings of inclusion and exclusion (Leary and Baumeister Reference Leary, Baumeister and Zanna2000). While researchers do not know whether the relationship between Facebook friends and self-esteem is causal, what matters for our purposes is that having fewer Facebook friends is a reasonable indicator of a person’s degree of (felt) social inclusion.
To test whether exclusion activates the relationship between anxiety and economic attitudes, we add the exclusion variables and exclusion × anxiety interaction terms to the models reported in Figs. 2 and 3. We also add interactions between exclusion and each of the other Big Five personality traits as well as volatility to ensure that the effects of anxiety are not confounded with other traits (Blackwell and Olson Reference Blackwell and Olson2022). As shown in Fig. 4, in all three samples, it was primarily among excluded people that being anxious predicted leaning left on economics. In LISS and TAPS, among included people, anxiety did not predict economic attitudes (LISS: b = 0.03, p = 0.534; TAPS: b = 0.02, p = 0.750). But among excluded people, the most anxious were 22 and 33 points further to the left, respectively (changes of 0.87 and 1.38 SDs; p’s = 0.031 and 0.002). In TAPS, this interaction was significant in the fully specified model (b = 0.31, p = 0.026). In LISS, the interaction between anxiety and exclusion was not significant in the full model (b = 0.20, p = 0.114), but it was significant when we included only the direct effects of the other Big Five traits (b = 0.27, p = 0.003; the interaction in the reduced TAPS model is also significant: b = 0.29; p = 0.009; see Table C11).
The same pattern appears in the CES. Among people with more than 500 Facebook friends, anxiety does not predict economic attitudes (b = −.05, p = 0.501). But among people with 1–100 and 101–250 Facebook friends, the most anxious are 16 and 21 points further to the left than the least anxious, respectively (p’s = 0.059 and 0.013). There is a nonsignificant trend for those with 251–500 friends, such that more anxious people lean to the left by 9 points (p = 0.333). We find similar results when we include only the direct effects of volatility and the other Big Five traits (1–100: b = 0.12, p = 0.070; 101–250: b = 0.18, p = 0.013; 251–500: b = 0.10, p = 0.166; >500: b = −.03, p = 0.614; see Table C12).
To obtain more precision in the data on CES Facebook friends, we swapped out the four-category variable with a binary variable indicating whether a person has more than 500 friends versus 500 or fewer friends. These are the results graphed in the third panel of Fig. 4. As before, among people with many friends, anxiety did not predict economic attitudes (b = − .04, p = 0.510). But among people with fewer friends, the most anxious were 11 points further left than the least anxious (a change of 0.34 SDs, p < 0.001). (The interaction between anxiety and having 500 or fewer Facebook friends was significant in both the fully specified and reduced models; Full: b = 0.16, p = 0.036; Reduced: b = 0.14. p = 0.026; see Table C12). Thus, in line with the social support hypothesis, anxious people do not always favour redistribution and social welfare – instead, they turn to these policies primarily when they feel socially excluded.
One might worry that people who feel socially excluded also tend to be materially insecure. If so, then the interactions between anxiety and exclusion shown above might actually be picking up on the fact that anxiety changes how people respond to material insecurity. To address this possibility, we re-estimated the models reported in Fig. 4 while controlling for interactions between anxiety and each of our socioeconomic variables. Figure 5 reveals little support for this alternative. First, and importantly, even with the interactions between anxiety and material security controlled for, there are generally still strong interactions between anxiety and exclusion, as shown by the filled dots. Second, in all three datasets, anxious people lean left on economic policy to the same extent whether they are materially secure or insecure; these null interactions are shown by the unfilled circles (cf. Bakker Reference Bakker2017). In TAPS and CES, the interactions between anxiety and exclusion remain significant (TAPS: b = 0.30, p = 0.031; CES: b = 0.15, p = 0.047). The magnitude of the anxiety interaction term is similar in our Dutch LISS sample; although it falls short of significance in the fully specified model (b = 0.21, p = 0.090), it is significant in a model that includes only the direct effects of the other Big Five traits (b = 0.28; p = 0.002). The interaction in the reduced TAPS and CES models is also significant (TAPS: b = 0.29; p = 0.011; CES: b = 0.13; p = 0.037; see Table C13).
Social Exclusion, not Material Insecurity, Activates the Link Between Anxiety and Economic Attitudes.
Note: The figure displays unstandardized regression coefficients with 95 per cent confidence intervals. All models control for demographic variables, personality traits, and interactions between each personality trait and social exclusion or social network size. Full regression tables and alternative specifications are in Table C13.

Since the data analyzed in this section is cross-sectional, it could be the case that anxiety causes people to be or feel socially excluded, and this in turn causes them to prefer left-wing economic policies. Although reasonable, we find little evidence that anxiety determines who reports being excluded. The correlations between anxiety and perceptions of social exclusion are minimal (LISS: r = 0.15, p < 0.001; TAPS: r = 0.20, p < 0.001), and anxious people report slightly more Facebook friends than less anxious people, although this effect is also small (Spearman’s ρ = 0.08, p < 0.001). Though not dispositive, these weak relationships suggest that our results are not due to anxiety causing people to be or feel excluded; instead, they suggest that anxiety-proneness shapes how people respond to exclusion when they perceive it.
Is It Really Social Exclusion? An Experiment
The previous results measured people’s networks and feelings of exclusion. This leaves open an alternative hypothesis: perhaps people logically reason that their social connections are sources of material support to fall back on in an emergency – a place to sleep, a meal to eat, or money to borrow. If so, then anxious people may be responding rationally to the prospect of losing material support and not to the exclusion itself. By contrast, according to the social support hypothesis, the reason why anxious people seek government assistance when excluded is because of an evolved sensitivity to cues of exclusion. In ancestral environments, exclusion and a loss of resources were necessarily connected: the only people in a position to reject us were those whom we knew personally and who could actually help us. But in modern environments exclusion can be decoupled from tangible help. For instance, strangers on social media can reject us, but they would never have been sources of food or shelter in any event. Thus, due to the evolved connection between rejection and deprivation, rejection by strangers can lead people to feel vulnerable and to seek alternative ways to buffer themselves in times of need – even though such a connection is not strictly rational.
To discriminate between these possibilities, we fielded two experiments. We manipulated exclusion in a way that could not rationally be connected to expectations of receiving material support. We did this by simulating ostracism in an online forum. The ostracizers were anonymous others whom participants had no chance of meeting in real life (Wolf et al. Reference Wolf, Levordashka, Ruff, Kraaijeveld, Lueckmann and Williams2015). According to the social support hypothesis, people excluded by anonymous strangers should react similarly to people excluded in real life: when excluded, anxious people should favour left-wing economic policies; when included, there should be less of a connection between anxiety and economic attitudes. According to the alternative hypothesis, rejection by strangers should not matter and we should see a pattern different from the ones in previous datasets: anxious people might lean left on economics, but whether they do so will be unaffected by whether they are included or excluded.
Experiment methods
The two experiments were identical, were fielded using CloudResearch, and were pre-registered. The only difference was that the first was fielded in June 2022 (n = 378) and the second in January 2023 (n = 913).Footnote 4 Participants first provided demographics, completed a neuroticism questionnaire, and reported their political engagement. They then went to a ‘discussion portal’. We deceived them by telling them that we were studying whether likeable people are seen as better communicators. Participants built a profile by entering their first name, picking an artificially generated face, and writing a short biography (to preserve anonymity, none of these were recorded). Participants’ profiles then appeared alongside eleven fake profiles. These are shown in Fig. 6; screenshots of the full experiment are shown in Appendix D. Participants read their partners’ profiles and clicked ‘like’ on the ones they liked. Counters showed each profile’s like-count. Profiles were displayed for three minutes as the like-counts increased. Participants were randomized into one of two conditions. In the inclusion condition, participants received six likes, the average number received by the other profiles (not counting likes given by the participants). In the exclusion condition, participants received one like, the fewest across all profiles. Finally, participants gave their opinions on economic and social policies (see Appendix B.5) and responded to an open-ended attention check. They were debriefed after completing the survey.
The fake profiles.
Note: The subject’s custom profile always appears in the top left corner. All subjects saw identical sets of fake profiles. Each of the fake profiles received and gave a pre-determined number of likes to one another and to the subject. The subject could choose to like or not like any of the fake profiles. A zoomed-out version of this image with all fake profiles, as well as images of the rest of the experiment, are in Appendix E.

Despite its simplicity, this manipulation is consistently found to make people feel as if they had been rejected by a real group (Lutz and Schneider Reference Lutz and Schneider2021; Schneider et al. Reference Schneider, Zwillich, Bindl, Hopp, Reich and Vorderer2017; Wolf et al. Reference Wolf, Levordashka, Ruff, Kraaijeveld, Lueckmann and Williams2015). In this sense, ‘minimal exclusion’ experiments like these are the flipside of minimal group experiments, where researchers sort strangers into groups based on arbitrary criteria (for example, the outcome of a coin toss, what art people prefer; Diehl Reference Diehl1990). Initially, researchers intended for minimal groups to serve as mere controls against which to measure the effects of important identities like race and nationality (Tajfel Reference Tajfel1970). But to their surprise, people placed great psychological importance on these groups – a finding that is now well-replicated (Balliet, Wu, and De Dreu Reference Balliet, Wu and De Dreu2014). If people feel a genuine sense of attachment to groups formed minutes earlier on the basis of a coin flip, it’s reasonable to expect that being excluded from arbitrary groups would also provoke powerful emotions. And this is precisely what experiments find (Hartgerink et al. Reference Hartgerink, Van Beest, Wicherts and Williams2015). In fact, people feel bad when excluded from a minimal group even if they dislike the group members (Gonsalkorale and Williams Reference Gonsalkorale and Williams2007). Though surprising, these results make sense from an evolutionary perspective. Any groups that our ancestors had the chance to join would have been composed of people who they would meet again – not random strangers (Krasnow et al. Reference Krasnow, Delton, Tooby and Cosmides2013). Therefore, it makes sense for our minds to treat any groups that we happen to be a part of as if they really matter, even if we know analytically that they do not.
Both experiments were pre-registered (Appendix F). However, for the first experiment, we did not pre-register any predictions about the moderating effect of political engagement. Thus, at a formal level, readers should consider analyses of engagement in that study as exploratory. Nonetheless, the possibility that engagement would matter was always part of our thinking. This is why it was on the short list of variables measured prior to our manipulation, which comprised only demographics, symbolic ideology, neuroticism, and political engagement. For the second experiment, we did pre-register predictions about engagement, which we describe below.
Experiment results
In our first experiment, anxious people leaned to the left economically, but it did not matter whether they were included or excluded; see the top left panel of Fig. 7.Footnote 5 Recall, however, that we suspected that people who are politically engaged might be particularly good at connecting personal motivations with policy. Thus, perhaps exclusion amplifies the link between anxiety and support for redistribution only among the politically engaged. This was the case, as shown in the bottom left panel of Fig. 7, which plots respondents scoring above the median in political engagement. Among engaged participants who were included, anxiety did not predict economic attitudes (b = 0.01, p = 0.960). But among engaged participants who were excluded, the most anxious were 53 points further to the left on economic policy than the least anxious (a difference of 1.90 SDs; p = 0.014).Footnote 6
Experimentally Manipulated Social Exclusion Activates the Relationship Between Anxiety and Economic Attitudes.
Note: The figure displays predicted values with 95 per cent confidence intervals. All models control for demographic variables, income, volatility, and interactions between each independent variable and the binary treatment indicator. Full regression outputs and alternative specifications are in Tables C14 to C21.

Following our first experiment, we pre-registered a second experiment to replicate the three-way interaction between anxiety, exclusion, and engagement. This experiment was a direct replication, but with a sample nearly two and half times larger, giving us 80 per cent power to detect the three-way interaction found in the first study (Baranger Reference Baranger2023). Here, the effect of political engagement was weaker and not statistically significant (three-way interaction: b = 0.16, p = 0.490). Instead, we found a more straightforward pattern, as shown in the top middle panel of Fig. 7: among the excluded, anxious people leaned to the left on economics (b = 0.35, SD = 1.34, p < 0.001); among the included, the relationship was weaker and not statistically significant (b = 0.06, SD = 0.22, p = 0.374).
Figure 7 graphs each study separately and combined using hierarchical linear models. When combined, the interaction between anxiety and social exclusion is significant whether considering all participants or just the politically engaged (full sample: b = 0.23, SD = 0.87, p = 0.003; politically engaged: b = 0.50, SD = 1.83, p = 0.001; Table C16). We also find some unanticipated results. First, we find that being excluded causes respondents higher in volatility to report more economically conservative attitudes (b = −0.19, SD = −.73, p = 0.025; Table C16). Though we did not predict this result, it is consistent with studies which find that anger increases economic conservatism (Kettle and Salerno Reference Kettle and Salerno2017). Second, and contrary to expectations, we find that being excluded has a positive effect on the relationship between anxiety and social attitudes in the pooled sample (b = 0.25, p = 0.001; Table C17). Though we can only speculate, we believe that this result may be due to a weakness in our design. In our surveys, respondents always answered the economic policy questions immediately before the social policy questions. We did this to avoid priming people’s political identities with potent social issues like abortion before measuring our outcome variables (Johnston and Wronski Reference Johnston and Wronski2015). However, it is possible that people who responded to the treatment by reporting more left-wing economic attitudes also gave more left-wing answers to the social policies to appear ideologically consistent (Coppock and Green Reference Coppock and Green2022; Groenendyk, Kimbrough, and Pickup Reference Groenendyk, Kimbrough and Pickup2023).
One might worry that our results are due to anxious subjects in the exclusion condition reporting more socially desirable political views. To test this, participants in Study 1 answered the policy questions twice – once reflecting their personal views and once reflecting the most common views of their friends and acquaintances. We then checked whether excluded, anxious people report views closer to where they believe others hold. Contradicting the alternative hypothesis, they do not (Table C18). In sum, our experimental results are consistent with the social support hypothesis: among those who were excluded by strangers, anxiety predicted left-wing economic attitudes; among those included by strangers, there is little relationship between anxiety and economic attitudes. The evidence did not favour the alternative hypothesis, which held that people draw an explicit connection between being excluded and losing material support. While this alternative might predict the results from the representative samples, it predicts no role for exclusion by anonymous strangers.
We also found some evidence that for politically engaged people, the link between anxiety and redistribution is magnified. In our experiments, we found that engagement moderated the interaction between anxiety and exclusion in one sample but not in the other. In the appendix, we checked whether engagement moderated the relationship between anxiety and economic attitudes. It did, but the result was not robust to alternative specifications and emerged in only two of our five datasets (Table D1). However, we also found evidence that these null results may have been due to our use of very short anxiety scales (Fig. D1). Finally, we also checked whether engagement moderated the anxiety-exclusion interactions in our cross-sectional analyses. We found large three-way interactions in CES and LISS consistent with our experimental results, though the LISS result was not statistically significant (CES: b = 0.66, p = 0.004; LISS: b = 1.16, p = 0.094; see Table D2). Altogether, the effect of political engagement was inconsistent across datasets, suggesting that if the effect is real, it is not large.
Conclusion
Why are liberals so anxious? Pundits speculate that current events or social trends are to blame (see Table A1). Meanwhile, some academics argue that liberals experience more distress because they struggle to ignore injustices (Gimbrone et al. Reference Gimbrone, Bates, Prins and Keyes2022; Napier and Jost Reference Napier and Jost2008). Our results suggest that the answer is more complicated. On the one hand, anxious people lean to the left on economic issues but not generally on social issues. This result runs contrary to the idea that liberals are anxious because they care more about injustice; presumably, the plight of undocumented immigrants and sexual minorities is just as distressing as poverty and income inequality. Instead, our results suggest that anxious people are more likely to identify as liberal because left-wing economic policies satisfy their psychological needs for care and material security. We also found that anxiety predicted most left-wing economic attitudes better than it did calling oneself a liberal, suggesting that studies that look only at symbolic liberal-conservative identification will often underestimate the relationship between ideology and anxiety (for example, Jost Reference Jost2006; Sibley, Osborne, and Duckitt Reference Sibley, Osborne and Duckitt2012). This result underlines the importance of using fine-grained measures when making claims about ideology (Feldman and Johnston Reference Feldman and Johnston2014).
Importantly, we find that context is crucial for explaining the link between anxiety and economic attitudes. In both cross-sectional and experimental analyses, we find that anxious people embrace left-wing economic policies when they feel excluded. Recently, researchers have argued that social media use is a major cause of increasing loneliness among young people, in part because it amplifies the natural tendency to engage in social comparison and competition (Twenge et al. Reference Twenge, Haidt, Blake, McAllister, Lemon and Le Roy2021). Thus, our results suggest that rising distress among young liberals since 2010 may be caused, in part, by feelings of rejection and alienation linked to social media use (Gimbrone et al. Reference Gimbrone, Bates, Prins and Keyes2022).
Besides explaining why liberals are more anxious than conservatives, our results speak to a long-running debate over the political consequences of anxiety. One of the oldest and most influential theories in political psychology is that people adopt right-wing beliefs to assuage their worries and fears (Fromm Reference Fromm1947; Jost et al. Reference Jost, Glaser, Kruglanski and Sulloway2003; Reich Reference Reich1946[Reference Reich1933]; Wilson Reference Wilson1973). The seminal studies in this literature make strong claims: as children, conservatives are said to be ‘indecisive and vacillating, easily victimized, inhibited, fearful, self-unrevealing, adult-seeking, shy, neat, compliant, anxious when confronted by ambiguity, and fearful [sic – fearful is listed twice]’ (Block and Block Reference Block and Block2006, 741). As adults, they are ‘poorly integrated psychologically, anxious, often perceiving themselves as inadequate, and subject to excessive feelings of guilt’ (McClosky Reference McClosky1958, 37–38) and characterized by ‘a generalized susceptibility to experiencing threat or anxiety in the face of uncertainty’ (Wilson Reference Wilson1973, 259). Moreover, conservative beliefs are ‘significantly (but not completely) related to motivational concerns having to do with the psychological management of uncertainty and fear’ (Jost et al. Reference Jost, Glaser, Kruglanski and Sulloway2003, 369). Compare these sketches of putative conservatives to the adjectives that personality psychologists use to define the high end of the neuroticism continuum: anxious, easily upset, worried, afraid of many things, and easily threatened. One would expect conservatives to rate themselves high on these adjectives. Our results, combined with existing research, show that they do not.
Our findings contrast especially with some predictions from motivated social cognition theory (Jost et al. Reference Jost, Glaser, Kruglanski and Sulloway2003) – namely, that (a) fearful people support laissez-faire economics because unregulated markets stymie change and thereby provide a sense of physical security, and (b) fearful people cling to the idea that markets reward merit to avoid facing the fact that capitalism is unjust and exploitative. Indeed, these authors themselves note the tension between their theory and findings on personality and politics: ‘To the extent that conservatives are more generally fearful than others, one might expect that they would also exhibit higher levels of neuroticism, but this does not generally seem to be the case’ (Jost et al. Reference Jost, Glaser, Kruglanski and Sulloway2003, 362). In fact, contra the interpretation provided by the theory of motivated social cognition, one might expect those low in anxiety to be more willing to take risks and embrace the vicissitudes of unregulated market economies (Gerber et al. Reference Gerber, Huber, Doherty and Dowling2011). After all, less anxious people feel secure in their relationships, providing a fallback in case risk-taking goes wrong. Additionally, some theories of risk-taking suggest that emotionally secure people will prefer high-risk, high-reward environments to safer, more predictable environments (Nettle Reference Nettle2009).
Our results also further a different debate in political science: whether people’s economic attitudes are driven by pocketbook concerns. Lasswell (Reference Lasswell1936) famously argued that politics is about who gets what, when, and how. Political scientists continually debate when and how people get what they want, but often take for granted that what they want is money (Weeden and Kurzban Reference Weeden and Kurzban2017). Thus, a classic hypothesis is that people who have less money or expect to earn less want redistribution, while those who have more want the government to leave them alone (Meltzer and Richard Reference Meltzer and Richard1981; Romer Reference Romer1975). Yet income, wealth, and job prospects tell us surprisingly little about people’s economic attitudes (Rueda and Stegmueller Reference Rueda and Stegmueller2019). We suggest that this is partly because the human anxiety system is calibrated to an ancestral life where friends serve the role that welfare states serve today. Consequently, we find that being socially excluded enhances the connection between being anxiety-prone and wanting redistribution. No such effects are observed for material insecurity, whether that is having little income or wealth, being unemployed, or lacking health insurance. Pocketbooks and bank accounts are recent inventions, but the need for social support and its attendant psychology has long been with us.
Beyond welfare state support, our theory shows how taking evolved psychology into account can explain seemingly irrational currents in public opinion. Research in political economy often starts, with good reason, with a simple theory – for instance, ‘people maximize money’ – and uses that to predict what people want from politics. When people’s behaviour deviates from these simple models, researchers add other currencies to the list of things to be maximized – ‘people maximize money’ becomes ‘people maximize money and status and meaning’. This creates a more accurate picture but risks turning theories into ad hoc descriptions of behaviour. Our approach instead starts by considering the problems our ancestors faced and what we know about how the mind solves these problems. For instance, the psychology of inclusion and exclusion is more complicated than trying to maximize inclusion. Instead, cues of exclusion activate parts of the brain’s pain network, making people feel vulnerable and motivating them to seek care and support (Leary and Baumeister Reference Leary, Baumeister and Zanna2000; MacDonald and Leary Reference MacDonald and Leary2005; Spoor and Williams Reference Spoor, Williams, Forgas, Haselton and von Hippel2007). By acknowledging this complexity, we were able to make novel predictions about the link between personality and politics.
We are certainly not the first to apply personality or evolution to politics (Bakker Reference Bakker, Huddy, Sears, Levy and Jerit2023; Petersen Reference Petersen, Huddy, Sears, Levy and Jerit2023). But we think we have contributed a novel way of combining them that could be used to unravel other connections between personality and political behaviour. The Big Five framework is by far the most popular approach to personality in political science (Gerber et al. Reference Gerber, Huber, Doherty and Dowling2011). Yet, a persistent criticism of the Big Five is that identifying five factors that describe how traits correlate does not reveal what personality is or how it works (Block Reference Block1995; Eysenck Reference Eysenck1992). By contrast to the atheoretical nature of the Big Five framework, evolutionary psychologists view personality traits as differences in the tuning of universal psychological systems (Lukaszewski et al. Reference Lukaszewski, Lewis, Durkee, Sell, Sznycer and Buss2020; Tooby and Cosmides Reference Tooby and Cosmides1990). Researchers can build stronger theories by linking personality traits to these systems. This is particularly helpful for designing experiments. It is difficult to manipulate someone’s personality, and research suggests that personality is mostly stable (Bleidorn et al. Reference Bleidorn, Schwaba, Zheng, Hopwood, Sosa, Roberts and Briley2022). But if researchers understand the psychology that a trait is embedded within, then they can design manipulations that affect downstream political attitudes and behaviours in predictable ways (Lavine et al. Reference Lavine, Lodge, Polichak and Taber2002). Here, we connected the neuroticism facet of anxiety to a system designed to manage inclusion and exclusion. This same approach could be pursued with other personality traits. For instance, by connecting agreeableness to the evolved psychology of anger, political scientists can build on research linking this personality trait to populism (Bakker, Schumacher, and Rooduijn Reference Bakker, Schumacher and Rooduijn2021; Lukaszewski et al. Reference Lukaszewski, Lewis, Durkee, Sell, Sznycer and Buss2020).
In summary, this paper combines two bodies of work – research in political science linking neuroticism to political attitudes and research in psychology linking neuroticism to differences in how the brain’s anxiety system responds to social exclusion. This involved tracing connections between political science, social and personality psychology, behavioural genetics, and anthropology. Drawing on this work, we showed that sensitivity to social exclusion explains why anxious people lean left on economics. Thus, the social support hypothesis allows us to move past arguments over whether our economic preferences are rational or irrational by presenting a third option: our economic preferences follow a logic of self-interest calibrated to an environment that no longer exists.
Supplementary material
The supplementary material for this article can be found at https://doi.org/10.1017/S0007123424000590.
Data availability statement
Replication data for this article can be found in Harvard Dataverse at: https://doi.org/10.7910/DVN/LFQCOO.
Acknowledgements
Earlier versions of this research were presented at the 2023 Rebecca B. Morton Conference on Experimental Political Science, the 2023 MPSA annual meeting in Chicago, the 2023 APSA annual meeting in Los Angeles, and the Center for Evolutionary Psychology Research Seminar at UC Santa Barbara. We thank Stanley Feldman, Hannah Nam, Angel Saavedra Cisneros, Liz Suhay, Kris-Stella Trump, the three anonymous reviewers, and the editor for providing valuable feedback.
Financial support
None.
Competing interests
None.


 Open access