





1. Introduction
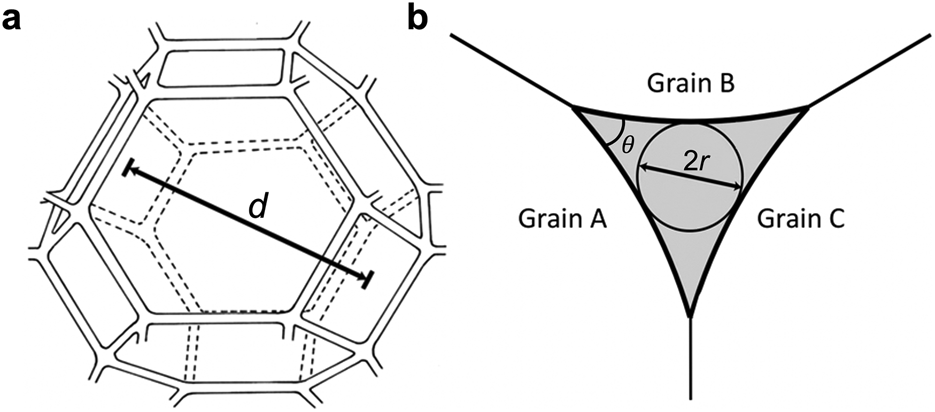
The temperate ice of glaciers is a binary mixture of ice and liquid water. Microscopic observations have demonstrated that this water resides predominantly in veins at three-grain intersections, which appear as equilateral curvilinear triangles in cross-section (Fig. 1) with radii of ~0.1–100 μm (Nye and Mae, Reference Nye and Mae1972; Raymond and Harrison, Reference Raymond and Harrison1975; Mader, Reference Mader1992; Fowler and Iverson, Reference Fowler and Iverson2022). Other water is stored in nodes where four veins join and in lenses at adjoining crystal faces. Together, these water bodies constitute an interconnected system of pathways (Nye, Reference Nye1989) through which water driven by gravity and pressure gradients can flow.
Idealized water veins in polycrystalline ice. (a) Vein network approximated by truncated, semiregular octahedra like that considered by Frank (Reference Frank1968) (modified from Price, Reference Price2000). (b) Cross-section of a water vein at a three-grain intersection, with vein radius, r, describing the size of a curvilinear triangle used to model Poiseuille flow through veins and where θ is the dihedral angle.
The resultant permeability of ice and water storage at the grain scale has important ramifications for glacier hydrology. Shreve (Reference Shreve1972) envisioned englacial drainage systems in temperate glaciers beginning as flow through a vein system that evolves with depth, through preferential viscous heat dissipation, to an arborescent system of millimeter-size and larger conduits – a prediction generally supported by later field observations (Raymond and Harrison, Reference Raymond and Harrison1975). However, the vein network commonly cannot convey the meltwater flux percolating through firn, so networks of expanded veins in ice near the firn base likely also act as a transient buffer for water storage during the melt season (Cooper and others, Reference Cooper2018; Miller and others, Reference Miller2022). Moreover, water in temperate ice has microbiological implications; vein networks provide a hydrologically connected microbial habitat in which flowing water can recharge and distribute the nutrients and energy resources for bacteria (Mader and others, Reference Mader, Pettitt, Wadham, Wolff and Parkes2006; Barletta and others, Reference Barletta, Priscu, Mader, Jones and Roe2012; Dani and others, Reference Dani, Mader, Wolff and Wadham2012). These networks are also relevant to climate studies, as veins facilitate diffusion and signal smoothing of water-stable isotopes used as climate proxies in ice cores (e.g. Ng, Reference Ng2023).
Of arguably greater importance is the effect of interstitial water on ice rheology and glacier dynamics. The effective viscosity of ice decreases with increasing water content (Duval, Reference Duval1977; Adams and others, Reference Adams, Iverson, Helanow, Zoet and Bate2021). Moreover, the movement of interstitial water, through its substantial latent heat, affects the energy balance that dictates ice temperature (Schoof and Hewitt, Reference Schoof and Hewitt2016). Thus, water fluxes through veins in ice affect the depth of the temperate/cold-ice transition. Zones of temperate ice are increasingly acknowledged as important modulators of ice-sheet mass balance (Meyer and Minchew, Reference Meyer and Minchew2018; Law and others, Reference Law2023), for which the characteristics and effects of grain-scale water transport remain largely mysterious. Glacier slip is also directly affected by water veins through their effect on ice water content and hence viscosity (Cohen, Reference Cohen2000). Ice permeability also allows capillary movement of water through ice across bedrock bumps as a means of meltwater transport during regelation (Lliboutry, Reference Lliboutry1993). Carol's (Reference Carol1947) subglacial observations of water exuding from veins in especially soft basal ice adjacent to a bedrock bump hinted early on at these effects.
Especially topical is the role of grain-scale water movement in shear-margin dynamics of ice streams in West Antarctica, where they account for most of the ice discharge fueling sea-level rise (Rignot and others, Reference Rignot2019). High velocity gradients and shear stresses in shear margins cause commensurately high frictional heat dissipation. Heat production in some margins is sufficient to overcome the effects of cold-ice advection from the glacier surface and adjacent slow-moving ice to warm ice to its melting temperature at depth (Echelmeyer and others, Reference Echelmeyer, Harrison, Clarke and Benson1992; Harrison and others, Reference Harrison, Echelmeyer and Larsen1998; Clarke and others, Reference Clarke, Liu, Lord and Bentley2000; Meyer and Minchew, Reference Meyer and Minchew2018; Hunter and others, Reference Hunter, Meyer, Minchew, Haseloff and Rempel2021). This temperate ice of shear margins affects their shearing resistance, velocity distribution, strain heating and the water delivery to the bed. In turn, this water delivery controls the lateral distribution of basal effective stress and drag and hence ice stream width (Suckale and others, Reference Suckale, Platt, Perol and Rice2014; Perol and Rice, Reference Perol and Rice2015; Meyer and others, Reference Meyer, Yehya, Minchew and Rice2018; Haseloff and others, Reference Haseloff, Hewitt and Katz2019). Thus, accurately characterizing englacial meltwater movement in the temperate zones of shear margins is a widely held objective (Kyrke-Smith and others, Reference Kyrke-Smith, Katz and Fowler2014, Reference Kyrke-Smith, Katz and Fowler2015; Suckale and others, Reference Suckale, Platt, Perol and Rice2014; Perol and Rice, Reference Perol and Rice2015; Perol and others, Reference Perol, Rice, Platt and Suckale2015; Platt and others, Reference Platt, Perol, Suckale and Rice2016; Meyer and others, Reference Meyer, Yehya, Minchew and Rice2018; Haseloff and others, Reference Haseloff, Hewitt and Katz2019; Hunter and others, Reference Hunter, Meyer, Minchew, Haseloff and Rempel2021).
Haseloff and others (Reference Haseloff, Hewitt and Katz2019) showed explicitly that effective ice viscosity of shear margins is acutely sensitive to ice permeability, with meltwater retained in ice decreasing sharply with increasing ice permeability. Their modeling highlighted how the softening effect of water in ice localizes strain in shear margins, thereby focusing heat dissipation, increasing meltwater production and delivery to the bed, and promoting high streaming velocities. In such models, ice's poorly known permeability – particularly its dependence on water content (Schoof and Hewitt, Reference Schoof and Hewitt2016) – is among the largest sources of uncertainty.
In this study, we use a new custom permeameter (Fowler and Iverson, Reference Fowler and Iverson2022) to measure experimentally for the first time the relationship between the permeability of polycrystalline temperate ice and its water content. We study ice made in the laboratory of different grain sizes using different preparation techniques and compare the results with a model of water flow through an idealized vein network. We begin with the background that provides the basis for the hypothesized relationship between ice permeability and water content that we wish to test.
2. Background
Nye and Frank (Reference Nye and Frank1973) first described steady, laminar water movement in temperate ice as capillary flow through an idealized and isotropic truncated-octahedral network (Fig. 1a), extending the theory for melt fluids in the upper mantle (Frank, Reference McKenzie1968). Consistent with this theory, experiments with temperate ice (Fowler and Iverson, Reference Fowler and Iverson2022) demonstrate that flow, at least over short time scales, can be approximated as Darcian, with permeability related to discharge using a standard formulation for saturated porous media, in which the vertical flux density, q z is defined as:
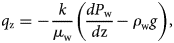
where ρ w is the water density, g is the gravitational acceleration, μ w is the water viscosity, dP w/d z is the water pressure gradient and k is the intrinsic permeability. Considering Poiseuille flow through individual veins yields:

where d is the grain diameter, r is the vein radii (Fig. 1b) and B is a dimensionless constant that depends on the geometry of the vein's bounding grains and the vein network geometry (Fig. 1) (e.g. Frank, Reference Frank1968). Defining ϕ as the volume fraction of melt, ϕ ∝ (r/d)2. Thus, if ϕ is constant, r ∝ ϕ 1/2d, so that (2) yields a power law for the permeability of rocks with small melt fractions:

where C is a dimensionless geometric factor influenced by vein-wall convexity and the dihedral angle, and n = 2, reflecting an isotropic flow system with uniform grain size and shape (Von Bargen and Waff, Reference Von Bargen and Waff1986; McKenzie, Reference McKenzie2000).
However, for complex natural systems with crystal anisotropy and grain-size heterogeneity, a higher value of n is expected (Zhu and Hirth, Reference Zhu and Hirth2003; Miller and others, Reference Miller, Zhu, Montési and Gaetani2014). The value of n also depends on whether the flow is primarily in veins or films at grain boundaries, which is affected by the melt fraction and dihedral angle (e.g. Miller and others, Reference Miller, Zhu, Montési and Gaetani2014). Cheadle and others (Reference Cheadle, Elliott and McKenzie2004) calculated the equilibrium shape of an octahedral melt network. They concluded that n likely begins increasing from 2.0 to 3.0 when melt fractions exceed ~3% and melt films have appreciable effects on the flow. However, others have suggested the transition occurs only if ϕ > 10% (e.g. Rudge, Reference Rudge2018). Schoof and Hewitt (Reference Schoof and Hewitt2016) chose n = 2.33 for temperate ice in their model of grain-scale water movement in a polythermal glacier. That value was thought to be appropriate, assuming a tendency toward vein-dominated flow, which is expected for glacier ice with ϕ ≤ 4%.
The values of the two exponents and C in (3) are necessarily based on idealizations for ice. One of these is that veins at three-grain intersections are straight and continuous and that all of them contribute to water flow. In contrast, veins in polycrystalline ice observed in experiments at atmospheric pressure are commonly discontinuous and irregular in shape (Mader, Reference Mader1992). Moreover, observations of grain-scale water-flow paths through temperate ice (Raymond and Harrison, Reference Raymond and Harrison1975) highlight the tendency for water to exploit some veins preferentially (Shreve, Reference Shreve1972). This effect may be due to preferential viscous heat dissipation in larger veins (e.g. Shreve, Reference Shreve1972), but preferential flow is a well-known tendency in most granular porous media (e.g. Flury and others, Reference Flury, Flühler, Jury and Leuenberger1994). The quadratic dependence on grain size (3), which reflects vein diameter increasing with grain diameter at a given water content, is considered relatively secure for rock/melt systems (Connolly and others, Reference Connolly, Schmidt, Solferino and Bagdassarov2009; Miller and others, Reference Miller, Zhu, Montési and Gaetani2014). However, if vein continuity and tortuosity vary systematically with grain size, deviations from a quadratic dependence will occur (Fowler and Iverson, Reference Fowler and Iverson2022). Another complication is air bubbles that plug some veins (Lliboutry, Reference Lliboutry1971, Reference Lliboutry1996; Raymond and Harrison, Reference Raymond and Harrison1975).
Importantly for ice, dissolved salts in veins influence the interfacial surface free energy and the local equilibrium temperature. Much of the unfrozen water in ice exists because the soluble impurity content concentrates in the liquid phase, lowering the equilibrium temperature of the vein (Nye, Reference Nye1991). Therefore, experiments aimed at measuring the permeability of temperate ice need to pay special attention to salinity and its effect on liquid-water volume and distribution.
With these experiments, we test the hypothesis that the permeability of polycrystalline, temperate ice obeys a power-law relationship with water content (3), with expected values of n between 2.0 and 3.0. No such experimental data exist for temperate ice, and unlike in studies of the permeability of other rock/melt mixtures (e.g. Miller and others, Reference Miller, Zhu, Montési and Gaetani2014), permeability is measured directly.
3. Methods
Apparatus
The laboratory permeameter for these experiments (Fig. 2) was used previously to measure the permeability of temperate ice as a function of its grain size (Fowler and Iverson, Reference Fowler and Iverson2022). For this study, the device was modified to measure the effect of water content on ice permeability.
Ice permeameter. (a) Oblique view. (b) Components of the ice chamber.
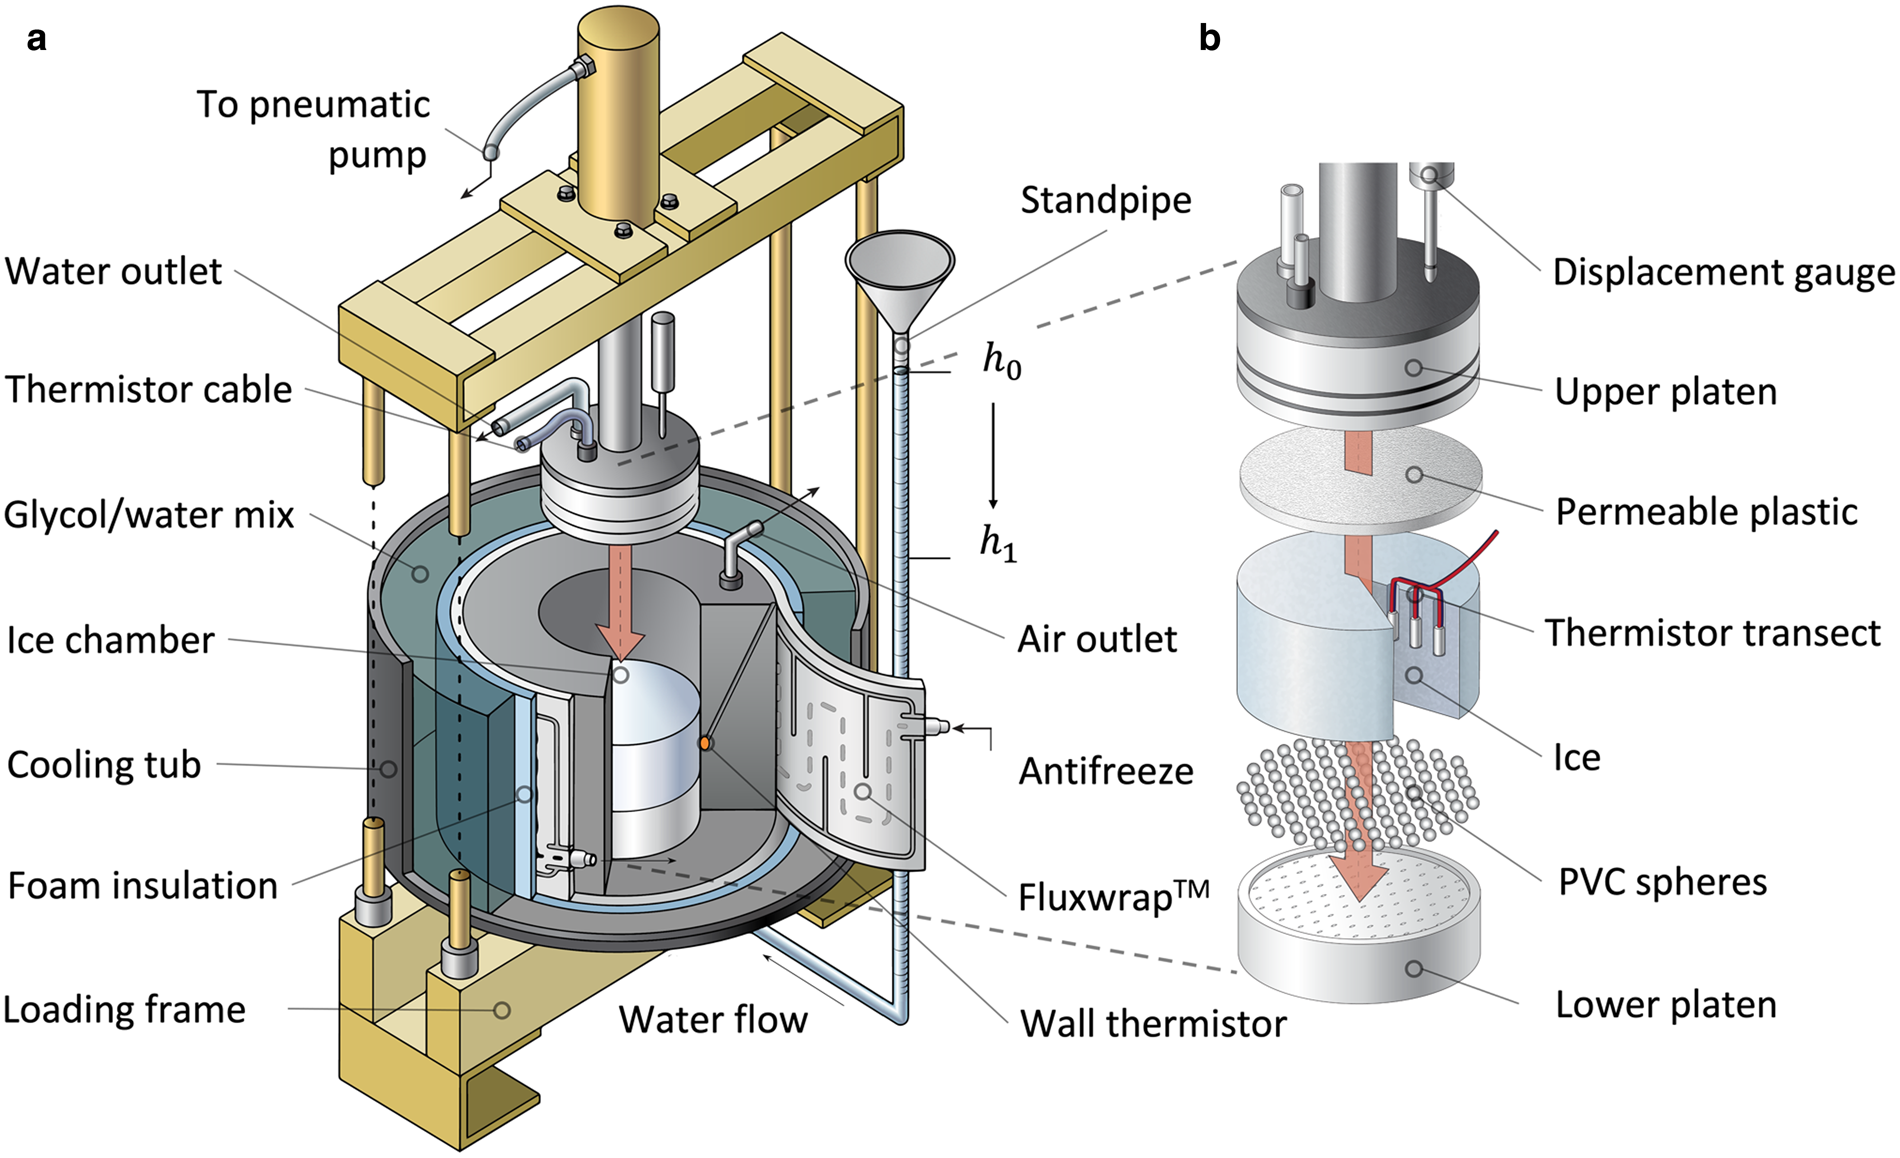
The ice chamber (Fig. 2b) contains either a disk of lab-made ice or a section of ice core 140 mm in diameter and up to 70 mm thick. This disk is kept under a steady normal stress and held at the ice's pressure melting temperature (PMT). The chamber's cross-sectional area through which water flows is a factor of ~200–15 000 larger than areas of individual ice crystals (1–10 mm in diameter) to ensure a representative volume is used (Du and Ostoja-Starzewski, Reference Du and Ostoja-Starzewski2006). A cylindrical poly vinyl chloride (PVC) wall confines the ice disk on its sides, while perforated PVC platens confine the upper and lower disk surfaces. Perforation of platens enables water to be conveyed uniformly to and from thin (6 mm) pervious plastic sheets at their surfaces. These sheets can consist of either permeable plastic or a layer of plastic spheres one sphere diameter thick (Fig. 2b). A conduit from the perimeter of the lower platen extends upward through the PVC wall to allow air to escape that could otherwise impede water flow.
Although the permeameter resides in a cold room at 1.0 ± 0.5 °C, this alone is insufficient for adequate temperature control to maintain ice at its PMT for prolonged periods. Thus, to keep ice disks at their melting temperature without melting them prohibitively fast, we minimize thermal heat fluxes to the boundaries of the ice disk by submerging the ice chamber in a 30 L tub filled with a temperature-regulated water/ethylene glycol mixture (Fig. 2a). This bath is plumbed to an external circulator capable of maintaining the bath temperature ~0.01 °C above the ice disk's PMT. The resultant heat flux to the ice is sufficiently small to allow experiments to last for weeks if necessary.
Normal stress (500 ± 30 kPa) is applied to the ice disk by a pneumatic cylinder, and this stress generates lateral stresses in the ice that keep it pressed against the wall of the ice chamber. The resultant pressure in the water film at the ice-disk edge is higher than the pressure head applied to the disk when permeability is measured, prohibiting through-flowing water at the disk edges that would corrupt the permeability measurement. The rate of ice-disk thinning due to melting and drainage is recorded using a displacement gauge mounted to the loading frame of the permeameter. Ice-disk thinning rates for experiments are ~1.5 mm d–1, corresponding to melt rates at the ice disk edges of ~0.6 mm d–1. The associated flux of water is a factor of ~10–104 smaller than the flux of water that moves upward through the ice disk during permeability tests, so even if all meltwater at the walls drains into the ice disk, associated radial pressure gradients in the ice must be negligibly small relative to vertical gradients.
The device follows the principles of a falling-head permeameter, which is used routinely for measuring the permeability of materials with low expected permeabilities (e.g. Lambe and Whitman, Reference Lambe and Whitman1969). The method relies on measuring water discharge through the ice disk as the pressure head falls in a standpipe. The rate of head decrease in the standpipe provides the intrinsic permeability, k, as expressed by a standard formulation (e.g. Freeze and Cherry, Reference Freeze and Cherry1979):
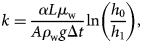
where α is the inside cross-sectional area of the water cylinder, L is the thickness of the ice disk, A is the cross-sectional area of the ice disk and Δt is the time required for the water level to drop from an initial value, h 0, to a lower value, h 1 (Fig. 2a). The viscosity, μ w, used is that for pure water at $0^\circ {\rm C}$ . Although the varying salinity we use to control the ice water content affects water density and, therefore, dynamic viscosity, the trace concentrations used in this study have insignificant effects (< 1% difference from pure H2O) (Qasem and others, Reference Qasem, Generous and Qureshi2021).
To precisely measure the liquid water content of the ice, we use the calorimetric method (Duval, Reference Duval1976; Cohen, Reference Cohen1998; Adams and others, Reference Adams, Iverson, Helanow, Zoet and Bate2021). A freezing front is initiated at the ice disk's outer edge, and the inward movement of the phase boundary is measured with time. To apply this method with our permeameter, the exterior of the ice chamber is fitted with a flexible chilling jacket (North Slope Chillers Fluxwrap™, Fig. 2a), capable of uniformly chilling the edges of the ice disk ~1°C below the ice's melting temperature, while the speed of the resultant freezing front is tracked with thermistors embedded in the ice disk. The Fluxwrap™ consists of a sheet of coiled fluid conduits that carry a chilled glycol/water mixture, pumped and temperature-controlled by an external circulator. The wrap is present only along the outside walls, and thick PVC above and below the ice disk inhibits non-lateral heat flow as the temperature of the chamber wall decreases. The outward face of the Fluxwrap™ is enclosed in a thick layer of insulation that inhibits heat transfer between the Fluxwrap™ and the surrounding glycol/water bath. Two thermistors mounted flush within the inner walls of the ice chamber (Fig. 2a) provide the time-dependent temperature boundary condition for the Stefan problem (Asaithambi, Reference Asaithambi1988), and three thermistors are embedded at mid-height in the ice disk (Fig. 2b) to track the radial freezing-front's position during its inward movement. These temperature records provide the basis for measuring the water content of ice disks, as described in the next section.
Procedure
The liquid-water content of the ice disks is controlled by varying the bulk ionic composition of the ice. Following Nye (Reference Nye1991), Mader (Reference Mader1992) and Hubbard and others (Reference Hubbard2003), the water content, ϕ, of ice can be approximated from its bulk ionic concentration S, and its pressure-melting temperature depression β (Nye, Reference Nye1991; Mader, Reference Mader1992; Hubbard and others, Reference Hubbard2003):

The constant, D, is determined from a bivariate plot of the freezing temperature versus the concentration of the relevant ion in the solution. Thus, for a given grain size, water content scales directly with the bulk ionic concentration of the ice at a particular temperature depression.
We use two different methods for making ice and controlling its salinity. Fine-grained (1.8 ± 0.6 mm) and coarse-grained ice disks (4.2 ± 2.2 mm) are made following the method of Duval and Le Gac (Reference Duval and Le Gac1980). Snow particles, either 1–2 mm (fine) or 3.4–4.8 mm (coarse) in diameter, are sieved from crushed ice made with de-aired, deionized water doped with NaCl and, in one case for fine-grained ice, with Na2SO4. The saline snow particles are packed into a cylindrical de-airing mold. Then a vacuum is drawn on the snow disk, while at its base, chilled water with the same salt concentration as the average ice-particle salinity flows upward into pore spaces. The water-saturated snowpack is then directionally frozen on a cold plate. To measure the effects of spatial differences in water content caused by salt heterogeneity, we use another set of coarse-ice disks, in which ~400 ice spheres, 15 mm in diameter, with hexagonal packing and all made from de-aired water doped to the same salinity, are placed into the de-airing mold. The packs of ice spheres are saturated with pure de-aired water at 0°C and unidirectionally frozen. The resultant ice disks had grain diameters of 4.4 ± 1.6 mm, with a higher salt concentration in ice-sphere centers due to the expulsion of ions from ice during inward freezing. These ice disks had bulk salinity and mean grain sizes comparable to the coarse disks made using the traditional method.
After an ice disk is extracted from the mold, vertical 4 mm holes are drilled to mid-height in the disk (~30 mm) in a horizontal, radial transect (Fig. 2b), where thermistors can be placed and the holes backfilled with ice. Thermistors are usually located 20, 40 and 60 mm from the ice disk edge. After an ice disk is added to the permeameter, its edges are sealed by dripping chilled deionized water in the submillimeter-wide gap that divides the disk from the walls of the ice chamber. A vertical stress is then applied to the ice disk, and the ice is brought to its PMT by increasing the glycol/water bath temperature to ~0.01 °C above the expected PMT. The downward movement of the upper platen indicates the initiation of ice melting, but permeability measurements are delayed for at least 18 h until thermistors within the ice disk indicate that the PMT has been reached. Meltwater from the ice is sampled immediately before permeability tests. Its conductivity is measured so that the through-flowing water can be prepared to match the salinity of the disk's meltwater, assuming that the melt salinity is approximately equal to the ice-vein salinity. Introducing water with the same salinity as the veins minimizes the osmotic contribution to the hydraulic gradient.
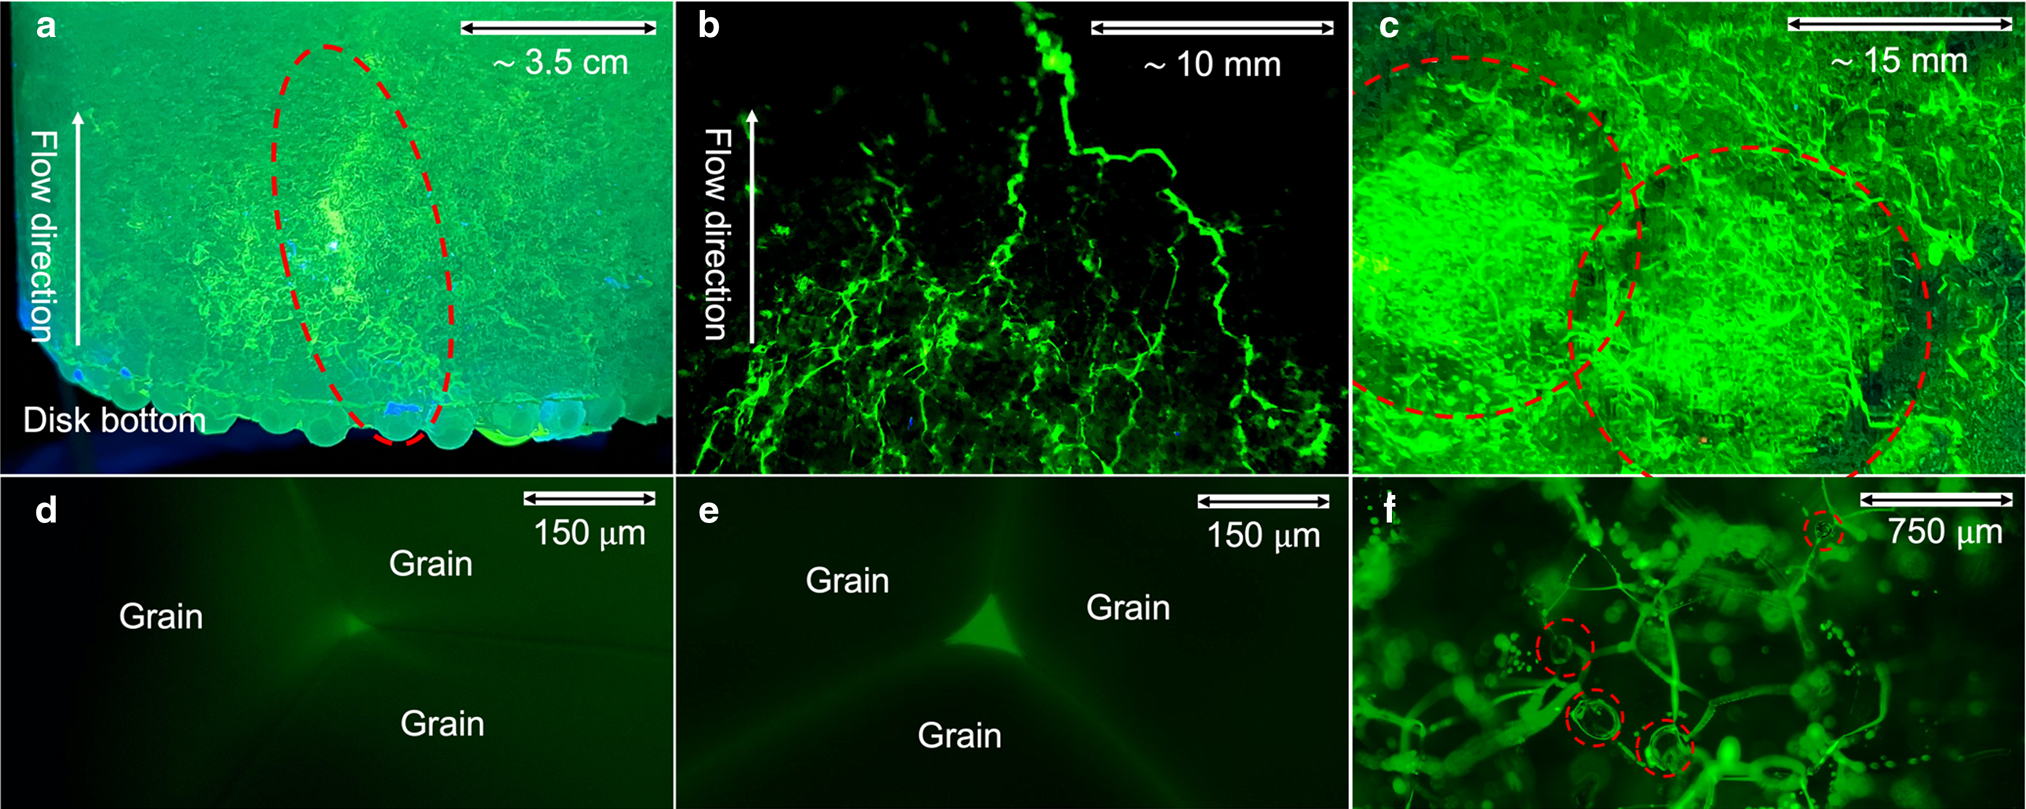
Permeability tests are then conducted in succession over ranges of head from 0.01 to 2.00 m. The latter value corresponds to a maximum hydraulic gradient of ~35. Through-flowing water introduced to the standpipe also contains fluorescein dye at low concentrations (10 mg L–1). Fluorescein is particularly well suited as a tracer owing to its detectability at low concentrations and its stability and inertness in the presence of ice surfaces (Eicken and others, Reference Eicken, Krouse, Kadko and Perovich2002; Fowler and Iverson, Reference Fowler and Iverson2022). Vein fluorescence, as revealed in thin sections and larger sections of ice disks still at the melting temperature, yields clear images of the former water-vein system (Fig. 3) (Fowler and Iverson, Reference Fowler and Iverson2022).
Flow pathways highlighted with fluorescein dye. (a) A coarse-grained ice disk with a preferential flow pathway (within the red dashed oval). (b) Vein arborescence in a fine-grained ice disk. Vein fluorescence from surrounding micropores was digitally reduced to emphasize arborescent pathways. (c) Vein network and meltwater heterogeneity in a sphere-seeded ice disk. Water-depleted rims around more watery interiors (red dashed circles). (d, e) Former water-filled veins at three-grain intersections. Ice disk in (d) was seeded with ice spheres and had a measured water content of 0.1 ± 0.09% with vein radius r ≅ 12 μm. Disk in (e) was fine-grained and had a measured water content of 1.2 ± 0.10%, with r ≅ 27 μm. (f) Vein network in a fine-grained ice disk with air bubbles residing along veins (red dashed circles).
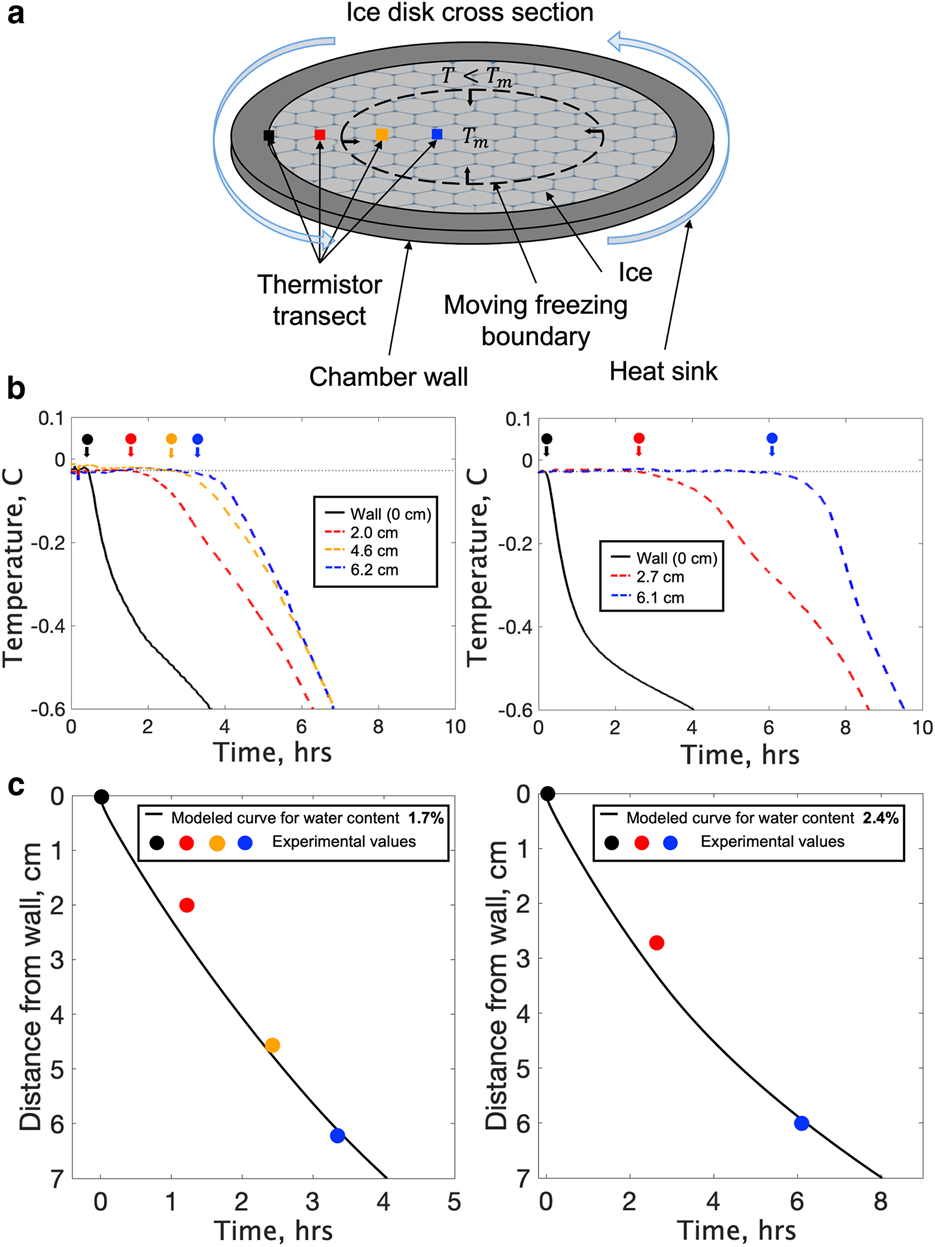
After permeability tests are completed, the water content of the ice disk is measured while it is still under pressure in the ice chamber. The speed of the freezing front created by cooling the ice disk edges is sensitive to the interstitial water content (equal to the ice porosity) due to the high latent heat of fusion of water. Small differences in water content (~0.1%) can thus be detected. The moving phase boundary results in a zone below its freezing temperature near the walls of the ice disk and a zone of temperate ice in the disk's interior (Fig. 4a). Freezing-front arrival times are indicated by thermistors when a substantial, sustained temperature decrease occurs (Fig. 4b). The water content is determined by fitting numerical solutions of the relevant Stefan problem (Asaithambi, Reference Asaithambi1988; Cohen, Reference Cohen1998; Adams and others, Reference Adams, Iverson, Helanow, Zoet and Bate2021) to freezing-front arrival times (Fig. 4c). More details are provided in Adams and others (Reference Adams, Iverson, Helanow, Zoet and Bate2021).
Measurement of ice water content. (a) Horizontal section through the ice chamber, showing a thermistor transect and inwardly moving freezing front induced by lowering the temperature of the chamber wall. Colored points show thermistor positions. Ice inside and outside the dashed line is at, respectively, the melting temperature, T m, and at subfreezing temperatures (T < T m). (b) Temperature records of thermistors for two coarse snow-seeded ice disks with different bulk salinities and water contents. Wall-thermistor records are black; those from ice-embedded thermistors are in color. Arrows indicate the freezing-front arrival times for each thermistor. (c) Model fits for freezing-front arrival times that are optimized with water contents of 1.7 and 2.4%. Time at 0 h reflects the moment the wall thermistor records the freezing front.
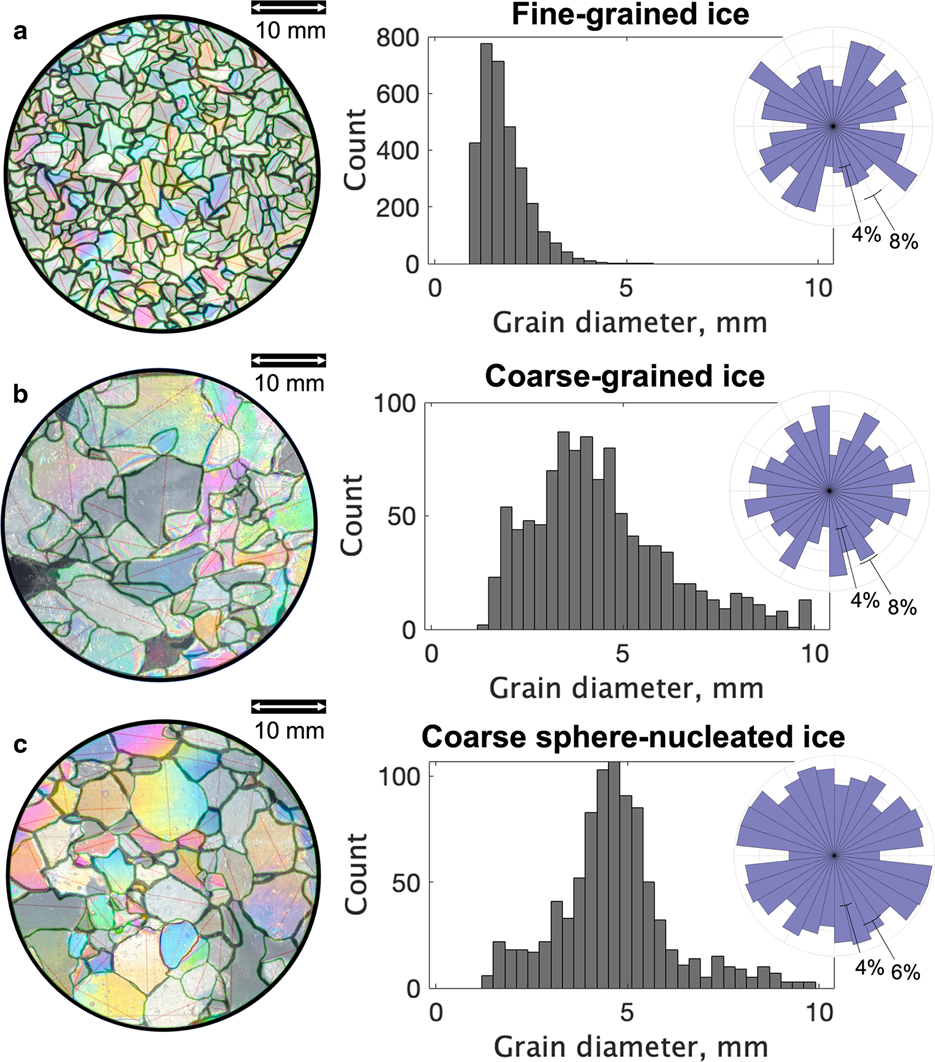
After water content is measured, the ice disk is removed from its chamber, so the properties of ice grains can be measured. Grain geometry is measured following Fitzpatrick (Reference Fitzpatrick2013), in which thin sections are cut perpendicular and parallel to water flow and photographed under cross-polarizing light to distinguish grain boundaries (Fig. 5). Grains are demarcated along 1-pixel boundaries to determine grain planimetric areas and calculate equivalent circular grain diameters. Grain diameters are then upscaled to account for measurement biases in a 2D plane following Durand (Reference Durand2004). Grain boundary tortuosity (actual length/straight-line distance) is determined by counting pixels along an ice-grain perimeter to determine the length and dividing it by the circumference of a circle computed from the grain's area (Fowler and Iverson, Reference Fowler and Iverson2022). Shape-preferred orientation (SPO) is determined by measuring the orientation of a line segment connecting the two-grain boundary pixels that are a maximum distance apart. All ice disk characteristics are analyzed using a MATLAB script that determines grain size, grain-boundary tortuosity and SPO using a color-thresholding and binarization technique (Fig. 5). Grain statistics from a subset of grains are manually cross-checked in ImageJ, an open-source image processing program (Schneider and others, Reference Schneider, Rasband and Eliceiri2012).
Grain characteristics. (Left) Photomicrographs of the three types of ice studied with grain boundaries highlighted. (Right) Grain-size distributions for each type of ice, with geometric mean grain sizes of (a) 1.8 ± 0.6 mm, (b) 4.2 ± 2.2 mm and (c) 4.4 ± 1.6 mm. SPO from thin sections cut normal to flow direction is plotted at the upper right as a frequency distribution.
4. Results
Characteristics of ice disks reflect their preparation method (Table 1). Disks made by seeding the mold with fine or coarse snow have log-normal grain-size distributions, as expected for glacier ice (Fitzpatrick, Reference Fitzpatrick2013), but ice made with coarse snow has more grain-size variability (Fig. 5). The ice seeded with 15 mm ice spheres, although comparable in grain size to disks seeded with coarse snow, have less variable grain sizes and Gaussian-like size distributions. Fine-grained samples have a slightly lower mean grain-boundary tortuosity than coarser samples (Table 1). Consistently, grain boundaries of larger crystals (> 7 mm diameter) were most irregular with measured tortuosity values > 3.0. Sphere-seeded disks have more equant grains with generally smoother grain boundaries than their coarse snow-seeded counterparts. None of the ice types had a significant SPO (Fig. 5).
Geometric mean grain diameters, mean grain-boundary tortuosities, mean permeabilities, bulk salinities and mean water contents for the three sample types
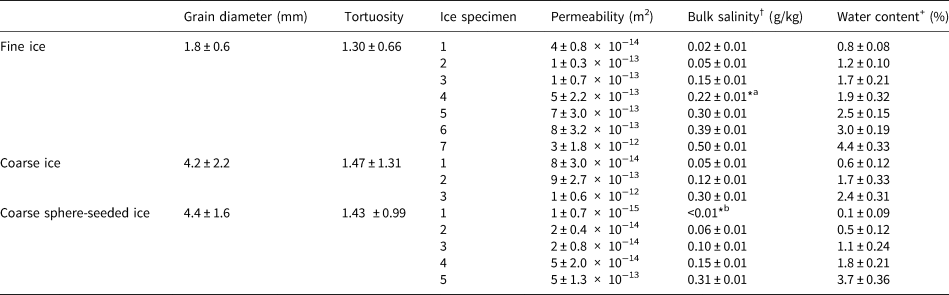
*aThis experiment used sodium sulfate.
*bThis experiment used pure deionized water with no salts added.
†Bulk salinity describes the measured addition of NaCl per liter of ultra-pure water used during sample prep.
+Water content error bars indicate ± one std dev. of values measured with individual thermistors.
Water contents resulting from varying the bulk salinity ranged from 0.1 to 4.4% (Table 1), which exceeds the highest water contents measured by Duval (Reference Duval1977) (0.008–0.80%) and Adams and others (Reference Adams, Iverson, Helanow, Zoet and Bate2021) (0.2–1.7%) in their experiments. Meltwater that drained from the base of the permeameter (< 50 mL of meltwater in all experiments) had salinities a factor of ~4 ± 2 greater than the measured bulk salinity, indicating that bulk salt concentration decreased with time, owing to the preferential release and gravity-driven drainage of salt in veins during the ice warming period, as also reported by Adams and others (Reference Adams, Iverson, Helanow, Zoet and Bate2021). In the current study, decreasing salt content during the warming period is unimportant because the average water content associated with only the flow tests, rather than the warming period, is the independent variable of interest.
Consistent with Fowler and Iverson (Reference Fowler and Iverson2022), a single intrinsic permeability value for each ice disk generally accounts for variable rates of head decrease across the range of initial hydraulic gradients applied, indicating that flow is Darcian over short time scales (minutes to hours) for the measured range of water contents (0.1–4.4%). Also, during any given flow test, mean permeability values do not vary systematically as the hydraulic gradient decreases over the duration of the test.
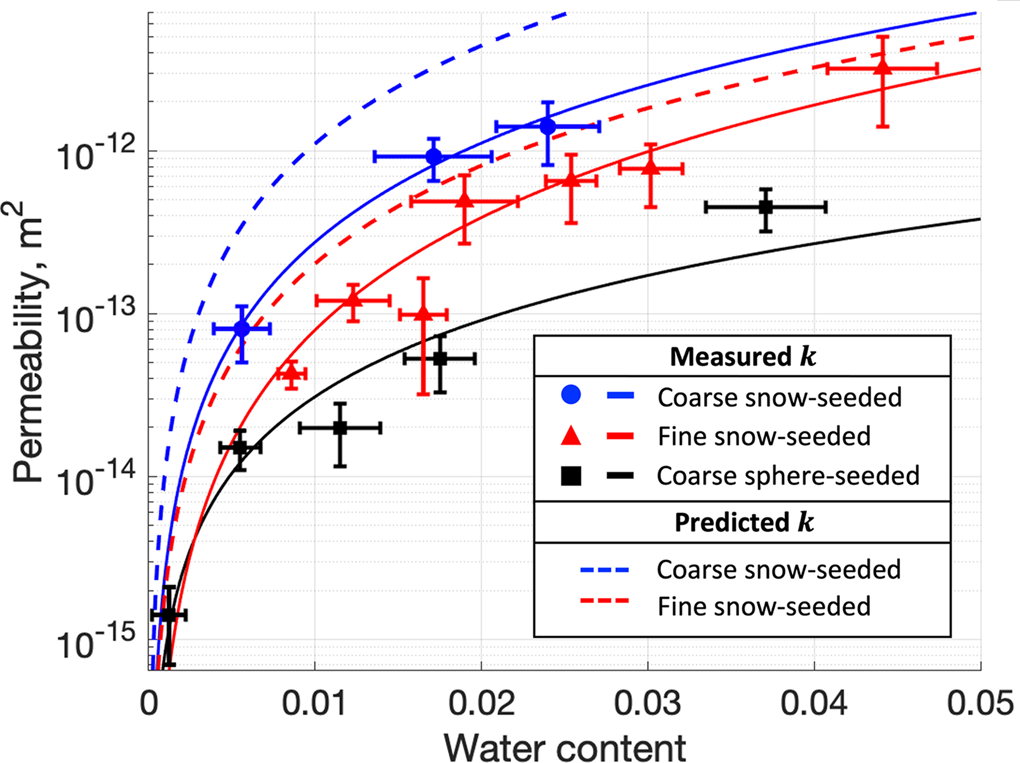
Permeability varies systematically with water content and grain size and for the two coarse-grained sample types with the sample preparation technique (Fig. 6). For all ice sample types, the data indicate a power-law relationship between permeability and water content, with fitted values of the power-law exponent of 2.3 for the fine-grained ice made with snow, and 2.0 and 1.6 for the coarse-grained ice made with snow and spheres, respectively. Over the measured range of water content (0.1–4.4%), permeability increases by about three orders of magnitude. At similar water content for ice made with snow, the coarse-grained ice is a factor of ~2–5 more permeable than fine-grained ice. Coarse-grained ice made with spheres is the least permeable, with permeability values lower by a factor of ~5–13 than for coarse-grained ice made with snow.
Permeability as a function of water content for fine snow-seeded (red), coarse snow-seeded (blue) and coarse sphere-seeded (black) ice disks. Solid lines are power-law regressions of the data, with exponent values of n = 2.3, 2.0 and 1.6 for fine-grained, coarse-grained and coarse sphere-seeded ice, respectively. Error bars are ± one std dev. Dashed lines indicate permeability from the adjusted model of Nye and Frank (Reference Nye and Frank1973) (n = 2, C = 1600), using the measured geometric mean grain diameters (Table 1).
After experiments, fluorescein dye was pervasive throughout the ice disks, indicating that a significant fraction of micro-pores were hydraulically connected (Fig. 3a). Dye, however, was seldom uniformly distributed, as indicated by differences in the brightness of fluorescence. Some fine-grained ice disks exhibited arborescent flow features, with smaller capillaries converging into larger veins down-flow (Fig. 3b) (e.g. Shreve, Reference Shreve1972). However, most macropores were not clearly arborescent (Fig. 3a). In sphere-seeded ice, dye indicated concentrically shaped water-depleted zones around the centers of the initial ice spheres (Fig. 3c). These centers clearly had locally elevated water content (Fig. 3c). The coarse sphere-seeded ice disk with the smallest measured mean water content (0.1 ± 0.09%) and permeability (1 ± 0.7 × 10⁻¹⁵ m2) showed no preferential flow pathways.
Measurement of the sizes of dye-impregnated veins in thin sections indicated 10 μm < r < 100 μm (Fig. 3d, e). Irregularly shaped melt pockets at unsystematic orientations and locations relative to grain boundaries were typical in more saline ice of higher water content, although the contribution of these pockets to the bulk water content could not be determined. Logistical problems in making thin sections and executing the fluorescence microscopy for the saline ice of these experiments prevented a more systematic study of vein sizes. Occasionally, air bubbles could be observed blocking veins (Fig. 3f).
5. Discussion
We model permeability k as a function of water content ϕ (Fig. 6) by assuming Poiseuille flow through an adjusted version of Nye and Frank's (Reference Nye and Frank1973) ideal network geometry, in which grain centers reside in a body-centered cubic lattice, grain boundaries are planar, and grain sizes and shapes are identical. Veins are defined where grain boundaries meet at 120°, and exactly four grains join at corners (Fig. 1). The adjusted model characterizes veins as uniformly sized and as curvilinear triangles in cross-section with vein-wall convexity at their vertices described by a 40° dihedral angle (Von Bargen and Waff, Reference Von Bargen and Waff1986). This value is at the upper end of the range of angles for ice measured most commonly by Mader (Reference Mader1992) (30–40°) and improves previous efforts in which veins were idealized as equilateral triangles (Fowler and Iverson, Reference Fowler and Iverson2022) or circles (Nye and Frank, Reference Nye and Frank1973) in cross-section. This vein-network model yields a squared dependence on k for both ϕ and d (3) and a geometric parameter, C = 1600 (Fig. 6) (Von Bargen and Waff, Reference Von Bargen and Waff1986).
The form of the modeled k–ϕ relationship is similar to the power-law relationships fitted to the data, which have values of the ϕ exponent, n, close to 2.0 (1.6–2.3, Fig. 6). The model also predicts, in agreement with the data, that fine-grained ice, made by snow seeding, is less permeable than coarse ice made in the same way (Fig. 6), despite the denser vein network expected for fine-grained ice. This result reflects that at a given water content, the lower density of veins in coarse ice requires that they be larger in cross-sectional area, which causes the coarse ice to be more permeable.
However, the model overpredicts k, with the degree of overprediction dependent on the sample preparation method. Coarse-grained and fine-grained ice disks seeded with snow have k values that are less than modeled values by average factors of ~4.1 and ~2.6, respectively. Measured permeabilities of coarse, sphere-seeded ice are more seriously overpredicted, with modeled values exceeding measured ones by nearly two orders of magnitude.
The fact that (3) overestimates ice permeability is unsurprising. The measured grain boundary tortuosity likely increases the tortuosity of veins, reducing the ice permeability. Moreover, the non-uniform grain size and associated dihedral angle variance likely increases the tendency for veins to be truncated or absent (Mader, Reference Mader1992), an effect that might also be exacerbated by irregular grain boundaries. Also, the model does not account for air bubbles in veins that block water movement (Raymond and Harrison, Reference Raymond and Harrison1975). Although we minimize air content by using de-aired water and a vacuum mold, small bubbles (< 300 μm) remain; examples of such bubbles situated along veins in ice disks are shown in Figure 3f.
Although these factors are difficult to quantify, the fact that the model overpredicts k more for coarse ice than for fine ice reinforces that these effects are likely important. Both the measured grain-size variability (Fig. 5) and grain-boundary tortuosity (Table 1) are greater for the coarse ice. Furthermore, air bubbles are thought to reduce k more for coarse-grained ice than fine ice (Raymond and Harrison, Reference Raymond and Harrison1975), owing to the lower density of veins in coarse ice.
The clearest divergence between the measurements and the model is for the sphere-seeded samples (compare the black and blue-dashed lines in Fig. 6), which were, as noted, nearly two orders of magnitude less permeable than the model estimation. In addition, for this ice n = 1.6 (Fig. 6), a smaller value than for the snow-seeded ice. We interpret the small k of the sphere-seeded ice, as well as the smaller value of n, to have resulted from the concentration of salt within interiors of spheres as they froze inwardly during ice preparation. The result was relative depletion of water near the exteriors of spheres that kept high-water content zones within spheres hydraulically poorly connected to surrounding ice (Fig. 3c), dramatically reducing the bulk permeability of disks at a given water content. The effect of this spatial variation in salinity on k highlights that k is not necessarily a function of only bulk values of ϕ and d but can depend sensitively on vein connectivity.
Given the idealized vein network of the model, the order of magnitude agreement between modeled and measured k values for the snow-seeded disks is somewhat surprising. One interpretation is that the mean vein cross-sectional area, the total length of veins and the proportion of bulk water content that occupies veins are not dramatically dissimilar from that of the ideal model (e.g. Wark and Watson, Reference Wark and Watson1998). Also possible is that the effects of tortuous, truncated, absent or blocked veins in ice reduce k more than indicated by the model-data comparison but that this effect is partly compensated by the ‘oversized’ preferential flow paths that we observed with the fluorescein (Fig. 3a, b). Even in ice disks where vein arborescence (e.g. Shreve, Reference Shreve1972) was observed, k values were less than modeled values, so the enhanced flow associated with arborescence did not fully offset the flow reduction through smaller, more numerous, non-ideal veins. Interestingly, arborescence was observed only in some fine-grained samples and only if ϕ > ~2%. High water contents, an associated distribution of vein size that includes larger veins, and a sufficiently large vein density may increase the probability of preferential heat dissipation in the flow sufficient to cause arborescence across the small thickness of the ice disks (< 70 mm).
Although there are no comparable laboratory data with ice to compare with our results, various studies with partially molten rocks or their analogs have yielded n values that bracket the values measured here for fine (n = 2.3) and coarse (n = 2.0) ice. Riley and Kohlstedt (Reference Riley and Kohlstedt1991) found experimentally with an aggregate of olivine and a silicate melt that n ≅ 1. More recent studies have yielded higher values. Miller and others (Reference Miller, Zhu, Montési and Gaetani2014) calculated that n ≅ 2.6 using high-resolution x-ray tomography to model flow through an olivine-basalt aggregate. Wark and Watson (Reference Wark and Watson1998) measured the permeability of mantle rock analogs to determine that n ≅ 3. These studies span ranges of melt content that are at least a factor of two larger than this study. For ϕ < 3%, more consistent with this study, n = 2 is commonly assumed for mantle rocks (e.g. McKenzie, Reference McKenzie1989).
Our experimental values of n of 2.0–2.3 are near the value chosen by Schoof and Hewitt (Reference Schoof and Hewitt2016) (2.33). Haseloff and others (Reference Haseloff, Hewitt and Katz2019) considered values of 2–3 in their modeling of ice-stream shear margins and used n = 2.0 for model calculations, consistent with Nye and Frank (Reference Nye and Frank1973). Experimental permeability values here correspond to approximately the upper half of the range they considered. Adopting the water content–permeability relationship in (3) with n = 2.3 and C = ~1600 (e.g. Von Bargen and Waff, Reference Von Bargen and Waff1986) and adding a pre-factor of 0.25–0.5 to account for vein tortuosity, truncation and clogging by air bubbles would be an approach in future modeling efforts that would be consistent with these experimental data.
Other unexplored uncertainties, particularly relevant to shear margins, include the sensitivity of ice-vein geometry to ice pressure – anticipated if ice creep into water-filled veins regulates their size through viscous compaction. The duration of our experiments, minutes to several days, cannot capture the effects of vein shrinkage from ice's viscous creep, which is thought to occur over longer periods (e.g. Schoof and Hewitt, Reference Schoof and Hewitt2016). However, the impact of creep on vein size may be minor (Lliboutry, Reference Lliboutry1996; Haseloff and others, Reference Haseloff, Hewitt and Katz2019). Haseloff and others (Reference Haseloff, Hewitt and Katz2019) found that the compaction of ice by creep plays a negligible role in ice stream dynamics, with its influence restricted to a narrow boundary layer at the top and bottom of the temperate ice region. Another uncertainty is whether ice foliation, such as the vertical foliation of some ice-steam shear margins (e.g. Thomas and others, Reference Thomas2021), causes significant permeability anisotropy. Such foliation could significantly increase meltwater flow to the bed through highly permeable fine-grained bands. Ongoing work with the permeameter on foliated glacier ice may help answer these questions.
6. Conclusions
In this first study of the permeability of temperate ice as a function of its liquid water content, permeability was closely proportional to the square of water content for values ranging from ~0.1 to 4.4%, consistent with the model of Nye and Frank (Reference Nye and Frank1973) (3). At a given water content, measured permeability values were lower than those predicted by the Nye and Frank model (Reference Nye and Frank1973) adjusted to include more realistic veins, by average factors of ~2.6 and ~4.1 for ice with mean grain diameters of 1.8 and 4.2 mm, respectively. Non-uniformity of grain sizes, irregular grain boundaries and probable associated increases in vein truncation and tortuosity, as well as vein clogging by air bubbles, are likely responsible for this discrepancy. Reduced permeability due to these factors was partly compensated by preferential flow in isolated oversized veins, as well as by vein arborescence. The latter was observed only in some finer-grained disks and only at water contents > 2%. An ice preparation technique that caused islands of high NaCl concentration and hence water content, with surrounding depleted zones, resulted in permeability values roughly two orders of magnitude smaller than the model prediction, presumably as a result of reduced vein connectivity. This result highlights that the permeability of ice of a given grain size is not necessarily a unique function of bulk water content.
Data
The data presented in this paper will be made available at the US Antarctic Data Center repository (https://www.usap-dc.org/) prior to final publication.
Acknowledgements
This research was supported by grant OPP2129252 from the US National Science Foundation. We thank Jamie Hefley for illustrating Figure 2, Carter Mayland for his help characterizing the ice texture, and the two anonymous reviewers for their constructive comments.
Author contributions
N. R. I. designed and supervised the construction of the permeameter. J. R. F. executed the experiments and analyzed the data, with contributions from N. R. I. Both authors helped design the experiments and write the paper.


 Open access

