


Are voters equipped to respond to policy and policy-induced changes in their lives? This question is central to the survival of democracy and serves as a key line of inquiry in political science. While scholars have long known that the creation of large policies and social programmes can create more politically engaged citizens (Schattschneider, Reference Schattschneider1935), considerably less evidence demonstrates that voters are able to recognise policy change and update their policy attitudes and candidate preferences in ways that are reflective of their experiences with the policy (Campbell, Reference Campbell2012). Existing explanations for the lack of evidence of this type of directional policy feedback Footnote 1 have mostly focused on the roles of partisanship and the structure of the policy or programme in making policy feedback more or less likely.
I argue that the institution of federalism and subsequent state-level variation in the effects of federal policy are important and understudied contributors to the patterns of directional policy feedback that we observe in the United States(US). Federalism creates significant barriers to citizens’ abilities to engage in directional policy feedback by blurring which actors are responsible for the policy received and creating geographic variation in the effects of federal policy. In addition to creating their own programmes and policies, state and local governments can also affect the design, implementation and eligibility conditions for many federal programmes, granting states significant discretion over many factors that impact ordinary people’s lives (Grumbach, Reference Grumbach2018).
In this era of intense partisan competition, state government officials are also increasingly using their delegated policymaking powers to undermine the performance and implementation of federal policies associated with the opposition party (Herd and Moynihan, Reference Herd and Moynihan2018). Restricted eligibility criteria, so-called administrative burdens, or outright rejections of federal policies and programmes by state actors who are politically opposed to the programme may cause voters to view the federal policy and its elite supporters negatively. At the same time, programme recipients who live in more policy-supportive states may be more likely to engage in the normal policy feedback process, with increased support for the policy and the elites who support it because of the increased likelihood of experiencing positive policy effects and have a more positive experience with the policy.
Incorporating this role of federalism introduces nuance into the policy feedback literature by creating geographically varied expectations for whether policy feedback occurs and, if so, whether the feedback is positive or negative. Based on prior work in blame attribution bias in political accountability (Rogers, Reference Rogers2017; Sances, Reference Sances2017), it is plausible that state officials may avoid the political consequences of their actions if voters are unable to appreciate state actors’ roles in policy implementation.
To evaluate whether and how federalism impacts policy feedback in this way, I focus on the effects of Medicaid expansion via the Affordable Care Act (ACA) on the opioid epidemic and the resulting political consequences of each. Many political observers suggested that voter anger due to the government’s failure at addressing the opioid epidemic helped explain President Trump’s electoral success (Garcia, Reference Garcia2017; Newburger, Reference Newburger2018). Beyond its anecdotal importance for the 2016 presidential election, the opioid epidemic, the ACA, and Medicaid expansion also provide a particularly useful case for my theoretical argument. In addition to its primary insurance goals (which could also indirectly influence opioid usage), the ACA included specific provisions for fighting the epidemic, such as expanded access to substance abuse disorder treatments and overdose prevention medications (Abraham et al., Reference Abraham, Andrews, Grogan, D’Aunno, Humphreys, Peter, Pollack and Friedmann2017; Davis, 2017a; Frank and Fry, Reference Frank and Fry2019). However, not all localities experienced the same level of access to this federal policy.
Following the National Federation of Independent Business versus Sebelius (2012) Supreme Court decision, which ruled that the Medicaid expansion provisions of the ACA were unconstitutional, states were given significant discretion over the implementation of the ACA. In effect, the court’s ruling gave states the complete power to opt in or out of the Medicaid expansion provisions of the ACA. In many states with Republican governors and state legislatures, governments opted out of Medicaid expansion and, whether intentional or not, bypassed many of the beneficial and epidemic-fighting components of the ACA. Indeed, many Republicans viewed rejecting the ACA and Medicaid expansion outright to be an important component of their long-term political strategy (Herd and Moynihan, Reference Herd and Moynihan2018).
To examine how both the Medicaid expansion decision and its resulting effects on the opioid epidemic influenced voting behaviour, I exploit differences across the borders of states that expanded Medicaid as part of the ACA and those that did not. This type of design serves two purposes. First, counties along the borders of expansion and nonexpansion states arguably vary only randomly in observable and unobservable characteristics. As a result, this geographic discontinuity design can provide a reliable estimate of the causal effect of policy change on political behaviour. Second, the ACA included many lesser-known provisions meant to specifically curb the growing opioid problem. As a result, these border discontinuities should also provide substantively important variation in the trajectory of the opioid epidemic following the Sebelius (2012) decision.
Using this geographic regression discontinuity design (GRD), I find that relative to counties in nonexpansion states, expansion counties on average became more Democratic from 2012 to 2016. However, this relationship heavily moderated the local severity of the opioid epidemic. The positive effects of Medicaid expansion on change in Democratic vote share completely attenuate to zero when a community’s opioid severity reaches roughly the median level of severity in 2016 or if the community experienced an increase in prescription opioid usage, suggesting that the opioid epidemic eroded support for the Democratic Party in expansion and nonexpansion counties by similar amounts. These results refine our understandings of policy feedback and electoral accountability in a federal system. Although voters in expansion states rewarded the party responsible for the policy and reacted predictably to the subsequent policy effects, the institution of federalism affected where this type of positive policy feedback occurred. The lack of full access to the ACA via Medicaid expansion caused voters in nonexpansion states to engage in arguably self-defeating policy feedback where the party of state the officials who obstructed the full implementation of the ACA actually benefited from comparatively worse health conditions.
This type of self-defeating policy feedback has important implications for both democracy and the state of health care. By undermining the implementation of the incumbent president’s party, state politicians of the opposition party worsened the objective health conditions of their own constituents, with voters in turn responding by blaming the incumbent president’s party in the next election. Theories of democracy and electoral accountability assume that politicians are motivated to perform well in office as part of their desires to seek re-election. However, these results suggest that under certain conditions – such as eras of strong partisanship and fierce electoral competition–opposition partisans of the president (especially at the state level) may be electorally incentivised to undermine public goods and harm their own constituents (Lee, Reference Lee2016; Sances, Reference Sances2017).
On the health care front, these findings have particularly grave consequences. Following the 2016 election, the state of health care provision and the opioid epidemic worsened in many nonexpansion states, with many rural hospitals closing as a result of states’ decisions not to expand Medicaid (Kelman, Reference Kelman2019) – further exacerbating the effects of the opioid epidemic and costing the lives of many. As a result, understanding how voters are likely to respond to these worsening health conditions is of continued practical importance.
Policy feedback and federalism
Scholars have long demonstrated that the public’s political engagement increases in response to major changes in public policy (Schattschneider, Reference Schattschneider1935; Campbell, Reference Campbell2002). When the federal government creates a new social programme, programme participants tend to become more politically interested and knowledgeable (participatory feedback). Across a variety of policy domains and social programmes, that “policy makes new politics” has become near canon. Theories of policy feedback also predict that participants’ self-interest in preserving the social programme can affect political attitudes and partisan loyalties (directional feedback). Despite clear theoretical expectations and extensive empirical studies, the literature on policy feedback is limited in a number of important respects.
First, the policy feedback literature has insufficiently incorporated how institutions like federalism may alter patterns of policy feedback. Footnote 2 This oversight has occurred despite the fact that states play increasingly important roles in policymaking, in shaping how federal programmes are implemented, and economic inequality (Kelly and Witko, Reference Kelly and Witko2012; Grumbach, Reference Grumbach2018; Herd and Moynihan, Reference Herd and Moynihan2018). Second, many existing accounts of policy feedback focus on participatory effects and have mostly failed to find directional feedback effects (Campbell, Reference Campbell2012). As a result, we are left without much evidence that major public policy changes can induce citizens to update their preferences and voting behaviour to reflect their positive experiences.
Third, many studies have yet to fully appreciate how varied policy implementation may alter patterns of policy feedback. In other words, while policy is of central focus in the feedback literature, the role of policy effects has remained under-investigated. Addressing this gap is especially important because scholars have shown that changing local objective conditions, such as the local economy or local trade-induced layoffs, can affect presidential voting and political attitudes (de Benedictis-Kessner and Warshaw, 2020; Lenz and Healy, Reference Lenz and Healy2019; Ritchie and You, 2021), especially when these conditions have been contextualised and made salient by the media or other political actors (Mutz, Reference Mutz1994; Hopkins, Reference Hopkins2010). Moreover, the structure and generosity of a programme is deeply affected by federalism and the choices of state legislative and executive officials (Gray, Lowery and Benz, Reference Gray, Lowery and Benz2013; Campbell, Reference Campbell2014; Michener, Reference Michener2018), creating greater potential for state-by-state differences.
The insufficient attention paid to these federalism-induced differences in policy and resulting geographic variation in the success or effectiveness of a policy can help explain the limited evidence of directional policy feedback. Prior work suggests that the design and implementation of federal policies can affect citizens’ abilities to incorporate their experiences with a programme into their political judgments (Soss and Schram, Reference Soss and Schram2007; Mettler, Reference Mettler2011; Morgan and Campbell, 2011). The federal government often allows state governments to have a significant amount of discretion over how programmes function, for instance which groups of people meet eligibility standards within a state or how generous benefits are. As a result, state policy implementation decisions can produce significant geographic variation in policy effects and therefore policy feedback (Michener, Reference Michener2018).
In a variety of domains, state officials have an advantage to undermine the policymaking objectives of federal out-partisans (Herd and Moynihan, Reference Herd and Moynihan2018). However, less is known about how voters respond in these situations. Michener’s (2018) work is the first to systematically interrogate whether federalism has an important influence on policy feedback. While important, Michener’s (2018) discussion focuses exclusively on dichotomous instances of political participation rather than the kinds of directional policy feedback of interest here. To further explore how federalism can impact directional policy feedback for federal policies, I turn to a generic health care policy example.
Consider a federal health care programme launched by the Democratic Party in which states can support or oppose the implementation of the health programme, influencing whether voters in their state receive more or less of the health policy. In states that choose to fully implement (or even improve upon) the health care programme, the classical policy feedback literature (Campbell, Reference Campbell2002, Reference Campbell2012) predicts that voters in those states will likely increase their support for the policy, increase their political participation in response to the policy, and ultimately credit the federal Democratic Party for the policy (H1).
This is consistent with theories of retrospective voting. Fiorina (Reference Fiorina1981) suggests that voters ought to respond to the positive effects of the policy as well. Indeed, politicians regularly design policy believing that the effects of their policies or the resulting objective conditions following policymaking will be more electorally relevant than the policymaking process itself (Arnold, Reference Arnold1990). If voters experience more favourable health conditions following the policy adoption, especially if those health conditions are made salient and politically relevant by elites or the media (Hopkins, Reference Hopkins2010), voters are again likely to credit the federal incumbent Democratic Party (H2). As a result, we would expect better health conditions to lead to increased support for the Democratic Party and for these health experiences to moderate and perhaps offset the direct effects of supporting the policy. Both of these theoretical traditions lead to clear predictions for policy-supportive states:
Voters in policy-supporting states will be more likely to support the Democratic Party
Voters in areas with better health conditions in policy-supporting states will be more likely to support the Democratic Party
Although we expect less support for the federal Democratic Party in policy-opposing states relative to supportive states, the predictions for the influence of what I have called “policy effects” are less clear. As a result of not implementing the policy, health conditions are likely to have worsened generally and especially relative to the policy-supporting states that are receiving full policy benefits. One possibility is that voters correctly recognise the role of state Republicans in the nonimplementation of the policy as well as the resulting health care conditions. This type of theorising has found consistent support in the empirical literature, with voters generally being able to hold politicians accountable for things under their direct purview, especially if those decisions are made salient (Stein, Reference Stein1990; Arceneaux, Reference Arceneaux2006). For example, Atkeson and Partin (Reference Atkeson and Partin1995) find that governors and not senators tend to be held accountable for local and state economic performance, reflecting governors’ more sizable influence on state economies. Across a number of levels of government and policy areas, many studies have similarly shown that voters seem to assign responsibility to politicians based on their job portfolios (Niemi, Stanley and Vogel, Reference Niemi, Stanley and Vogel1995; Hansen, Reference Hansen1999; Orth, Reference Orth2001).
Based on this perspective, because voters are aware of their state’s decision to forego these potential benefits, we may anticipate them to either blame the party that controls their state government – in this example Republicans – for their worsening health conditions or they may not vote along those lines at all, absolving the federal Democratic Party of responsibility for worsening conditions. As a result, we would either expect to see no relationship between the resulting health conditions or perhaps even a negative relationship, where worse conditions lead to greater support for the Democratic Party (H3a).
(a) Voters in areas with worse health conditions in policy-opposing states will be uninfluenced or more likely to support the Democratic Party
Alternatively, we may expect voters in policy-opposing states to respond to their changing objective conditions in the same way as voters in the policy-supportive ones. Voters often struggle to connect policies and policy effects to specific politicians. Difficulties in blame or credit attribution even cause voters to fault national politicians and especially the president for events outside of their or anyone’s control (Healy and Malhotra, Reference Healy and Malhotra2010; Achen and Bartels, Reference Achen and Bartels2016). This attribution issue can manifest itself in voters evaluating state and local politicians based on their evaluations of the president (Carsey and Wright, Reference Carsey and Wright1998; Rogers, Reference Rogers2017), sometimes going as far as blaming the president for policy changes that the voters themselves enact via direct democracy (Sances, Reference Sances2017).
When voters are unlikely to know that state actors are responsible for the success or failure of a federal programme in their area or are unaware that their state government has made the health conditions around them worse relative to peer communities, they are likely to simply blame the incumbent president’s party. Along these lines, and although voters trust their state governments more than the federal government (i.e. Kam and Mikos (2007)), voters indeed often understand very little about how their state governments function and what they do (Carpini and Keeter, 1996). As a result, we may anticipate seeing the federal Democratic Party perform worse in places where health conditions worsened in nonimplementation states, even though local Republican officials were largely responsible (H3b).
(b) Voters in areas with worse health conditions in policy-opposing states will be less likely to support the Democratic Party
All told, we are left with competing expectations for the differences in voting behaviour between policy-supporting and policy-opposing states. While policy-supporting states ought to be more supportive of the federal Democratic Party relative to policy-opposing ones (H1), there are multiple possible effects of the resulting health disparities. We might expect voters to blame the Democratic Party for worsened conditions regardless of the policy decisions of the state government because they lack awareness of state-politician culpability (H2 and H3b). However, voters in policy-opposing states may also recognise that state officials have impacted their policy experiences and, as a result, increase their support of the Democratic Party (H3a).
The ACA, the opioid epidemic, and the politics of pain
To gain leverage on these important gaps in the policy feedback literature, I focus on the case of Medicaid expansion via the ACA and the opioid epidemic. The ACA was designed to simultaneously extend insurance coverage to more Americans and cut health care costs. One method of achieving these goals was to expand Medicaid eligibility to individuals making 138 per cent of the federal poverty line and below. However, as a result of the National Federation of Independent Business versus Sebelius (2012) Supreme Court decision, state governments had complete discretion over whether or not Medicaid eligibility, a key component of the ACA, would be expanded within their state.
While state-level variation in Medicaid and universal coverage practices existed prior to the ACA as a result of federalism (Gray, Lowery and Benz, Reference Gray, Lowery and Benz2013; Campbell, Reference Campbell2014; Michener, Reference Michener2018), the National Federation of Independent Business versus Sebelius (2012) decision further exacerbated these differences and created new ones. The Sebelius decision allowed state government officials who were opposed to the ACA the opportunity to chose to undermine the ACA’s effectiveness by forgoing Medicaid expansion. As a result, Herd and Moynihan (Reference Herd and Moynihan2018) describe the ACA as a perfect example of how federalism “creates opportunities for different levels of government to work at cross-purposes” (96). In this regard, many Republican officials fought the full implementation of the ACA for fear of the pro-Democratic political effects of the policy being popular and widely used (Cassidy, Reference Cassidy2017).
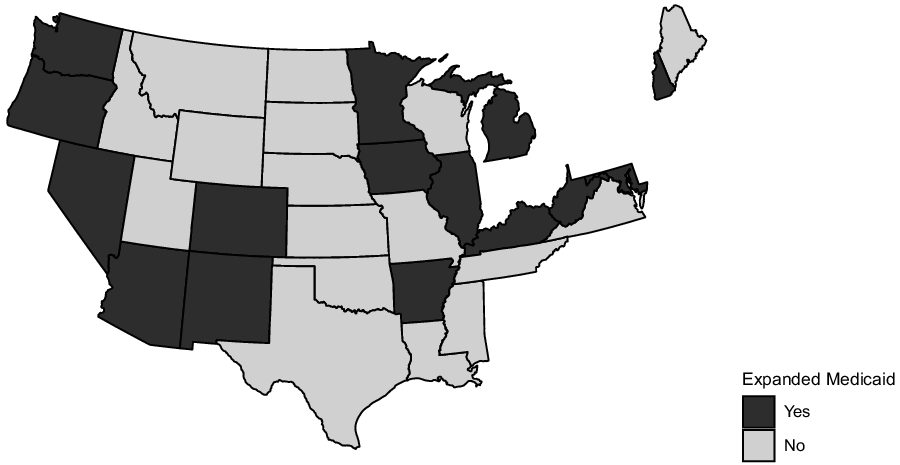
As Figure 1 demonstrates, the Sebelius decision created significant variation across the country in experiences with Medicaid expansion, and, as a result, the many positive policy effects of the ACA. Footnote 3 In Figure 1, which provides the Medicaid expansion status of all states, darker coloured states are states that expanded Medicaid and implemented as of 2015, the lighter shaded states had not. As can be seen in Figure 1, nearly all Democratic-controlled states (especially in the Northeast and West) chose to expand Medicaid, some of which had equivalent or more universal policies (like Massachusetts and Vermont) in place prior to the 2014 onset of many of the ACA’s provisions (Gray, Lowery and Benz, Reference Gray, Lowery and Benz2013). However, the Medicaid expansion status of Republican and mixed-control states varied considerably. Battleground states with Republican governors, like Ohio and Michigan, expanded Medicaid quickly, while the battlegrounds of Wisconsin and Florida did not. Even some deeply Republican states, like Indiana and Arizona (at that time), chose to expand Medicaid. Footnote 4
Medicaid expansion implementation status of states (2015). Notes: Plot provides the Medicaid expansion implementation status of each state as of the end of 2015. Darker colours reflect states that expanded and implemented Medicaid by the end of 2015.

In addition to its primary insurance coverage and health care cost goals, the ACA also included lesser-known provisions for fighting the growing opioid epidemic. Many of these provisions were specifically tied to a state’s Medicaid expansion decision. For example, via Medicaid expansion, the ACA helped expand access to substance abuse disorder treatments, increased use of naloxone (a fast-acting drug that reverses the effects of opioid overdoses and can be used to promote responsible opioid use), provided new enforcement emphasis on over-prescribers, and increased the availability of affordable health insurance that allowed citizens to pursue alternatives to opioids, black market pain killers, and heroin (Abraham et al., Reference Abraham, Andrews, Grogan, D’Aunno, Humphreys, Peter, Pollack and Friedmann2017; Davis, 2017a; Frank and Fry, Reference Frank and Fry2019). As a result, whether or not a state expanded Medicaid under the ACA had important impacts on the trajectory of the opioid epidemic in the state.
I provide graphical evidence in support of these previous findings in Figures 2 and 3. Here, we see that opioid prescription rates – measured as the number of opioid prescriptions per 100 people in a county – began declining on average across the country in 2014 when the major components of the ACA had taken effect following the Sebelius decision. Some of this national decline is no doubt driven by states passing opioid-fighting policies independently of the ACA, such as enhanced prescription monitoring programmes (Haegerich et al., Reference Haegerich, Paulozzi, Manns and Jones2014; Davis and Carr, Reference Davis and Carr2015; Ali et al., Reference Ali, Dowd, Classen, Mutter and Novak2017; Whitmore et al., Reference Whitmore, White, Buntin, Fry, Calamari and Patrick2019) as well as state-level variation in other health policies (Gray, Lowery and Benz, Reference Gray, Lowery and Benz2013). However, as can be seen in Figure 3 states that expanded Medicaid began to experience larger declines in opioid usage relative to nonexpansion states.
CDC trends in average opioid usage.
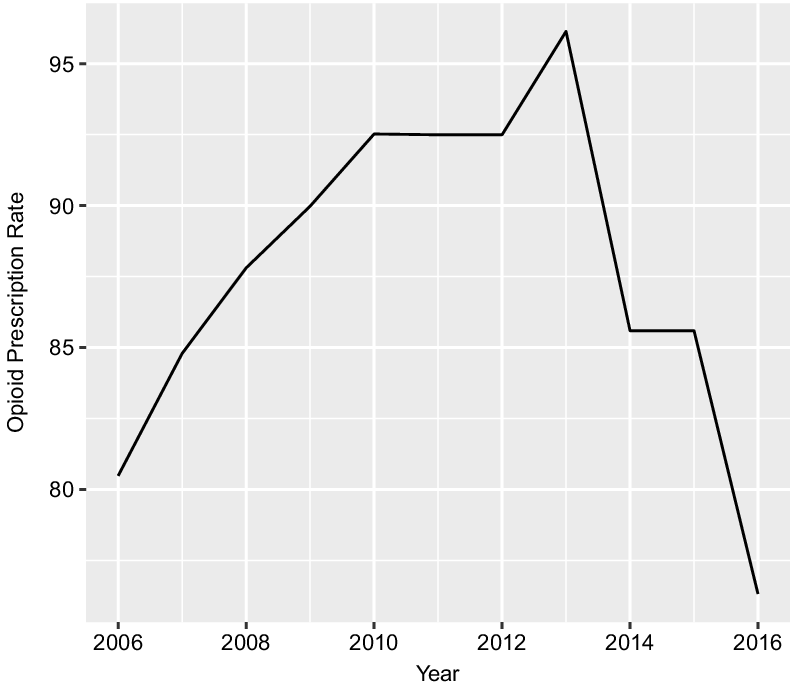
Change in opioid usage. Note: Figure 2 provides the yearly average prescription opioid rate from 2006–2016. Figure 3 compares the change in prescription opioid usage from 2014 to 2016 in communities along expansion and nonexpansion state borders, with the darker line indicating a larger decline in usage in expansion communities. Source: Centers for Disease Control.
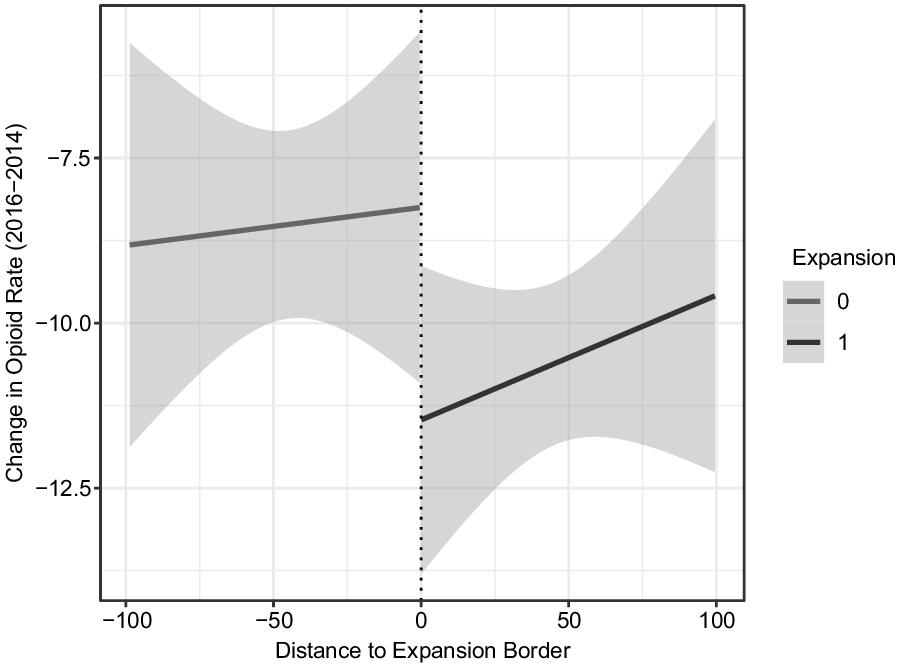
In Figure 3, I compare how opioid prescription rates changed in the two years (2014-2016) following the onset of the ACA’s provisions in counties just on either side of opposite Medicaid expansion borders. Footnote 5 When examining this set of expansion state counties bordering nonexpansion state counties, we observe larger declines in opioid usage in states that opted for expansion. Footnote 6
In the run up to the 2016 presidential election, political observers suggested that the opioid epidemic may have caused voters to support Donald Trump. Communities where “opioids took over thousands of lives” and where “deaths of despair” loomed became bastions of Trump support (Garcia, Reference Garcia2017; Newburger, Reference Newburger2018). Inherent in all of these anecdotal analyses was the assertion that places that experienced worse and worsening opioid conditions blamed President Obama and the Democratic Party for their community’s plight. Indeed, some of the rhetoric surrounding the Trump campaign and the 2016 election connected the opioid epidemic specifically to the politics of the election and to debates about the quality of the ACA.
On the campaign trail in 2016, candidate Donald Trump regularly evoked the opioid epidemic to rally support, often stating things like, “the people that are in trouble, the people that are addicted, we’re going to work with them and try to make them better” (Hauck and Stafford, 2017). Candidate Trump also often tweeted about the opioid epidemic and the ACA during the primary and general election periods. For example, on 15 October 2016, Trump tweeted, “Landing in New Hampshire soon to talk about the massive drug problem there, and all over the country.” Just days later on 19 October 2016, Trump tweeted, “We have to repeal & replace #Obamacare! Look what its doing to people! #DrainTheSwamp,” later promoting the #ObamacareFail hashtag as the election neared. Footnote 7 The New York Times were among multiple outlets that suggested that the attention Trump paid to the epidemic during the campaign was particularly influential with white working-class voters (Davis, Reference Davis2017b).
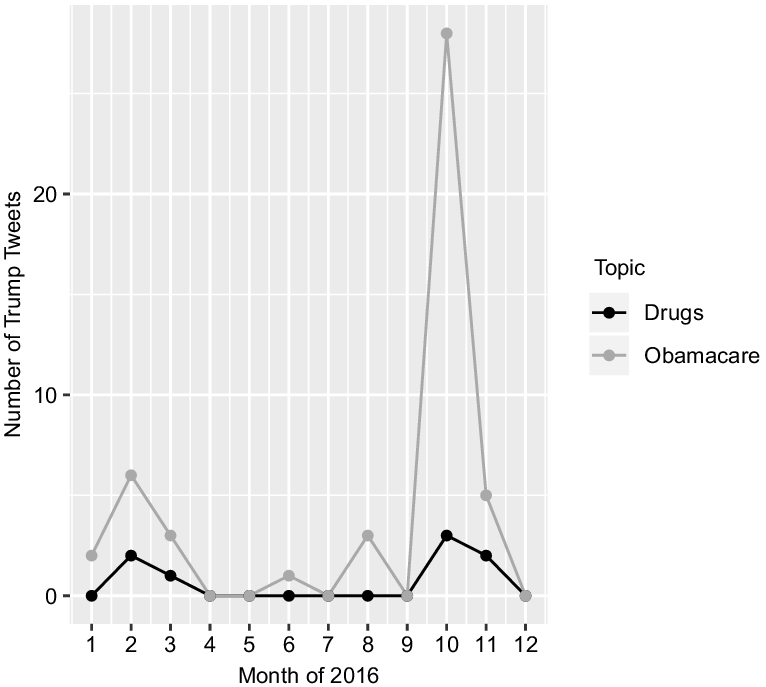
In Figure 4, I provide graphical evidence of Trump’s personal role in increasing the salience of the epidemic. Here, I use data from the Trump Tweet Archive to plot the number of tweets by Trump each month of 2016 mentioning either “drug” or “Obamacare,” as in the examples mentioned previously. Two, albeit very differently sized, peaks are visible in Trump’s online discussions of the opioid epidemic and Obamacare. Trump’s tweets for both terms initially peaked during the early Republican primary months, especially around the New Hampshire primary. Footnote 8 His mentions of both terms and especially Obamacare reached much higher peaks as the general election neared. These data show that Trump tweeted about the opioid epidemic (“drug”) 5 times and Obamacare 33 times in the final weeks of the campaign. Research by the political communication scholars suggests that in addition to the direct attention paid to these issues by Trump online, roughly 40% of all political ads aired during the 2016 presidential election cycle made reference to health issues (Fowler et al., Reference Fowler, Baum, Jesch, Haddad, Reyes, Gollust and Niederdeppe2019). Additionally, nearly 5.5% of the all political ads run in federal and state/local races between 2012 and 2016 made reference either to Obamacare/ACA or Medicaid, while another 1% of all campaign ads specifically referenced drug addiction (Fowler et al., Reference Fowler, Baum, Jesch, Haddad, Reyes, Gollust and Niederdeppe2019).
Trump tweets.
The activities by the Trump campaign and the broader political environment appear to have made the opioid epidemic and the politics of the ACA/Medicaid expansion salient for voters during the 2016 election. As Hopkins (Reference Hopkins2010) argues, the increase in this type of “salient national rhetoric” is likely to cause citizens to “find it easier to draw political conclusions from their experiences” (43). In other words, social and demographic differences between communities (like the severity of the opioid epidemic, level of immigration in an area, etc), which ubiquitously vary in local relevance or level, are likely to be most politically important when that issue has been made salient by the national media environment and political elites. We can see in Figure 5 that, as measured by the number of articles mentioning the word “opioids” in the New York Times, the opioid epidemic was indeed salient and likely politically relevant in 2016 for the first time, with the number of articles mentioning opioids jumping from 38 in 2015 to 343 in 2016. Using similar data, Clinton and Sances (Reference Clinton and Sances2021) show that the politics of Medicaid expansion, the ACA, and the potential repeal thereof were also highly salient during this same period. As a result, it seems plausible that there was some degree of opioid-based and ACA issue-voting and policy feedback in the 2016 presidential election.

Finally, the extant literature suggests that this particular case may be ideal for testing the competing predictions outlined in the previous section. Prior work has demonstrated that, consistent with canonical theories of policy feedback, state Medicaid expansion decisions impacted participatory policy feedback(Clinton and Sances, Reference Clinton and Sances2018) and attitudes about the ACA (Hopkins and Parish, Reference Hopkins and Parish2019; Clinton and Sances, Reference Clinton and Sances2021). Work on other opioid-related policies suggests that opioid attitudes seem to be driven by self-interest (de Benedictis-Kessner and Hankinson, Reference de Benedictis-Kessner and Hankinson2019), increasing the likelihood of directional policy feedback for this specific case. Finally, Kaufman and Hersh (Reference Kaufman and Hersh2020) show that personal experiences with opioid overdoses matter politically. All told, these factors and the idiosyncratic nature of Medicaid expansion due to the Sebelius decision make this case ideal for testing the arguments outlined in the previous section. Footnote 9
Data and research design
My hypotheses focus on the potential differences in presidential voting behaviour between areas that received expanded Medicaid coverage between 2013 and 2015 and, as a result, experienced different levels of the severity of the opioid epidemic. For my purposes, states are considered to have expanded Medicaid if they had expanded and implemented Medicaid expansion under the ACA or had an equivalent or more universal policy in place as of 2015 – coded as 1 if expanded and 0 if not. Footnote 10 To measure the changing severity of the opioid epidemic, I use data from the Centers for Disease Control (CDC). These data provide estimates of the number of opioid prescriptions per 100 people in each county in the US. The CDC collects reports from a sample of roughly 50,000 pharmacies across the country and includes estimates of both initial and refill prescriptions. Although there are some missing data, estimates are available for nearly all counties from 2006–2018. Footnote 11
I rely on these prescription data as a measure of how severe the opioid epidemic is in a locality over other potential measures like drug-related deaths and the Washington Post’s DEA Pills database for practical reasons. In comparison to both measures, the CDC opioid prescription rate measure has far fewer cases of missing data and is publicly available for more years (most crucially 2016). Moreover, estimates of drug-related deaths are often noisy and may include nonopioid specific deaths. Fortunately, all three of these measures of the severity of the opioid epidemic are highly correlated and using one over the other is not likely to matter empirically. Footnote 12 The substantive relationship between the CDC opioid prescription rate and the drug-related deaths measure suggests that increasing opioid prescription rates from their minimum to maximum value is associated with an increase in approximately 37 drug-related deaths per 100,000 – above the 90th percentile in drug-related deaths across the country in 2014. Footnote 13 The weighted-average county opioid prescription rate in 2016 was 76, with considerable variation across the US in opioid usage. Footnote 14 Matching many of the anecdotes from the previous section, these data suggest that the most severely impacted areas were in Appalachia and the Rust Belt, with some of these counties having prescription to people ratios of 3 to 1 or higher at some point between 2006 and 2016.
I rely on county-level data of the opioid epidemic for three reasons. First, most existing measures of opioid epidemic severity only exist at county and state levels, making more fine-grained analyses with administrative data difficult. Second, existing survey measures of experiences with the opioid epidemic do not appear to reliably measure the severity of the opioid epidemic in communities. For example, Sides, Tesler and Vavreck (Reference Sides, Tesler and Vavreck2018) use survey measures of whether respondents report knowing someone who is addicted to painkillers, drugs, or alcohol to dismiss notions that the opioid epidemic was electorally relevant in 2016. In Appendix 3 Table 7, I show that these survey items are negatively related to changes in the severity of the opioid epidemic from 2014 to 2016 and quite modestly related to the absolute level of opioid prescriptions in communities. Third, scholars have demonstrated that community and group experiences are often more relevant predictors of political behaviour than individual experiences, often demonstrating such using county-level data (Brody and Sniderman, Reference Brody and Sniderman1977; Huckfeldt, 1979; Mondak, Mutz and Huckfeldt, Reference Mondak, Mutz and Huckfeldt1996; Mutz and Mondak, Reference Mutz and Mondak1997; Hopkins, Reference Hopkins2010; Anoll, Reference Anoll2018; Ritchie and You, 2021).
Geographic discontinuity design and Medicaid expansion borders
To assess the electoral effects of Medicaid expansion and the opioid epidemic, I employ a version of a GRD. The logic behind a GRD is that observations on either side of a substantively relevant geographic boundary (i.e. “treatment”) ought to vary as-if randomly on observable and unobservable dimensions (Keele and Titiunik, Reference Keele and Titiunik2015). As a result, comparisons across substantively important borders can reveal the causal impact of different geographic unit treatments. The design I use in this project mirrors that of Clinton and Sances (Reference Clinton and Sances2018), who compare the effect of Medicaid expansion on insurance uptake and voter turnout in communities just on either side of differing Medicaid expansion border.
Specifically, I exploit the fact that some states expanded Medicaid and some did not. As a result, state borders between expansion and nonexpansion states provide variation in the “treatment” of policy change via Medicaid expansion. Moreover, and as I and others have shown, the decision to expand Medicaid had important impacts on the level of severity of the opioid epidemic. Thus, these border discontinuities also provide variation in the changing severity of the opioid epidemic. In Figure 6, I graphically display the logic of this design as well as the sample of states included in the GRD design. Footnote 15 The goal of this design is to compare changes in voting behaviour for communities just on either side of a Medicaid expansion border. As a result, I aim to compare only the sample of states that share border with a state of a different Medicaid expansion status. For example, while both Kentucky and Ohio expanded Medicaid as of 2015, as Figure 6 shows, only Kentucky shares a border with nonexpansion states (Tennessee, Missouri, and Virginia). Therefore, Kentucky is included in the border analyses and Ohio is not.
Medicaid expansion implementation status of states (2015). Notes: Plot provides the Medicaid expansion implementation status of each state as of the end of 2015. Darker colours reflect states that expanded and implemented Medicaid by the end of 2015.
Observations in this type of design are primarily defined by three quantities of interest: running, forcing, and outcome variables. The running variable is a continuous variable that captures “distance” to or from the forcing variable. Here, the running variable is measured as Euclidean distance (in miles) from the geographic centroid of the county to the closest state with a different Medicaid expansion status, with counties in expansion states taking on positive values (in miles) and counties in nonexpansion states taking on negative ones. Footnote 16
The forcing variable, or cut point, is a county’s Medicaid expansion status, which is measured dichotomously with values of 1 for having expanded Medicaid and 0 for not. The outcome variable is the change in the Democratic Party’s share of two-party vote from 2012 to 2016. Footnote 17 To the standard GRD design, which may focus simply on the impact of the policy, I add and assess the political impact of opioid prescription rates on either side of the Medicaid expansion borders. For robustness, I also estimate models that include control variables to rule out potential confounding explanations for a community’s level of support for the Democratic Party and the level of the opioid epidemic in the area. Specifically, I also estimate models that control for an area’s educational attainment (% of the population with less than a high school education) and socio-economic status of the area (median income, unemployment). Case and Deaton (Reference Case and Deaton2020) argue that communities with higher proportions of working-class men have been the most frequent victims of “deaths of despair” like the opioid epidemic. Footnote 18
The GRD estimates causal effects if a few identifying assumptions are met. First, expansion and nonexpansion observations must remain independent. This assumption requires that expansion status in one area must not impact conditions in another. This “no sorting” constraint is most likely violated if Medicaid expansion causes individuals to move across state borders (Clinton and Sances, Reference Clinton and Sances2018). Prior work suggests that this is not a concern as there is little evidence of Medicaid-induced migration (Schwartz and Sommers, Reference Schwartz and Sommers2014; Clinton and Sances, Reference Clinton and Sances2018). Footnote 19
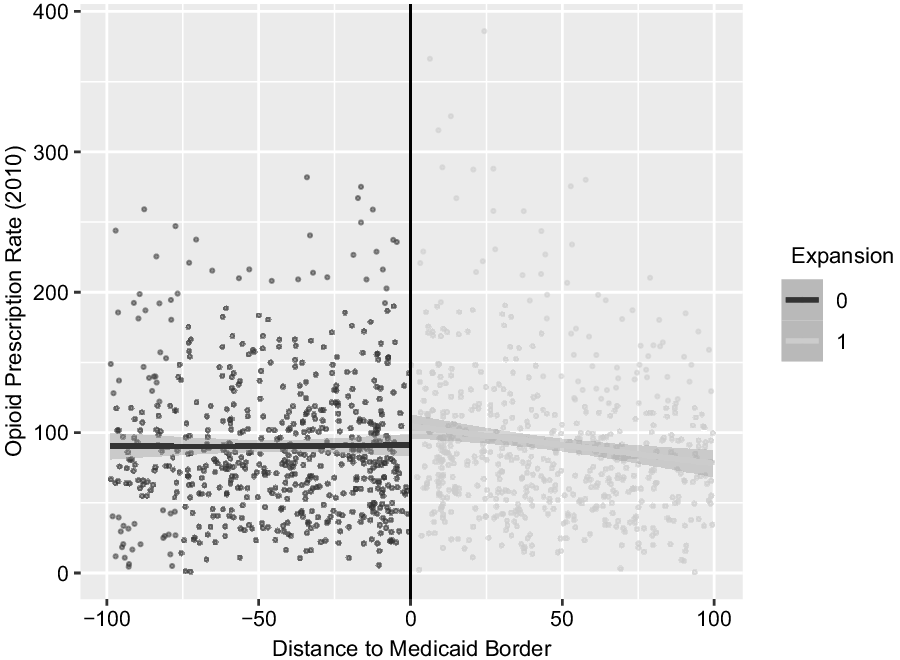
Second, treated and untreated units must serve as good counterfactuals of each other. The classic GRD setup requires that observed levels of the outcome variable be smooth at the discontinuity. That is to say, we should not observe a discontinuity in Democratic voting prior to the treatment. I graphically probe this identification assumption in Figure 7 by plotting the 2008 (pretreatment) Democratic two-party vote shares for counties along Medicaid expansion borders. Figure 7 provides strong evidence that there are no pretreatment political differences between expansion and nonexpansion counties. Moreover, I use change in the Democratic two-party vote share as the dependent variable, and, as a result, these models are akin to using a difference-in-differences design across the discontinuity border. Footnote 20 This difference-in-differences design choice requires that prior to expansion counties in expansion and nonexpansion states experienced similar trends in the outcome variable (Angrist and Pischke, Reference Angrist and Pischke2008). As in Figure 7, Appendix 2 Figure 13 shows that prior to expansion counties in expansion and nonexpansion states also experienced similar trends in their voting behaviour from 2004-2012. Moreover, Figure 8 shows that prior to Medicaid expansion, the treatment and control counties experienced nearly identical opioid epidemic conditions. Footnote 21 As a result, we can be reasonably sure that the GRD models are comparing mostly similar communities on either side of a fixed, policy-relevant geographic border. Following Clinton and Sances (Reference Clinton and Sances2018), I use all observations within 100 miles of a Medicaid expansion border. With these observations, I estimate regressions of the following form:
 $$\matrix{
{{Y_{cs}} = \alpha Expansio{n_{cs}} + \beta OpioidRat{e_c} + \mu (Expansio{n_{cs}} \times OpioidRat{e_c})} \hfill \cr
{\quad \quad + \theta Distanc{e_c} + \eta (Expansio{n_{cs}} \times Distanc{e_c}) + {\gamma _{cs}} + {\varepsilon _c}} \hfill \cr
} $$
$$\matrix{
{{Y_{cs}} = \alpha Expansio{n_{cs}} + \beta OpioidRat{e_c} + \mu (Expansio{n_{cs}} \times OpioidRat{e_c})} \hfill \cr
{\quad \quad + \theta Distanc{e_c} + \eta (Expansio{n_{cs}} \times Distanc{e_c}) + {\gamma _{cs}} + {\varepsilon _c}} \hfill \cr
} $$
Democratic vote (2008).
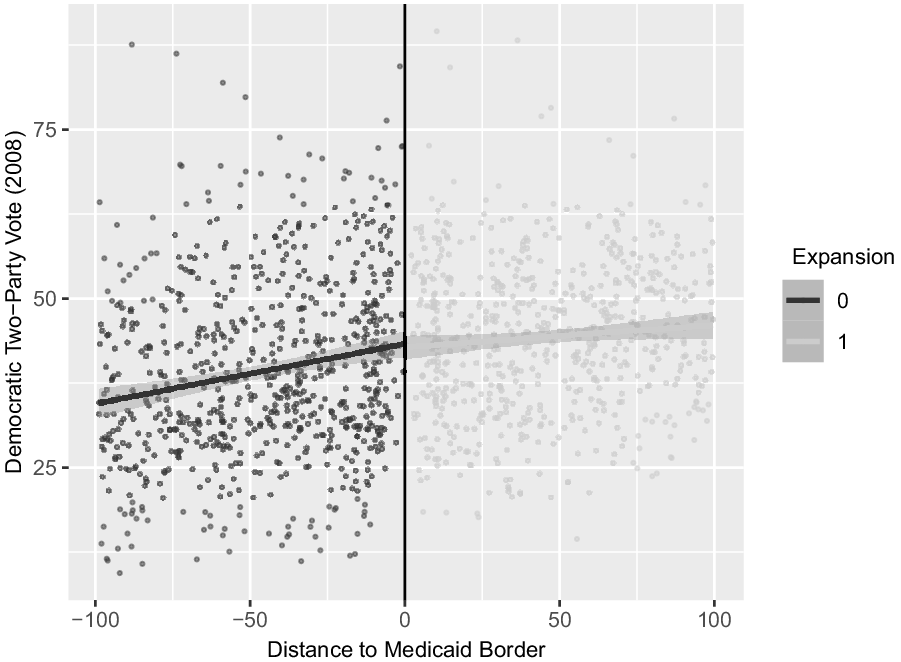
Opioid prescription rate (2010). Note: Figure 7 displays sample county’s pretreatment, 2008 Democratic two-party vote share as a function of the county’s distance to an opposite Medicaid expansion border. Figure 8 shows the same information for the pretreatment 2010 county prescription opioid usage rate. Lighter coloured observations in each are counties in expansion states. Source: Centers for Disease Control; Clinton and Sances (Reference Clinton and Sances2018).
where the outcome variable, ${Y_{cs}}$
, is the shift in the Democratic Party’s share of the two-party vote from 2012 to 2016. The variable,
${Y_{cs}}$
, is the shift in the Democratic Party’s share of the two-party vote from 2012 to 2016. The variable, $\alpha Expansio{n_{cs}}$
, is a state-level indicator for whether the state expanded Medicaid. In the equation,
$\alpha Expansio{n_{cs}}$
, is a state-level indicator for whether the state expanded Medicaid. In the equation, $\beta OpioidRat{e_c}$
represents a county’s opioid prescription usage. Within the empirical models, I use three versions of this measure. First, I rely on an indicator variable for counties that experienced increases in opioid prescription rates from 2014 to 2016.
Footnote 22
I also rely on the 2016 CDC opioid prescription rate and the logged transformed opioid prescription rate for each county. The term,
$\beta OpioidRat{e_c}$
represents a county’s opioid prescription usage. Within the empirical models, I use three versions of this measure. First, I rely on an indicator variable for counties that experienced increases in opioid prescription rates from 2014 to 2016.
Footnote 22
I also rely on the 2016 CDC opioid prescription rate and the logged transformed opioid prescription rate for each county. The term, $\mu (Expansio{n_{sc}} \times OpioidRat{e_c})$
, is the interaction term between a county’s opioid rate and its Medicaid expansion status. This term assesses whether voters in expansion and nonexpansion states reacted to the opioid epidemic differently.
$\mu (Expansio{n_{sc}} \times OpioidRat{e_c})$
, is the interaction term between a county’s opioid rate and its Medicaid expansion status. This term assesses whether voters in expansion and nonexpansion states reacted to the opioid epidemic differently.
Additionally, $\theta Distance$
, the running variable, is the distance (in miles) from the county to the closest state with a different Medicaid expansion status. Following convention (Lee and Lemieux, Reference Lee and Lemieux2010), I allow the slope of the running variable to vary on either side of the border with the interaction term
$\theta Distance$
, the running variable, is the distance (in miles) from the county to the closest state with a different Medicaid expansion status. Following convention (Lee and Lemieux, Reference Lee and Lemieux2010), I allow the slope of the running variable to vary on either side of the border with the interaction term $\eta (Expansio{n_{cs}} \times Distanc{e_c})$
and include a series of polynomial terms of the
$\eta (Expansio{n_{cs}} \times Distanc{e_c})$
and include a series of polynomial terms of the $Distance$
variable interacted with the Expansion indicator, represented in the formula generically by
$Distance$
variable interacted with the Expansion indicator, represented in the formula generically by ${\gamma _{cs}}$
.
Footnote 23
. Finally,
${\gamma _{cs}}$
.
Footnote 23
. Finally, ${\varepsilon _c}$
represents idiosyncratic errors; all models report cluster-robust standard errors. I also include state fixed effects to rule out all time-invariant state-level confounding factors. These fixed effects account for all stable state-level differences in opioid policies (e.g. (Haegerich et al., Reference Haegerich, Paulozzi, Manns and Jones2014; Davis and Carr, Reference Davis and Carr2015; Ali et al., Reference Ali, Dowd, Classen, Mutter and Novak2017; Whitmore et al., Reference Whitmore, White, Buntin, Fry, Calamari and Patrick2019)), pre-existing differences in state health care reforms (e.g.(Gray, Lowery and Benz, Reference Gray, Lowery and Benz2013)) state government partisanship, and any other substantively relevant, time-invariant state-level factors.
Footnote 24
${\varepsilon _c}$
represents idiosyncratic errors; all models report cluster-robust standard errors. I also include state fixed effects to rule out all time-invariant state-level confounding factors. These fixed effects account for all stable state-level differences in opioid policies (e.g. (Haegerich et al., Reference Haegerich, Paulozzi, Manns and Jones2014; Davis and Carr, Reference Davis and Carr2015; Ali et al., Reference Ali, Dowd, Classen, Mutter and Novak2017; Whitmore et al., Reference Whitmore, White, Buntin, Fry, Calamari and Patrick2019)), pre-existing differences in state health care reforms (e.g.(Gray, Lowery and Benz, Reference Gray, Lowery and Benz2013)) state government partisanship, and any other substantively relevant, time-invariant state-level factors.
Footnote 24
Medicaid expansion, the opioid epidemic, and voting behaviour
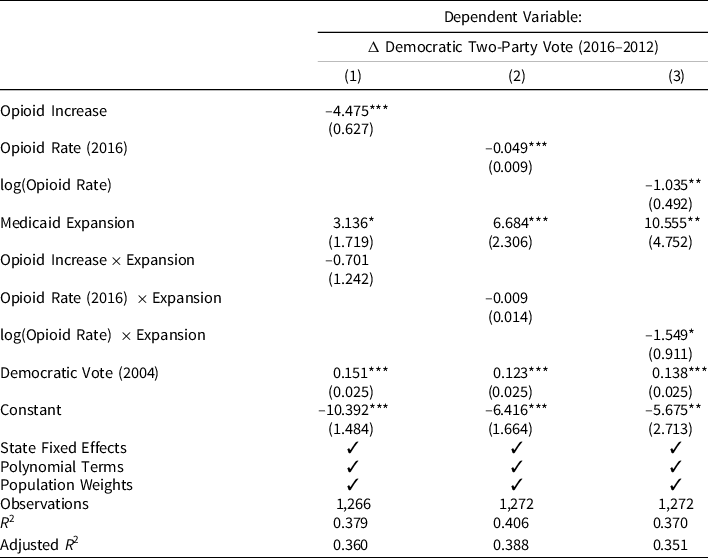
Next, I estimate the effects of Medicaid expansion and the opioid epidemic on presidential voting. To do so, I exploit the GRD model discussed above, where I compare the voting behaviour of counties on either side of Medicaid expansion borders. Recall the aims of the analyses were to assess if counties in Medicaid expansion states increased their Democratic support relative to counties in nonexpansion states (H1) and how the varying severity of the opioid epidemic differentially impacted communities in both types of states (H2, H3a, H3b). Regression results are reported in Table 1. Consistent with canonical policy feedback theories and in support of (H1), we see that in all models Medicaid expansion was positively related to increased Democratic support between 2012 and 2016. The results of the models imply that communities in expansion states experiencing low opioid epidemic severity, shifted their support towards the Democratic Party between 2012 and 2016. However, this relationship was significantly offset and moderated by how severely a county was affected by the opioid epidemic following Medicaid expansion.
Effects of opioid epidemic and Medicaid expansion on voting behaviour
Note:
* p < 0.1;
** p < 0.05;
*** p < 0.01.
Consistent with (H2), the largest increases in vote share for Medicaid expansion states were observed in communities that had the lowest levels of opioid epidemic severity. Conversely, communities in expansion states that were still deeply affected by the opioid epidemic shifted strongly toward the Republican Party and Donald Trump in 2016. In each of the models, the Democratic Party was credited slightly more strongly for opioid epidemic conditions in expansion states relative to nonexpansion ones, though this difference only periodically reaches traditional standards of statistical significance. Footnote 25 . The results of model 3 imply that a one-per cent increase in the severity of the opioid epidemic is associated with a roughly 2.5 percentage point decrease in the Democratic two-party vote from 2012 to 2016 in expansion states – relative to a 1 percentage point decrease in nonexpansion states for a similarly sized shift in opioid usage. Footnote 26
Consistent with (H3b), I find that counties in nonexpansion states that experienced worse opioid epidemic conditions, both in terms of opioid usage increases and worse overall levels of usage, shifted away from the Democratic Party between 2012 and 2016. The results from Model 2 imply that a one-standard deviation increase in the severity of the opioid epidemic (about 42 prescriptions per 100 people) is associated with a 2 percentage point decrease in the Democratic share of the two-party vote between 2012 and 2016. The results from Model 1 show that places that experienced opioid usage increases between 2014 and 2016 in nonexpansion states shifted their support towards the Republican Party by roughly 4.5 percentage points. Footnote 27 This shift in support in nonexpansion communities completely offsets that gains observed in expansion communities that experienced more favourable opioid conditions. More theoretically, the similar direction and size of the opioid effects in expansion and nonexpansion states yields support more in favour of (H3b) over (H3a). Voters experiencing worse opioid conditions voted similarly regardless of their Medicaid expansion experiences. Instead, voters blamed the federal Democratic Party for worse local health conditions, even though state Republicans were more responsible for these local outcomes in nonexpansion states. Footnote 28
Overall, the prior analyses suggest highly conditional policy feedback effects. In Medicaid expansion states, areas with favourable opioid conditions responded by increasing their support for the Democratic Party by a modest amount. However, areas in the same expansion states with above-median levels of opioid epidemic severity shifted strongly towards the Republican Party. In many cases, the positive feedback effects of Medicaid expansion were entirely offset by large penalties associated with the opioid epidemic. I further probe the conditional nature of these effects exploring the extent to which the partisanship of the state government influenced the feedback effects previously observed. Although the prior analyses have held constant many of the idiosyncratic state-level factors via state fixed effects, it possible that states with Republican governors and state legislatures that also chose to expand Medicaid – contra many of their co-partisans – would experience different patterns of policy feedback than observed in the full sample.
To assess this, I subset the original border sample to the 787 counties in expansion and nonexpansion states with Republican(GOP) governors and state legislatures Footnote 29 and replicate the original analyses. Footnote 30 In Figure 9, I provide a graphical depiction of these results. Footnote 31 The figure provides the estimated predicted change in Democratic vote as a function of a two-standard deviation increase in a county’s Medicaid expansion status (this is essentially 1 or the full impact of expanding Medicaid) and in opioid usage for the full (light grey marks, triangle points) and GOP samples (dark grey marks, circle points) separately.
Impact of a two-standard deviation change in variable (full and GOP samples). Note: This figure plots the predicted change in the Democratic two-party vote from 2012 to 2016 as a function of a two-standard deviation increase in the two independent variables (Medicaid expansion, opioid prescription rate) for the full sample of states and the GOP sample. Row 1 plots the predicted change in the outcome variable for opioid prescription rates in the full (light grey, triangle points) and GOP (dark grey, circle points) samples. Row 2 provides the estimates for Medicaid expansion status. The full model results that produced this figure are reported in Appendix A7 Table 17.
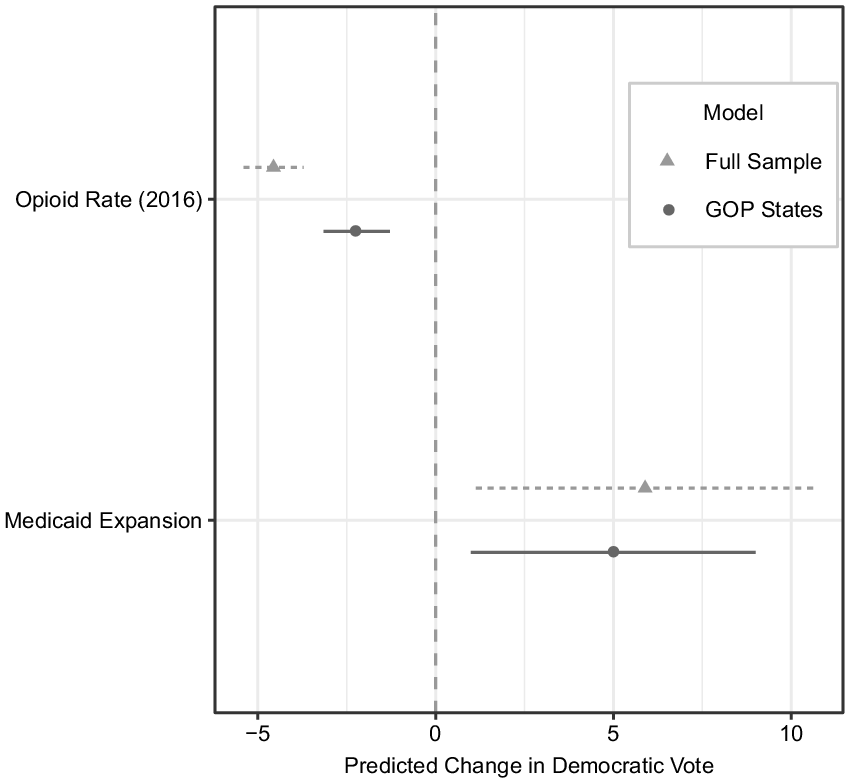
The relationships between the opioid epidemic and Medicaid expansion on change in the Democratic vote are similar across the models. However, consistent with muted effects based on the partisanship of the state government, the estimated effect of Medicaid expansion on change in the Democratic vote is roughly 1 percentage point smaller in the GOP-controlled states than in the full sample, though this difference is not statistically significant. This more modest effect may, however, suggest that it was easier for voters to engage in this type of policy feedback when the partisan control of their state government matched the incumbent president’s party. Interestingly, the effects of the opioid epidemic, although still substantively and statistically significant, are about half as large in magnitude in the GOP-controlled sample as in the full sample, creating subtle differences between expansion states. Voters in expansion states with Republican governors were marginally less likely to credit the federal Democratic Party for positive health policy changes. Additionally, voters in expansion states that had Democratic governors were especially likely to penalise the federal Democratic Party for worsening opioid conditions. These results imply that clearer signals mean larger consequences for politicians.
These analyses reveal that the largest positive policy feedback gains for the Democratic Party were highly concentrated in states with Democratic governors and places with favourable opioid epidemic conditions. States that expanded Medicaid, but were controlled by Republicans, experienced smaller feedback effects. Finally, the Republican Party performed more strongly in nonexpansion states and places where the opioid epidemic was worse. Perversely, these results suggest that the Republican Party performed more strongly in areas where states opted out of Medicaid expansion and where the opioid epidemic was more severe even compared to how their party fared in similar GOP-controlled states that chose to expand Medicaid and experienced more favourable opioid epidemic conditions on average.
Conclusion
The fact that institutions affect voters’ ability to hold politicians accountable for their actions is well established (i.e. Powell and Whitten (1993)). However, less is known about how institutions affect voters’ abilities to engage in policy feedback. Building on work on voter blame attribution errors in federalist systems (Sances, Reference Sances2017), I have argued that federalism provides state-level elites with unique opportunities to undermine or increase support of federal policies. As a result, these state decisions can impact how well voters perceive federal policies are functioning and who voters hold accountable for the conditions of the world around them.
To analyse how this affects policy feedback, I exploited the fact that the ACA included many provisions for fighting the severity of the opioid epidemic. However, states were only able to receive these services if their state government chose to expand Medicaid enrolment. By comparing counties along the borders of expansion states, I gained considerable inferential leverage to explore the impact of state government decisionmaking on changes in the well-being of communities and political behaviour. Using this design, I found evidence that the decision to expand or not expand Medicaid had important effects on the trajectory of the nation’s opioid epidemic, with counties in states that expanded Medicaid experiencing larger declines in opioid usage. These policy effects, as well as the direct impact of the policy, produced differential policy feedback effects. The Democratic Party’s presidential ticket benefited from the state government’s expanding Medicaid. Somewhat perversely, Donald Trump performed better in nonexpansion counties and where the opioid epidemic was worse, even though members of his party were partly responsible for these outcomes.
This work makes a number of scholarly contributions. First, while Michener (Reference Michener2018) finds evidence of federalism-induced variation in participatory feedback, I extend this work by showing that variation in policy experiences made possible by federalism also affects directional policy feedback. Democrats performed modestly more positively in the places that received expanded policy. Republicans, however, benefited from resisting Medicaid expansion and preventing their constituents from expanded eligibility. These results suggest that federalism may play an unappreciated role in hampering down the observed effects of federal policy on politics and policy feedback across the fifty states. Additionally, I show that broader policy effects, not just the policy or personally enrolling in a programme, play important roles in policy feedback. When specific policy effects are made salient, they are likely to be translated into political behaviour. However, these effects are likely to vary depending on personal and local relevance. More research is needed on understanding the effects of news salience on policy feedback. Additionally, more work is needed on the role of broader, more communal policy experiences in policy feedback.
This work also contributes indirectly to debates on political accountability in the states. My work suggests that federalism can shape the direction in which accountability occurs. Voters seemed to hold the federal Democratic Party responsible for worsening local conditions, even when the actions of state-level Republicans were more influential in shaping these conditions. Voters in nonexpansion states blamed the federal Democratic Party for their comparatively worse experiences, despite the more culpable state Republican resistance. In this way, my work builds on Sances (Reference Sances2017) and Rogers (Reference Rogers2017), who document major pathologies in accountability patterns due to federalism. Building on Sances (Reference Sances2017), I show that similar biases emerge when focusing on salient policy issues and policies where voters have the ability to hold the actors who are actually responsible for policy change accountable. Moreover, most previous studies have mostly connected state-level roll call votes or legislative outcomes to poor voter retrospection (i.e. Rogers (Reference Rogers2017)). I show that even when voters are responding retrospectively to the life-changing health conditions immediately around them, they still tend to do so by blaming the president.
This work also contributes to work on the importance of partisan control of state government. There is a growing body of work suggesting that which party controls a state government may not matter much for the objective conditions of citizens’ lives or public policy (Grossman, Reference Grossman2019; Dynes and Holbein, Reference de Benedictis-Kessner and Warshaw2020). While the states themselves may not be able to pass policy that produces sizable differences, their ability to undermine federal policies may have large impacts. Indeed, scholars on administrative burdens argue that this may be the most impactful way that states undermine or limited the impacts of federal policy (Herd and Moynihan, Reference Herd and Moynihan2018). My work demonstrates that the largely partisan decision to expand or not expand Medicaid had large impacts on citizen well-being and that this in turn had important political effects.
More work is needed to better understand how voters at the individual-level connect policy effects or experiences with specific public policies. While I have shown that both the policy (the ACA/Medicaid expansion) and the policy effects (the opioid epidemic) were salient and politically relevant for voters during the 2016 election, I did not demonstrate a psychological connection between opioid experiences and the ACA policy per se. Do voters respond to policy effects with the policy in mind specifically or simply who is in charge of the government when the experience is translated into voting behaviour? Arnold (Reference Arnold1990) argued that politicians rarely know how their policies will affect the lives of voters by election time, but how aware are voters of which policies are responsible for their experiences when they enter the ballot box? Future research is needed to disentangle how much of what looks like specific policy feedback or issue-based political accountability may reflect voters’ more vague understandings of their “policy” experiences rather than direct evaluations of specific public policies.
Supplementary material
To view supplementary material for this article, please visit https://doi.org/10.1017/S0143814X21000192
Data availability statement
Replication data and code are available via Dataverse: https://doi.org/10.7910/DVN/SUPEL1
Acknowledgements
I would like to thank Larry Bartels, Josh Clinton, Kathy Cramer, Cindy Kam, Eunji Kim, Dave Lewis, Mellissa Meisels, Jeff Mondak, Gregory Saxton, John Sides, Hye Young You, and the anonymous reviewers and editor for their helpful comments. I would also like to thank participants of the Vanderbilt American Politics Workshop.
Competing interest declaration
The author(s) declare none.
Funding information
There are no financial commitments to disclose.


 Open access