





1. Introduction
Coffee is a cultivar that grows well in the varied eco-physiological conditions of tropical and subtropical highlands and can be grown on agricultural land. After crude oil, it is the most consumed beverage and the second most traded commodity worldwide [Reference Sujaritpong, Yoo-Kong and Bhadola45]. Although it is the main source of income for tropical countries, which are often less developed, wealthy countries are the ones that consume it the most [Reference Garedew, Lemessa and Pinard23]. The growth of weeds, pests and diseases have all hampered coffee output. For example, the coffee berry disease (CBD) caused by Colletotrichum kahawae substantially hinders the production of Arabica coffee in African countries [Reference Vieira, Silva, Várzea, Paulo and Batista51]. It is a pathogenic fungus that affects plants [Reference Batista, Silva and Vieira9, Reference Mouen Bedimo, Bieysse, Nyassé, Notteghem and Cilas32]. Black depressed wounds on coffee berries are one of the signs of CBD [Reference Gaitán, Cristancho, Caicedo, Rivillas and Gómez22]. All phases of fruit and flower development are affected by the disease, but immature berries are especially vulnerable during the 4–16 weeks expanding phase following flowering [Reference Silva, Nicole, Rijo, Geiger and Rodrigues41].
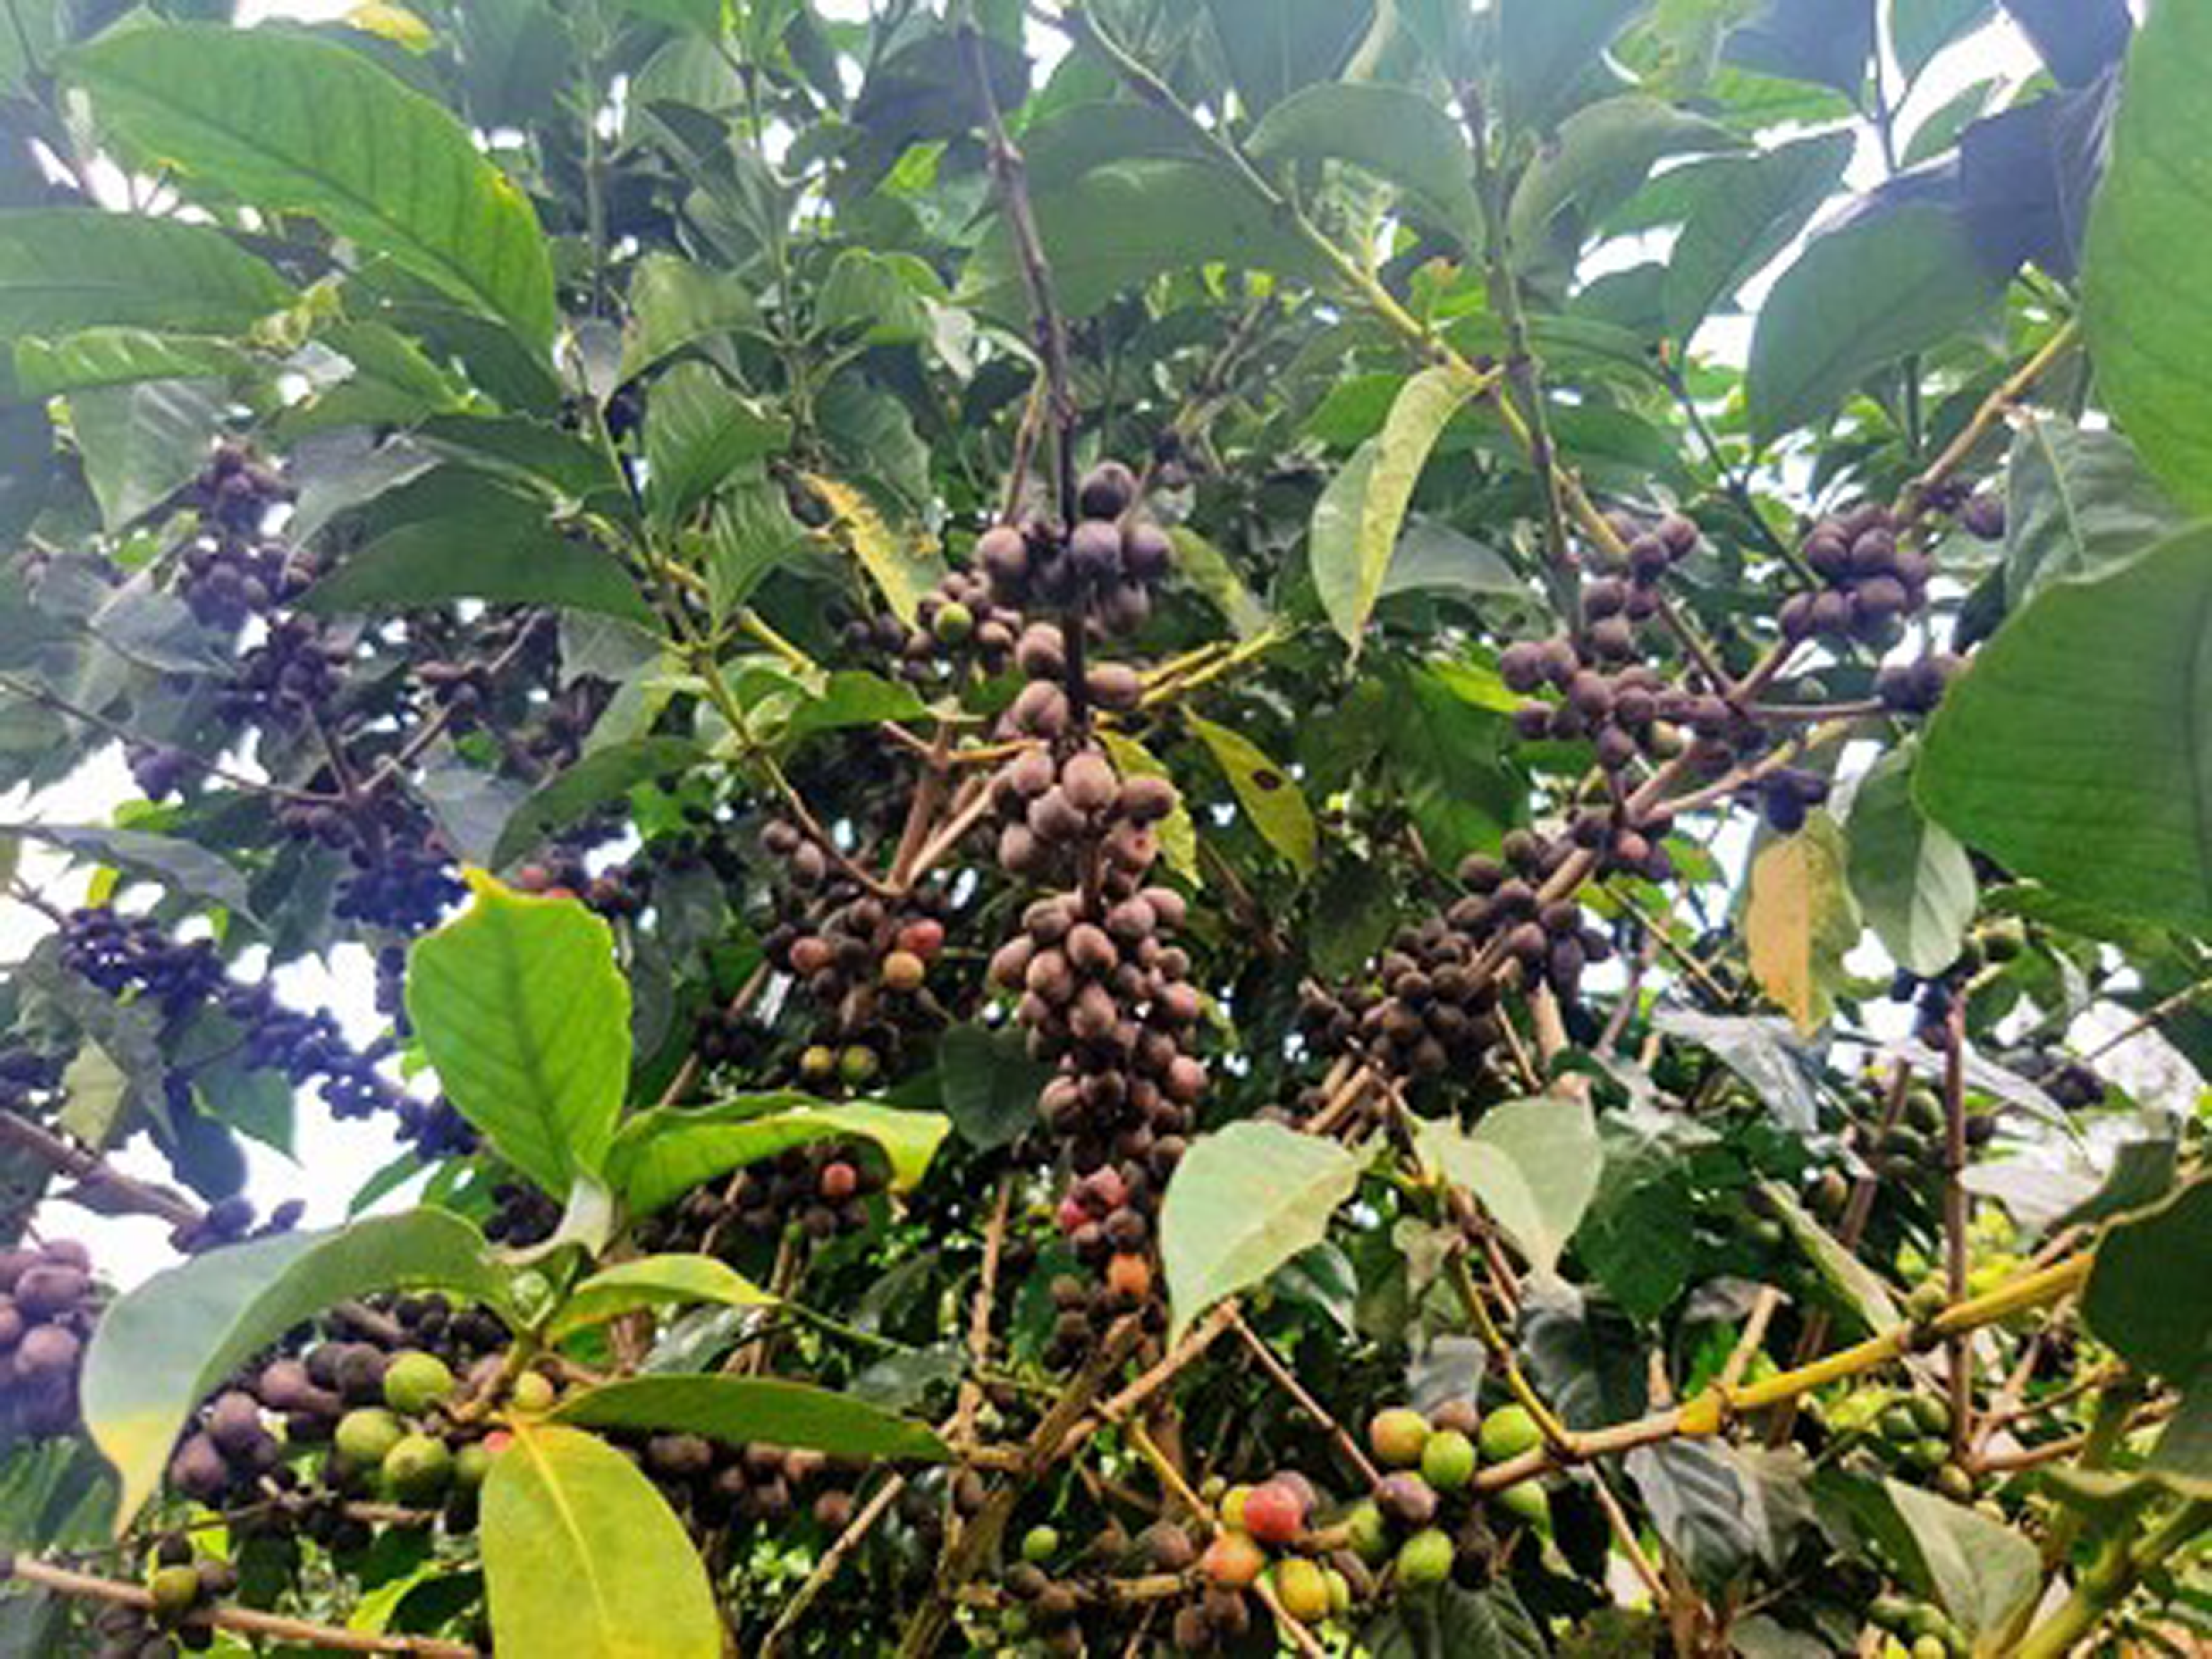
The quality and yield of coffee berries are both affected by this disease. In this regard, Ethiopia, Kenya and Cameroon each decrease in up to 29, 9, 75 and 60% of their annual output, respectively. In regions with high levels of precipitation, humidity and altitude, losses could reach 100% [Reference Garedew, Lemessa and Pinard23, Reference Alemu, Adugna, Lemessa and Muleta3]. Biological control, pharmacological treatments, cultural customs, the adoption of resistant cultivars and other approaches are some of the various ways that CBD can be managed [Reference Girma and Chala24]. By way of the wind and rain, CBD is dispersed locally between branches and coffee trees [Reference GRIFFITHS, Gibbs and Waller26] (see Figure 1). However, insects, birds and coffee harvesters are frequently used vectors for long- and medium-distance CBD dispersal [Reference Fotsa, Houpa, Bekolle, Thron and Ndoumbe19]. Healthy coffee berries, after coming into touch with a fungal disease from the environment or coffee berries that have already been infected with CBD, were responsible for the spread of the disease.
Infected coffee berries with coffee berry disease (CBD).
The dynamics of plant disease have been studied by different authors ([Reference Shi, Ishtiaq, Din and Akram40–Reference Wang, Xiang and Chen52]). For instance, Fotsa et al. [Reference Cunniffe and Gilligan15] introduction of mathematical modelling and best management of the anthracnose disease is a good example. Plant pathogen epidemiological models were examined by Cunniffe and Gilligan [Reference Fotso Fotso, Touzeau, Tsanou, Bowong and Grognard21]. Foltso et al. [Reference Abraha, Basir, Obsu and Torres2] presented and analysed a mathematical model of the coffee berry borer with optimal control strategies. The results were demonstrated using a class of models that had been subjected to plant disease experimentation. Following that, an impulse control approach that corresponds to cultivation methods was included in this study, making it more broadly applicable [Reference Mbogne and Thron30]. An important factor in the control of pests is farmer awareness, as demonstrated by [Reference Abraha, Basir, Obsu and Torres2].
Coffee wilt disease, coffee leaf rust and CBD are the three most dangerous coffee diseases that Ethiopia faces as a threat to its coffee production. The development and analysis of a nonlinear deterministic mathematical model for CBD transmission dynamics in a coffee farm was done by [Reference Melese, Makinde and Obsu31]. It was looked into how fungus pathogens interacted with disease vectors and coffee plants. Additionally, authors [Reference Nyaberi, Mutuku, Malonza and Gachigua33] developed a mathematical model of CBD dynamics. They determined the fundamental reproduction number ( $R_{0}$
), computed the equilibrium points of the system model and showed that the CBD ends when
$R_{0}$
), computed the equilibrium points of the system model and showed that the CBD ends when $R_{0}\lt 1$
. Moreover, they have shown that if
$R_{0}\lt 1$
. Moreover, they have shown that if $R_{0}\gt 1$
, CBD remains in the population of coffee plants. The numerical simulation’s results agree with the stability analysis’s theoretical conclusions.
$R_{0}\gt 1$
, CBD remains in the population of coffee plants. The numerical simulation’s results agree with the stability analysis’s theoretical conclusions.
Fractional calculus has been investigated by numerous authors as having the potential to take the memory effect into account [Reference Paul, Mahata, Mukherjee, Mahato, Salimi and Roy38–Reference Atangana and Araz6]. Based on data from the past and the present, this memory makes predictions. Compared to integer derivatives, this sets it apart. In order to handle issues in fractional calculus, which has numerous real-world applications, significant analytical and numerical approaches have been developed [Reference Singh42–Reference Paul, Mahata and Mukherjee37] and [Reference Balatif, Boujallal, Labzai and Rachik8]. For investigating the impact of the memory effect on epidemiological models and generating more accurate results, fractional calculus is essential. Because fractional calculus was used so frequently, it was impossible to accurately depict a variety of inherited materials and memory processes in the framework of mathematical modelling [Reference Bushnaq, Shah and Alrabaiah12]. Due to their special characteristics, fractional differential equations (FDE) provide a number of advantages over integer-order differential equations (IDEs) when it comes to simulating difficult real-world problems. Unlike IDEs, which are based locally, FDEs are composed of memory effects, which contribute to their increased efficiency.
In a sense, it is more flexible than classical calculus because of its hereditary characteristics and the way memory is described [Reference Jan, Khan, Kumam and Thounthong27]. The Caputo fractional derivative (CFD), Caputo–Fabrizio derivative, Atangana–Baleanu fractional derivative and many others are introduced in this tool for use in modelling. The various kernels available for fractional derivatives, which can be selected to meet the needs of various applications, are the fundamental differences between them. The key distinction between the CFD [Reference Diethelm17], Caputo–Fabrizio derivative [Reference Caputo and Fabrizio13] and Atangana–Baleanu fractional derivative [Reference Atangana4] is that the Caputo derivative is defined by a power law, the Caputo–Fabrizio derivative by an exponential decay law and the Atangana–Baleanu derivative by a Mittag-Leffler law. In fractional derivatives, several studies have recently been developed. One of the best operators is the Atangana–Baleanu–Caputo (ABC) operator [Reference Bonyah, Atangana and Chand10]. An expanded Mittag-Leffler function with a non-singular and non-local kernel serves as the foundation for this operator.
Nevertheless, no previous research has used a fractional order to predict the kinetics of CBD transmission. In this study, we will incorporate the non-singular kernel of the Atangana–Baleanu fractional derivative to build a new model for the analysis of CBD [Reference Atangana and Baleanu7]. This unique fractional operator is considered since it does not suffer from the singularity that arises from using other fractional derivatives. When simulating biological and physical processes, the Atangana–Baleanu fractional derivative is the most popular method since it does not involve the singularity associated with non-singular and non-local kernels [Reference Atangana and Baleanu7]. Furthermore, equilibria based on the value of the fundamental reproduction number ( $R_{0}$
) are studied with respect to their local and global asymptotic stability. The remaining sections of the paper are organised as follows: Some initial ideas and the model’s formulation are covered in parts two and three, respectively. In parts four and five, respectively, the equilibrium points and stability analysis of CBD are established. Additionally, in parts six and seven, respectively, the numerical solution and numerical simulation of the model are examined. Part eight concludes with some final thoughts.
$R_{0}$
) are studied with respect to their local and global asymptotic stability. The remaining sections of the paper are organised as follows: Some initial ideas and the model’s formulation are covered in parts two and three, respectively. In parts four and five, respectively, the equilibrium points and stability analysis of CBD are established. Additionally, in parts six and seven, respectively, the numerical solution and numerical simulation of the model are examined. Part eight concludes with some final thoughts.
2. Preliminaries
Now let’s begin by reviewing the fundamental definitions of Atangana–Baleanu fractional operators.
Definition 1. Let $f \in C^{1}(\alpha, \beta ), \alpha \lt \beta$
, be a function, and let
$f \in C^{1}(\alpha, \beta ), \alpha \lt \beta$
, be a function, and let $\sigma \in [0, 1]$
. The ABC fractional derivative of order
$\sigma \in [0, 1]$
. The ABC fractional derivative of order $\sigma$
is given by [Reference Singh43–Reference Sujaritpong, Yoo-Kong and Bhadola45]
$\sigma$
is given by [Reference Singh43–Reference Sujaritpong, Yoo-Kong and Bhadola45]
 \begin{align} ^{ABC}_{\alpha }D_{t}^{\sigma }f(t)=\frac{G(\sigma )}{1-\sigma }\int _{\alpha }^{t}\frac{df}{dn}E_{\sigma }\left [{-}\frac{\sigma }{1-\sigma }(t-n)^{\sigma }\right ]dn, \end{align}
where $G(\sigma )$
is the normalisation function given by
$G(\sigma )$
is the normalisation function given by $G(\sigma )=1-\sigma +\frac{\sigma }{\Gamma (\sigma )}$
, characterised by
$G(\sigma )=1-\sigma +\frac{\sigma }{\Gamma (\sigma )}$
, characterised by $G(0) = G(1) = 1$
, and the Mittag-Leffler function
$G(0) = G(1) = 1$
, and the Mittag-Leffler function $E_{\sigma }(z)$
with
$E_{\sigma }(z)$
with $\mathbb{C}$
the set of the complex number is given by
$\mathbb{C}$
the set of the complex number is given by
 \begin{align} E_{\sigma }(z)=\sum _{b=0}^{\infty }\frac{z^{b}}{\Gamma (1+\sigma b)}, \sigma, b \in \mathbb{C}, \mathbb{R}(\sigma )\gt 0. \end{align}
Definition 2. The ABC fractional integral of the function $f \in C^{1}(\alpha, \beta )$
is given by [Reference Singh, Srivastava, Hammouch and Nisar44, Reference Sujaritpong, Yoo-Kong and Bhadola45]
$f \in C^{1}(\alpha, \beta )$
is given by [Reference Singh, Srivastava, Hammouch and Nisar44, Reference Sujaritpong, Yoo-Kong and Bhadola45]
 \begin{align} ^{AB}_{\alpha }I_{t}^{\sigma }f(t)=\frac{1-\sigma }{G(\sigma )}f(t)+\frac{\sigma }{G(\sigma )\Gamma (\sigma )}\int _{\alpha }^{t}f(n)(t-n)^{\sigma -1}dn. \end{align}
Lemma 1. [Reference Sweilam, Al-Mekhlafi and Baleanu46]: The ABC fractional derivative and ABC fractional integral of the function $f \in C^{1}(\alpha, \beta )$
satisfies the Newton–Leibniz equality
$f \in C^{1}(\alpha, \beta )$
satisfies the Newton–Leibniz equality
 \begin{equation*} ^{AB}_{\alpha }I_{t}^{\sigma }\left (^{ABC}_{\alpha }D_{t}^{\sigma }f(t)\right )=f(t)-f(\alpha ) . \end{equation*}
Lemma 2. [Reference Teklu47]: Assume that for $0\lt \sigma \leq 1, f(t)\in C(\alpha, \beta )$
. If
$0\lt \sigma \leq 1, f(t)\in C(\alpha, \beta )$
. If $ ^{ABC}_{t_{0}}D_{t}^{\sigma }f(t)\geq 0\left (^{ABC}_{t_{0}}D_{t}^{\sigma }f(t)\leq 0\right ), t\in (a,b)$
, then
$ ^{ABC}_{t_{0}}D_{t}^{\sigma }f(t)\geq 0\left (^{ABC}_{t_{0}}D_{t}^{\sigma }f(t)\leq 0\right ), t\in (a,b)$
, then $f(t)$
is a increasing (decreasing) function for
$f(t)$
is a increasing (decreasing) function for $t\in [a,b]$
.
$t\in [a,b]$
.
Lemma 3. [Reference Tilahun, Wolle and Tofik48]: For two functions $f,g \in \mathbb{K}^{1}(\alpha, \beta ), \alpha \lt \beta$
, the AB fractional derivative satisfies the following inequality:
$f,g \in \mathbb{K}^{1}(\alpha, \beta ), \alpha \lt \beta$
, the AB fractional derivative satisfies the following inequality:
 \begin{equation*} \Vert ^{ABC}_{\alpha }D_{t}^{\sigma }f(t)-^{ABC}_{\alpha }D_{t}^{\sigma }g(t) \Vert \leq \mathbb {K}\Vert \,f(t)-g(t) \Vert . \end{equation*}
Lemma 4. (Generalised mean value theorem, [Reference Toufik and Atangana49]): Let $f(x) \in C[\alpha, \beta ]$
, and let
$f(x) \in C[\alpha, \beta ]$
, and let $^{ABC}_{0} D^{\sigma }_{t} f(x) \in C[\alpha, \beta ]$
when
$^{ABC}_{0} D^{\sigma }_{t} f(x) \in C[\alpha, \beta ]$
when $0 \lt \sigma \leq 1$
. Then we have
$0 \lt \sigma \leq 1$
. Then we have $f(x) = f(\alpha ) +\frac{1}{\Gamma (\sigma )}$ $^{ABC}_{0}D^{\sigma }_{t} f(\phi )(x-\phi )^{n}$
, when
$^{ABC}_{0}D^{\sigma }_{t} f(\phi )(x-\phi )^{n}$
, when $0 \leq \phi \leq x,\forall x \in (\alpha, \beta ]$
. Note that by Lemma3, if
$0 \leq \phi \leq x,\forall x \in (\alpha, \beta ]$
. Note that by Lemma3, if $f(x) \in [0, \beta ],\hspace{0.05cm} ^{ABC}_{0} D^{\sigma }_{t} f(x) \in C[0, \beta ]$
and
$f(x) \in [0, \beta ],\hspace{0.05cm} ^{ABC}_{0} D^{\sigma }_{t} f(x) \in C[0, \beta ]$
and $^{ABC}_{0} D^{\sigma }_{t} f(x) \geq 0, \forall x \in (0, \beta ]$
when
$^{ABC}_{0} D^{\sigma }_{t} f(x) \geq 0, \forall x \in (0, \beta ]$
when $0 \leq \sigma \leq 1$
, then the function
$0 \leq \sigma \leq 1$
, then the function $f(x)$
is non-decreasing, and if
$f(x)$
is non-decreasing, and if $^{ABC}_{0} D^{\sigma }_{t} f(x) \leq 0, \forall x \in (0, \beta ]$
, then the function g(x) is non-increasing
$^{ABC}_{0} D^{\sigma }_{t} f(x) \leq 0, \forall x \in (0, \beta ]$
, then the function g(x) is non-increasing $\forall x \in (0, \beta ]$
.
$\forall x \in (0, \beta ]$
.
Then, next, we will proceed to the formulation of the model.
3. Formulation of the model
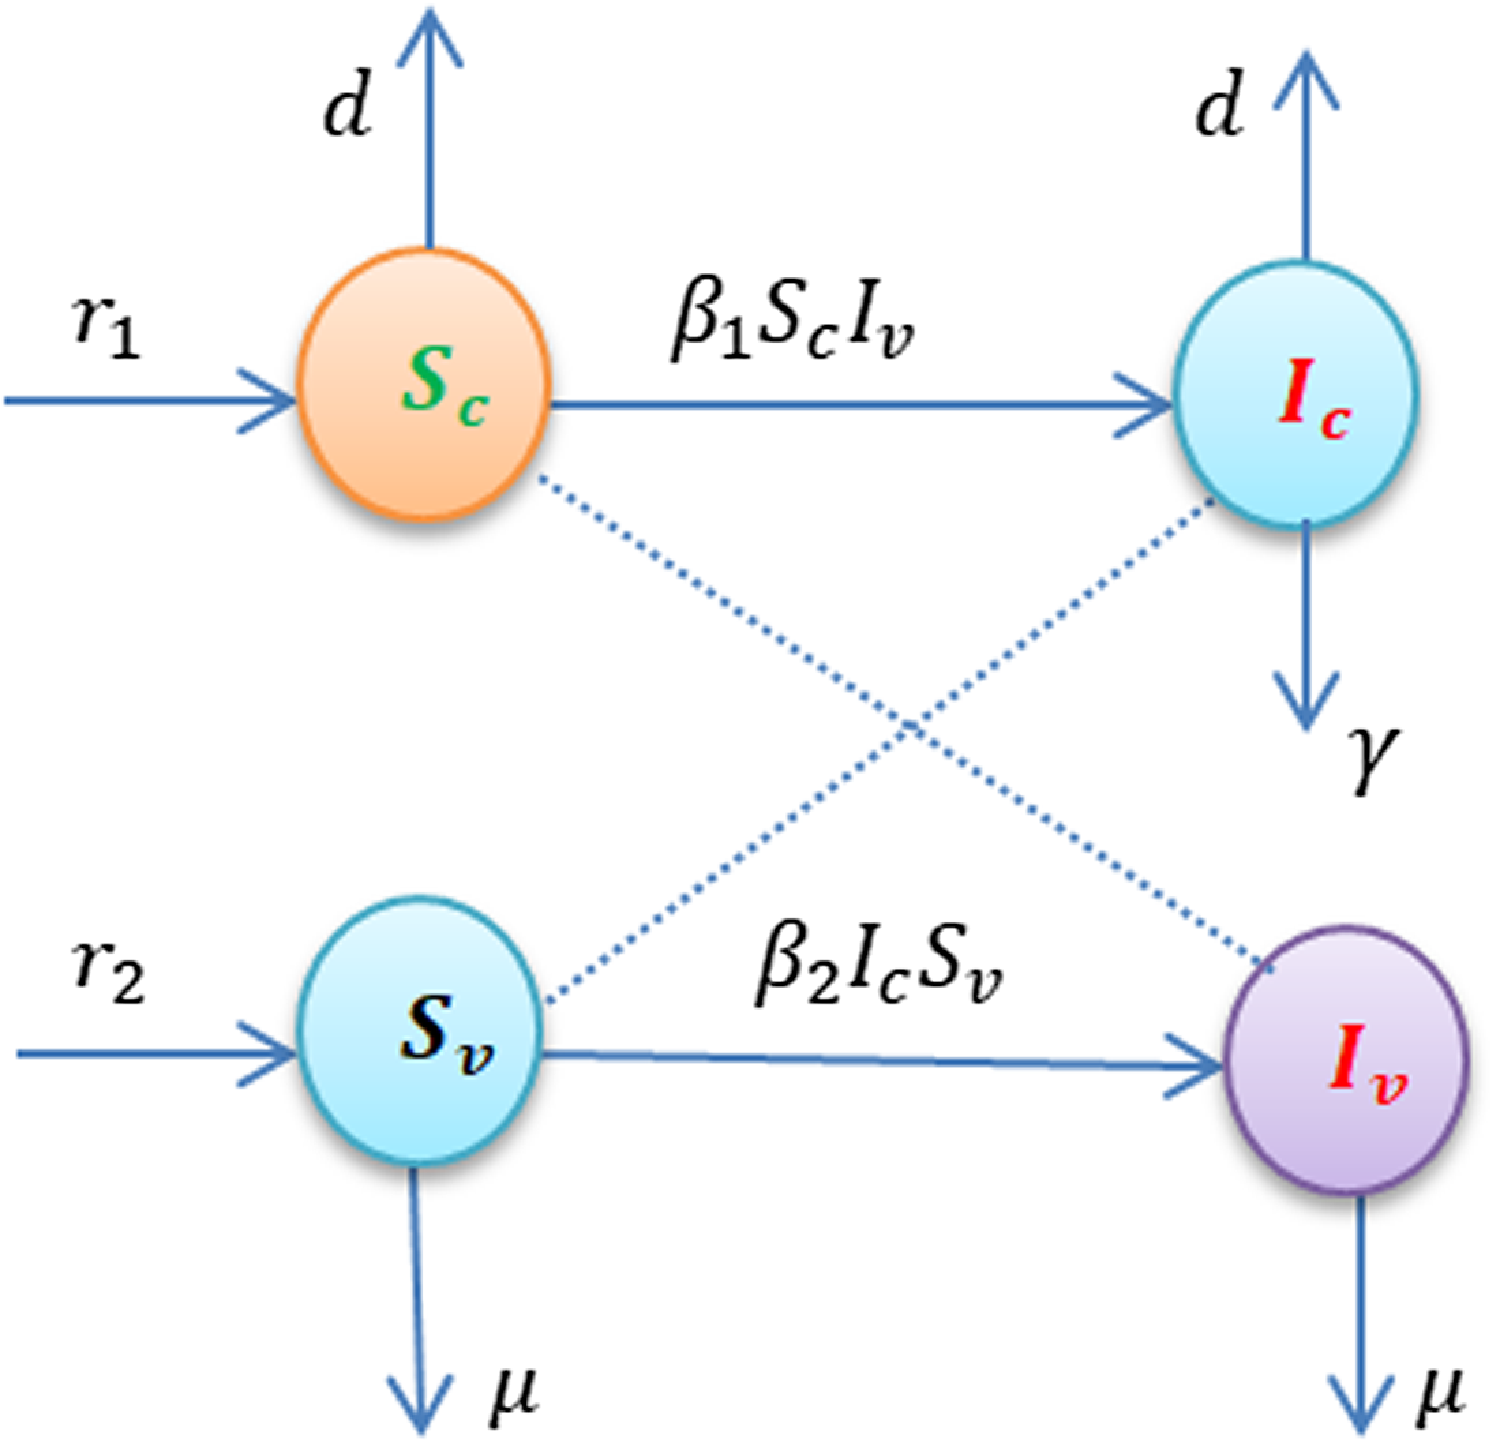
In this work, we partitioned the CBD model into coffee berry and vector populations. There are susceptible and infected coffee berry subcategories in the total coffee berry population ( $N_{c}(t))$
. Susceptible coffee berry is denoted by
$N_{c}(t))$
. Susceptible coffee berry is denoted by $S_{c}$
, and infected coffee berry is denoted by
$S_{c}$
, and infected coffee berry is denoted by $I_{c}$
. This is defined as
$I_{c}$
. This is defined as $N_{c}(t)=S_{c}+I_{c}$
. There are susceptible and infected subclasses in the total vector population
$N_{c}(t)=S_{c}+I_{c}$
. There are susceptible and infected subclasses in the total vector population $(N_{v}(t))$
. The susceptible vector is represented by
$(N_{v}(t))$
. The susceptible vector is represented by $S_{v}$
, and the infected vector is represented by
$S_{v}$
, and the infected vector is represented by $I_{v}$
. This is defined as
$I_{v}$
. This is defined as $N_{v}(t)=S_{v}+I_{v}$
. The model took into account the recruitment rate of susceptible vectors
$N_{v}(t)=S_{v}+I_{v}$
. The model took into account the recruitment rate of susceptible vectors $r_{2}$
and the shift to infected vectors
$r_{2}$
and the shift to infected vectors $(I_{v})$
with
$(I_{v})$
with $\beta _{2}$
rate after eating ill plants or coffee berry. The susceptible coffee berry
$\beta _{2}$
rate after eating ill plants or coffee berry. The susceptible coffee berry $(S_{c})$
is also replanted at a rate of
$(S_{c})$
is also replanted at a rate of $r r_{1}$
, and the diseases spread to coffee berry, and when infected vectors
$r r_{1}$
, and the diseases spread to coffee berry, and when infected vectors $(Y_{v})$
eat susceptible cotton
$(Y_{v})$
eat susceptible cotton $(S_{c})$
, the diseases propagate to coffee berry at a rate of
$(S_{c})$
, the diseases propagate to coffee berry at a rate of $\beta _{1}$
. Coffee berry, once infected, never recovers and produces no or extremely low yields. To regulate the illness, the parameter
$\beta _{1}$
. Coffee berry, once infected, never recovers and produces no or extremely low yields. To regulate the illness, the parameter $\gamma$
is the induced death rate and is the elimination rate of infected coffee berry from uninfected coffee berry. Furthermore,
$\gamma$
is the induced death rate and is the elimination rate of infected coffee berry from uninfected coffee berry. Furthermore, $d$
and
$d$
and $\mu$
are the natural death rates of coffee berry and vector population, respectively.
$\mu$
are the natural death rates of coffee berry and vector population, respectively.
The following governing equations are given based on the model’s assumptions and flow chart in Figure 2:
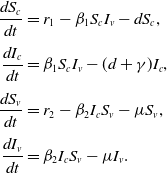 \begin{align} \frac{dS_{c}}{dt}&=r_{1}-\beta _{1}S_{c}I_{v} - dS_{c}, \nonumber \\[3pt] \frac{dI_{c}}{dt}&=\beta _{1}S_{c}I_{v} - (d+\gamma )I_{c}, \nonumber \\[3pt] \frac{dS_{v}}{dt}&=r_{2}-\beta _{2}I_{c}S_{v} - \mu S_{v},\nonumber \\[3pt] \frac{dI_{v}}{dt}&=\beta _{2}I_{c}S_{v}-\mu I_{v}. \end{align}
Flow chart of the model.
Now, replacing the $\frac{d}{dt}$
in the system (4) with
$\frac{d}{dt}$
in the system (4) with $^{ABC}_{0}D_{t}^{\sigma }$
, we obtain the AB derivative that is described by the system of differential equations given in equation (5).
$^{ABC}_{0}D_{t}^{\sigma }$
, we obtain the AB derivative that is described by the system of differential equations given in equation (5).
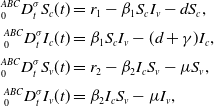 \begin{align} ^{ABC}_{0}D_{t}^{\sigma }S_{c}(t)&= r_{1}-\beta _{1}S_{c}I_{v} - dS_{c}, \nonumber \\[3pt] ^{ABC}_{0}D_{t}^{\sigma }I_{c}(t)&=\beta _{1}S_{c}I_{v} - (d+\gamma )I_{c}, \nonumber \\[3pt] ^{ABC}_{0}D_{t}^{\sigma }S_{v}(t)&=r_{2}-\beta _{2}I_{c}S_{v} - \mu S_{v},\nonumber \\[3pt] ^{ABC}_{0}D_{t}^{\sigma }I_{v}(t)&=\beta _{2}I_{c}S_{v}-\mu I_{v}, \end{align}
with initial conditions
 \begin{align} S_{c}(0) \gt 0, I_{c}(0) \geq 0, S_{v}(0) \geq 0,I_{v}(0) \geq 0. \end{align}
3.1. Existence and uniqueness of solutions
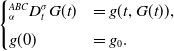
In this subsection, we shall apply some basic results from fixed point theory to the model (1), in order to establish the existence and uniqueness of the solution. The model (1) is rewritten in the following form:
 \begin{align} \begin{cases} ^{ABC}_{\alpha }D_{t}^{\sigma }G(t) & =g(t, G(t)), \\[3pt] g(0) & =g_{0}. \end{cases} \end{align}
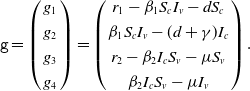
where the vector $g=(S_{c}, I_{c},S_{v}, I_{v})$
represents the compartments of the model and
$g=(S_{c}, I_{c},S_{v}, I_{v})$
represents the compartments of the model and $g$
denotes a continuous vector defined as follows:
$g$
denotes a continuous vector defined as follows:
 \begin{align} \texttt{g} = \left ( \begin{array}{c} g_{1}\\[3pt] g_{2}\\[3pt] g_{3}\\[3pt] g_{4} \end{array} \right ) = \left ( \begin{array}{c} r_{1}-\beta _{1}S_{c}I_{v} - dS_{c}\\[3pt] \beta _{1}S_{c}I_{v} - (d+\gamma )I_{c}\\[3pt] r_{2}-\beta _{2}I_{c}S_{v} - \mu S_{v}\\[3pt] \beta _{2}I_{c}S_{v}-\mu I_{v} \end{array} \right ). \end{align}
The initial condition of the variables of the model is denoted by $g(0)=(S_{c}(0), I_{c}(0), S_{v}(0),I_{v}(0))$
. Furthermore,
$g(0)=(S_{c}(0), I_{c}(0), S_{v}(0),I_{v}(0))$
. Furthermore, $G$
satisfies the Lipschitz condition as given by Lemma3:
$G$
satisfies the Lipschitz condition as given by Lemma3:
 \begin{align} \Vert g(t,g_{1}(t)) -g(t,g_{2}(t))\Vert \leq K\Vert g_{1}(t)- g_{2}(t) \Vert . \end{align}
The existence of the solution for model equation (5) is investigated in the following theorem:
Theorem 1.
There exists a unique solution in $C^{1}([0, T])$
to the initial value problem
$C^{1}([0, T])$
to the initial value problem $t\in [0, T]$
given that equation (
9
) and
$t\in [0, T]$
given that equation (
9
) and
 \begin{align} \left (\frac{(1-\sigma )K}{G(\sigma )}+\frac{\sigma K}{G(\sigma )\Gamma (\sigma +1)}T_{\max }^{\sigma }\right )\lt 1. \end{align}
are satisfied.
Proof. Applying ABC fractional integral on both sides of equation (18), we obtain
 \begin{align} g(t)=g_{0}+\frac{1-\sigma }{G(\sigma )}g(t,g(t))+\frac{\sigma }{G(\sigma )\Gamma (\sigma )}\int _{0}^{t}(t-\tau )^{\sigma -1}g(t,g(t))d\tau . \end{align}
Let $M=(0, K)$
. Then, define the operator
$M=(0, K)$
. Then, define the operator $\mathcal{F}\,:\,C(M,\mathbb{R}^{4})\rightarrow C(M,\mathbb{R}^{4})$
by
$\mathcal{F}\,:\,C(M,\mathbb{R}^{4})\rightarrow C(M,\mathbb{R}^{4})$
by
 \begin{align} \mathcal{F}[g(t)]=g_{0}+\frac{1-\sigma }{G(\sigma )}g(t,g(t))+\frac{\sigma }{G(\sigma )\Gamma (\sigma )}\int _{0}^{t}(t-\tau )^{\sigma -1}g(t,g(t))d\tau . \end{align}
It implies that $g(t)=\mathcal{F}[g(t)]$
. The supremum norm on
$g(t)=\mathcal{F}[g(t)]$
. The supremum norm on $M.\Vert .\Vert _{M}$
is given by
$M.\Vert .\Vert _{M}$
is given by
 \begin{align} \Vert g(t)\Vert _{M}=^{\sup }_{t\in M}\Vert g(t)\Vert, g(t)\in C. \end{align}
Clearly, $C(M,\mathbb{R}^{4})$
equipped with
$C(M,\mathbb{R}^{4})$
equipped with $\Vert .\Vert _{M}$
is a Banach space. Also, the following inequality holds
$\Vert .\Vert _{M}$
is a Banach space. Also, the following inequality holds
 \begin{align} \Vert \int _{0}^{t}B(t,\tau )g(\tau )d\tau \Vert \leq \Vert B(t,\tau )\Vert _{M}\Vert g(t)\Vert _{M}, \end{align}
with $g(t)\in C(M,\mathbb{R}^{4}), B(t,\tau )\in C(M^{2},\mathbb{R})$
such that
$g(t)\in C(M,\mathbb{R}^{4}), B(t,\tau )\in C(M^{2},\mathbb{R})$
such that $|B(t,\tau )|_{M}=^{\sup }_{t, \tau \in M}|B(t,\tau )|$
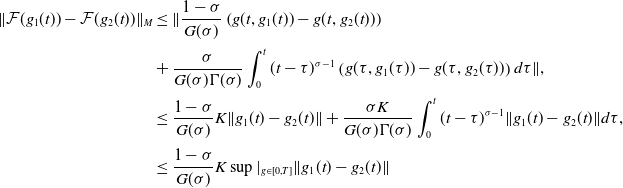
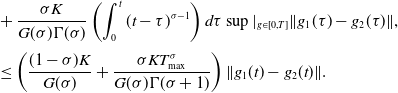
. By applying equation (9), we have that
$|B(t,\tau )|_{M}=^{\sup }_{t, \tau \in M}|B(t,\tau )|$
. By applying equation (9), we have that
 \begin{align} \Vert \mathcal{F}(g_{1}(t)) -\mathcal{F}(g_{2}(t))\Vert _{M}&\leq \Vert \frac{1-\sigma }{G(\sigma )}\left (g(t,g_{1}(t))-g(t,g_{2}(t))\right )\nonumber \\[3pt] &+\frac{\sigma }{G(\sigma )\Gamma (\sigma )}\int _{0}^{t}(t-\tau )^{\sigma -1}\left (g(\tau, g_{1}(\tau ))-g(\tau, g_{2}(\tau ))\right )d\tau \Vert, \nonumber \\[3pt] &\leq \frac{1-\sigma }{G(\sigma )}K\Vert g_{1}(t)-g_{2}(t) \Vert + \frac{\sigma K}{G(\sigma )\Gamma (\sigma )}\int _{0}^{t}(t-\tau )^{\sigma -1}\Vert g_{1}(t)-g_{2}(t) \Vert d\tau, \nonumber \\[3pt] &\leq \frac{1-\sigma }{G(\sigma )}K \sup |_{g\in [0, T]}\Vert g_{1}(t)-g_{2}(t) \Vert \\[-10pt] \nonumber \end{align}
 \begin{align} &+\frac{\sigma K}{G(\sigma )\Gamma (\sigma )}\left (\int _{0}^{t}(t-\tau )^{\sigma -1}\right )d\tau \sup |_{g\in [0, T]}\Vert g_{1}(\tau )-g_{2}(\tau ) \Vert, \nonumber \\[3pt] & \leq \left (\frac{(1-\sigma )K}{G(\sigma )}+\frac{\sigma K T_{\max }^{\sigma }}{G(\sigma )\Gamma (\sigma +1)}\right )\Vert g_{1}(t)-g_{2}(t) \Vert . \\[14pt] \nonumber\end{align}
Consequently, if the condition in equation (10) is satisfied, then $\Vert \mathcal{F}([g_{1}(t)]) - \mathcal{F}([g_{2}(t)]) \Vert \lt \Vert g_{1}(t)-g_{2}(t) \Vert$
and the operator
$\Vert \mathcal{F}([g_{1}(t)]) - \mathcal{F}([g_{2}(t)]) \Vert \lt \Vert g_{1}(t)-g_{2}(t) \Vert$
and the operator $\mathcal{F}$
become a contraction. Hence,
$\mathcal{F}$
become a contraction. Hence, $\mathcal{F}$
has a unique fixed point, which is a solution to the initial value problem in (18) and thus a solution to the system of equation (5).
$\mathcal{F}$
has a unique fixed point, which is a solution to the initial value problem in (18) and thus a solution to the system of equation (5).
Theorem 2.
For the initial condition given in (
6
), the solution of the system of equation (
5
) is non-negative and bounded for $t\gt 0$
in the region
$t\gt 0$
in the region
 \begin{align} \Omega =\Omega _{c}\times \Omega _{v}=\left \{(S_{c},I_{c}, S_{v},I_{v})\in \mathbb{R}_{+}^{4}\,:\, N_{c}\leq \frac{r_{1}}{d},N_{v}\leq \frac{r_{1}}{\mu } \right \}. \end{align}
Proof. First, we shall prove that $S_{c}(t)\gt 0$
for all
$S_{c}(t)\gt 0$
for all $t \geq 0$
. We assume that
$t \geq 0$
. We assume that $S_{c}(t)\geq 0$
is not true. Then there exists at
$S_{c}(t)\geq 0$
is not true. Then there exists at $\tau _{1}\gt 0$
, such that
$\tau _{1}\gt 0$
, such that
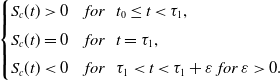 \begin{align} \begin{cases} S_{c}(t)\gt 0 & for \hspace{0.25cm}t_{0}\leq t\lt \tau _{1}, \\[3pt] S_{c}(t)=0 & for\hspace{0.25cm} t=\tau _{1},\\[3pt] S_{c}(t)\lt 0 & for\hspace{0.25cm} \tau _{1}\lt t\lt \tau _{1} + \varepsilon\ for\ \varepsilon \gt 0. \end{cases} \end{align}
Then, from the first system of equation (5), we have
 \begin{align} ^{ABC}_{0} D^{\sigma }_{t}S_{c}|_{S_{c}=0}=r_{1}\geq 0. \end{align}
Thus, using Lemma2, for all $0\lt \varepsilon \lt \lt 1$
, we have
$0\lt \varepsilon \lt \lt 1$
, we have $S_{c}\left (\tau _{1}+\varepsilon \right )=S_{c}(\tau _{1})+\frac{1}{\sigma }\frac{d^{\sigma }}{dt^{\sigma }}S_{c}(t)\varepsilon ^{\sigma }$
. Hence,
$S_{c}\left (\tau _{1}+\varepsilon \right )=S_{c}(\tau _{1})+\frac{1}{\sigma }\frac{d^{\sigma }}{dt^{\sigma }}S_{c}(t)\varepsilon ^{\sigma }$
. Hence, $S_{c}(\tau _{1}+\varepsilon )\gt 0$
contradicts our assumption that
$S_{c}(\tau _{1}+\varepsilon )\gt 0$
contradicts our assumption that $S_{c}(t)\lt 0$
for
$S_{c}(t)\lt 0$
for $\tau _{1}\lt t\lt \tau _{1}+\varepsilon$
for
$\tau _{1}\lt t\lt \tau _{1}+\varepsilon$
for $\varepsilon \gt 0$
. As a result, we obtain
$\varepsilon \gt 0$
. As a result, we obtain $S_{c}(t)\geq 0$
for all
$S_{c}(t)\geq 0$
for all $t \geq 0$
. Similarly, we have
$t \geq 0$
. Similarly, we have $I_{c}(t)\geq 0, S_{v}(t)\geq 0, I_{v}(t)\geq 0,$
for all
$I_{c}(t)\geq 0, S_{v}(t)\geq 0, I_{v}(t)\geq 0,$
for all $t \geq 0$
. It follows that each of the solutions of (5) is non-negative and remains in
$t \geq 0$
. It follows that each of the solutions of (5) is non-negative and remains in $\mathbb{R}_{+}^{4}$
, and hence, the set
$\mathbb{R}_{+}^{4}$
, and hence, the set $\Omega$
defined in (17) is positively invariant for model (5).
$\Omega$
defined in (17) is positively invariant for model (5).
Eventually, to demonstrate the boundedness of the fractional model’s solutions (5), given that all of the parameters are positive, we continue by adding up all of the model’s equations for both cotton and vector population, which yields
 \begin{align} &^{ABC}_{0} D^{\sigma }_{t}N_{c}=r_{1}-d N_{c}-\gamma I_{c}\leq r_{1}-d N_{c}, \\[-6pt] \nonumber \end{align}
 \begin{align} &^{ABC}_{0} D^{\sigma }_{t}N_{v}= r_{2}-\mu N_{v}. \\[12pt] \nonumber \end{align}
Now, using the Laplace transform and simplifying equations (20) and (21), we get
 \begin{align} N_{c}(t)\leq & \left (\frac{G(\sigma )}{G(\sigma )+(1-\sigma )d}N_{c}(0)+\frac{(1-\sigma )r_{1}}{G(\sigma )+(1-\sigma )d}\right )E_{\sigma, 1}\left (-c_{1}t^{\sigma }\right ) \nonumber \\[3pt] &+\frac{\sigma r_{1}}{G(\sigma )+(1-\sigma )d}E_{\sigma, \sigma +1}\left (-c_{2}t^{\sigma }\right ), \\[-6pt] \nonumber \end{align}
 \begin{align} N_{v}(t)\leq & \left (\frac{G(\sigma )}{G(\sigma )+(1-\sigma )\mu }N_{v}(0)+\frac{(1-\sigma )r_{2}}{G(\sigma )+(1-\sigma )\mu }\right )E_{\sigma, 1}\left (-c_{2}t^{\sigma }\right )\nonumber \\[3pt] &+\frac{\sigma r_{2}}{G(\sigma )+(1-\sigma )\psi }E_{\sigma, \sigma +1}\left (-c_{2}t^{\sigma }\right ), \\[12pt] \nonumber \end{align}
where $c_{1}=\frac{\sigma d}{G(\sigma )\,+\,(1-\sigma )d}$
and
$c_{1}=\frac{\sigma d}{G(\sigma )\,+\,(1-\sigma )d}$
and $c_{2}=\frac{\sigma \mu }{G(\sigma )\,+\,(1-\sigma )\mu }$
with
$c_{2}=\frac{\sigma \mu }{G(\sigma )\,+\,(1-\sigma )\mu }$
with $E_{\sigma, c_{1}}$
and
$E_{\sigma, c_{1}}$
and $E_{\sigma, c_{2}}$
constitute the two parameter Mittag-Leffler function and due to its asymptotic nature that leads to the conclusion that
$E_{\sigma, c_{2}}$
constitute the two parameter Mittag-Leffler function and due to its asymptotic nature that leads to the conclusion that $N_{c}(t)\leq \frac{r_{1}}{d}$
and
$N_{c}(t)\leq \frac{r_{1}}{d}$
and $N_{v}(t)\leq \frac{r_{2}}{\mu } as t \rightarrow \infty$
. Hence, (17) is the biologically feasible region of model (5).
$N_{v}(t)\leq \frac{r_{2}}{\mu } as t \rightarrow \infty$
. Hence, (17) is the biologically feasible region of model (5).
4. Equilibrium points of the model
4.1. The coffee berry disease-free equilibrium points of the model $(E_{0})$

The CBD-free equilibrium points $(E_{0})$
of the model are stationary solutions with no diseases. It is obtained by equating equation (5) to zero and using
$(E_{0})$
of the model are stationary solutions with no diseases. It is obtained by equating equation (5) to zero and using $I_{c} = 0$
and
$I_{c} = 0$
and $Y_{v} = 0$
. Then,
$Y_{v} = 0$
. Then, $E_{0}$
of our model equation (5) is given by
$E_{0}$
of our model equation (5) is given by
 \begin{align} E_{0} = (S_{c}^{0}, I_{c}^{0}, S_{v}^{0}, I_{v}^{0}) = \left (\frac{r_{1}}{d}, 0, \frac{r_{2}}{\mu }, 0\right ) . \end{align}
4.2. The basic reproduction number
$(R_{0})$

The basic reproduction number $(R_{0})$
counts the estimated number of secondary infections that result from one newly infected coffee berry delivered directly into a susceptible population. We can obtain
$(R_{0})$
counts the estimated number of secondary infections that result from one newly infected coffee berry delivered directly into a susceptible population. We can obtain $R_{0}$
of the system of equation (5) using the next-generation matrix method as described by [Reference Van den Driessche and Watmough50]. It can be determined by rewriting the system of equation (5) starting with newly infective classes and using the next-generation matrix method:
$R_{0}$
of the system of equation (5) using the next-generation matrix method as described by [Reference Van den Driessche and Watmough50]. It can be determined by rewriting the system of equation (5) starting with newly infective classes and using the next-generation matrix method:
 \begin{align} ^{ABC}_{0} D^{\sigma }_{t}I_{c} &=\beta _{1}S_{c}I_{v} - (d+\gamma ) I_{c}, \\[-6pt] \nonumber \end{align}
 \begin{align} ^{ABC}_{0} D^{\sigma }_{t}I_{v} &=\beta _{2}I_{c}S_{v}-\mu I_{v}. \\[12pt] \nonumber \end{align}
Then, we consider
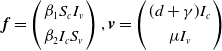 \begin{align} \boldsymbol{f} = \left ( \begin{array}{c} \beta _{1}S_{c}I_{v}\\[3pt] \beta _{2}I_{c}S_{v} \end{array} \right ), \boldsymbol{v} = \left ( \begin{array}{c} (d+\gamma ) I_{c}\\[3pt] \mu I_{v} \end{array} \right ) \\[-10pt] \nonumber \end{align}
Now, the Jacobian matrix of $\boldsymbol{f}$
and
$\boldsymbol{f}$
and $\boldsymbol{v}$
with respect to
$\boldsymbol{v}$
with respect to $I_{c}$
and
$I_{c}$
and $I_{v}$
at CBD-free equilibrium point
$I_{v}$
at CBD-free equilibrium point $E_{0}=\left (\frac{r_{1}}{d}, 0, \frac{r_{2}}{\mu }, 0\right )$
is
$E_{0}=\left (\frac{r_{1}}{d}, 0, \frac{r_{2}}{\mu }, 0\right )$
is
 \begin{align} \texttt{F} = \left ( \begin{array}{c@{\quad}c} 0 & \frac{\beta _{1}r_{1}}{d}\\[3pt] \frac{\beta _{2}r_{2}}{\mu } & 0 \end{array} \right ), \texttt{V} = \left ( \begin{array}{c@{\quad}c} d+\gamma & 0\\[3pt] 0 & \mu \end{array} \right ). \end{align}
Then, by the principle of next-generation matrix, basic reproduction number $(R_{0})$
is the dominant eigenvalue of the
$(R_{0})$
is the dominant eigenvalue of the $FV^{-1}$
or spectral radius of
$FV^{-1}$
or spectral radius of $FV^{-1}$
where
$FV^{-1}$
where
 \begin{align} FV^{-1} = \left ( \begin{array}{c@{\quad}c} 0 & \frac{\beta _{1}r_{1}}{d}\\[3pt] \frac{\beta _{2}r_{2}}{\mu } & 0 \end{array} \right ) \left ( \begin{array}{c@{\quad}c} \frac{1}{d+\gamma }& 0\\[3pt] 0 & \frac{1}{\mu } \end{array} \right )= \left ( \begin{array}{c@{\quad}c} 0 & \frac{\beta _{1}r_{1}}{d\mu }\\[3pt] \frac{\beta _{2}r_{2}}{\mu (d+\gamma )} & 0 \end{array} \right ). \end{align}
The characteristic equations of equation (29) becomes
 \begin{align} \lambda ^{2}-\frac{m_{1}r_{2}\beta _{1}\beta _{2}}{(d+\gamma )d \mu ^{2}}=0 \implies \lambda =\pm \sqrt{\frac{r_{1}r_{2}\beta _{1}\beta _{2}}{(d+\gamma )d \mu ^{2}}}. \end{align}
Since, $R_{0}$
is the maximum eigenvalues of
$R_{0}$
is the maximum eigenvalues of $FV^{-1}$
or the spectral radius of
$FV^{-1}$
or the spectral radius of $FV^{-1}$
. That is,
$FV^{-1}$
. That is,
 \begin{align} R_{0}=\max \left \{-\sqrt{\frac{r_{1}r_{2}\beta _{1}\beta _{2}}{(d+\gamma )d \mu ^{2}}},\sqrt{\frac{r_{1}r_{2}\beta _{1}\beta _{2}}{(d+\gamma )d \mu ^{2}}}\right \}. \end{align}
4.3. Coffee berry disease endemic equilibrium point of the model (
$E_{1}$
)

The coffee berry endemic equilibrium point, $E_{1}=(S_{c}^{*},I_{c}^{*},S_{v}^{*},I_{v}^{*} )$
, of the model is the steady-state solution, where coffee berries persist in the population of coffee plants. We can obtain this by equating each system of equation (5) equal to zero, and it is given by
$E_{1}=(S_{c}^{*},I_{c}^{*},S_{v}^{*},I_{v}^{*} )$
, of the model is the steady-state solution, where coffee berries persist in the population of coffee plants. We can obtain this by equating each system of equation (5) equal to zero, and it is given by
 \begin{align} S_{c}^{*}&=\frac{r_{1}(r_{1}\beta _{2}+\mu (d+\gamma ))}{d\mu (d+\gamma )(R_{0}^{2}-1)+d(r_{1}\beta _{2}+\mu (d+\gamma ))}, \\[-2pt] \nonumber \end{align}
 \begin{align} I_{c}^{*}&=\frac{r_{1}\mu (R_{0}^{2}-1)}{\mu ((d+\gamma ))(R_{0}^{2}-1)+(r_{1}\beta _{2}+\mu (d+\gamma ))}, \\[-2pt] \nonumber \end{align}
 \begin{align} S_{v}^{*}&=\frac{r_{2}((d+\gamma )\mu (R_{0}^{2}-1)+r_{1}\beta _{2}+d\mu )}{\mu ((r_{1}\beta _{2}+d\mu )(R_{0}^{2}-1)+r_{1}\beta _{2}+\mu (d+\gamma ))}, \\[-2pt] \nonumber \end{align}
 \begin{align} I_{v}^{*}&= \frac{d\mu (d+\gamma )(R_{0}^{2}-1)}{\beta _{1}(r_{1}\beta _{2}+\mu )(d+\gamma )}. \\[12pt] \nonumber \end{align}
5. Stability analysis of the model
5.1. Local stability of the coffee berry disease-free equilibrium point
The linearisation system of equation (5) at $E_{0}$
can be used to find the local stability of the model at
$E_{0}$
can be used to find the local stability of the model at $E_{0}$
.
$E_{0}$
.
Theorem 3.
Disease-free equilibrium point $(E_{0})$
of the system of equation (
5
) is locally asymptotically stable, if
$(E_{0})$
of the system of equation (
5
) is locally asymptotically stable, if $R_{0}\lt 1 .$
Proof. Evaluating the Jacobian matrix of the system of equation (5) at $E_{0}=\left (\frac{r_{1}}{d}, 0, \frac{r_{2}}{\mu }, 0\right )$
is
$E_{0}=\left (\frac{r_{1}}{d}, 0, \frac{r_{2}}{\mu }, 0\right )$
is
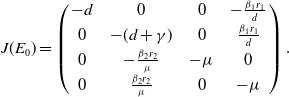 \begin{align} J(E_{0})=\left ( \begin{array}{c@{\quad}c@{\quad}c@{\quad}c} -d & 0 &0 & -\frac{\beta _{1}r_{1}}{d}\\[3pt] 0 & -(d+\gamma ) & 0 & \frac{\beta _{1}r_{1}}{d}\\[3pt] 0 & -\frac{\beta _{2}r_{2}}{\mu }& -\mu & 0\\[3pt] 0 & \frac{\beta _{2}r_{2}}{\mu } & 0 & -\mu \end{array} \right ). \end{align}
The corresponding characteristic equation of the Jacobian matrix of equation (36) at $E_{0}$
is given by
$E_{0}$
is given by $|J(E_{0})-\lambda I_{4}| =0$
. That is,
$|J(E_{0})-\lambda I_{4}| =0$
. That is,
 \begin{align} \left (-d-\lambda \right )\left (-\mu -\lambda \right )(\lambda ^{2}+d_{1}\lambda +d_{2})=0. \end{align}
where
 \begin{align} &d _{1} = d+\gamma +\mu, \nonumber \\[3pt] &d _{2} = (d+\gamma )\mu -\frac{r_{1}r_{2}\beta _{1}\beta _{2}}{d\mu }=(d+\gamma )\mu \left [1- \frac{r_{1}r_{2}\beta _{1}\beta _{2}}{(d+\gamma )d\mu ^{2}}\right ]=(d+\gamma )\mu (1-R_{0}^{2}). \end{align}
Clearly, from equation (37), we observe that
 \begin{align} \lambda _{1} = -d \lt 0, \lambda _{2} = -\mu \lt 0, \end{align}
and from the last expression of equation (37), that is,
 \begin{align} \lambda ^{2}+d_{1}\lambda +d_{2}=0, \end{align}
by using the Routh–Hurwitz criteria, equation (40) has a strictly negative real root if $d_{1}\gt 0$
and
$d_{1}\gt 0$
and $d_{2}\gt 0$
. Clearly, we observe that
$d_{2}\gt 0$
. Clearly, we observe that $d_{1}= d+\gamma +\mu \gt 0$
and
$d_{1}= d+\gamma +\mu \gt 0$
and
 \begin{align} d_{2}= (d+\gamma )\mu (1-R_{0}^{2})\gt 0, \end{align}
if $(1-R_{0}^{2})\gt 0$
. That is,
$(1-R_{0}^{2})\gt 0$
. That is, $R_{0}^{2}\lt 1$
implies that
$R_{0}^{2}\lt 1$
implies that $R_{0}\lt 1$
. As a result, our model equation (5) at
$R_{0}\lt 1$
. As a result, our model equation (5) at $E_{0}$
offers all eigenvalues with a negative real part, and so it is locally asymptotically stable if
$E_{0}$
offers all eigenvalues with a negative real part, and so it is locally asymptotically stable if $R_{0}\lt 1$
.
$R_{0}\lt 1$
.
5.2. Global stability of the coffee berry disease-free equilibrium point
To establish the global stability of disease-free equilibrium point $(E_{0})$
, we need to rewrite the system of equation (5) in the following form:
$(E_{0})$
, we need to rewrite the system of equation (5) in the following form:
 \begin{align} &\dot{M} = J(M,L),\nonumber \\[3pt] &\dot{L} = P(M,L),\nonumber \\[3pt] &P(M,0)=0, \end{align}
where $ M= (S_{c}, S_{v})\in R^{2}$
represents the number of uninfected classes, while
$ M= (S_{c}, S_{v})\in R^{2}$
represents the number of uninfected classes, while $L = (I_{c},I_{v})\in R^{2}$
represents the number of infected classes, and
$L = (I_{c},I_{v})\in R^{2}$
represents the number of infected classes, and $E_{0}=(M^{0},0)$
represents the CBD-free equilibrium of this system. The disease-free equilibrium
$E_{0}=(M^{0},0)$
represents the CBD-free equilibrium of this system. The disease-free equilibrium $E_{0}$
is a globally asymptotically stable equilibrium for the model if the following conditions are fulfilled:
$E_{0}$
is a globally asymptotically stable equilibrium for the model if the following conditions are fulfilled:
-
1.
$\frac{dM}{dt}=J(M,0), M^{*}$
is a globally asymptotically stable. -
2.
$\frac{dL}{dt}=D_{L}P(M^{*},0)L-P_{1}(M,L), P_{1}(M,L)\geq 0$
,
$\forall (M,L)\in \Omega$
.


where $D_{L}P(M^{0},0)$
is an M-matrix and
$D_{L}P(M^{0},0)$
is an M-matrix and $P(M,L)$
taken in
$P(M,L)$
taken in $(I_{c},Y_{v})$
and evaluated at
$(I_{c},Y_{v})$
and evaluated at $(M^{0},0)=\left (\frac{r_{1}}{d},\frac{r_{2}}{\mu },0,0\right )$
. If the system of equation (42) satisfies the above conditions, then the following theorem holds.
$(M^{0},0)=\left (\frac{r_{1}}{d},\frac{r_{2}}{\mu },0,0\right )$
. If the system of equation (42) satisfies the above conditions, then the following theorem holds.
Theorem 4.
The coffee berry disease-free equilibrium point, $E_{0}=(M^{0},0)$
, of the system of equation (
5
) is globally asymptotically stable if
$E_{0}=(M^{0},0)$
, of the system of equation (
5
) is globally asymptotically stable if $R_{0} \leq 1$
and conditions (
1
) and (
2
) are satisfied.
$R_{0} \leq 1$
and conditions (
1
) and (
2
) are satisfied.
Proof. From our model of equation (5), we can obtain $J(M,L)$
and
$J(M,L)$
and $P(M,L)$
:
$P(M,L)$
:
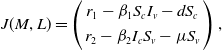 \begin{equation*} J(M,L)=\left ( \begin {array}{c} r_{1}-\beta _{1}S_{c}I_{v} - d S_{c} \\[3pt] r_{2}-\beta _{2}I_{c}S_{v} - \mu S_{v} \end {array} \right ), \end{equation*}
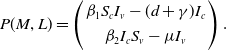 \begin{equation*} P(M,L)= \left ( \begin {array}{c} \beta _{1}S_{c}I_{v} - (d+\gamma ) I_{c} \\[3pt] \beta _{2}I_{c}S_{v}-\mu I_{v} \end {array} \right ) . \end{equation*}
Now, we consider the reduced system and from condition (1):
 \begin{align} &^{ABC}_{0} D^{\sigma }_{t}S_{c}=r_{1} - d S_{c}, \end{align}
 \begin{align} &^{ABC}_{0} D^{\sigma }_{t}S_{v}=r_{2}- \mu S_{v}, \\[12pt] \nonumber \end{align} $M^{0}=\left (\frac{r_{1}}{d}, \frac{r_{2}}{\mu }\right )$
is a globally asymptotically stable equilibrium point for the reduced system
$M^{0}=\left (\frac{r_{1}}{d}, \frac{r_{2}}{\mu }\right )$
is a globally asymptotically stable equilibrium point for the reduced system $\frac{dM}{dt}=J(M,0)$
. Using the Laplace transform, the solution of equation (43) is
$\frac{dM}{dt}=J(M,0)$
. Using the Laplace transform, the solution of equation (43) is $S_{c}(t)=\frac{r_{1}}{d}+\left (S_{c}(0)-\frac{r_{1}}{d}\right )e^{-d t}$
, which approaches
$S_{c}(t)=\frac{r_{1}}{d}+\left (S_{c}(0)-\frac{r_{1}}{d}\right )e^{-d t}$
, which approaches $\frac{r_{1}}{d}$
as
$\frac{r_{1}}{d}$
as $t\rightarrow \infty$
, and from equation (44), we obtain
$t\rightarrow \infty$
, and from equation (44), we obtain $S_{v}(t)=\frac{r_{2}}{\psi }+(S_{v}(0)-\frac{r_{2}}{\mu })e^{-\mu t}$
, which approaches
$S_{v}(t)=\frac{r_{2}}{\psi }+(S_{v}(0)-\frac{r_{2}}{\mu })e^{-\mu t}$
, which approaches $\frac{r_{2}}{\mu }$
as
$\frac{r_{2}}{\mu }$
as $t\rightarrow \infty$
. Note that this asymptomatic dynamics is independent of the initial conditions in
$t\rightarrow \infty$
. Note that this asymptomatic dynamics is independent of the initial conditions in $\Omega$
; therefore, the convergence of the solutions of the reduced system (43) and (44) is global in
$\Omega$
; therefore, the convergence of the solutions of the reduced system (43) and (44) is global in $\Omega$
. Now, we compute
$\Omega$
. Now, we compute
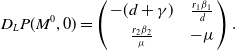 \begin{align} D_{L}P(M^{0},0)= \left ( \begin{array}{c@{\quad}c} -(d+\gamma ) &\frac{r_{1}\beta _{1}}{d} \\[3pt] \frac{r_{2}\beta _{2}}{\mu } &-\mu \end{array} \right ). \end{align}
Then, $P(M,L)$
can be written as
$P(M,L)$
can be written as
 \begin{align} P(M,L)=D_{L}P(M^{*},0)L-P_{1}(M,L), \end{align}
and we want to show $P_{1}(M,L)$
, which is obtained as
$P_{1}(M,L)$
, which is obtained as
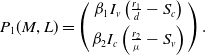 \begin{align} P_{1}(M,L)= \left ( \begin{array}{c} \beta _{1}I_{v}\left (\frac{r_{1}}{d}-S_{c}\right ) \\[3pt] \beta _{2}I_{c}\left (\frac{r_{2}}{\mu }-S_{v}\right ) \end{array} \right ). \end{align}
Here $\frac{r_{1}}{d} \geq S_{c}$
and
$\frac{r_{1}}{d} \geq S_{c}$
and $\frac{r_{2}}{\mu } \geq S_{v}$
. Hence, it is clear that
$\frac{r_{2}}{\mu } \geq S_{v}$
. Hence, it is clear that $P_{1}(M,L) \geq 0$
,
$P_{1}(M,L) \geq 0$
, $\forall (M,L) \in \Omega$
. Thus, this proves that
$\forall (M,L) \in \Omega$
. Thus, this proves that $E_{0}$
is globally asymptotically stable when
$E_{0}$
is globally asymptotically stable when $R_{0} \leq 1$
.
$R_{0} \leq 1$
.
5.3. Local stability of the coffee berry endemic equilibrium point
We used the Jacobian stability approach to prove the local stability of the disease endemic equilibrium state in this section.
Theorem 5.
When $R_{0} \gt 1$
, the model’s endemic equilibrium point,
$R_{0} \gt 1$
, the model’s endemic equilibrium point, $E_{1}$
, is locally asymptotically stable.
$E_{1}$
, is locally asymptotically stable.
Proof. The local stability of the coffee berry endemic equilibrium $(E_{1})$
is determined based on the signs of the eigenvalues of the Jacobian matrix, which is computed at
$(E_{1})$
is determined based on the signs of the eigenvalues of the Jacobian matrix, which is computed at $E_{1}$
. Now, the Jacobian matrix of our model at
$E_{1}$
. Now, the Jacobian matrix of our model at $E_{1}$
is given by
$E_{1}$
is given by
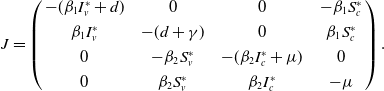 \begin{align} J = \left ( \begin{array}{c@{\quad}c@{\quad}c@{\quad}c} -(\beta _{1}I_{v}^{*}+d)&0 & 0 & -\beta _{1}S_{c}^{*}\\[3pt] \beta _{1}I_{v}^{*} & -(d+\gamma ) & 0 & \beta _{1}S_{c}^{*}\\[3pt] 0 & -\beta _{2}S_{v}^{*} & -(\beta _{2}I_{c}^{*}+\mu ) & 0\\[3pt] 0 & \beta _{2}S_{v}^{*} & \beta _{2}I_{c}^{*} & -\mu \end{array} \right ). \end{align}
The corresponding characteristic equation of the Jacobian matrix of equation (48) at $E_{1}$
is
$E_{1}$
is $|J(E_{1})- \lambda I_{4}| =0$
. That is,
$|J(E_{1})- \lambda I_{4}| =0$
. That is,
 \begin{align} P(\lambda ) = f_{4} \lambda ^{4}+f_{3} \lambda ^{3}+f_{2} \lambda ^{2}+f_{1} \lambda + f_{0}, \end{align}
where
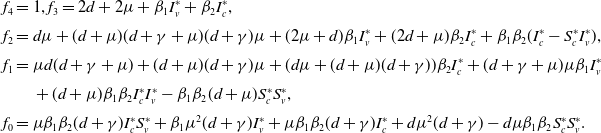 \begin{align} f_{4}=\,&1,f_{3}=2d+2\mu +\beta _{1}I_{v}^{*}+\beta _{2}I_{c}^{*}, \nonumber \\[3pt] f_{2} = \,&d\mu +(d+\mu )(d+\gamma +\mu )(d+\gamma )\mu +(2\mu +d)\beta _{1}I_{v}^{*}+(2d+\mu )\beta _{2}I_{c}^{*}+\beta _{1}\beta _{2}(I_{c}^{*}-S_{c}^{*}I_{v}^{*}),\nonumber \\[3pt] f_{1}= \, &\mu d(d+\gamma +\mu )+(d+\mu )(d+\gamma )\mu +(d\mu +(d+\mu )(d+\gamma ))\beta _{2}I_{c}^{*}+(d+\gamma +\mu )\mu \beta _{1}I_{v}^{*}\nonumber \\[3pt] &+(d+\mu )\beta _{1}\beta _{2}I_{c}^{*}I_{v}^{*}-\beta _{1}\beta _{2}(d+\mu )S_{c}^{*}S_{v}^{*}, \nonumber \\[3pt] f_{0} = \, & \mu \beta _{1}\beta _{2}(d+\gamma ) I_{c}^{*}S_{v}^{*}+\beta _{1}\mu ^{2}(d+\gamma ) I_{v}^{*}+\mu \beta _{1}\beta _{2}(d+\gamma ) I_{c}^{*}+d \mu ^{2}(d+\gamma )-d\mu \beta _{1}\beta _{2}S_{c}^{*}S_{v}^{*}. \end{align}
Using the Routh–Hurwitz criterion, all roots of a characteristic polynomial have negative real parts if and only if $ f_{4}\gt 0, f_{3}\gt 0, f_{2}\gt 0, f_{1}\gt 0,f_{0}\gt, f_{3}f_{2}\gt f_{1}$
and
$ f_{4}\gt 0, f_{3}\gt 0, f_{2}\gt 0, f_{1}\gt 0,f_{0}\gt, f_{3}f_{2}\gt f_{1}$
and $f_{1}f_{2}f_{3}\gt f_{0}f_{3}^{2}+f_{1}^{2}$
for
$f_{1}f_{2}f_{3}\gt f_{0}f_{3}^{2}+f_{1}^{2}$
for $R_{0} \gt 1$
. Therefore,
$R_{0} \gt 1$
. Therefore, $E_{1}$
is locally asymptotically stable if
$E_{1}$
is locally asymptotically stable if $R_{0} \gt 1$
.
$R_{0} \gt 1$
.
6. Numerical solution of the model
In this section, we develop a numerical scheme for model (5) using the Toufik–Atangana rule detailed in [Reference Toufik and Atangana49]. Now from the first equation of (5), we have
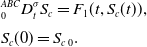 \begin{align} &^{ABC}_{0} D^{\sigma }_{t}S_{c} =F_{1}(t,S_{c}(t)),\nonumber \\[3pt] &S_{c}(0)=S_{c\hspace{0.05cm}0}. \end{align}
Based on (11), we obtain the solution for (51) given in (52):
 \begin{align} S_{c}(t)=S_{c}(0)+\frac{1-\sigma }{G(\sigma )}F_{1}(t,S_{c}(t))+\frac{\sigma }{G(\sigma )\Gamma (\sigma )}\int _{0}^{t}F_{1}(\rho, S_{c}(\rho ))(t-\rho )^{\sigma -1}d\rho . \end{align}
Applying Lagrange’s interpolation polynomial on the interval $[t_{k}, t_{k+1}]$
to the equality
$[t_{k}, t_{k+1}]$
to the equality $F_{1}(w,S_{c}(w))=r_{1}-\beta _{1}S_{c}(w)Y_{v}(w)-dS_{c}(w)$
leads to
$F_{1}(w,S_{c}(w))=r_{1}-\beta _{1}S_{c}(w)Y_{v}(w)-dS_{c}(w)$
leads to
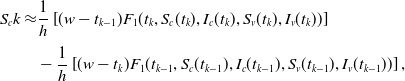 \begin{align} S_{c}k\approx &\frac{1}{h}\left [(w-t_{k-1})F_{1}(t_{k},S_{c}(t_{k}),I_{c}(t_{k}),S_{v}(t_{k}),I_{v}(t_{k})) \right ]\nonumber \\[3pt] &-\frac{1}{h}\left [(w-t_{k})F_{1}(t_{k-1},S_{c}(t_{k-1}),I_{c}(t_{k-1}),S_{v}(t_{k-1}),I_{v}(t_{k-1}) )\right ], \end{align}
where $h=t_{k}-t_{k-1}$
. Now, substituting equation (53) into equation (52), we get
$h=t_{k}-t_{k-1}$
. Now, substituting equation (53) into equation (52), we get
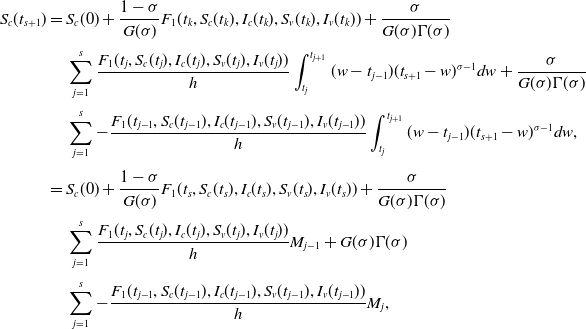 \begin{align} S_{c}(t_{s+1})= \, &S_{c}(0)+\frac{1-\sigma }{G(\sigma )}F_{1}(t_{k},S_{c}(t_{k}),I_{c}(t_{k}),S_{v}(t_{k}),I_{v}(t_{k}))+\frac{\sigma }{G(\sigma )\Gamma (\sigma )}\nonumber \\[3pt] &\sum _{j=1}^{s}\frac{F_{1}(t_{j},S_{c}(t_{j}),I_{c}(t_{j}),S_{v}(t_{j}),I_{v}(t_{j}))}{h}\int _{t_{j}}^{t_{j+1}}(w-t_{j-1})(t_{s+1}-w)^{\sigma -1}dw +\frac{\sigma }{G(\sigma )\Gamma (\sigma )}\nonumber \\[3pt] &\sum _{j=1}^{s}-\frac{F_{1}(t_{j-1},S_{c}(t_{j-1}),I_{c}(t_{j-1}),S_{v}(t_{j-1}),I_{v}(t_{j-1}))}{h}\int _{t_{j}}^{t_{j+1}}(w-t_{j-1})(t_{s+1}-w)^{\sigma -1}dw, \nonumber \\[3pt] = \, & S_{c}(0)+\frac{1-\sigma }{G(\sigma )}F_{1}(t_{s},S_{c}(t_{s}),I_{c}(t_{s}),S_{v}(t_{s}),I_{v}(t_{s}))+\frac{\sigma }{G(\sigma )\Gamma (\sigma )}\nonumber \\[3pt] &\sum _{j=1}^{s}\frac{F_{1}(t_{j},S_{c}(t_{j}),I_{c}(t_{j}),S_{v}(t_{j}),I_{v}(t_{j}))}{h}M_{j-1}+{G(\sigma )\Gamma (\sigma )}\nonumber \\[3pt] &\sum _{j=1}^{s}-\frac{F_{1}(t_{j-1},S_{c}(t_{j-1}),I_{c}(t_{j-1}),S_{v}(t_{j-1}),I_{v}(t_{j-1}))}{h}M_{j}, \end{align}
where
 \begin{align} M_{j-1}=&\int _{t_{j}}^{t_{j}+1}(w-t_{j-1})(t_{s+1}-w)^{\sigma -1}dw= -\frac{1}{\sigma }\left [(t_{j+1}-t_{j-1})(t_{s+1}-t_{j+1})^{\sigma }-(t_{j}-t_{j-1})(t_{s+1}-t_{j})^{\sigma }\right ]\nonumber \\[3pt] &-\frac{1}{\sigma (\sigma +1)}\left [(t_{s+1}-t_{j+1})^{\sigma +1}(t_{s+1}-t_{j+1})^{\sigma }-(t_{s+1}-t_{j})^{\sigma +1}\right ], \\[-2pt] \nonumber \end{align}
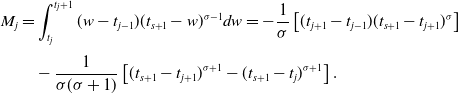 \begin{align} M_{j}=&\int _{t_{j}}^{t_{j}+1}(w-t_{j-1})(t_{s+1}-w)^{\sigma -1}dw= -\frac{1}{\sigma }\left [(t_{j+1}-t_{j-1})(t_{s+1}-t_{j+1})^{\sigma }\right ]\nonumber \\[3pt] &-\frac{1}{\sigma (\sigma +1)}\left [(t_{s+1}-t_{j+1})^{\sigma +1}-(t_{s+1}-t_{j})^{\sigma +1}\right ]. \\[12pt] \nonumber \end{align}
Moreover, substituting $t_{j}=jh$
into equations (55) and (56) gives
$t_{j}=jh$
into equations (55) and (56) gives
 \begin{align} M_{j-1}=&\frac{h^{\sigma +1}}{\sigma (\sigma +1)}\left [(s+1-j)^{\sigma }(s-j+2+\sigma )-(s-j)^{\sigma }(s-j+2+2\sigma )\right ], \\[-2pt] \nonumber \end{align}
 \begin{align} M_{j}=&\frac{h^{\sigma +1}}{\sigma (\sigma +1)}\left [(s+1-j)^{\sigma +1}-(s-j)^{\sigma }(s-j+1+\sigma )\right ]. \\[12pt] \nonumber \end{align}
Finally, we can express equation (54) in terms of equations (57) and (58) as follows:
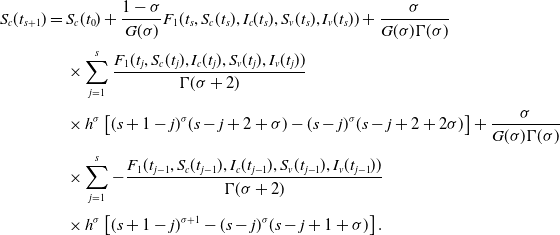 \begin{align} S_{c}(t_{s+1}) = \, & S_{c}(t_{0})+\frac{1-\sigma }{G(\sigma )}F_{1}(t_{s},S_{c}(t_{s}),I_{c}(t_{s}),S_{v}(t_{s}),I_{v}(t_{s}))+\frac{\sigma }{G(\sigma )\Gamma (\sigma )}\nonumber \\[3pt] &\times \sum _{j=1}^{s}\frac{F_{1}(t_{j},S_{c}(t_{j}),I_{c}(t_{j}),S_{v}(t_{j}),I_{v}(t_{j}))}{\Gamma (\sigma +2)}\nonumber \\[3pt] &\times h^{\sigma }\left [(s+1-j)^{\sigma }(s-j+2+\sigma )-(s-j)^{\sigma }(s-j+2+2\sigma )\right ]+\frac{\sigma }{G(\sigma )\Gamma (\sigma )} \nonumber \\[3pt] &\times \sum _{j=1}^{s}-\frac{F_{1}(t_{j-1},S_{c}(t_{j-1}),I_{c}(t_{j-1}),S_{v}(t_{j-1}),I_{v}(t_{j-1}))}{\Gamma (\sigma +2)}\\[3pt] &\times h^{\sigma } \left [(s+1-j)^{\sigma +1}-(s-j)^{\sigma }(s-j+1+\sigma )\right ]. \nonumber \end{align}
In the same way, we have the following equations for the remaining state variables:
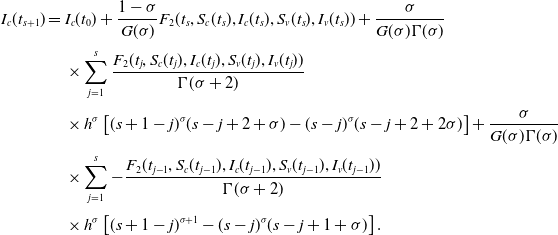 \begin{align} I_{c}(t_{s+1}) = \,&I_{c}(t_{0})+\frac{1-\sigma }{G(\sigma )}F_{2}(t_{s},S_{c}(t_{s}),I_{c}(t_{s}),S_{v}(t_{s}),I_{v}(t_{s}))+\frac{\sigma }{G(\sigma )\Gamma (\sigma )}\nonumber \\[3pt] &\times \sum _{j=1}^{s}\frac{F_{2}(t_{j},S_{c}(t_{j}),I_{c}(t_{j}),S_{v}(t_{j}),I_{v}(t_{j}))}{\Gamma (\sigma +2)}\nonumber \\[3pt] &\times h^{\sigma }\left [(s+1-j)^{\sigma }(s-j+2+\sigma )-(s-j)^{\sigma }(s-j+2+2\sigma )\right ]+\frac{\sigma }{G(\sigma )\Gamma (\sigma )} \nonumber \\[3pt] &\times \sum _{j=1}^{s}-\frac{F_{2}(t_{j-1},S_{c}(t_{j-1}),I_{c}(t_{j-1}),S_{v}(t_{j-1}),I_{v}(t_{j-1}))}{\Gamma (\sigma +2)}\\[3pt] &\times h^{\sigma } \left [(s+1-j)^{\sigma +1}-(s-j)^{\sigma }(s-j+1+\sigma )\right ]. \nonumber \\[-2pt] \nonumber \end{align}
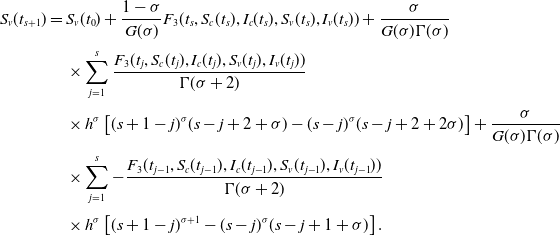 \begin{align} S_{v}(t_{s+1})=\, & S_{v}(t_{0})+\frac{1-\sigma }{G(\sigma )}F_{3}(t_{s},S_{c}(t_{s}),I_{c}(t_{s}),S_{v}(t_{s}),I_{v}(t_{s}))+\frac{\sigma }{G(\sigma )\Gamma (\sigma )}\nonumber \\[3pt] &\times \sum _{j=1}^{s}\frac{F_{3}(t_{j},S_{c}(t_{j}),I_{c}(t_{j}),S_{v}(t_{j}),I_{v}(t_{j}))}{\Gamma (\sigma +2)}\nonumber \\[3pt] &\times h^{\sigma }\left [(s+1-j)^{\sigma }(s-j+2+\sigma )-(s-j)^{\sigma }(s-j+2+2\sigma )\right ]+\frac{\sigma }{G(\sigma )\Gamma (\sigma )} \nonumber \\[3pt] &\times \sum _{j=1}^{s}-\frac{F_{3}(t_{j-1},S_{c}(t_{j-1}),I_{c}(t_{j-1}),S_{v}(t_{j-1}),I_{v}(t_{j-1}))}{\Gamma (\sigma +2)}\\[3pt] &\times h^{\sigma } \left [(s+1-j)^{\sigma +1}-(s-j)^{\sigma }(s-j+1+\sigma )\right ]. \nonumber \\[-2pt] \nonumber \end{align}
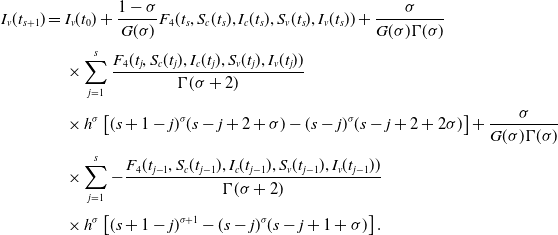 \begin{align} I_{v}(t_{s+1})= \, & I_{v}(t_{0})+\frac{1-\sigma }{G(\sigma )}F_{4}(t_{s},S_{c}(t_{s}),I_{c}(t_{s}),S_{v}(t_{s}),I_{v}(t_{s}))+\frac{\sigma }{G(\sigma )\Gamma (\sigma )}\nonumber \\[3pt] &\times \sum _{j=1}^{s}\frac{F_{4}(t_{j},S_{c}(t_{j}),I_{c}(t_{j}),S_{v}(t_{j}),I_{v}(t_{j}))}{\Gamma (\sigma +2)}\nonumber \\[3pt] &\times h^{\sigma }\left [(s+1-j)^{\sigma }(s-j+2+\sigma )-(s-j)^{\sigma }(s-j+2+2\sigma )\right ]+\frac{\sigma }{G(\sigma )\Gamma (\sigma )} \nonumber \\[3pt] &\times \sum _{j=1}^{s}-\frac{F_{4}(t_{j-1},S_{c}(t_{j-1}),I_{c}(t_{j-1}),S_{v}(t_{j-1}),I_{v}(t_{j-1}))}{\Gamma (\sigma +2)}\\[3pt] &\times h^{\sigma } \left [(s+1-j)^{\sigma +1}-(s-j)^{\sigma }(s-j+1+\sigma )\right ]. \nonumber \\[12pt] \nonumber \end{align}
7. Numerical simulation
This section examines the effects of various fractional order values on the system of equation (5). In order to achieve this, we present a number of numerical simulations of the model that make use of a numerical method created by Toufic and Antagana, as shown in equations (59)–(62). The following initial conditions are used in the simulations and analysis: $S_{c}(0)=700, I_{c}(0)= 150, S_{v}(0)= 100, I_{v}(0)= 180$
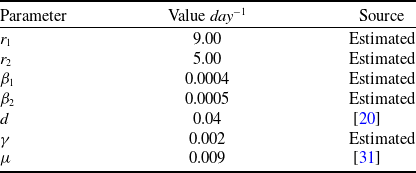
. The values of the parameters are shown in Table 1.
$S_{c}(0)=700, I_{c}(0)= 150, S_{v}(0)= 100, I_{v}(0)= 180$
. The values of the parameters are shown in Table 1.
The parameter values
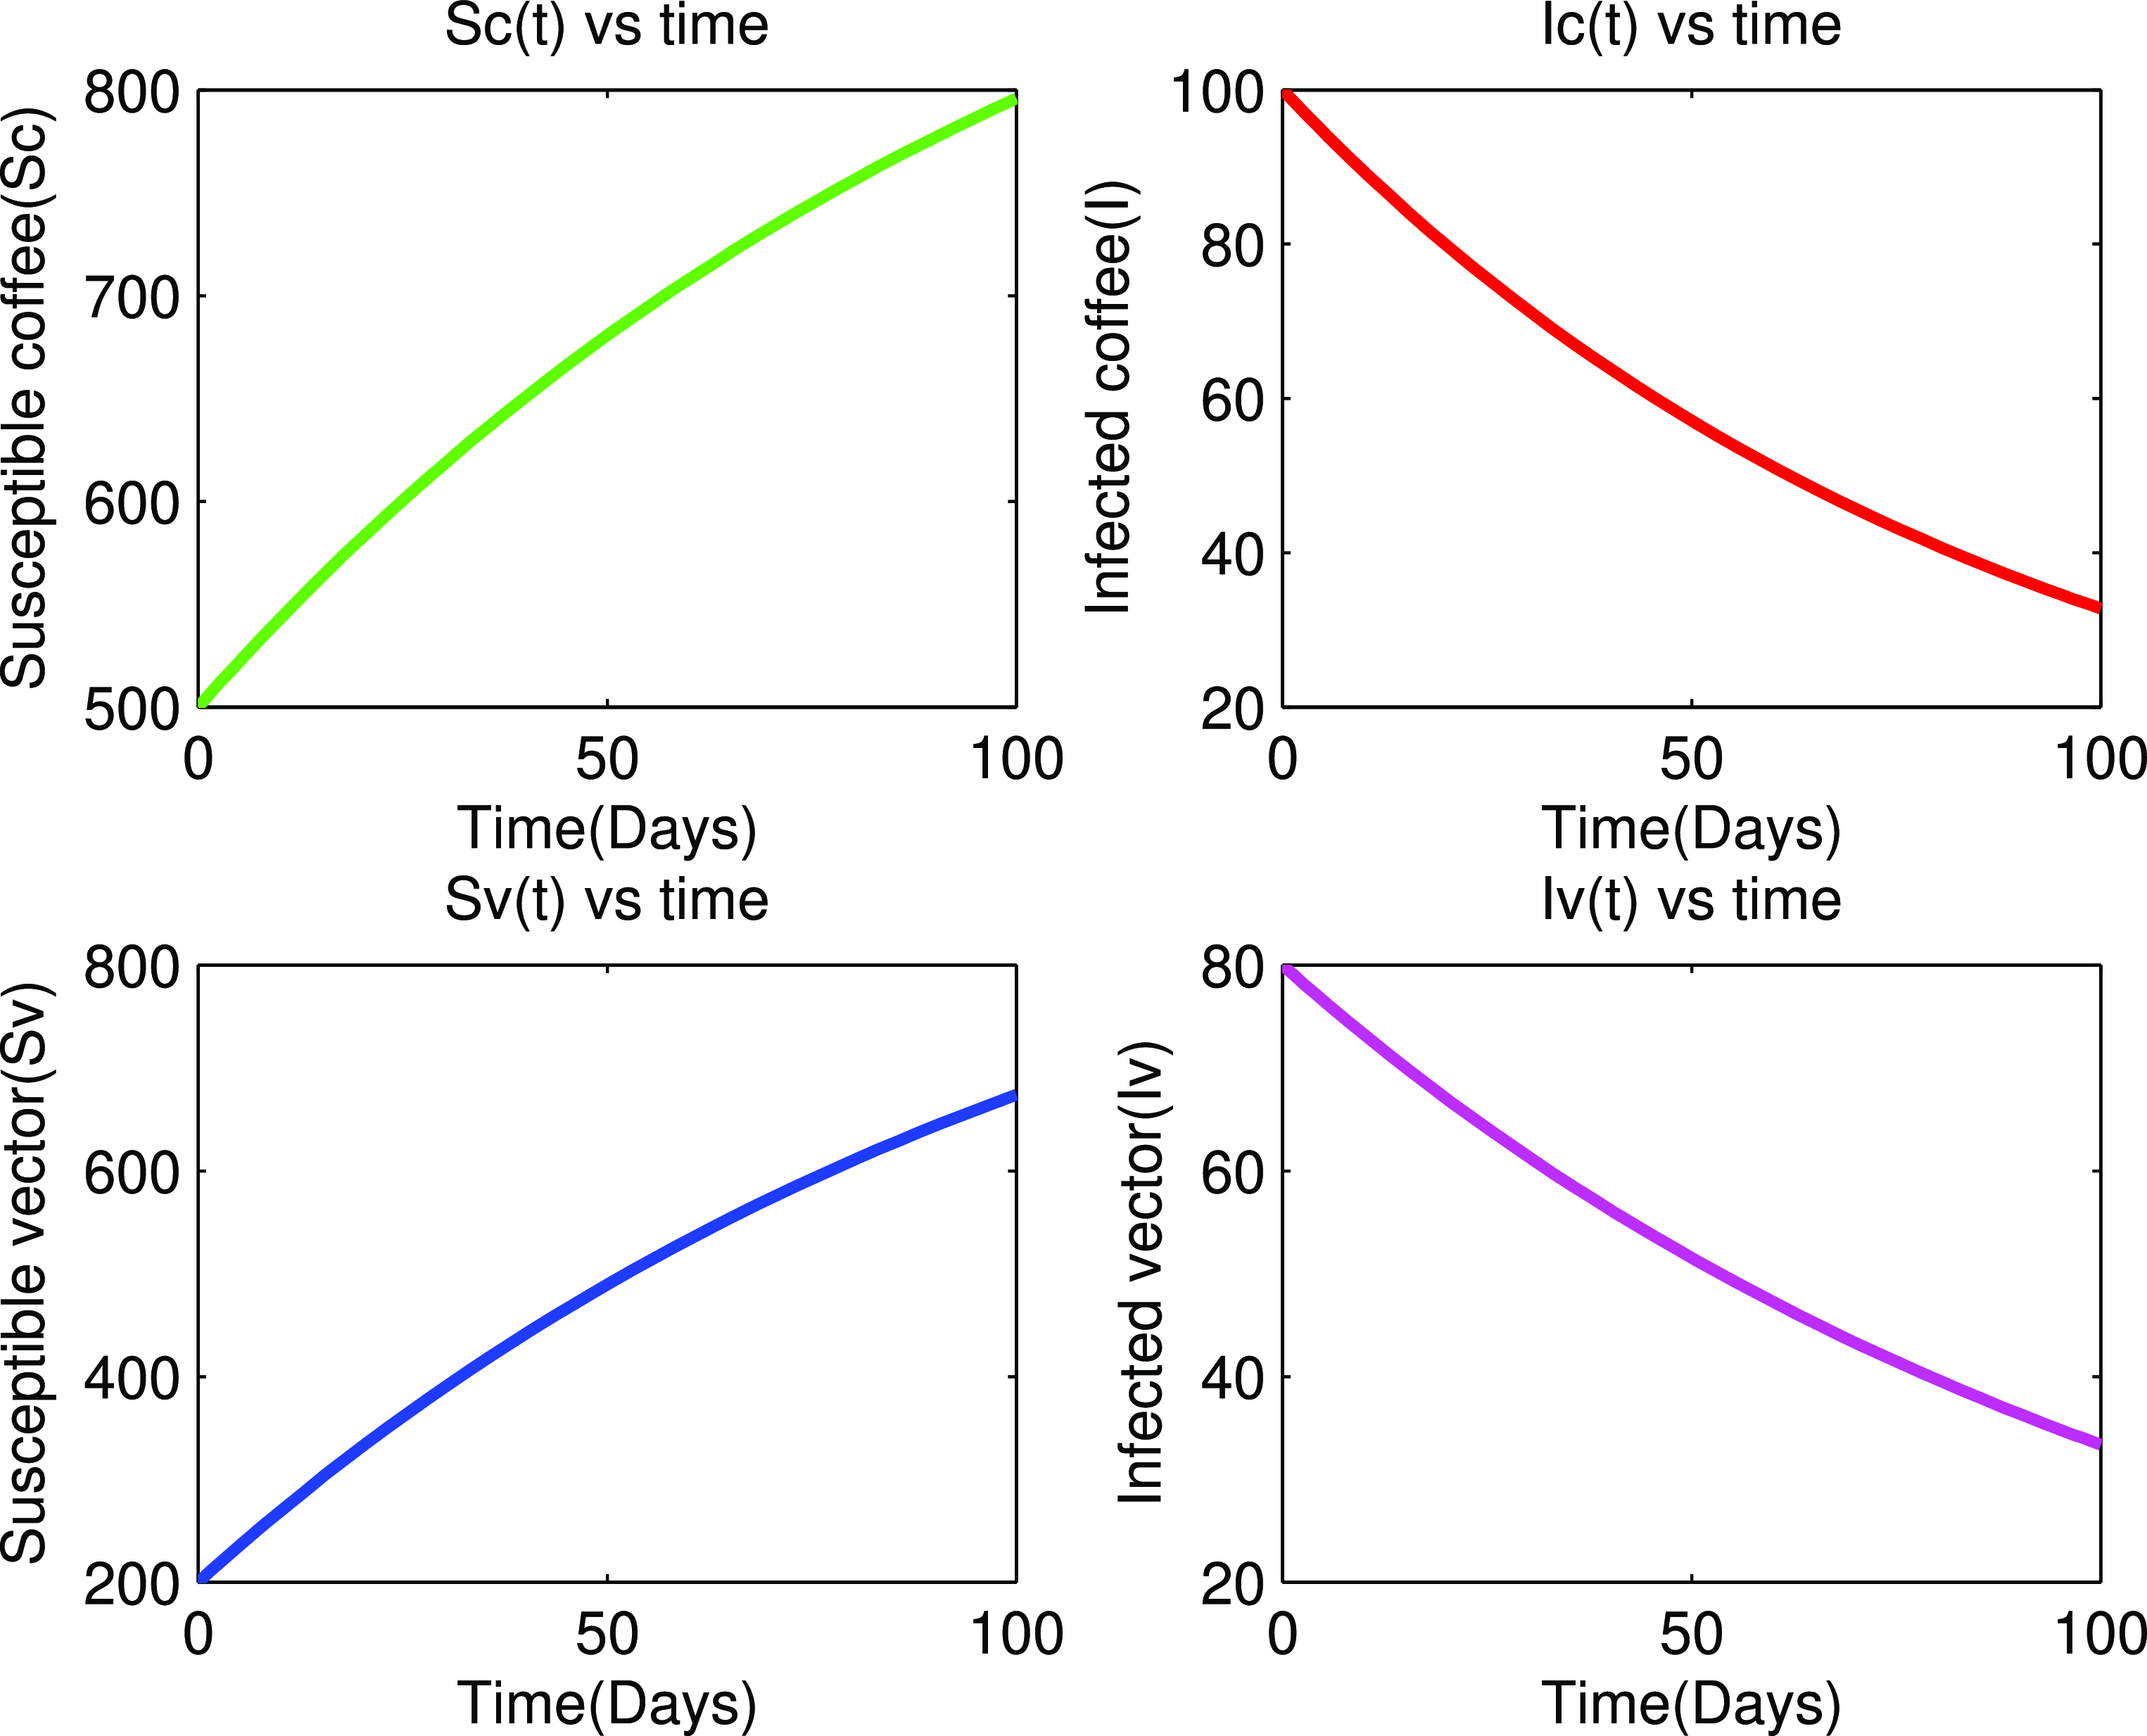
Time series plot of state variables for $R_{0}\lt 1$
.
$R_{0}\lt 1$
.
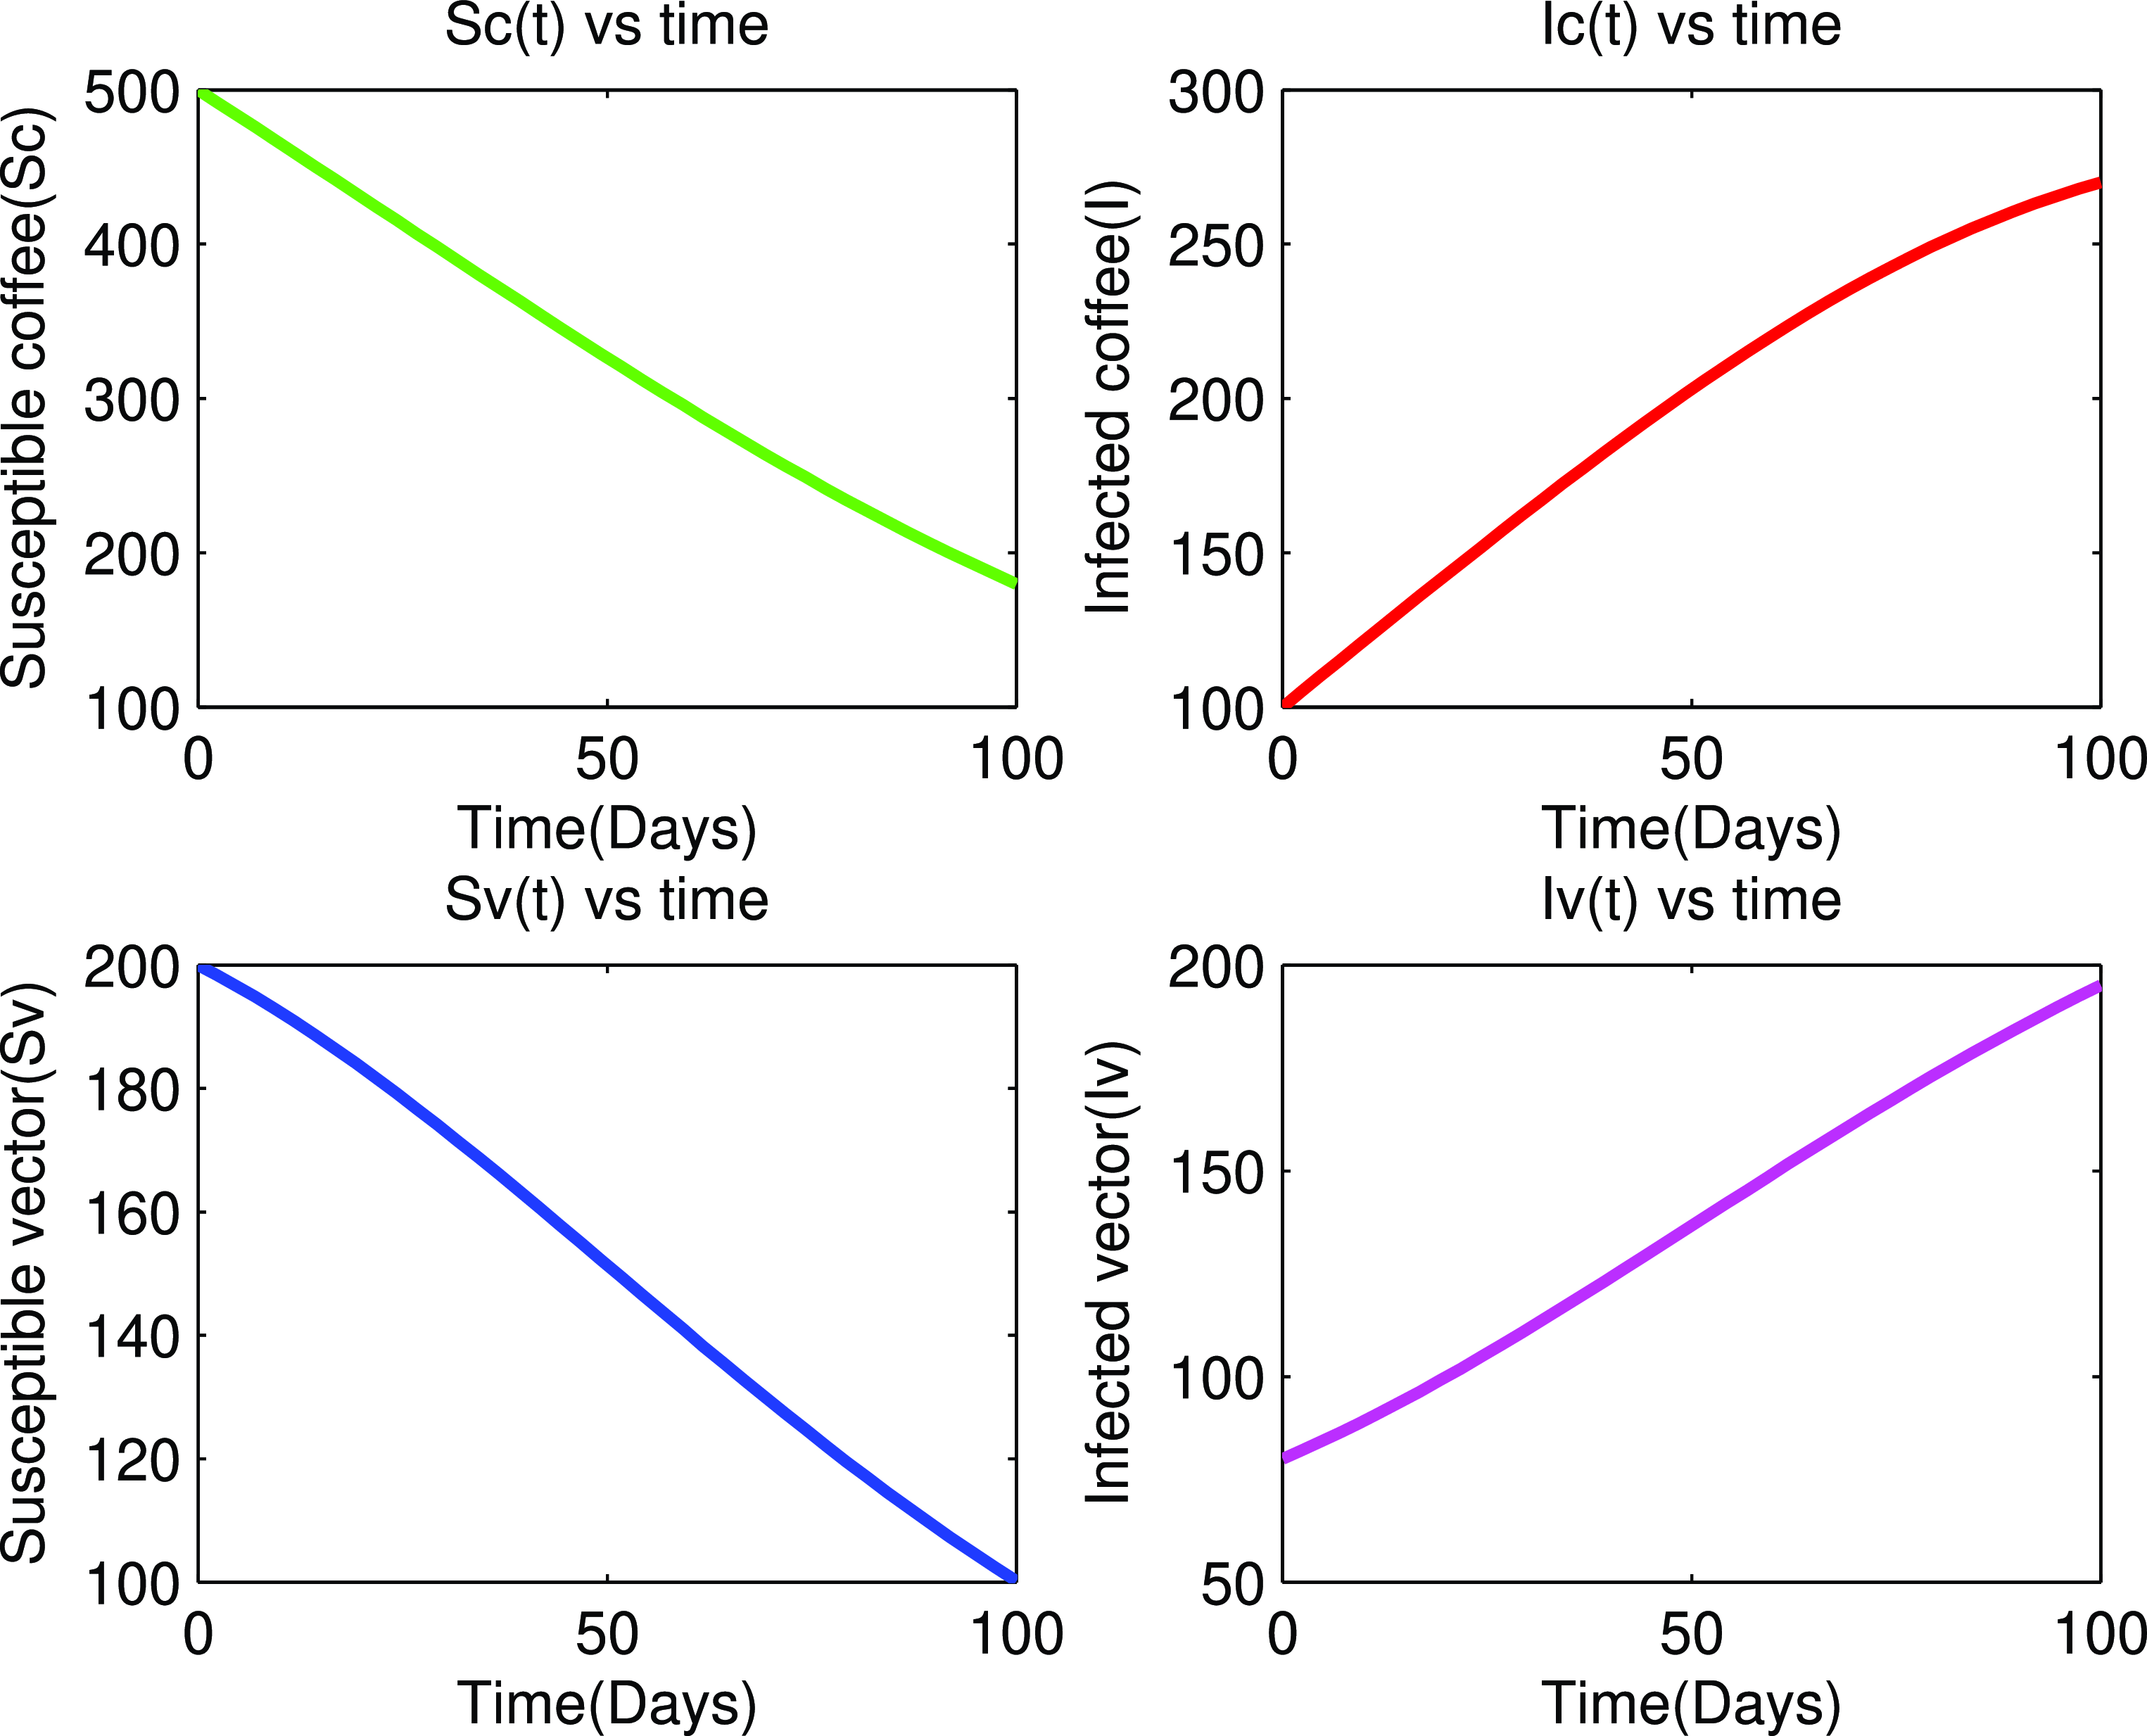
Time series plot of state variables for $R_{0}\gt 1$
.
$R_{0}\gt 1$
.
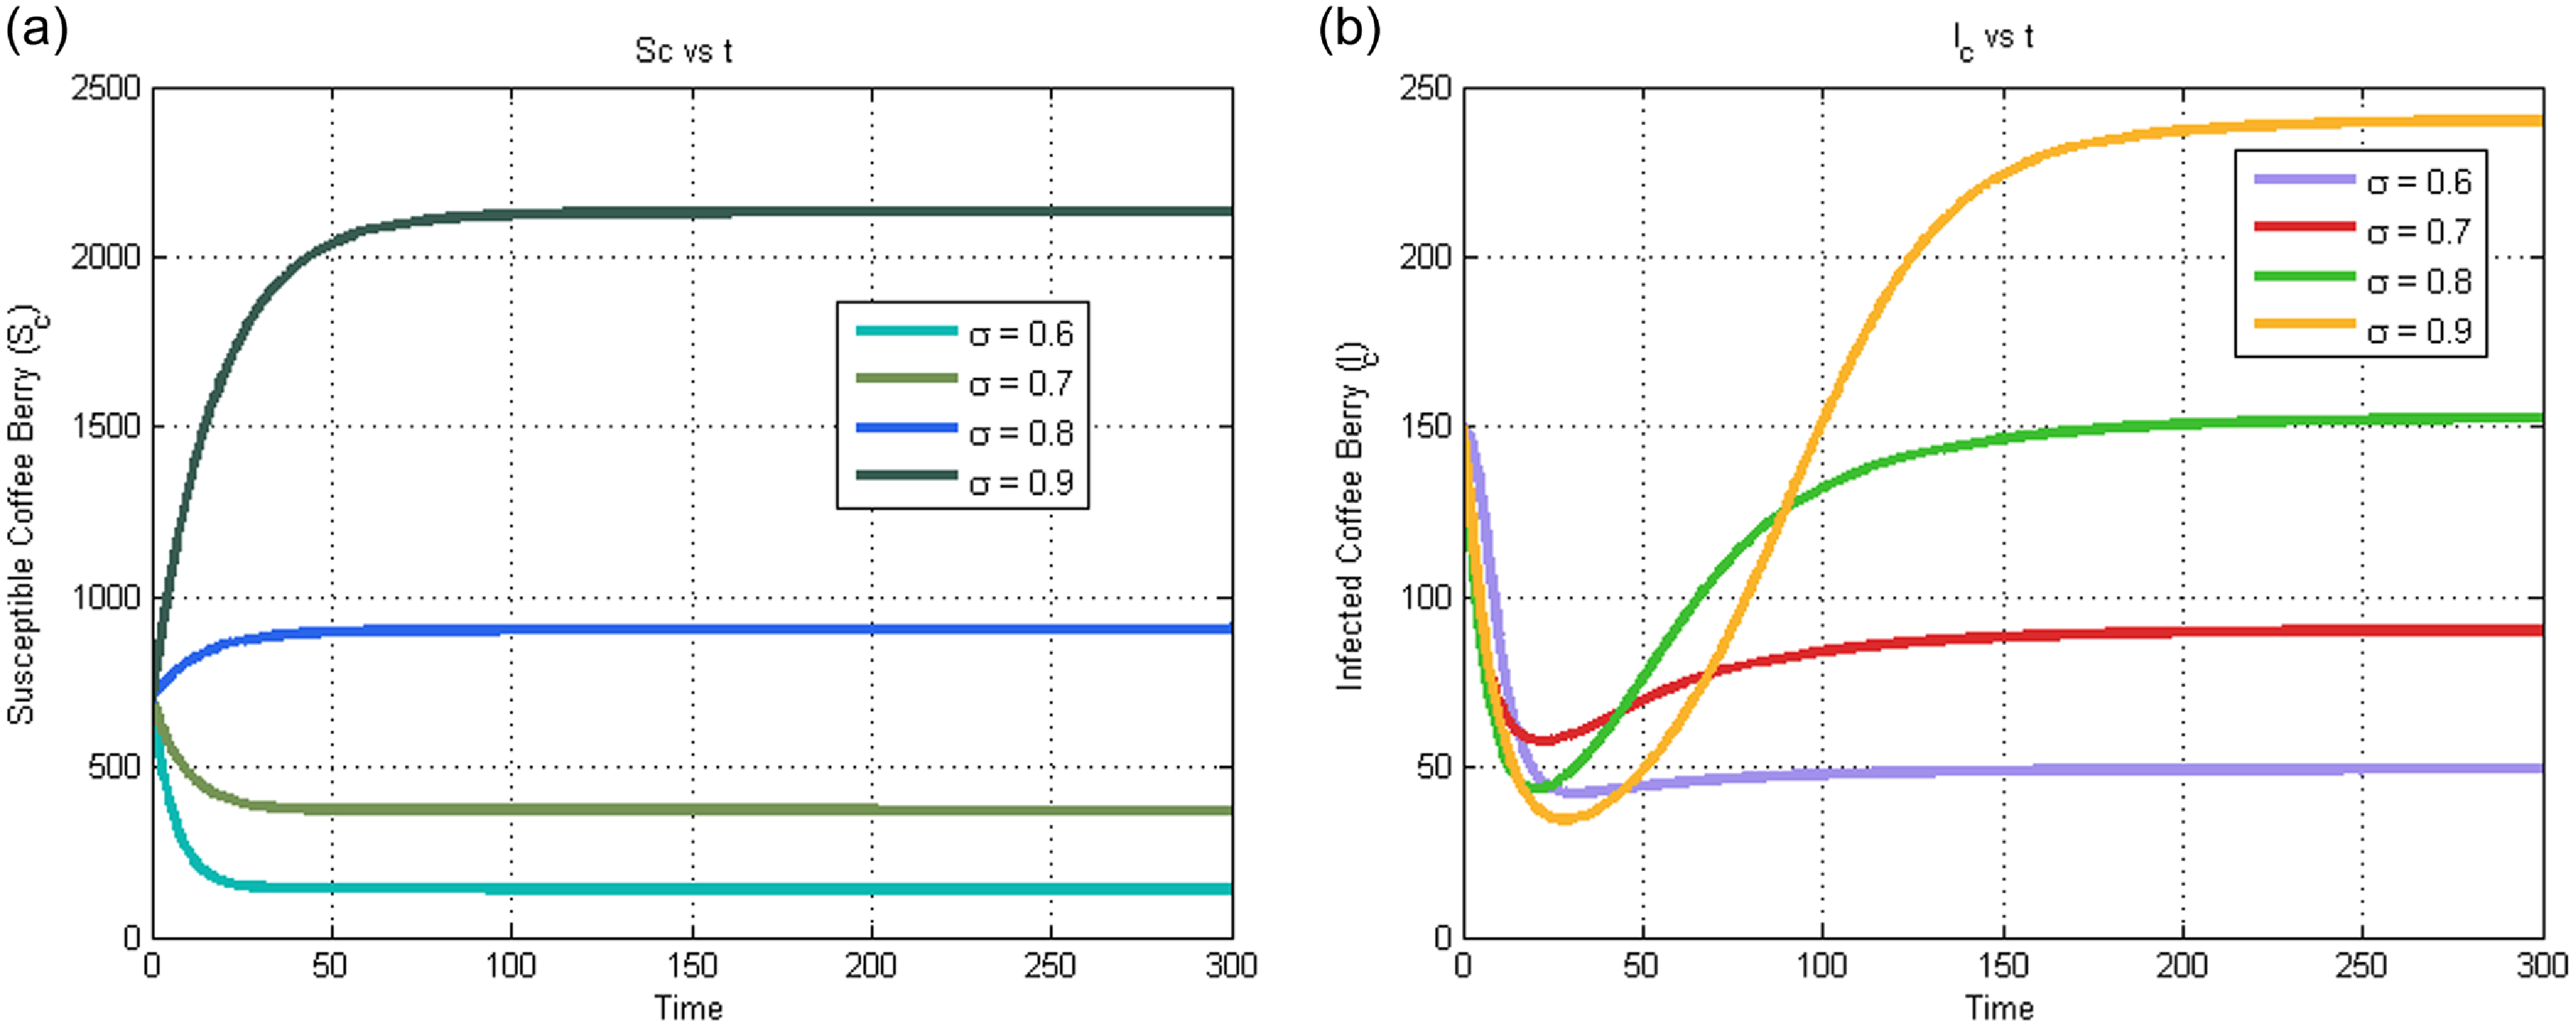
Total number of susceptible and infected coffee berry with different values of $\sigma$
.
$\sigma$
.
Total number of susceptible and infected vector with different values of $\sigma$
.
$\sigma$
.
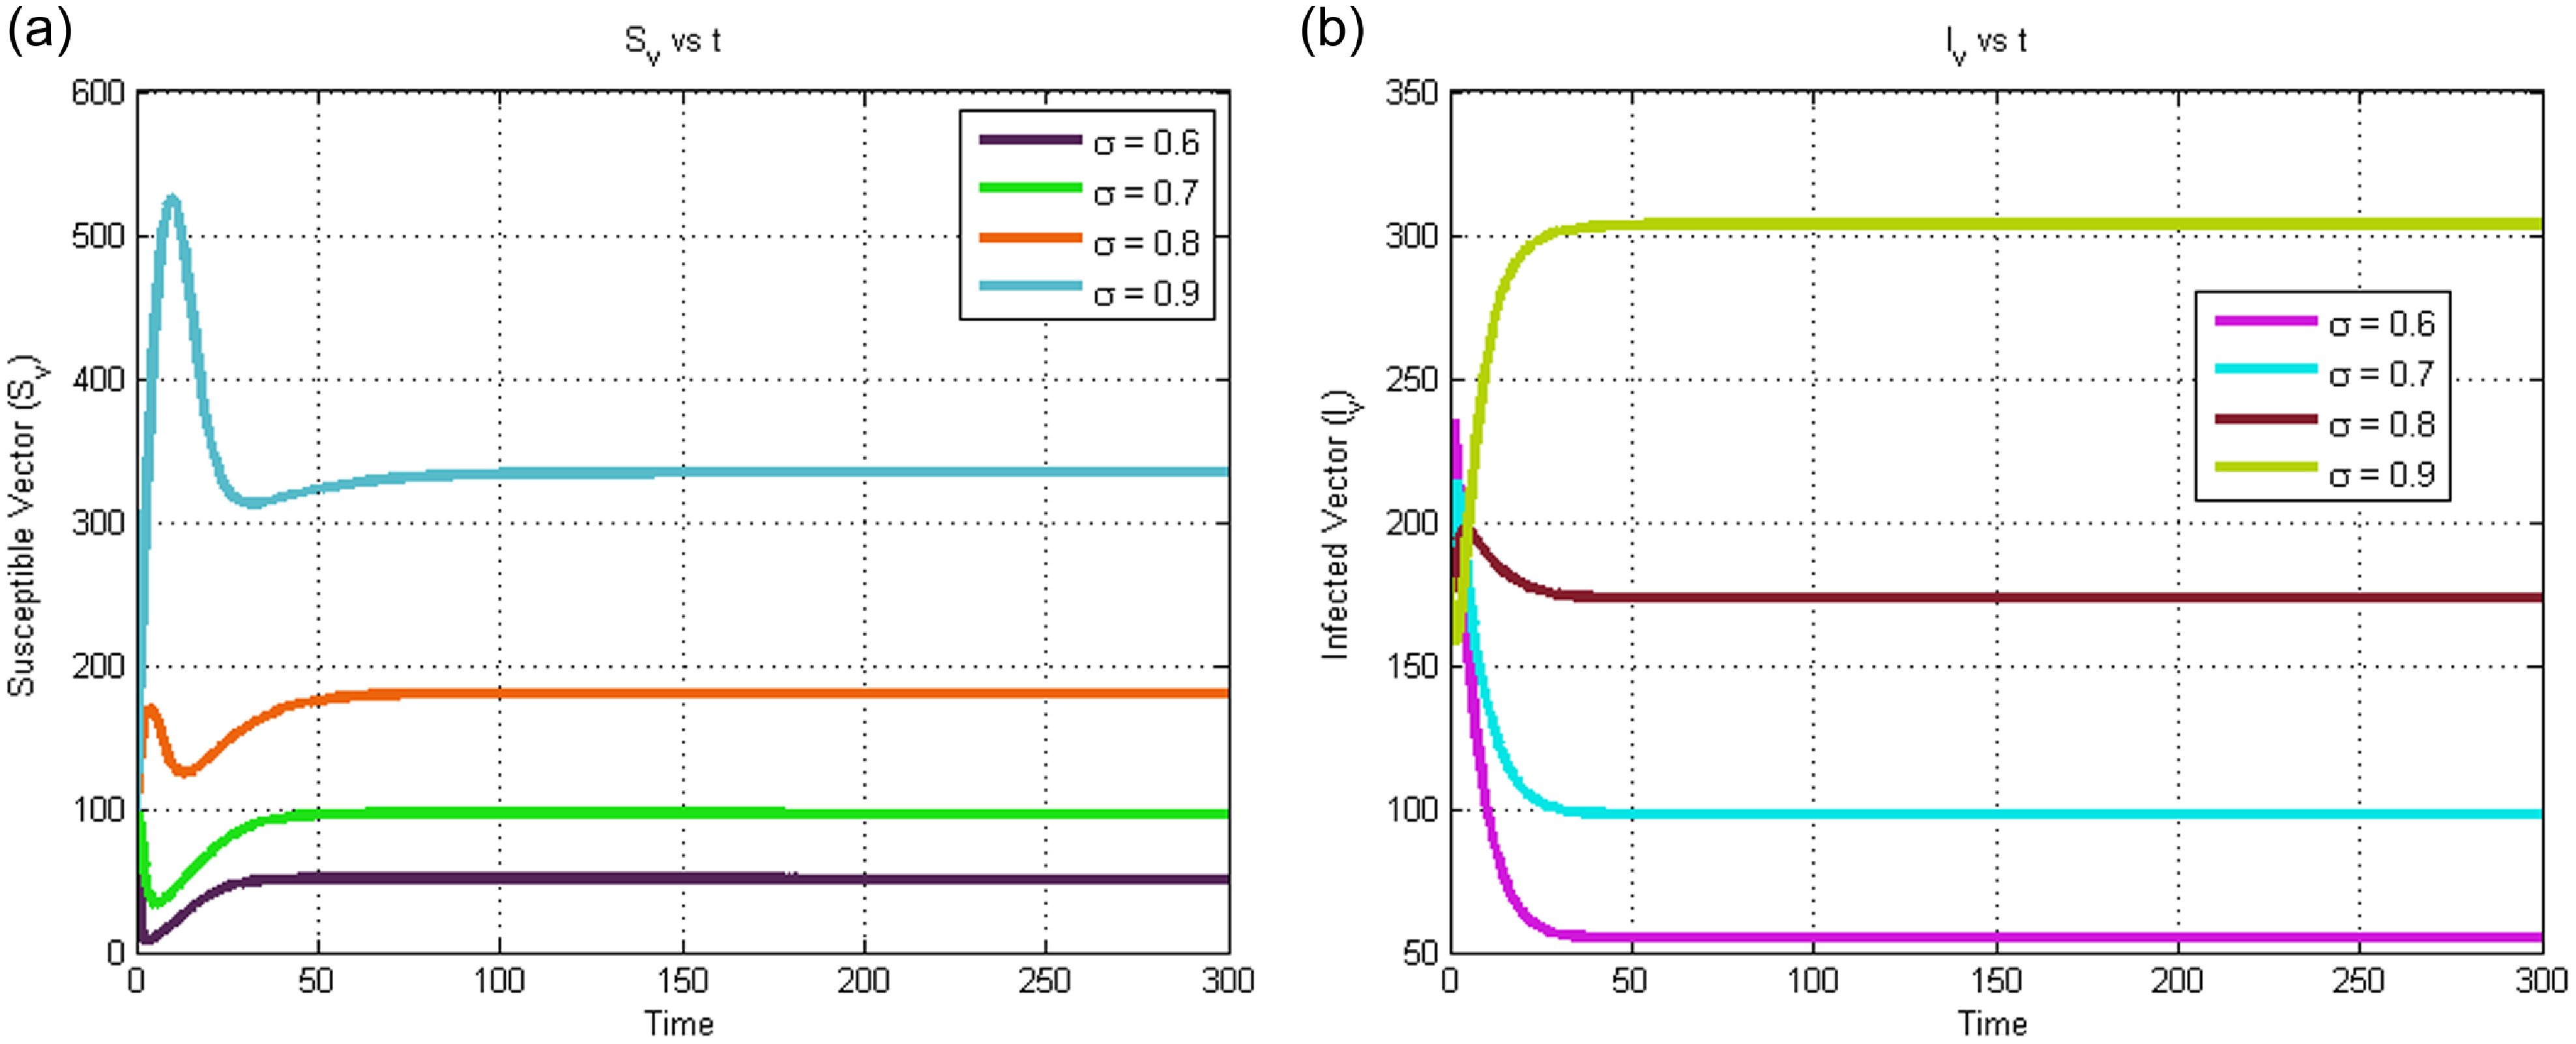
Figure 3 depicts how populations of susceptible coffee berries rise asymptotically to the disease-free equilibrium point, while those of infected coffee berries fall asymptotically to that point. The susceptible vector population increases asymptotically to the disease-free equilibrium point, whereas the infected vector population decreases asymptotically to the same equilibrium point. In this case, the disease might ultimately go away in the long run. The fact that $R_{0}=0.0442$
, which is less than one, accounts for the existence of such a condition. This indicates the theorem that the stability of the disease-free equilibrium point occurs when
$R_{0}=0.0442$
, which is less than one, accounts for the existence of such a condition. This indicates the theorem that the stability of the disease-free equilibrium point occurs when $R_{0} \lt 1$
; that is, if
$R_{0} \lt 1$
; that is, if $R_{0} \lt 1$
, then on average, one infected coffee berry produces less than one newly infectious coffee berry over the course of its disease period. Figure 4 demonstrates how the number of susceptible coffee berry and vector decreases as a result of the influence of infected coffee berry and vector people, after which they join the infected class, leading to an increase in infected coffee berry and vector. As a result, the number of infected coffee berries and vectors is rising, and the disease’s endemic equilibrium point is both present and stable. The fact that
$R_{0} \lt 1$
, then on average, one infected coffee berry produces less than one newly infectious coffee berry over the course of its disease period. Figure 4 demonstrates how the number of susceptible coffee berry and vector decreases as a result of the influence of infected coffee berry and vector people, after which they join the infected class, leading to an increase in infected coffee berry and vector. As a result, the number of infected coffee berries and vectors is rising, and the disease’s endemic equilibrium point is both present and stable. The fact that $R_{0} = 5.3244$
, which is greater than one, proves that this condition exists. This demonstrates the theorem that disease endemic equilibrium points are stable when
$R_{0} = 5.3244$
, which is greater than one, proves that this condition exists. This demonstrates the theorem that disease endemic equilibrium points are stable when $R_{0}\gt 1$
; that is, if each infected coffee berry and its vectors produce, on average, more than one new infected coffee berry and vector, then the disease can spread in the specified area. Figure 5a demonstrates how decreasing the number of coffee berries
$R_{0}\gt 1$
; that is, if each infected coffee berry and its vectors produce, on average, more than one new infected coffee berry and vector, then the disease can spread in the specified area. Figure 5a demonstrates how decreasing the number of coffee berries $(S_{c})$
that are susceptible results from increasing the fractional order
$(S_{c})$
that are susceptible results from increasing the fractional order $(\sigma )$
from 0.04 to 1.00. Figure 5b demonstrates how increasing the fractional order
$(\sigma )$
from 0.04 to 1.00. Figure 5b demonstrates how increasing the fractional order $(\sigma )$
from 0.04 to 1.00 results in an increase in the number of infected coffee berries
$(\sigma )$
from 0.04 to 1.00 results in an increase in the number of infected coffee berries $(I_{c})$
. According to Figure 6a, the number of susceptible vector populations
$(I_{c})$
. According to Figure 6a, the number of susceptible vector populations $(S_{v})$
decreases as fractional order
$(S_{v})$
decreases as fractional order $(\sigma )$
, increases from 0.04 to 1.00. The fractional order
$(\sigma )$
, increases from 0.04 to 1.00. The fractional order $(\sigma )$
is shown in Figure 6b to increase from 0.04 to 1.00, which results in an increase in the population of infected vectors
$(\sigma )$
is shown in Figure 6b to increase from 0.04 to 1.00, which results in an increase in the population of infected vectors $(I_{v})$
. To put it another way, we can infer from Figures 5 and 6 that a reduction in
$(I_{v})$
. To put it another way, we can infer from Figures 5 and 6 that a reduction in $sigma$
results in a marked decrease in the number of
$sigma$
results in a marked decrease in the number of $I_{c}$
and
$I_{c}$
and $I_{v}$
cases. The curves for each compartment,
$I_{v}$
cases. The curves for each compartment, $I_{c}$
and
$I_{c}$
and $I_{v}$
, also compress as the value decreases from 1.00 to 0.04, as shown in the figures. Therefore, we can say that diseases in
$I_{v}$
, also compress as the value decreases from 1.00 to 0.04, as shown in the figures. Therefore, we can say that diseases in $I_{c}$
and
$I_{c}$
and $I_{v}$
decrease as one approaches zero from the right.
$I_{v}$
decrease as one approaches zero from the right.
More specifically, the memory effect of the dynamic system is increased when the derivative order is decreased from 1.00 to 0.04, which causes the infection in each compartment to gradually worsen over time. As a result, we can infer from the results that lowering the derivative’s fractional order significantly slows the growth of crop infections and that lowering it to zero produces no change in rate of change. If the disease’s rate of spread stays the same, the crop will produce. Because of this, the fractional order will be higher than 0. The role of farmer’s experience or knowledge of the history of the disease is also captured by the derivative order. The approximative findings support the notion that fractional order derivatives offer a wealth of dynamics and frequently express biological systems more effectively. The results allow us to draw the conclusion that lowering the derivative’s fractional order significantly slows the growth of crop infections and that lowering it to zero produces no change in rate of change. If there is no change in the disease’s rate, the crop will produce. The fractional order will thus be higher than zero. Additionally, the derivative order captures the significance of farmer’s expertise or familiarity with the disease’s past. The rough results show that fractional order derivatives have a lot of dynamics and have an ability to better represent biological systems.
8. Conclusion
In this study, we looked into an Atangana–Baleanu fractional derivative-based mathematical model for eco-epidemiology. We established the existence and uniqueness of the solution, asymptotic stability of the equilibria and the fundamental reproduction number ( $R_{0}$
). The findings of the study, the CBD-free equilibrium is locally and globally asymptotically stable if the basic reproduction number is less than one; however, if the basic reproduction number is greater than one, the coffee berry endemic equilibrium is locally asymptotically stable. According to the simulation results, the graphs flattened as the fractional derivative order was decreased from 1.00, and the disease progresses slowly for the susceptible class
$R_{0}$
). The findings of the study, the CBD-free equilibrium is locally and globally asymptotically stable if the basic reproduction number is less than one; however, if the basic reproduction number is greater than one, the coffee berry endemic equilibrium is locally asymptotically stable. According to the simulation results, the graphs flattened as the fractional derivative order was decreased from 1.00, and the disease progresses slowly for the susceptible class $(S_{c})$
. The graphs for compartments
$(S_{c})$
. The graphs for compartments $(I_{c})$
and
$(I_{c})$
and $(I_{v})$
demonstrate that the disease spreads gradually as the fractional order decreases, and the number of cases at maximum declines relatively. This noteworthy result is due to the fractional operator Atangana–Baleanu with the inherited assets. We claim that fractional models using the Atangana–Baleanu operator can shed more light on the hidden or actual characteristics of phenomena encountered in everyday life. As the order is decreased, we see a decrease in the number of cases as we display graphic results with various fractional orders. In the future study, the impact of other fractional operators like Caputo–Fabrizio fractional derivatives and comparisons with the ABC operator will be considered on the same model or other relevant models with optimal control.
$(I_{v})$
demonstrate that the disease spreads gradually as the fractional order decreases, and the number of cases at maximum declines relatively. This noteworthy result is due to the fractional operator Atangana–Baleanu with the inherited assets. We claim that fractional models using the Atangana–Baleanu operator can shed more light on the hidden or actual characteristics of phenomena encountered in everyday life. As the order is decreased, we see a decrease in the number of cases as we display graphic results with various fractional orders. In the future study, the impact of other fractional operators like Caputo–Fabrizio fractional derivatives and comparisons with the ABC operator will be considered on the same model or other relevant models with optimal control.
Data availability statement
All data generated or analysed during this study are included in this published article.
Competing interests
The authors declare that there is no conflict of interest.


 Open access

