

1. Introduction
Glaciologists are interested in the internal and basal structure of ice shelves and, in particular, in understanding their causes. The internal structure of ice shelves is a result of advection, flow, accumulation, basal melting/freezing and rupture. Layers that appear with high backscatter amplitudes originate from distinct changes in the dielectric properties of polycrystalline ice. These distinct dielectric characteristics might be created by acids of, for example, volcanic origin or an abrupt onset of anisotropy. If spatially extensive layers are deposited at the same time, they can be interpreted as isochrones.
As airborne surveys and field traverses are still sparse, remote sensing is a promising source for inferring internal structures. However, satellite-borne X-band radar sensors penetrate only the upper few metres of the ice and thus, over vast areas, only the upper firn layers. In-firn changes in dielectric properties also arise from densification and hence denser summer layers and wind crusts. Thus, the question arises to what extent one can infer the internal structure from remotely sensed observations of the surface only.
Backscattering of radar waves is highly sensitive to the incident angle and to the material properties, as well as the inclination of layers with distinct dielectric properties. Thus the idea arises that structures seen in radar imagery are mainly driven by the local surface topography. This can be studied using laser scanner data, which map the local surface topography. The result is horizontally limited, but yields high vertical resolution. Therefore, in this study we combine laser scanner data with radar imagery and radio-echo sounding (RES) to study the inferences one can draw from surface structures.
The Jelbart Ice Shelf covers an area of 11 000 km2 fringing Dronning Maud Land, East Antarctica (70.3–71.5° S, 3–6° W; Fig. 1). We chose this ice shelf for our investigation because it exhibits a large number of stripe-like features and an airborne campaign was achievable during a ferry flight. However, similar kinds of structures are seen on other ice shelves, such as Fimbulisen (Reference Humbert and SteinhageHumbert and Steinhage, 2011; Reference SinisaloSinisalo and others, 2013; Reference LangleyLangley and others, 2014) and the Larsen C ice shelf (Reference Luckman, Jansen, Kulessa, King, Sammonds and BennLuckman and others, 2012), and have been used to classify calving fronts (Reference Wesche, Jansen and DierkingWesche and others, 2014).
(a) Overview map of the Jelbart Ice Shelf (Jelbartisen), Antarctica; a TerraSAR-X scene from 9 November 2013 is superimposed on the RADARSAT mosaic. (b) Structures targeted within this study; the same TerraSAR-X scene as in (a) is shown. Both panels are in polar stereographic projection. The light blue line shows the RES profile and the dark blue line the ASIRAS survey flight both shown in Figure 2 (arrow denotes the orientation of the radargram in Fig. 2). The red frame marks the region shown in Figure 5.

The hypothesis of coincidence between the observed bottom and surface structures motivates our analysis of mechanisms through which initial bottom structures are transmitted to the surface of an ice shelf. In order to gain a better understanding of the mechanical processes involved, viscoelastic finite-element simulations are carried out using a Maxwell material model. Our comparison of the computed surface undulations with the observed surface data yields estimates of the timescales involved. Additional analyses of simplified geometries demonstrate the influences of geometric scales as well as material parameters, and indicate the time needed to reach hydrostatic equilibrium. We emphasize that although glaciologists often use the term basal crevasse for these structures, they are not cracks or even notches in a mechanical sense, and thus fracture mechanical concepts cannot be applied.
2. Database
In January 2014 a survey flight above the Jelbart Ice Shelf was carried out mapping a 43 km south–north-oriented transect up to the front of the ice shelf. The main instruments on the aircraft were a RES system for mapping the ice thickness and structure of the ice shelf and a laser scanner surveying the surface topography. Parallel to the airborne data, TerraSAR-X scenes of the area were acquired (Airbus Defence and Space, 2014). During a ferry flight in December 2014, we had the chance to cover part of the profile again with an Airborne SAR (Synthetic Aperture Radar)/ Interferometric Radar Altimeter System (ASIRAS). The two flight tracks are shown in Figure 1.
2.1. Laser scanner
The digital elevation model (DEM) used in the study has a pixel size of 10 m. It was derived from a point cloud (PC) with a point spacing of ∼1m of laser scanner data acquired with a RIEGL LMS-VQ580 instrument on board the science aircraft POLAR6 of the Alfred Wegener Institute. The laser scanner was operated simultaneously with the radar system 200 m above ground with a scan angle of 60°. This resulted in a scan width of 200 m and a mean point-to-point distance of ∼1 m. To determine the final calibrated and geo-referenced PC data we combined the raw laser data with the post-processed GPS trajectory, corrected for attitude and calibration angles. The GPS data were acquired at 50 Hz resolution with a Novatel OEMV receiver on board POLAR6. The GPS trajectory was post-processed using precise ephemerides and the commercial software package Waypoint 8.5 (Precise Point Positioning processing). At crossovers we calibrated the system and determined the elevation accuracy of the final geo-referenced PC to be better than 0.15 ± 0.1 m. The bias of <0.15 m varies along track and is due to the vertical accuracy of the post-processed GPS trajectory. In the last step, we interpolated the PC data to the final DEM using an inverse distance weighting (IDW) algorithm of all PC points within a 10 m radius of each pixel. The ellipsoidal heights of the DEM derived from the processed and gridded laser scanner data are converted into freeboard heights using the geoid EGM2008 (Reference Pavlis, Holmes, Kenyon and FactorPavlis and others, 2012).
2.2. Radio-echo sounding
To map the ice thickness and the structure of the ice shelf, a RES system was deployed, operating at 150 MHz and recording the envelope from 60 ns long bursts at a rate of 7.5 Hz. The basic concept and dynamic range of the RES system are described by Reference NixdorfNixdorf and others (1999).
The received signal is split into two with different amplitude settings for each, in order to cover the amplitude range from +10 dB down to −110 dB. A total of 1024 shots are stacked prior to recording, to improve the signal-to-noise ratio. For the data evaluation both channels are used. The shot separation in the processed sections is, on average, 10.9 m, varying because the air speed of the aircraft is kept constant, but not the speed over ground. The vertical resolution is ∼5 m. For interpretation the RES data are filtered and amplitudes are normalized, using different settings to account for the characteristics of the channels used. Since the aircraft was flown at a constant flight level along the profile, no static correction was applied to the RES section. Figure 2a shows the 43 km long RES profile used in this study. The orientation of the profile, which ends directly at the front of the Jelbart Ice Shelf, is close to true north (Fig. 1), so northing (in km) is taken as the x-axis.
(a) Extracted picks and layering revealed by the RES profile and associated radargram of the ice thickness radar ranging from 200 to 465 m. (b) Subset of the ASIRAS radargram across surface troughs.

2.3. Airborne SAR
ASIRAS is a Ku-band altimeter with SAR capability. It was operated 500 m above ground with a centre frequency of 13.5 GHz, a bandwidth of 1 GHz and a pulse repetition frequency of 3000 Hz. After the final SAR processing, the geo-referenced, retracked elevation product samples the surface topography every 3 m with an accuracy of ∼0.1 m. ASIRAS is able to penetrate the top 20 m of dry snow and can resolve internal layering (Reference Hawley, Morris, Cullen, Nixdorf, Shepherd and WinghamHawley and others, 2006; Reference HelmHelm and others, 2007). Even though surface melting occurs occasionally at the northern edges of the ice shelves fringing Dronning Maud Land, firn layering is still preserved and can be mapped using ASIRAS to determine temporal and spatial changes of accumulation rates.
A single altimetric waveform, also termed radar trace, consists of 256 samples. The sample rate is 0.732 ns, corresponding to ∼0.08 m in snow, using a velocity of 0.22 m ns−1. For the current work each waveform was retracked at the leading edge of the first maxima using the Threshold-First-Maximum-Retracker-Algorithm (TFMRA) (Reference Helm, Humbert and MillerHelm and others, 2014). Subsequently, all waveforms were aligned to remove altitude changes of the aircraft and topography. The resulting radargram was converted to a standard seismic format (segy). This radargram (Fig. 2b) was interpreted with the commercial seismic software package ECHOS. Due to bad flight conditions, only part of the profile flown in January 2014 could be repeated in December 2014, so the extents of the RES and ASIRAS profiles are not the same.
2.4. Satellite-borne SAR
We used six SAR images, acquired by the two German Earth observation satellites TerraSAR-X and TanDEM-X (TSX/TDX). Both satellites operate in X-band at a frequency of 9.65 GHz. An overview of the data basis is given in Table 1. Two stripmap mode (SM) scenes in ascending and descending orbit were acquired simultaneously with the airborne campaign on 2 February 2014. The data were delivered by the German Aerospace Center (DLR) as a L1b product.
Overview of the TSX/TDX X-band scenes used in this study in either stripmap mode (SM) or ScanSAR mode (SC), ascending (A) or descending (D), with a radiometric accuracy (RA) either spatially enhanced (SE) or radiometrically enhanced (RE) processed EEC level 1B product. For details on EEC processing see Airbus Defence and Space (2014)
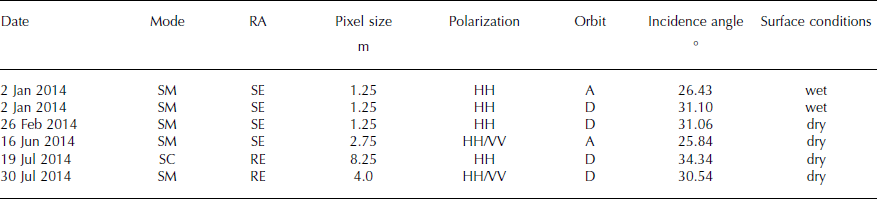
In this study we use only the amplitude of the radar backscatter signal. This enhanced ellipsoid corrected (EEC) product is already multilooked and has a pixel size in SM of 1.25 m (single polarization), 2.75 m (dual polarization) and 8.25 m (single polarization) in ScanSAR mode (SC). The calibrated radar brightness β 0 = ks · |DN|2 was calculated by applying a calibration factor (ks ) on the digital numbers DN of the EEC product (Reference InfoterraInfoterra GmbH, 2014). The factor ks was delivered by the DLR and takes into account all perturbing influences on the radiometric values. To correct for the influence of the variation of the local incidence angle (Θloc), a geocoded incidence-angle mask (GIM), supplied by DLR, was used to determine σ 0 = β 0 · sin Θloc.
3. Methods
3.1. Analysis of geometry and structures by means of RES, ASIRAS and laser scanner
We use different datasets to acquire information on the structures seen in radar imagery, beginning with the geometry of the transect along the flight path. In the RES data, surface reflections are determined automatically. All subglacial reflections are manually picked and cross-checked. The strongly μ subglacial topography and hyperbolas caused by subglacial crevasses made picking subglacial reflections very difficult and did not allow further stacking.
To calculate the ice thickness, and the depth below the surface of a feature, the two-way travel time (twt) was converted using the local velocity of the electromagnetic waves in ice, based on the empirical relationship by Reference Kovacs, Gow and MoreyKovacs and others (1995), and a mean density derived by calculating the local density. The mean density can also be estimated using the density–depth relationship of Reference Herron and LangwayHerron and Langway (1980) and the accumulation rate and mean annual temperature of the Regional Atmospheric Climate Model (RACMO) (Reference Van WessemVan Wessem and others, 2014).
Even though ASIRAS is built for radar altimetry, it allows mapping of internal layering at shallow depth, and snow layer thickness, and thus allows a closer look at the most recent accumulation distribution. For picking snow layers, the data were resampled to 1 ns. Thus the vertical resolution decreases to 0.11 m. In order to estimate the spatial variability of the accumulation distribution along the profile, we tracked an isochrone, visible as a bright reflector in Figure 2b. The isochrone depth h ic was calculated from the twt using a velocity of 0.22 m ns−1.
Applying the laser scanner based surface elevation and the ice thickness from RES, we can estimate the mean density of ice assuming a local hydrostatic equilibrium. This allows us to estimate the thickness of the firn layer and the time the radar signal travels through the firn based on the radar wave velocity as a function of density. The remaining part of the observed twt results from the radar wave propagation through consolidated ice for which we assume a density of 917 kg m−3. In the following the evaluated mean density is referred to as ![]() . Comparing the two independently derived mean densities allows us to assess how likely it is that the ice shelf is in local hydrostatic equilibrium.
. Comparing the two independently derived mean densities allows us to assess how likely it is that the ice shelf is in local hydrostatic equilibrium.
3.2. Comparison to radar imagery
The main purpose of the comparison of radar imagery to RES is to assess whether the radar imagery can be used to infer basal structure. As the backscatter signal contains a spatially shortwave signal originating from speckle, we used the EEC product combined with a bicubic-spline interpolation applying the software gdal (gdal.org) onto different pixel resolutions 12.5 m, 30 m and 70 m, as well as filtering with a L2 norm. To understand to what extent the backscatter signal is influenced by both the surface topography and the physical structure of the firn, which is penetrated by the TSX signal, we compare the correlation of the radar backscatter to surface elevation and inferred density. This comparison is performed by analysing a cross section along the flight track of σ 0 and the laser scanner DEM. For this purpose we interpolated the data onto the same grid as we used for the TSX data given above. Additionally, we calculate the Pearson correlation coefficient between the two datasets. To this end, we detrended the surface elevation by subtracting a linear trend, as the backscatter signal does not depend on the absolute height.
In order to understand the nature of the scattering and to infer whether volume or surface scattering is predominant, we use dual-polarized radar imagery and investigate the difference between HH and VV backscatter intensities. In the case of the dominance of volume scattering, the different polarization modes are similar; however, examples in the literature show that even pure surface scatter arising from surface roughness might have similar backscatter in HH and VV modes (Reference Liang, Xu, Tsang, Gui and ChenLiang and others, 2009).
For this purpose, one ascending and one descending scene were acquired. The multilooking capability of the DLR TerraSAR Multimode SAR Processor (TMSP) (Reference Breit, Fritz, Balss, Lachaise, Niedermeier and VonavkaBreit and others, 2010) was used in this case and further speckle reduction performed by bicubic spline interpolation to 12.5 m, 30 m and 70 m. Besides the magnitude of the difference |HH − VV|, we also compute a composed image. The composed image contains three channels, in which red is the full σ 0 range of HH, green the same for VV and the blue channel is the full range of |HH − VV|, each mapped onto 0–255. For this analysis we compare a subset of the scene in an area where the flight was located with cut-off pixels of the scene margin, so that the range in σ 0 is determined by the structures of the ice itself and not of artificial effects.
3.3. Viscoelastic modelling
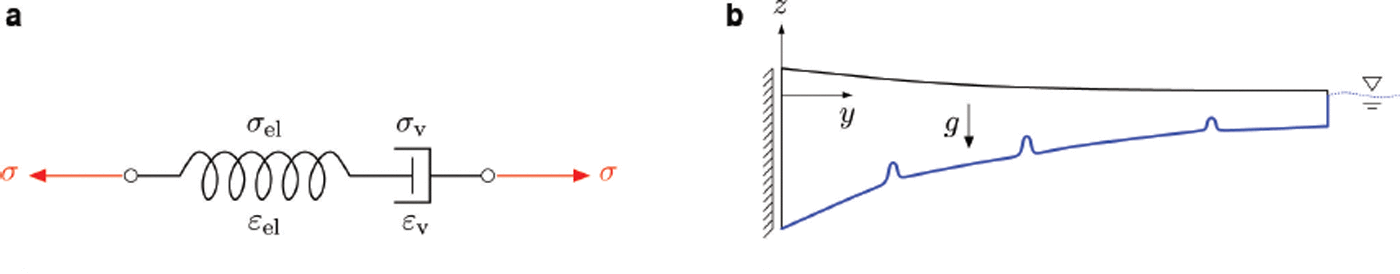
Besides data analysis we employ numerical modelling to understand the ice-shelf structure. Polycrystalline ice in ice shelves behaves as a viscoelastic material (Reference GudmundssonGudmundsson, 2011), with an elastic response to load on short timescales and a viscous response on long timescales. Here we intend to investigate the viscoelastic surface displacement as a response to changes in the ice thickness due to bottom structures, i.e. basal notches or meltwater channels. To this end, we assume a Maxwell material model. The model solves for the displacement field and yields the velocities, if desired, as time derivatives of the solution. Reference BeyerBeyer (2014) used a related model directly solving for the ice-shelf velocities. A comparable approach for the evaluation of deviatoric stresses due to subglacial channels in Pine Island Glacier, Antarctica, using a linear viscous finite-element (FE) model was published by Reference VaughanVaughan and others (2012). The one-dimensional (1-D) representation of our rheological model consists of a linear elastic spring and a viscous dashpot, with constant viscosity, connected in series (Fig. 3a). The timescale at which either the viscous or the elastic response dominates is determined by the material parameters. Loaded by a constant force, the model instantaneously reacts with a constant elastic strain, which is accompanied by an increasing viscous strain as time passes. The total strain in a 1-D representation is given by ε = ε el + ε v. For simplicity, geometric linearity is also assumed, and only small strains are considered. Equilibrium considerations for the Maxwell model yield equal stresses in the dashpot and the spring, i.e. σ = σ el = σ v. This behaviour can be extended to a three-dimensional (3-D) setting. For the viscoelastic implementation the stress and strain tensors are decomposed into a volumetric and deviatoric part, denoted by the superscript (·) D ,
(a) Rheological model of the Maxwell material. (b) Simplified model geometry showing the applied boundary conditions.
The volumetric part of the stress tensor is determined by the elastic deformation, and only the deviatoric stress is affected by the viscoelastic response (Reference Altenbach and AltenbachAltenbach and Altenbach, 1994). Therefore, the equations of the Maxwell material model are formulated in the deviators and read
The constitutive relation is finally given by
where E and v denote the elastic material parameters, Young’s modulus and Poisson’s ratio, respectively. These elastic parameters yield a shear modulus ![]() and the viscosity η. The differential equation for the simulation of the stress deviator reads
and the viscosity η. The differential equation for the simulation of the stress deviator reads
and is solved together with the equilibrium condition
where f denotes volume forces, such as gravity. The nature of the plug flow regime allows us to further simplify the general 3-D equations using plane strain assumptions. The non-trivial partial differential equations of the equilibrium now read
with the ice density ρ ice and the gravity g. Figure 3b represents a general sketch of the model geometry and the applied boundary conditions. The horizontal displacement at the upstream vertical boundary is fixed. The ice draft as well as the bottom of the domain are loaded by a depth-dependent Robin-type water pressure
indicated in blue in Figure 3b.
Since the focus of this study is the analysis of the mechanical displacements due to the redistribution of stresses and strains, we neglect the contribution of basal melting and surface accumulation. For the same reason we omit the thermomechanical dependence of the viscosity. A Maxwell model applying a temperature and strain-rate dependent viscosity for the problem of grounding line migration can be found in Reference BeyerBeyer (2014). The domain is meshed using triangular finite elements with quadratic and cubic shape functions. The problem is solved using the commercial FE software COMSOL (comsol.org).
4. Results
4.1. Structural characteristics
The ice thickness decreases from nearly 450 m at the southern end of the profile of the Jelbart Ice Shelf to ∼200 m at the ice front. Roughly half the decrease in ice thickness occurs north of three rifts (around y = 2185 km in Fig. 2a) over a distance of 6 km. The lower surface of the ice shelf is more undulated than the upper surface, and the amplitudes are in the order of 30–50 m. Hyperbolas with apexes ∼100 m above the lower surface, and increasing height from south to north, indicate subglacial crevasses. While the height of the crevasses is difficult to pick, it is not possible to determine the width accurately or even to find out whether one sees one wide or two narrow crevasses.
The RES profile reveals very little internal structure of the ice sheet. No continuous internal layering could be mapped in the profile. Only in the southern part of the profile could segments of layering at ∼90–150 m depth be traced. The end points of the segments coincide with troughs mapped by the Airborne Laser Scanner. Even though the layering is interrupted frequently, no hyperbolas, which would indicate the existence of crevasses, occur in the upper third (vertically) of the ice shelf. No clear structure is resolved in the middle and lower third of the ice shelf. The base itself is very rough. Since the changes in ice thickness cause artificial structures, continuous picking of the lower boundary along the profile up to the southern rift is not possible. The distance between the manually picked basal reflections varies between the shot separation and ∼310 m.
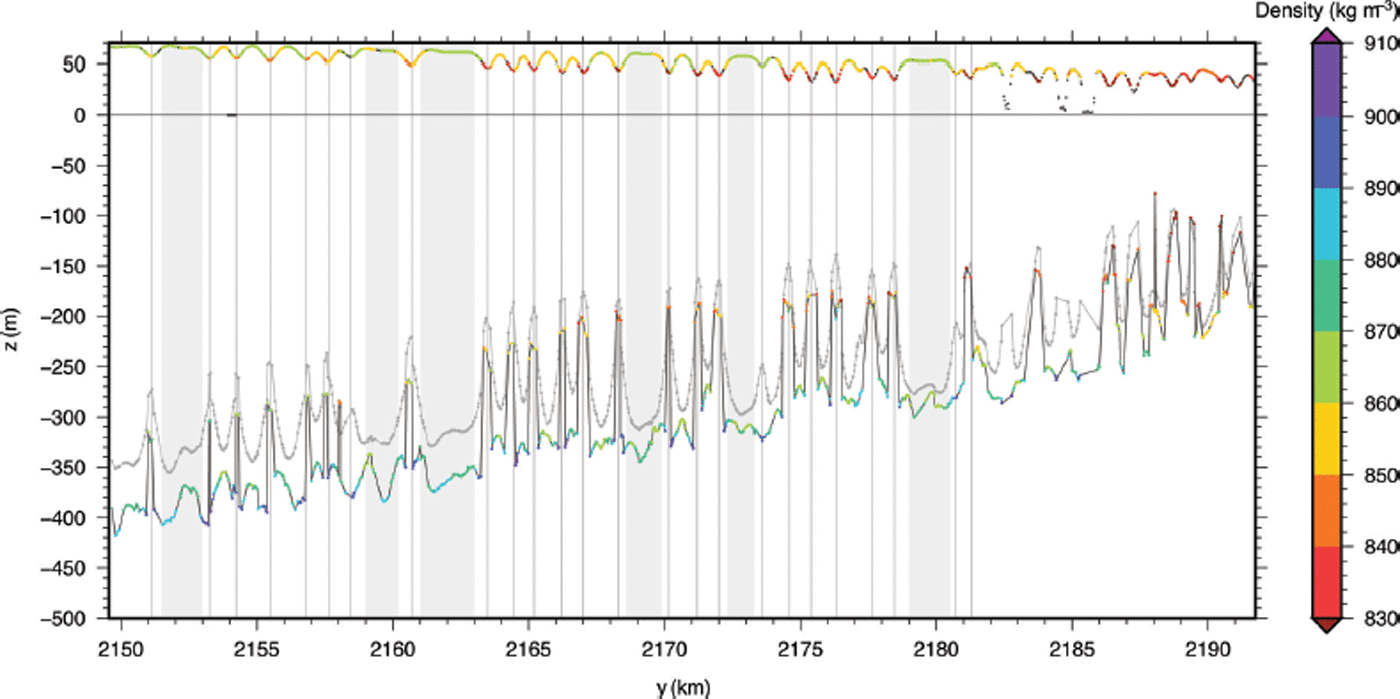
The profile of the surface elevation shown in Figure 4 exhibits a general trend of the ice-shelf surface lowering due to ice dynamics. The surface elevation decreases from 67 m a.s.l. at the southern end of the profile to ∼40 m a.s.l. at the ice front. The profile runs across three large rifts approximately 10, 8 and 7 km south of the ice front. The width of these, very likely with sea-ice filled rifts, is 300–500 m. Short-range surface undulations exhibit surface troughs with a depth of up to 15 m, spaced irregularly at 1000–1200 m intervals. The slope of the crests is ∼0.05%. There are six areas without surface undulation and matching continuous basal reflections. These areas are marked with light grey bars in Figure 4. The local minima in the surface troughs are marked as vertical grey lines. Along with the surface topography the mean density estimated from twt, ![]() , is shown as coloured dots wherever a basal reflection is found.
, is shown as coloured dots wherever a basal reflection is found. ![]() ranges from 870 to <830 kg m−3. Higher densities are found at non-undulated surfaces and low densities in the troughs. Using
ranges from 870 to <830 kg m−3. Higher densities are found at non-undulated surfaces and low densities in the troughs. Using ![]() and the hydrostatic equilibrium condition, we estimated where the ice-shelf base would be expected if the assumption was correct. This location is marked as pale grey dots connected by a pale grey line. The ice-shelf base, estimated by subtracting the ice thickness from h
s, is shown in Figure 4 in combination with the mean density
and the hydrostatic equilibrium condition, we estimated where the ice-shelf base would be expected if the assumption was correct. This location is marked as pale grey dots connected by a pale grey line. The ice-shelf base, estimated by subtracting the ice thickness from h
s, is shown in Figure 4 in combination with the mean density ![]() , based on the hydrostatic equilibrium, as coloured dots connected with a dark grey line.
, based on the hydrostatic equilibrium, as coloured dots connected with a dark grey line. ![]() is almost everywhere larger than
is almost everywhere larger than ![]() ; however, the general trend is similar, with lower mean densities in the troughs. Along the profile, the difference
; however, the general trend is similar, with lower mean densities in the troughs. Along the profile, the difference ![]() de-creases, and in the northernmost non-undulated area both densities nearly match. The locations of the surface troughs coincide with maxima in the basal topography at all locations except one (y = 2173.5 km). The shape of the observed lower surface in the grey shaded areas is relatively similar to that estimated from the hydrostatic equilibrium, except at y = 2159 km.
de-creases, and in the northernmost non-undulated area both densities nearly match. The locations of the surface troughs coincide with maxima in the basal topography at all locations except one (y = 2173.5 km). The shape of the observed lower surface in the grey shaded areas is relatively similar to that estimated from the hydrostatic equilibrium, except at y = 2159 km.
Comprehensive view of the geometry and structure of the Jelbart Ice Shelf along the cross section of the airborne survey. Shown are the surface topography derived from airborne laser scanning, and the ice-shelf/ocean interface derived from our picked ice thicknesses. For each thickness pick, the mean density ![]() was calculated using the local height and plotted colour coded on top of the surface graph. The pale grey line below represents the subglacial interface if the ice shelf were in hydrostatic equilibrium. The coloured dots on top of the subglacial interface represent the mean density
was calculated using the local height and plotted colour coded on top of the surface graph. The pale grey line below represents the subglacial interface if the ice shelf were in hydrostatic equilibrium. The coloured dots on top of the subglacial interface represent the mean density ![]() required if the ice shelf were in hydrostatic equilibrium. These densities are mostly higher than that derived using the mapped surface topography. Only in the troughs are the densities of comparable range.
required if the ice shelf were in hydrostatic equilibrium. These densities are mostly higher than that derived using the mapped surface topography. Only in the troughs are the densities of comparable range.
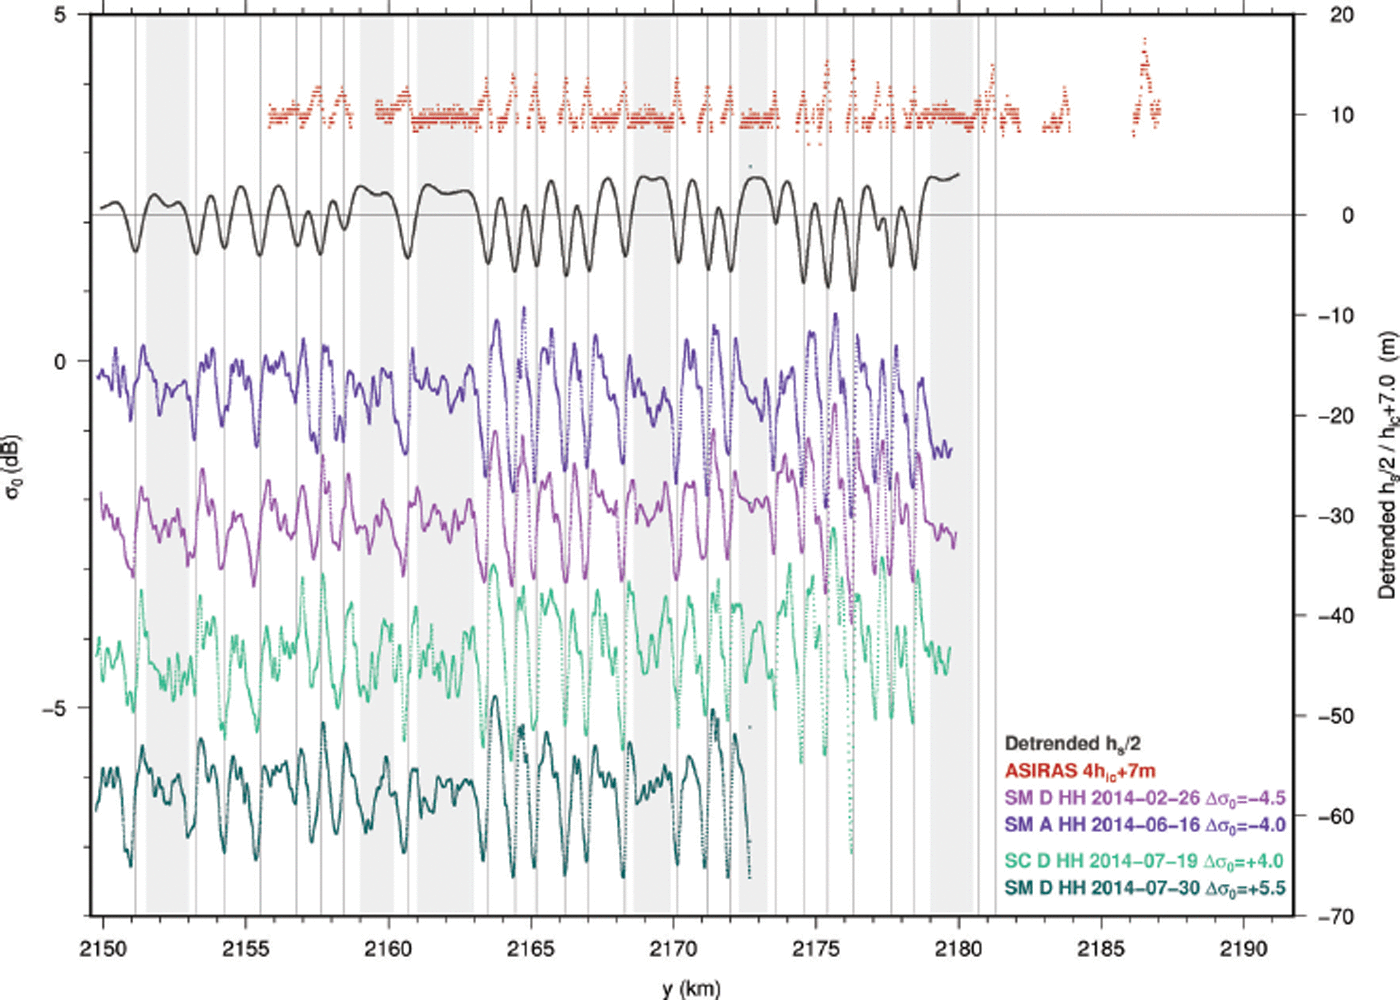
The ASIRAS radargram was used to determine variations in the accumulation rate. The depth of the second isochrone h ic, visible in Figure 2b as a bright horizon, ranges from 0.22 to 2.64 m in the part of the transect covered by ASIRAS. The resulting h ic was scaled and shifted for visibility purposes and is displayed in Figure 5 in red. While there is a small-scale variation of h ic, a clear increase in h ic occurs repeatedly. This increase coincides with troughs of the surface shown in the same diagram, the detrended surface in black and the picks as red dots. The local minima of the troughs are marked with vertical thin black lines. All locations of high h ic match a trough in the surface; even a small one at y = 2177 km is linked to a higher h ic.
Profile of h ic, detrended h s and σ 0 in HH polarization in 70 m resolution (bicubic spline interpolation). The latter are shifted for visibility purposes. Surface troughs are marked as thin vertical lines, undisturbed basal reflection as light grey bars.
In Figure 6 the freeboard elevation h s is displayed along with σ 0 for different scenes (Table 1) at a pixel size of 70 m, including HH, as well as VV, polarization. The ascending scene from 2 January 2014 exhibits low σ 0 values indicating a wet surface. This is even more pronounced in the descending scene of the same day, which is in the range –16.7 to −14.4 dB and hence outside the range shown in the diagram. At 26 February 2014, i.e. at the end of summer, the backscatter is also significantly reduced, leading us to hypothesize that the surface was moist. All scenes from winter exhibit the same level of σ 0, demonstrating that the calibration is reliable. All scenes show a similar structure along this transect including small-scale variations of <0.5 dB and repeating minimum–maximum sequences. The small-scale variations are more pronounced at smaller pixel sizes (not shown here) and are likely speckle. There is no significant difference between HH polarization (shown in cool colours) and VV polarization (orange).
Along-track profile of TerraSAR-X backscatter σ 0 in 70 m resolution (bicubic spline interpolation; colours denote date, left vertical axis) and laser scanner data (dark grey, right vertical axis).
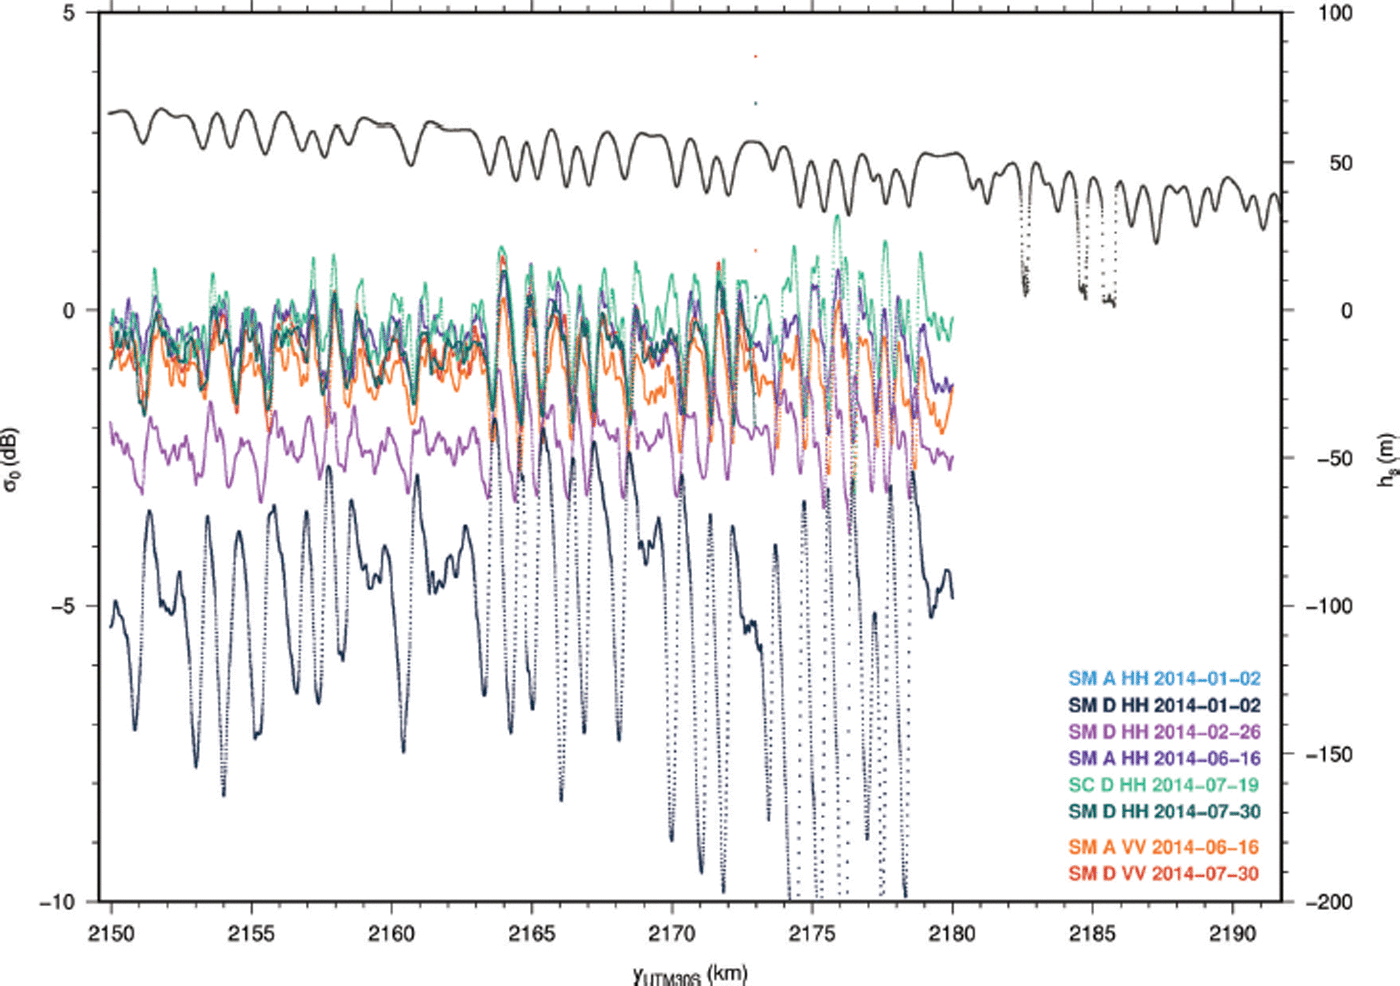
For a direct comparison of all datasets we corrected for ice flow velocities along the profile and aligned them to 2 January 2014. This has been done using the MEaSUREs dataset (Reference Rignot, Mouginot and ScheuchlRignot and others, 2011). The velocity vy ranges along the profile from 390 to 570 m a−1. The result is shown in Figure 5 for the detrended surface topography in dark grey, h ic in red, and in blueish colour σ 0 of scenes with frozen surface in HH polarization. In Figure 5, the grey shaded areas marking continuous bottom reflections, and thin grey lines indicating locations of surface troughs, are shown similar to Figure 4. Comparing the detrended surface to σ 0 we find that the minima in the surface h s never exactly match the minima in σ 0, but vary slightly in position. Additionally, the shape of the σ 0 signal is asymmetric, so the downstream side always exhibits larger σ 0 than the up-stream side. This is visible in Figures 1 and 7 as stripes of different brightness on both sides of the dark stripes. To summarize, although both h s and σ 0 show sequences of local minima, the sequences are different in shape and location. The correlation coefficients along the transect (Fig. 5) between detrended h s and σ 0 are, in general, relatively low. With increasing pixel size, the correlations increase slightly, but never reach a range which one would consider for correlated datasets. Different filtering and interpolation techniques do not improve the correlations significantly. Shifting the radar scenes, taking an error in the geocoding into account, only slightly improves the correlation coefficient. The maximum correlation coefficient is found to be 0.3.
Comparison between HH and VV polarization. (a–e, g, i) Scene from 16 June 2014. (f, h, j) Scene from 30 July 2014.

Figure 7 displays the results of the comparison of the dual polarization modes. Figure 7a and b show HH and VV respectively of the same scene taken on 16 June 2014. The min/max range of the HH channel is −7.03/4.73 and for the VV channels −7.87/4.49, which is mapped in this plot to a greyscale of 0–255. The difference between the two channels is presented in three different resolutions in Figure 7c–e. The magnitude of the difference is shown in colour. This is completed by showing the difference in 70 m resolution for a descending scene in Figure 7f. The differences between the two channels are small and randomly distributed, showing no significant deviation in the areas of the surface structures. This holds true for all three resolutions. Figure 7g–j show colour composite images, and no difference between the two polarizations coincident with the structures is found.
4.2. Modelling
4.2.1. Single crevasses in ideal ice-shelf geometries
In order to gain a general understanding of the deformation response of structures representing crevasses or channels at the ice-shelf base of different form and size, a simplified geometry as shown in Figure 8a (subplot) is analysed.
(a) Bottom displacement due to a single crevasse of different width W. (b) Bottom displacement due to different material parameters E and η for W = 300 m. (c) Time-dependent surface displacement caused by three crevasses.
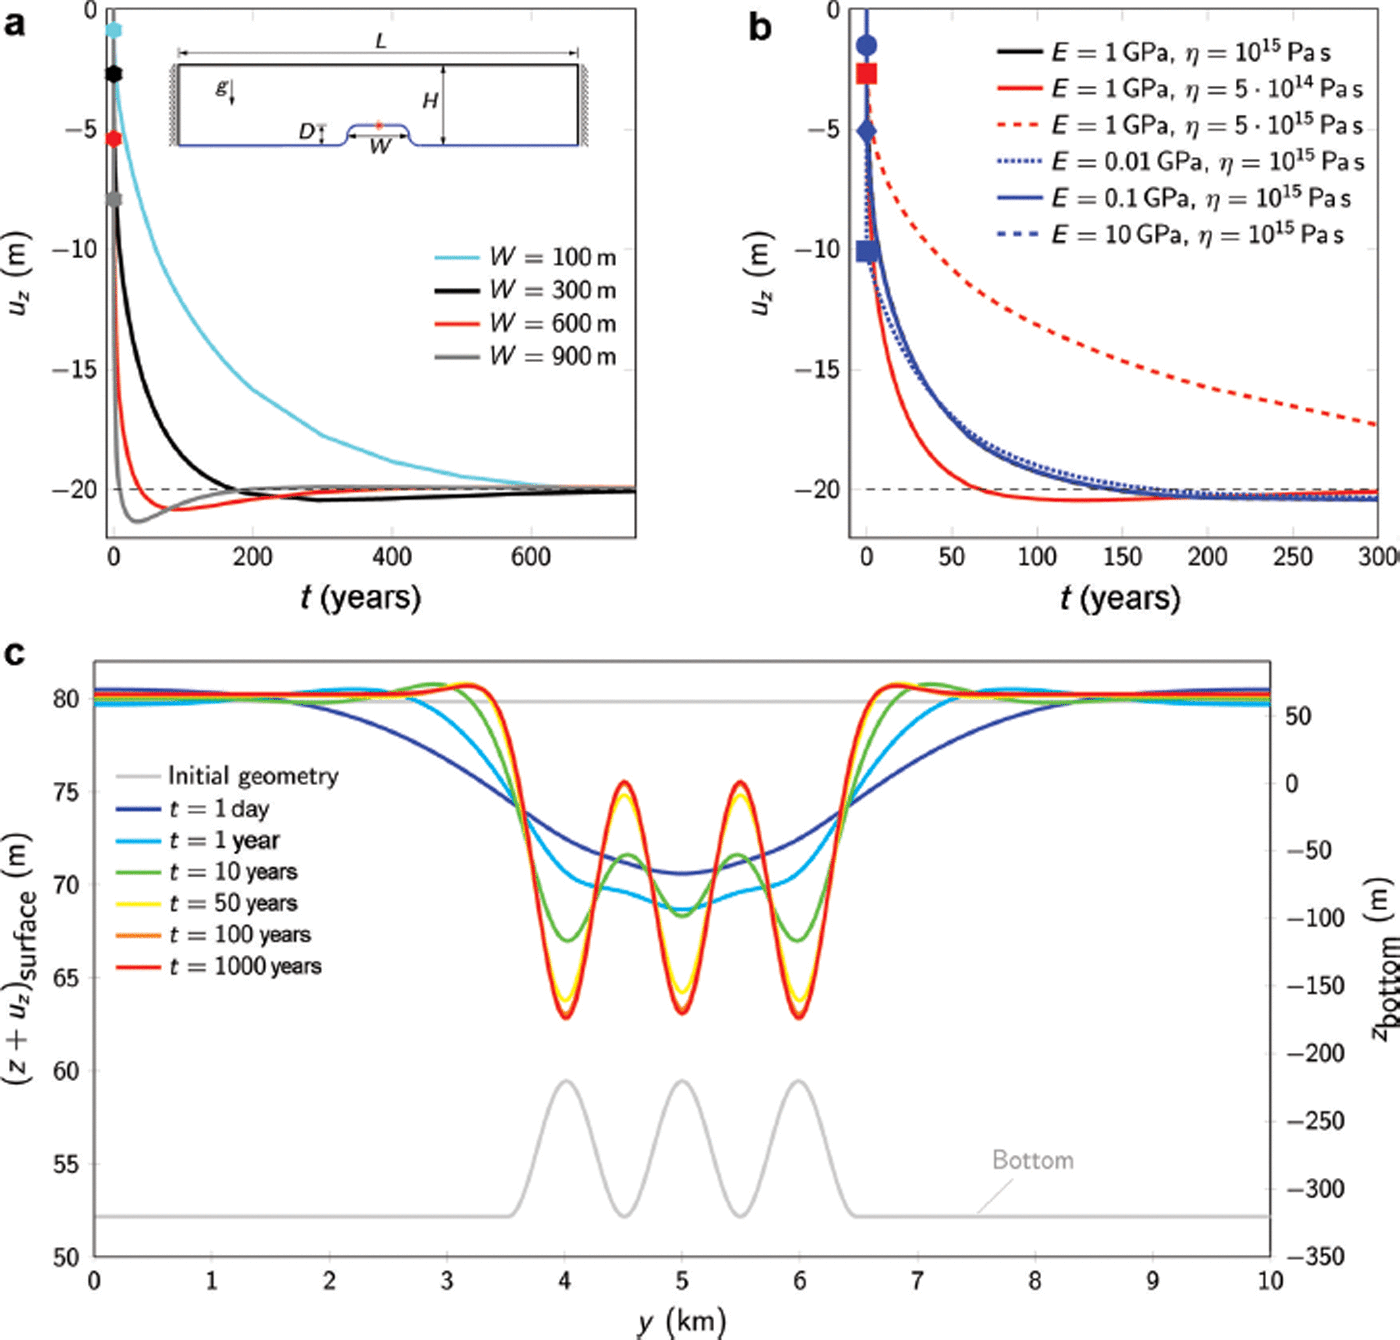
The geometric lengths and material parameters used are L = 10 km, H = 400 m, D = 100 m, ρ sw = 1027 kg m−3 and v = 0.499, representing an incompressible material behaviour. A constant ice density of ρ ice = 822 kg m−3 is applied in analogy to the setting in Section 4.2.3. In the first step, a viscosity and Young’s modulus of η = 1015 Pa s and E=1GPa are applied. Figure 8a shows the vertical displacements uz of the point marked in red in the inset versus time for different width W of the structure. The black dashed line represents the predicted vertical displacement uz at the bottom of the structure corresponding to local hydrostatic equilibrium for the given geometric parameters and densities. The coloured circles indicate the instantaneous elastic displacement for the respective width. It is observed that the width of the structure strongly influences the amount of elastic displacement and hence also the time needed to reach hydrostatic equilibrium at the ice-shelf bottom.
In the next step, the width of the structure is kept constant at W = 300 m and different viscosities and Young’s moduli are analysed. Figure 8b shows that increasing viscosity results in considerably longer times to reach steady-state conditions. The initial displacements for the different Young’s moduli E = 0.01 GPa, E = 0.1 GPa, E = 1 GPa and E = 10 GPa are indicated by a blue square, a blue diamond, a red square and a blue circle, respectively. It appears that a lower Young’s modulus of, for example, E = 0.01 GPa results in larger initial displacements uz at the surface but yields a slightly longer time to reach steady state. The results for E ≥ 108 GPa coincide with the black line. The following simulations are performed with E = 1 GPa and η = 1015 Pa s.
4.2.2. Multiple crevasses in ideal ice-shelf geometries
In the next step, the form of the cut-out is more closely related to realistic structures. Measurements of the surface elevation indicate bell-curve-like structures with an average distance of a = 1000 m. Figure 8c shows the bottom geometry (grey line) and the vertical surface displacement for three bell-shaped bottom structures in the middle of the idealized domain for different points in time. The almost elastic response after 1 day shows a strong deflection at the surface but cannot resolve the three distinct bottom structures which take more than a year to appear as clearly detectable features of the surface. After 100 years, the surface structure has become stationary, so the individual lines are visually not resolvable.
4.2.3. Surface displacement at the Jelbart Ice Shelf
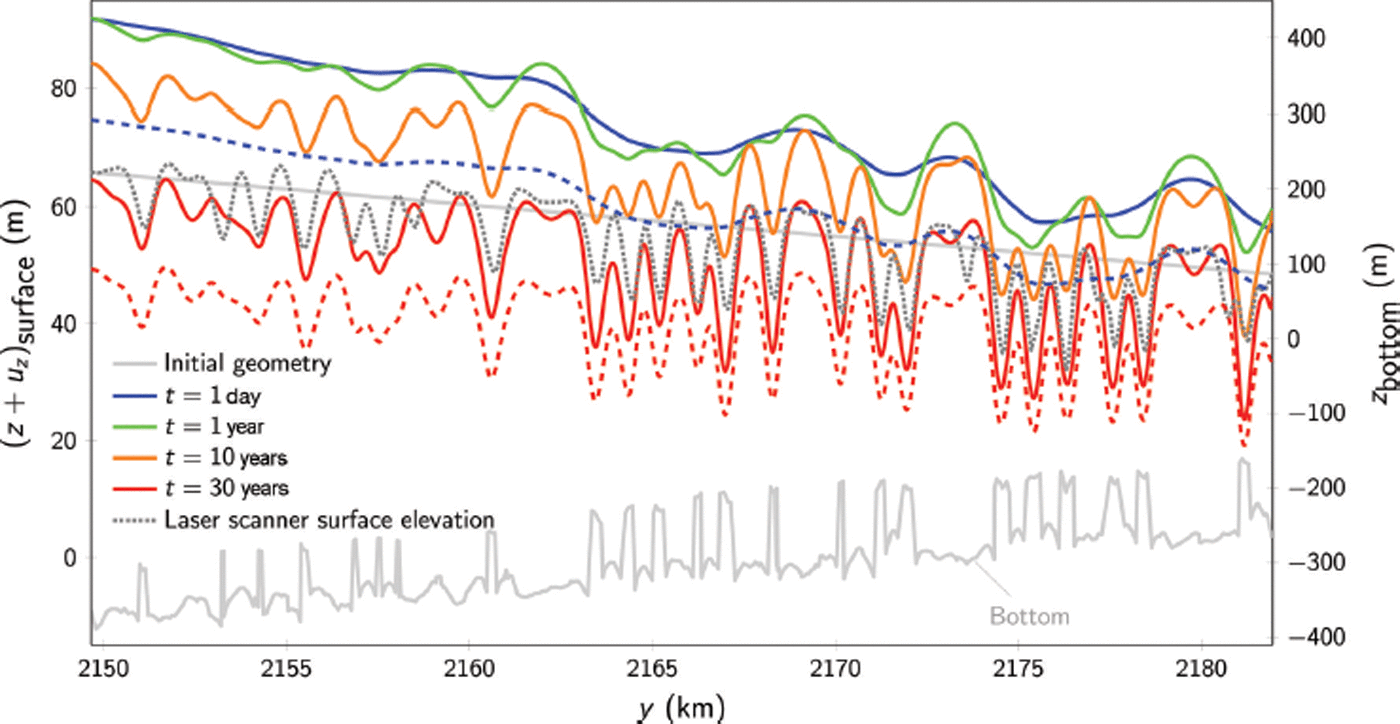
Here the evolution of surface elevation due to the bottom structure, obtained by RES (cf. Fig. 4), is analysed. The initial geometry (Fig. 9, grey solid line) is composed of the basal topography (Fig. 4) and a linearly decreasing surface. Thereby, the elevation of the starting and end points of the model surface is defined by the corresponding laser scanner data. In order to ensure a simulated surface displacement independent of assumed spatial variations in the density, a constant density of ρ ice = 822 kg m−3 is applied. This adjustment results in a satisfying mean elevation in comparison to the measured laser scan data. To highlight the influence of the density, two additional dashed lines show the deflection after t = 1 day and t = 30 years for ρ ice = 860 kg m−3. The remaining material parameters and the boundary conditions are the same as for the simplified geometries, except for the boundary condition at the ice front. This boundary condition is assumed to coincide with a depth-dependent Robin-type water pressure as described in Section 3.3 and depicted in blue in Figure 3b. In Figure 9, the colour gradient from blue to red passing green represents the progressive surface alteration with time. The instantaneous linear elastic vertical displacement uz , due to the stated bottom geometry, is given by the dashed and solid blue lines corresponding to t = 1 day. Only slight variations due to the bottom geometry can be seen. The considerable lift compared to the initial geometry results from the global hydrostatic equilibrium and is dependent on the applied densities. In the course of time the surface structure develops. For comparison, the grey densely dotted curve shows the surface geometry determined by the laser scanner. This line and the computed curve for t = 30 years and ρ ice = 822 kg m−3 are in good agreement. In the case of ρ ice = 860 kg m−3 the resulting surface displacements (dashed red and blue line) are vertically shifted and the surface undulations are slightly less pronounced. In the parts further downstream in Figure 9, the accordance of the measured surface and the computed surface is more accurate than upstream.
Time evolution of the surface elevation of the Jelbart Ice Shelf due to the depicted bottom structure in comparison to laser altimetry measurements of the surface. Solid and dashed coloured lines represent results for ρ ice = 822 kg m−3 and ρ ice = 860 kg m−3, respectively.
5. Discussion
The surface structures in the radar imagery are linked to troughs in the surface topography. However, the topography in the sense of the scattering geometry is only one contributor to the backscatter signal in the radar imagery. Low correlation coefficients between radar imagery back-scatter and detrended surface elevation show that the geometry alone does not generate the stripe. The second contribution comes from changes in the density in the upper 10 m. We infer changes in density due to higher accumulation rates in the troughs from the isochrone depth h ic shown in Figure 2b. A local trough can be considered to be at the location where wind-blown snow accumulates; thus the local accumulation rate is higher, leading to a thicker firn layer. Thus the change in σ 0 has two origins, the different density–depth profile and the geometrical factor. From the comparison between HH and VV polarization (Fig. 7) we learned that the signal is not dominated by surface scattering. This does not rule out the existence of summer melt layers, but these are less likely to occur only inside the troughs.
Our observations demonstrated that in the areas where the radar imagery exhibits stripe-shaped structures, the ice-shelf base is rough and crevassed (Fig. 2a). Similarly to Reference Humbert and SteinhageHumbert and Steinhage (2011) we infer that structured ice-shelf surfaces indicate a rough basal topography. Underneath nearly all surface troughs the RES profile shows basal crevasses or channel-like structures, which cannot be distinguished (see Fig. 4). At three locations within the first 32 km of the transect, no basal crevasses were found in the RES profile. One would expect such crevasses based on the surface topography if the ice shelf was in hydrostatic equilibrium. However, at those locations the bed reflections indicate discontinuities of the bed, but no indications for crevasses were detected from the internal reflections above.
Since our RES system is unable to focus the footprint of its signals, the width of the crevasses is a rough, but upper, estimate deduced from the internal structure. The RES data show the presence of subglacial crevasses, but do not allow us to map their exact shape or to discriminate between one wide and two or more narrower crevasses. Their width ∼10 m below their crest is generally increasing from south to north, up to ∼350 m.
Besides investigating the relation between surface and basal structures, the study employed viscoelastic modelling to determine whether the surface structures are caused by basal crevasses or channels over time. During the course of developing a suitable modelling approach, we started with a Kelvin–Voigt model that represents a long-term elastic response (results not shown here), from which we learned that the surface displacement with any kind of material parameter combination is much too low. Thus, considering the long-term response, one conclusion to be drawn is that in this scope a Maxwell material model is required to model the viscoelastic behaviour of ice shelves.
Both modelling set-ups, the idealized and the realistic geometries, clearly show the sink-in of the surface as a result of a basal crevasse or channel. Thereby, after a few years, variances in the bottom displacements due to different Young’s moduli are negligibly small. Variances due to different viscosities are more pronounced since they scale linearly. We infer that the surface troughs are caused by basal crevasses or channels. From the transient simulations with three basal crevasses we learned that it requires decades of temporal evolution to obtain a surface representation of each individual basal crevasse or channel. Thus, over time, crevasses spaced one to two ice thicknesses apart might be resolved well. This picture might be slightly biased by the fact that the model still assumes small deformations; however, the general trend will persist, while the timescale might be adjusted using large deformations.
Figure 4 shows that further downstream the ice shelf is more likely to be in hydrostatic equilibrium. This can be understood taking the temporal evolution as seen in modelling into account: our profile shows the basal crevasse structure approximately 30–90 years after its creation, assuming a flow velocity of ∼330 m a−1. Thus the further north the ice, the more time it had to adjust viscously to the basal pertubation and the closer it is to a basal surface in hydrostatic equlibrium.
The good agreement of the computed and measured surface elevation in Figure 9 demonstrates that the assumptions made for the viscoelastic simulations are realistic. We want to point out that for ρ ice = 822 kg m−3 the vertical displacements after 30 years almost coincide with the laser data, despite the simplification of the Maxwell rheology (constant viscosity), and the constant ice density. This is especially true for parts further downstream, where a better resolution of the bottom geometry was given. In the upstream part of this figure, where the ice thickness is larger, sharp structures at the bottom are not represented by the computed surface displacement. The instantaneous rise of the displacements uz indicates that the initial configuration did not satisfy the global equilibrium. The subsequent decrease of the overall surface results from a general thinning due to the downstream flowing ice according to the applied model. However, the consequent changes in the ice thickness and draft are not reflected by the bottom geometry. This is a feature of the applied linear theory assuming small deformation. Hence, the bottom geometry remains in an equilibrium state according to the initial configuration. Nevertheless, the present simulations up to 30 years fulfil the requirements of the linear theory (no strains larger than 0.1). The modelling of larger time spans, however, violates the assumptions. In future projects, the extension of the model towards large deformations might resolve the aforementioned problems and could lead to even more accurate results.
The modelling has considerable implications for state-of-the-art ice-sheet modelling, in particular grounding-line migration. Clearly the ice shelf cannot be assumed to be in hydrostatic equilibrium instantaneously, so the conditions for determining the grounding line position need to be renewed. Although extremly inconvenient, we have to conclude that modelling grounding line migration requires a viscoelastic model in appropriate resolution.
6. Conclusions
Surface structures in SAR imagery coincide with troughs in the surface topography. Correlation coefficients between surface topography and radar backscatter σ 0 are small, even if filtering, interpolation and different multilooking techniques are applied. This is due to the different shape of the signals, a nearly symmetric surface trough and an asymmetric σ 0 signal over the features. The asymmetry of σ 0 results from the influence of the local geometry and the incidence angle. As the SAR signal shows no significant difference in pattern in HH and VV polarization, dual polarimetric imagery does not provide a simple way for automatic classification of this type of surface structure.
The surface troughs are linked to basal structures that might be either crevasses or melt channels. In areas where the radar imagery exhibits stripe-shaped structures, the ice-shelf base was found to be rough and crevassed. Mapping the surface of ice shelves using radar imagery thus gives useful information about the nature of the basal topography.
We present clear evidence that the surface undulations are induced by basal crevasses or channels, which cause the surface to lower. Although our model set-up is simple, the results are convincing. The narrower or lower the height of the crevasses or channels, the smaller are the resulting surface troughs. The timescale at which the ice shelf approaches local hydrostatic equilibrium is in the order of decades to centuries. This is much longer than previously assumed and requires consideration in ice-sheet modelling.
Acknowledgements
This work was funded by the HGF Alliance Remote Sensing and Earth System Analysis. A.H. thanks Olaf Eisen for useful discussions on radar data analysis. We are grateful for two in-depth reviews by an anonymous reviewer, which were extremely helpful for improving the manuscript. A.H. thanks Marcel Humbert for rigorous criticism of presumptions.


