


Introduction
The Southern Ocean (SO) is essential for regulating global climate and sequestering both heat and anthropogenic carbon, which are subsequently redistributed throughout the world’s oceans (Williams et al. Reference Williams, Ceppi, Roussenov, Katavouta and Meijers2023). In addition to its physical and climatic significance, the SO supports complex and dynamic ecosystems (Johnston et al. Reference Johnston, Murphy, Atkinson, Constable, Cotté and Cox2022). One of these ecosystems’ most ecologically significant components is zooplankton, which play a crucial role linking primary producers to higher trophic levels and contribute significantly to biogeochemical cycling (Johnston et al. Reference Johnston, Murphy, Atkinson, Constable, Cotté and Cox2022). These organisms, ranging from small copepods to larger krill and chaetognaths, are integral to nutrient cycling and the functioning of the biological carbon pump (Atkinson et al. Reference Atkinson, Ward, Hunt, Pakhomov and Hosie2012). However, the distribution and composition of zooplankton communities are highly influenced by environmental variables such as salinity, temperature and chlorophyll a (chl a) concentrations, which vary across the water masses and seasons (Liu et al. Reference Liu, Wang, Sun, Yang and Swadling2024).
In the Indian sector of the SO, seasonal variations, the complexity of the water masses and the currents (e.g. Antarctic Circumpolar Current (ACC) and Antarctic Slope Current) create unique environmental conditions that shape zooplankton communities (Venkataramana et al. Reference Venkataramana, Anilkumar, Swadling, Mishra, Tripathy and Sarkar2020, Liu et al. Reference Liu, Wang, Sun, Yang and Swadling2024, Venkataramana et al. Reference Venkataramana, Mishra, Anilkumar, Soares, Sabu and Sarkar2024). During the austral summer, increased primary productivity supports rich zooplankton populations (Takahashi et al. Reference Takahashi, Makabe, Takao, Kashiwase and Moteki2022). However, due to its remote location and extreme climate conditions, many challenges, such as logistical complications and high research operations costs, have resulted in this region being understudied (Prakash et al. Reference Prakash, Prakash, Ravichandran, Udaya Bhaskar and Anil Kumar2020), leaving gaps in our understanding of how zooplankton abundance and distribution are structured across environmental gradients.
In this study, zooplankton were collected in the eastern Indian sector of the SO. The study aims to describe the community structure of zooplankton in the epipelagic layer across a latitudinal gradient during the austral summer of 2022/2023. It highlights the effects of different oceanic fronts on species distributions. Through this analysis, the study offers insights into the ecological patterns that shape zooplankton communities and improves our understanding of how these communities might react to ongoing environmental changes in the SO.
Materials and methods
Field sampling
Zooplankton sampling was conducted on board the training research vessel (TRV) Umitaka-maru of the Tokyo University of Marine Science and Technology from 24 January until 4 February 2023 (austral summer). The samples were collected in the Indian sector of the SO along two different transects. Transect 1 included two sampling stations located at 50°S and 54°S, at the northern end of the sampling region, and Transect 2 comprised five sampling stations situated along 110°E, from 60°S to 64°S, at the southern end of the sampling region (Fig. 1). Sampling was performed using a ring net (mouth diameter: 1.6 m; mesh size: 500 μm) that was towed obliquely with a wire payout of 400 m. The exact depth that each net reached was measured using a COMPACT-TD device (JFE Advantech Co., Ltd), which was attached to the net opening (Table I). The volume of filtered seawater was measured by a flow meter (General Oceanic, Inc.) attached to the centre net ring’s opening. Zooplankton samples were preserved in 5% neutral formaldehyde-seawater and analysed further in the laboratory.
Map of sampling locations in the Indian sector of the Southern Ocean overlaid with bathymetry data (m) derived from GEBCO_2024 (GEBCO Bathymetric Compilation Group, 2024). The white and black dots represent the stations at Transect 1 (T1) and Transect 2 (T2), respectively. Station numbers are labelled near each sampling station.

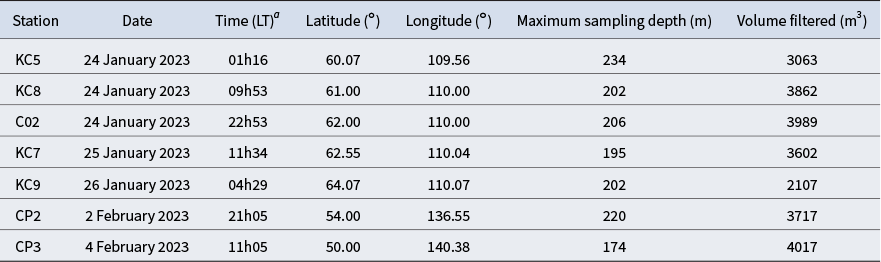
Summary of ring net sampling at each station in the Indian sector of the Southern Ocean during the austral summer of 2022/2023.

a Local time (LT) is UTC + 8 h from stations KC5 to KC9, UTC + 10 for station CP2 and UTC + 11 for station CP3.
Physical variables such as temperature, salinity and seawater density were measured using an expandable conductivity, temperature and depth (CTD) device (X-CTD, Tsurumi Seiki Co., Ltd., MK-130) at Transect 1 and CTD device (SBE 911plus, Sea-Bird Electronics, Inc.) deployments at Transect 2. Transect 2 CTD data are available on the Arctic Data Archive Systems (ADS; https://ads.nipr.ac.jp/data/meta/A20230323-001; Shimada et al. Reference Shimada, Takashi, Makabe, Hirawake, Mizobata and Kitade2023). The SO is characterized by the ACC, which separates various water masses and is a critical component of the global ocean circulation (Orsi et al. Reference Orsi, Whitworth and Nowlin1995). Across Transects 1 and 2, the estimation of the frontal lines was determined from the available CTD data following the definitions of Orsi et al. (Reference Orsi, Whitworth and Nowlin1995) and Sokolov & Rintoul (Reference Sokolov and Rintoul2002).
To determine concentrations of chl a, a known volume of seawater collected from the Niskin bottles was filtered onto Whatman GF/F filters. The filters were then soaked in 6 ml of N,N-dimethylformamide (DMF) before extracting the pigments for 24 h in the dark at −20°C (Suzuki & Ishimaru, Reference Suzuki and Ishimaru1990). Finally, the chl a concentration was determined with a fluorometer (10-AU, Turner Designs, Sunnyside, CA, USA) according to the procedure outlined by Welschmeyer (Reference Welschmeyer1994). The concentrations of chl a at the average of 200 m depth were measured at all stations on Transect 2. Detailed information on the chl a data is available on the ADS (https://ads.nipr.ac.jp/data/meta/A20250115-002/) (Makabe et al. Reference Makabe, Shimada, Hirawake and Takahashi2025). Unfortunately, due to unforeseen technical difficulties, chl a data could not be obtained at the stations on Transect 1.
Zooplankton abundance and biomass
Macrozooplankton, such as salps, were sorted and removed from the original samples then identified and counted separately. The remaining mesozooplankton samples were then subsampled and enumerated using a Folsom splitter with a range of 291–546 individuals. Zooplankton were counted under a dissecting microscope (SZX-7 Olympus, Tokyo, Japan) and identified to the lowest taxonomic level possible. To estimate the biomass of each zooplankton taxon, the length of all individuals was measured and calculated using previously reported allometric equations (Mizdalski Reference Mizdalski1988, Hernandez-Leon & Montero Reference Hernandez-Leon and Montero2006, Wallis et al. Reference Wallis, Maschette, Wotherspoon, Kawaguchi and Swadling2020). However, some of the zooplankton groups, such as pteropods, calyptopsis/decapod zoea and larvae of copepods, were excluded due to unavailable conversion factors in the literature and/or the damaged shells and poor condition of the body samples. The morphometric measurements were performed using ImageJ software (Ver. 1.33u, National Institutes of Health).
Data analysis
Zooplankton abundance was estimated as the number of individuals per 1000 cubic metres (ind. 1000 m−3) (see Fig. S1) and the volume of water filtered through the net, which was calculated from the flow meter (2030R, General Oceanics, Miami, FL, USA). In addition, the biomass of zooplankton was determined in milligrams of dry weight per 1000 cubic metres (mg DW 1000 m−3) by using Equation 1:
 $$\begin{align}y={ax}^b\end{align}$$
where y is the biomass using dry weight (mg), x is body length (mm), a is the intercept and b is the slope of body area (mm2). Species richness and Shannon diversity index (H’) values for each sampling station were calculated (Shannon & Weaver Reference Shannon and Weaver1949). Kruskal-Wallis tests were performed to calculate any significant differences in abundance and biomass of the zooplankton within the same and different transects, with significance set at P < 0.05.
Temperature and salinity profiles from all Transect 1 and Transect 2 stations. The unmarked lines represent the stations of Transect 1, whereas the asterisked lines represent the stations of Transect 2. Only data beginning at a depth of 5 m were used to avoid using noisy surface data. PSU = practical salinity unit.

Vertical distribution of temperature (θ; °C), salinity and chlorophyll a (chl a) concentration (μg l−1) at a maximum depth of 200 m at Transect 2. Due to limited data coverage at shallow depths (< 25 m), only temperature and salinity measurements from depths ≥ 25 m were included. SACCF = Southern Antarctic Circumpolar Current Front; SB = Southern Boundary.

The original data from species abundance (X; ind. 1000 m−3) were log10(X + 1)-transformed to down-weight the contribution of highly abundant species and increase the contribution of the less common species. Zooplankton community structure was then investigated with a hierarchical agglomerative cluster analysis based on a Bray-Curtis similarity matrix and group-average linkage (Clarke & Warwick Reference Clarke and Warwick2001). To find potential indicator species in the groups that resulted from the cluster analysis, the program Indicator Value (IndVal) was applied (Dufrêne & Legendre Reference Dufrêne and Legendre1997). IndVal was calculated as per Equation 2:
 $$\begin{align}{\mathrm{IndVal}}_{ij}={A}_{ij}\times {B}_{ij}\times 100\end{align}$$
where Aij = Nindividuals ij /Nindividuals i and Bij = Nsites ij /Nsites j . Aij measures site specificity, where Nindividuals ij is the mean number of individuals in species i across sites of group j and Nindividuals i is the sum of the mean number of individuals of species i over all groups. Bij measures group fidelity, where Nsite ij is the number of sites in group j where i is present and Nsite j is the total number of sites in that group. A permutational multivariate analysis of variance (PERMANOVA) was conducted to determine whether the station groupings based on the cluster analysis were statistically significant (P = 0.05). All statistical analyses were performed using the statistical packages PRIMER 6 (version 6.1.13) and R (version 4.2.3).
Results
Hydrographic condition
According to the frontal lines defined by Orsi et al. (Reference Orsi, Whitworth and Nowlin1995) and Sokolov & Rintoul (Reference Sokolov and Rintoul2002), stations CP2 and CP3 of Transect 1 were separated by the Subantarctic Front (SAF). This is reflected in the contrasting water properties between stations CP2 and CP3 (Fig. 2). Station CP2 exhibited cooler and fresher water (surface temperature: 3.5–6.1°C, salinity: 31.7–33.9), whereas station CP3 was characterized by warmer and more saline water (surface temperature: 9.5–10.7°C, salinity: 34.3–34.7). The temperature profile at station CP2 was stratified, whereas its salinity remained homogeneous. In contrast, station CP3 exhibited a uniform temperature profile but a stratified salinity profile. This observation is consistent with the findings of Orsi et al. (Reference Orsi, Whitworth and Nowlin1995), which suggested that stratified, cooler water and uniformly fresher water are located south of the SAF (as at station CP2). In contrast, uniformly warmer water and stratified, higher-salinity water are found north of the SAF (as at station CP3).
According to Orsi et al. (Reference Orsi, Whitworth and Nowlin1995) and Sokolov & Rintoul (Reference Sokolov and Rintoul2002), the Southern Antarctic Circumpolar Current Front (SACCF) corresponds to the southernmost extent of water temperatures exceeding 1.8°C, situated between stations KC8 and C02. In contrast, the Southern Boundary (SB) marks the southern limit of the area where temperatures are lower than 1.5°C, located between stations KC7 and KC9 (Fig. 3). At nearly all stations, fresher water with a salinity of less than 33.8 was found at depths shallower than 50 m. The distribution of chl a concentrations mirrored the salinity pattern, with areas of fresher water corresponding to higher chl a levels at at depths shallower than 50 m. The highest chl a concentrations were observed at the southernmost limit, decreasing gradually as they spread northwards. Warmer and saline layers were found below the temperature minimum layer and identified as Circumpolar Deep Water in the eastern area at depths greater than ~100 m.
Zooplankton abundance and biomass
In total, 36 zooplankton species/taxa, representing nine classes, were collected from the epipelagic layer (0–200 m depth). Copepods dominated the assemblage, comprising 64% of the total taxa. In Transect 1, species richness varied between 17 and 21, whereas in Transect 2 it ranged from 15 to 18. Additionally, the diversity index in Transect 1 was higher, with values between 2.3 and 2.5, compared to Transect 2, which had a diversity index ranging from 1.5 to 2.0.
Total abundance of zooplankton gradually increased towards the south, ranging from 2171 to 39 244 ind. 1000 m−3 (Fig. 4). The highest abundance was recorded at the southernmost sampling station, KC9 (Transect 2), and the lowest was observed at station CP3 (Transect 1), located close to the SAF. No significant differences in zooplankton abundances were found between the transects (P = 0.085) or among stations within the same transect (Transect 1: df = 1, P = 0.317; Transect 2: df = 4, P = 0.406).
The relative abundance of zooplankton groups along a. Transect 1 and b. Transect 2 during the austral summer of 2022/2023. White dots mark average abundances (right-hand y-axis). ind. = individuals.

Copepods dominated the zooplankton community across both transects, ranging from 860 to 32 197 ind. 1000 m−3. Following that, along Transect 1, the two next most abundant groups were ostracods and euphausiids, with ostracods comprising 7–21% (mean (μ) = 747.6, standard deviation (SD) = 403.8) and euphausiids comprising 9–13% (μ = 843.4, SD = 804.0) of the total abundance, both reaching their highest values at station CP3. Along Transect 2, euphausiids and chaetognaths were the second and third most abundant groups, accounting for 2–13% (μ = 1458.6, SD = 1127.6) and 3–7% (μ = 1337.6, SD = 958.6) of the total abundance, respectively. Notably, Thaliacea were only present along Transect 1, comprising < 1% of the total zooplankton abundance. The variations in zooplankton group compositions led to a statistically significant difference between the transects (P = 0.043).
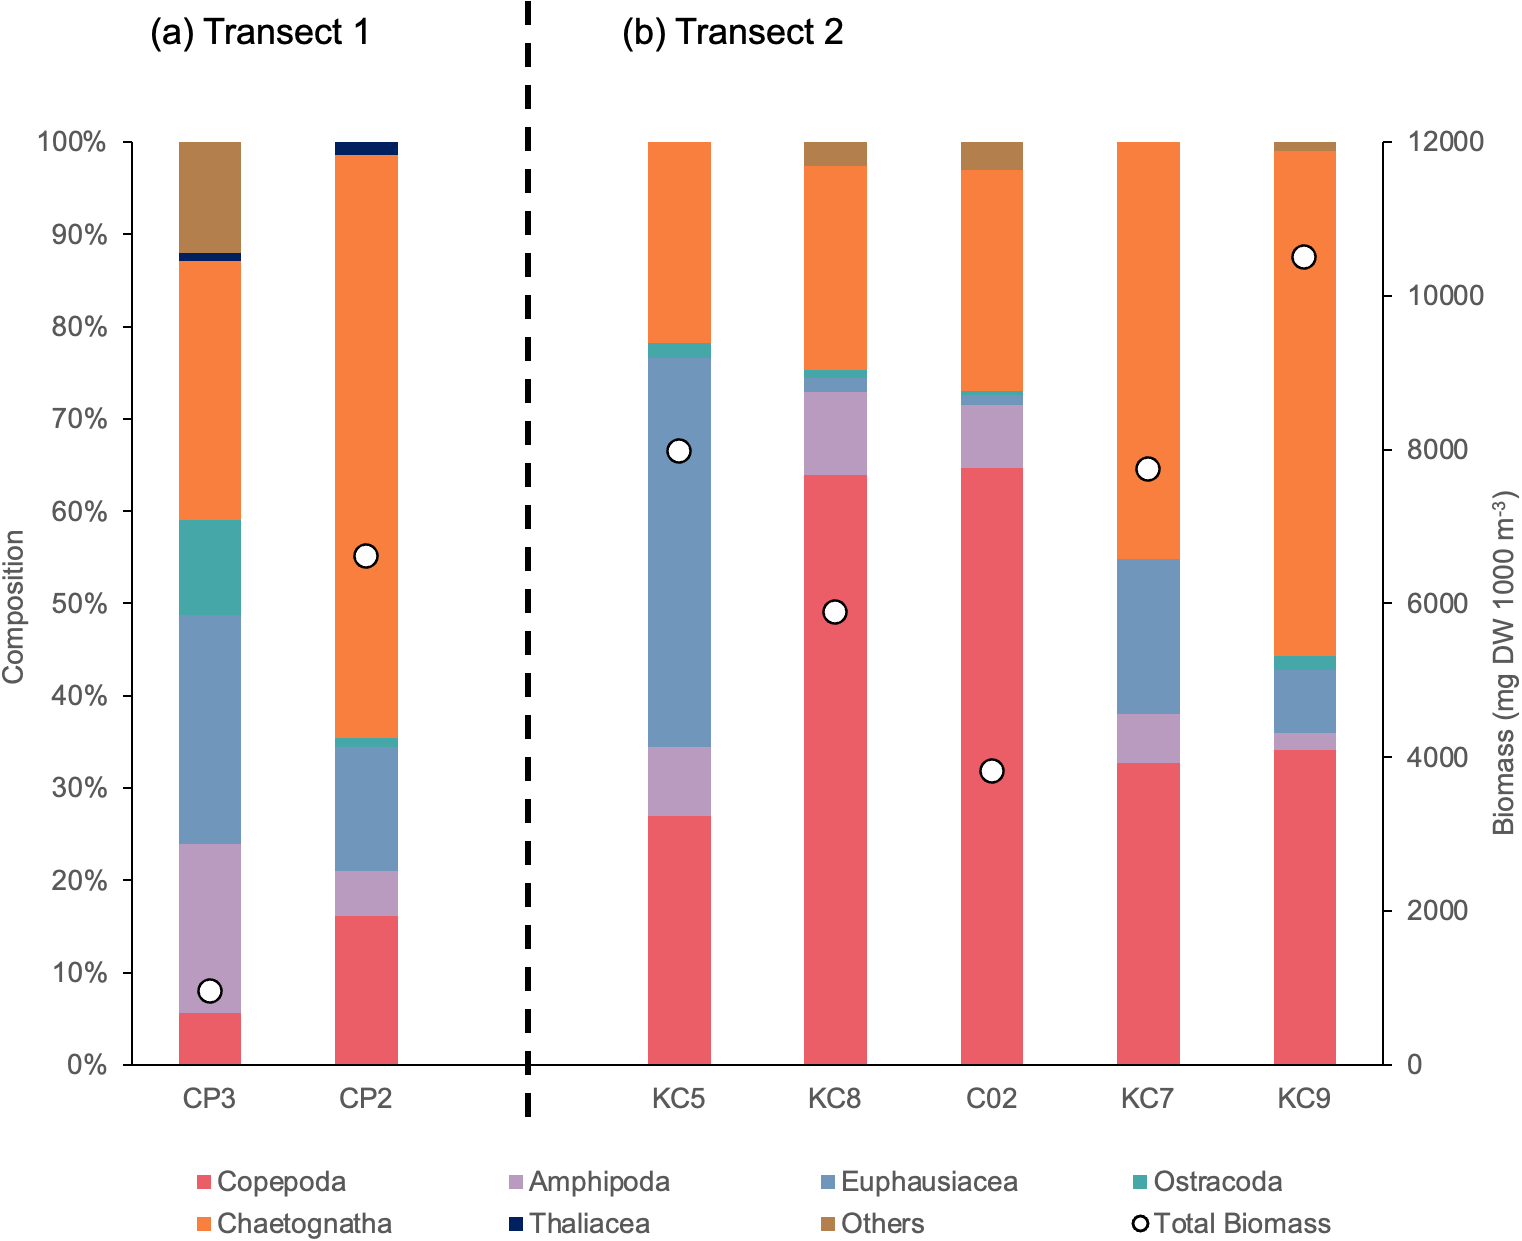
Total zooplankton biomass ranged from 956 to 10 497 mg DW 1000 m−3 (Fig. 5). Station CP3 from Transect 1 showed the lowest total biomass, whereas station KC9 from Transect 2 recorded the highest biomass across the sampling stations. Although copepods dominated the abundance across both transects, their contribution to biomass was generally lower, accounting for, on average, 35% of the total zooplankton biomass. Along Transect 2, there was an increasing trend in the biomass of chaetognaths towards the south, contributing 22–55% (μ = 2636.7, SD = 1993.6) of the total zooplankton biomass. Additionally, euphausiids contributed significantly to the biomass at certain stations, particularly where adult individuals were present in a sample. Despite the observed variations in biomass distribution and dominant taxa between the two transects, statistical analysis indicated no significant differences in total biomass between transects (P = 0.795) or among stations within the same transect (Transect 1: df = 1, P = 0.406; Transect 2: df = 4, P = 0.317).
The relative biomass of zooplankton groups along a. Transect 1 and b. Transect 2 during the austral summer of 2022/2023. White dots mark average biomasses (right-hand y-axis). mg DW 1000 m3 = milligrams of dry weight per 1000 cubic metres.

Species distribution
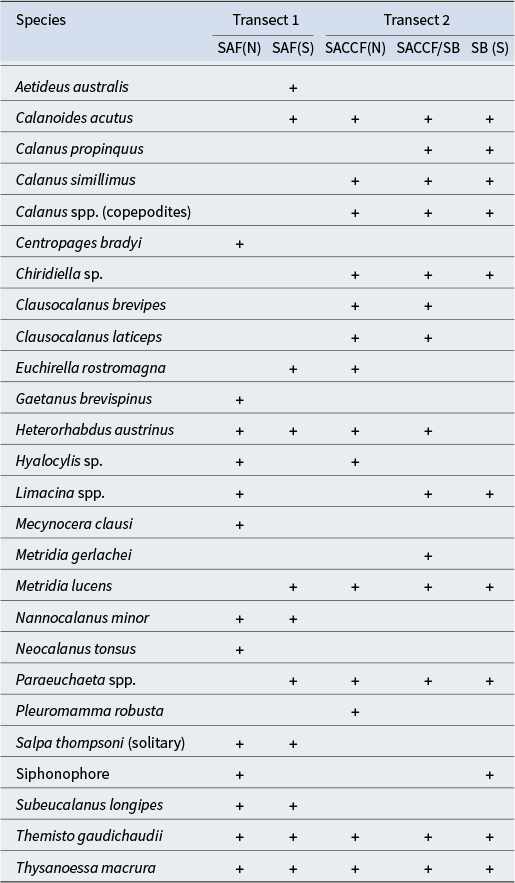
Table II shows the presence of the selected zooplankton taxa in Transects 1 and 2. In Transect 1, a total of 13 taxa were found north of the SAF (station CP3) and 11 taxa were found south of the SAF (station CP2). Among these, six taxa were present both north and south of the SAF. In Transect 2, a total of 14 taxa were found north of the SACCF (stations KC5 and KC8), another 14 were found between the SACCF and SB (stations C02 and KC7) and 11 were found south of the SB (station KC9). Among the 14 taxa located north of the SACCF, only three (Euchirella rostromagna, Hyalocylis sp. and Pleuromamma robusta) were found only within that region.
Checklist of selected zooplankton taxa present (+) in various oceanic fronts.

SAF(N) = north of the Subantarctic Front; SAF(S) = south of the Subantarctic Front; SACCF(N) = north of the Southern Antarctic Circumpolar Current Front; SACCF/SB = between the Southern Antarctic Circumpolar Current Front and the Southern Boundary; SB(S) = south of the Southern Boundary.
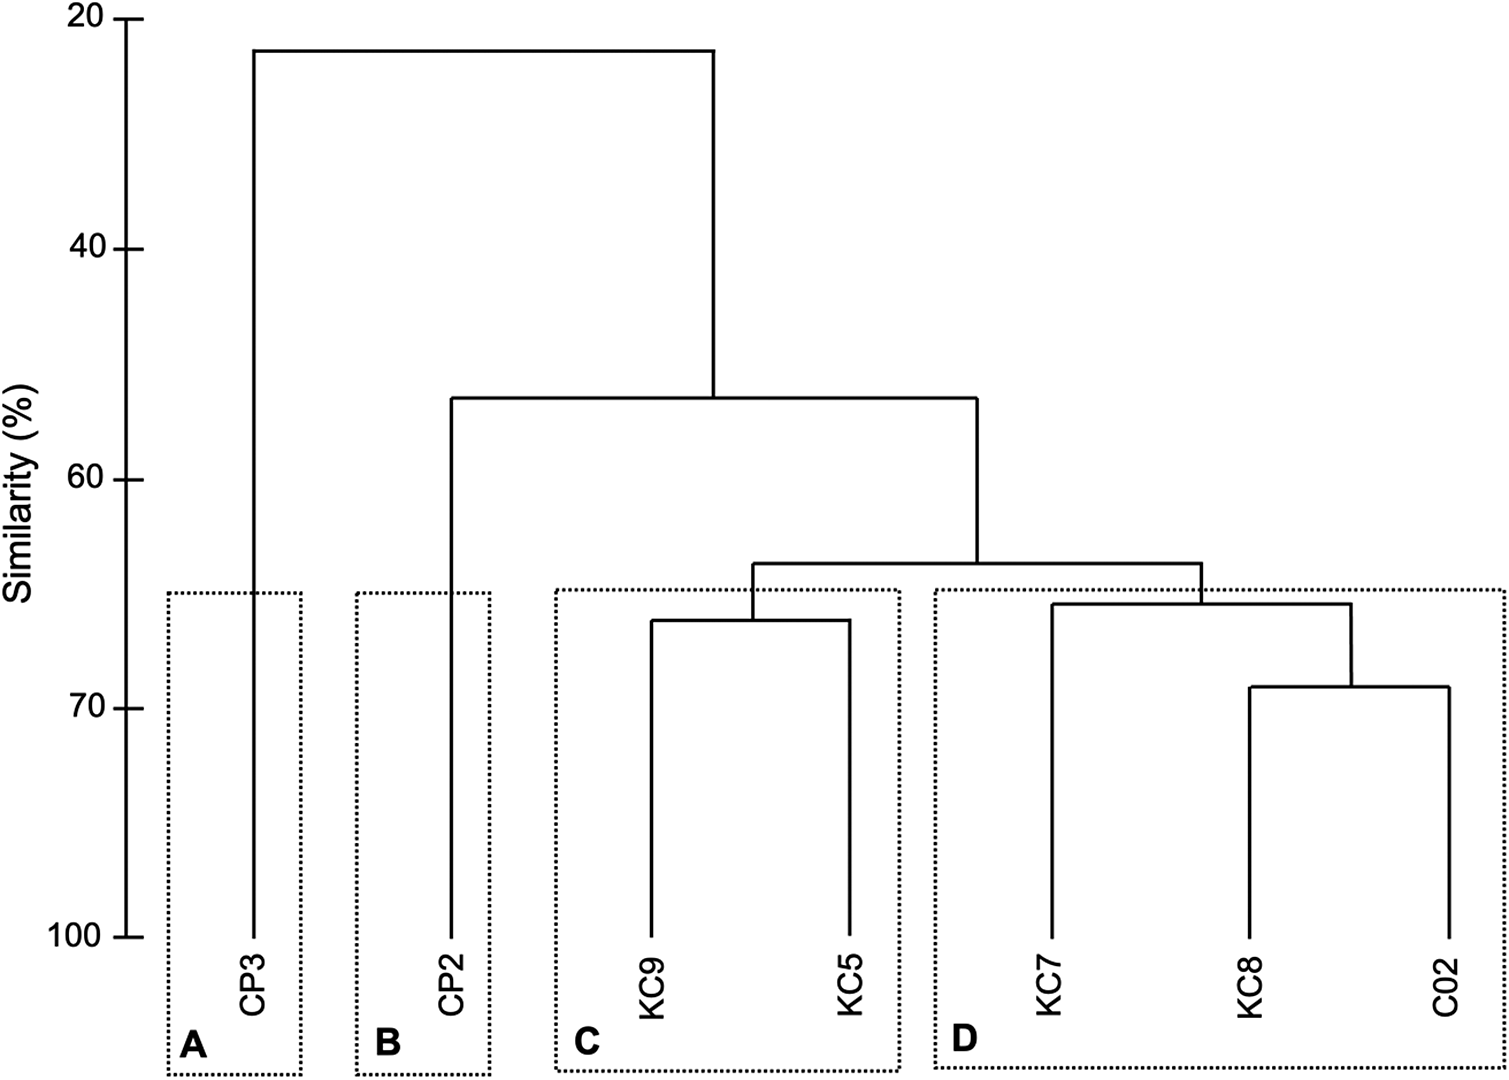
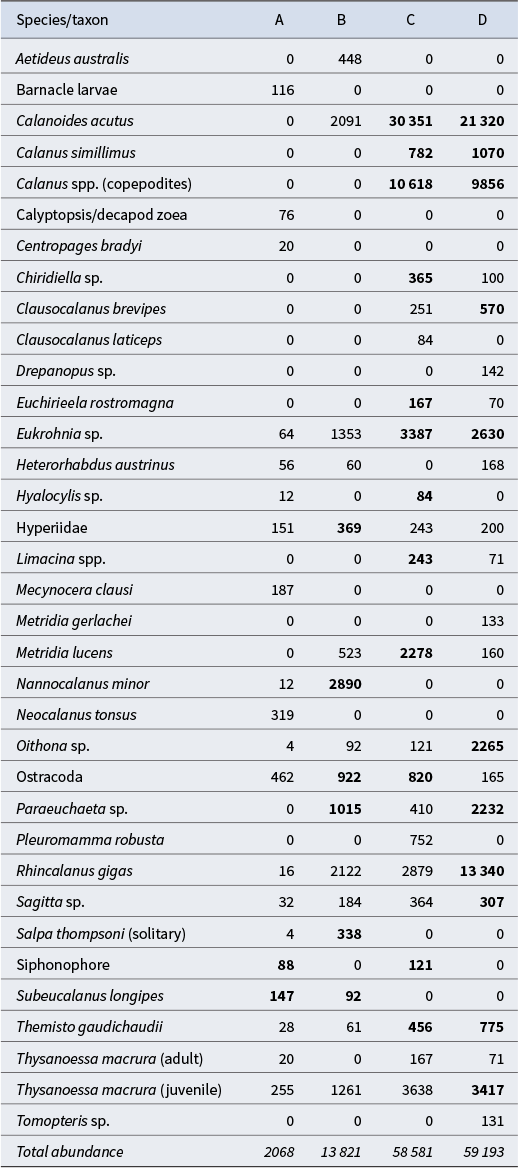
Based on the cluster analysis, four zooplankton clusters were identified at 65% similarity (Fig. 6). The groups were labelled A (station CP3), B (station CP2), C (stations KC5 and KC9) and D (stations KC8, C02 and KC7). The clustering reflects the oceanic fronts of Transect 1 and Transect 2. Groups C and D from Transect 2 have a shared zooplankton community structure, and all of these stations were located at the southern end of the sampling region. Group C consisted of stations KC5 and KC9, located ~444 km from each other, whereas Group D consisted of stations KC8, C02 and KC7, located ~111 km (KC8 and C02) and ~61 km (C02 and KC7) from each other. Group D had the highest total abundance (59 193 ind. 1000 m−3), although specific zooplankton classes, such as euphausiids (Group C: 3805 ind. 1000 m−3; Group D: 3488 ind. 1000 m−3), chaetognaths (Group C: 3751 ind. 1000 m−3; Group D: 2937 ind. 1000 m−3) and siphonophores (Group C: 121 ind. 1000 m−3), were more prevalent in Group C (58 581 ind. 1000 m−3) than in the other clusters (Table III). However, in Group D, copepods (51 460 ind. 1000 m−3) and amphipods (975 ind. 1000 m−3) made large contributions to total abundance, for which most of the species in these two zooplankton classes served as indicator species. Group A had the lowest abundance, with only siphonophores and Subeucalanus longipes as indicator species. A PERMANOVA revealed a statistically significant difference in zooplankton community abundances among the four groups identified by cluster analysis (P = 0.008).
Discussion
There are limited comprehensive studies on zooplankton in the south-eastern Indian sector of the SO. Copepods consistently emerge as the dominant group in the zooplankton community, regardless of mesh size and sampling technique. This is evident in the current findings, where copepods predominated in both transects, which were ~2386 km apart. Additionally, there was a greater diversity of copepod species compared to non-copepod groups such as chaetognaths, amphipods and euphausiids. Previous studies have also indicated that copepods are the most prevalent group in the Indian sector of the SO at various oceanic fronts (Venkataramana et al. Reference Venkataramana, Anilkumar, Swadling, Mishra, Tripathy and Sarkar2020, Reference Venkataramana, Mishra, Anilkumar, Soares, Sabu and Sarkar2024, Sugioka et al. Reference Sugioka, Matsuno, Takahashi, Makabe, Takahashi and Moteki2021, Schaafsma et al. Reference Schaafsma, Matsuno, Driscoll, Sasaki, van Regteren and Driscoll2024).
Among the copepod species observed, Neocalanus tonsus, Mecynocera clausi, Gaetanus brevispinus and Centropages bradyi were all found exclusively either at the north or south of the SAF. N. tonsus and M. clausi represented 15% and 9% of the total abundance at station CP3, whereas the other two species comprised < 1%, respectively. The SAF represents a dynamic boundary between warmer sub-Antarctic waters and colder Antarctic waters (Sokolov & Rintoul Reference Sokolov and Rintoul2002), creating a zone of moderate stratification and elevated productivity that supports a diverse zooplankton community. The presence of N. tonsus in this region is consistent with previous studies by Venkataramana et al. (Reference Venkataramana, Anilkumar, Swadling, Mishra, Tripathy and Sarkar2020) and Takahashi et al. (Reference Takahashi, Takamura and Odate2021), which documented its presence in sub-Antarctic waters. As a Southern Hemisphere endemic (Tanaka Reference Tanaka1956), N. tonsus exhibits a well-defined seasonal vertical migration pattern, typically descending below 500 m by late January (Ohman et al. Reference Ohman, Bradford and Jillett1989). Its presence in surface waters during the sampling period may indicate a delayed descent or regional variation in life-cycle timing, probably influenced by local environmental conditions at the SAF.
In contrast, limited information is available on the ecology and distribution of M. clausi in the SO, although its presence in sub-Antarctic waters has been confirmed through continuous plankton recorder recordings taken by the Australian Antarctic Data Centre (https://data.aad.gov.au/aadc/biodiversity/taxon_profile.cfm?taxon_id=110293). Its exclusive presence at the north of the SAF in this study suggests a similar reliance on this front’s transitional thermal and trophic characteristics. However, the ecological mechanisms governing its distribution remain unclear. Further research is needed to investigate its habitat preferences, reproductive cycle and trophic role within the frontal systems of the SO to better understand the factors shaping its biogeographical range.
Results of the cluster analysis performed on the zooplankton community collected in the Indian sector of the Southern Ocean in the austral summer of 2022/2023. Four groups were identified, indicated with rectangles and named A to D from left to right.

Based on the cluster analysis, M. clausi and other small copepod species with total lengths less than 2 mm, such as Aetideus australis and Heterorhabdus austrinus, were dominant at the two stations along Transect 1, which showed strong dissimilarity. Small copepods play a crucial role in the SO ecosystem by regulating lower trophic levels and contributing to carbon uptake efficiency through their feeding activities on phytoplankton and microzooplankton (Tachibana et al. Reference Tachibana, Ohkubo, Matsuno, Takahashi, Makabe and Moteki2023). Despite their importance, the abundance of small copepods in Transect 1 may be underestimated due to the mesh size of the nets used in sampling, which can hinder the accurate assessment of their contributions to the complex dynamics of the SO ecosystem (Tachibana et al. Reference Tachibana, Ohkubo, Matsuno, Takahashi, Makabe and Moteki2023). This potential underestimation highlights the need for refined sampling techniques to fully understand the ecological roles of small copepods, including other small zooplankton species.
In addition, Calanoides acutus, E. rostromagna and H. austrinus were observed at both transects, specifically between the SAF and SACCF, highlighting their association with the cold, nutrient-rich waters characteristic of these southern frontal systems. Among these, C. acutus accounted for 14–53% of the total abundance from stations CP2 to KC9. This widely distributed herbivorous copepod plays a crucial role in linking primary production and higher trophic levels by taking advantage of seasonal phytoplankton blooms, attributable to its adaptation to cold water and extensive lipid-storage capacity utilized during winter (Bathmann et al. Reference Bathmann, Makarov, Spiridonov and Rohardt1993, Pasternak & Schnack-Schiel Reference Pasternak and Schnack-Schiel2001, Pond et al. Reference Pond, Tarling, Ward and Mayor2012).
Along Transect 2, large calanoid copepods other than C. acutus, such as Calanus simillimus, Metridia gerlachei and Rhincalanus gigas, were dominant. Two clusters (Groups C and D) were identified in Transect 2, with C. acutus showing the highest abundance and dominating both groups, followed by Calanus spp. (copepodites) and R. gigas. These dominant species were recognized as indicator species, except for R. gigas in Group C. The dominance of C. acutus in the sampling region has been previously reported by Matsuno et al. (Reference Matsuno, Sugioka, Maeda, Driscoll, Schaafsma and Driscoll2024) and Sugioka et al. (Reference Sugioka, Matsuno, Takahashi, Makabe, Takahashi and Moteki2021). During the transition from spring to summer, C. acutus actively reproduces and reaches the copepodite stage of C4 or C5 by the end of the summer, after which it descends into deeper water layers to overwinter (Bathmann et al. Reference Bathmann, Makarov, Spiridonov and Rohardt1993).
In Group D, R. gigas was the second most abundant species and is highlighted as an indicator species. In contrast, Group C showed a low abundance of R. gigas across individual sampling stations in this study. This finding is particularly notable at station KC5, as it contrasts with the results reported for the same sampling station by Sugioka et al. (Reference Sugioka, Matsuno, Takahashi, Makabe, Takahashi and Moteki2021). Matsuno et al. (Reference Matsuno, Wallis, Kawaguchi, Bestley and Swadling2020) noted that the reproduction of R. gigas occurs in January and February in the Indian sector of the SO, with a reported generation time of 1–2 years (Marin Reference Marin1988). The reduced abundance in the current study may be attributable to local oceanographical circulation patterns, which could influence the distribution of zooplankton species (Mizobata et al. Reference Mizobata, Shimada, Aoki and Kitade2020, Tachibana et al. Reference Tachibana, Ohkubo, Matsuno, Takahashi, Makabe and Moteki2023).
Besides copepods, groups such as chaetognaths, euphausiids, ostracods, amphipods and Thaliacea also contributed significantly to the overall zooplankton biomass. Among these, chaetognaths contributed the most to biomass, despite the low abundance recorded at all stations. In the SO, the genera Eukrohnia sp. and Sagitta sp. are commonly reported; for example, in the Atlantic sector, chaetognaths comprised 5–30% of the zooplankton abundance and biomass within the upper 300 m (Pakhomov et al. Reference Pakhomov, Perissinotto, McQuaid and Froneman2000, Kruse et al. Reference Kruse, Brey and Bathmann2010). According to Hosie et al. (Reference Hosie, Schultz, Kitchener, Cochran and Richards2000), many species, including chaetognaths, showed decreasing abundances towards the continental shelf of the Antarctic coast, and Sugioka et al. (Reference Sugioka, Matsuno, Takahashi, Makabe, Takahashi and Moteki2021) also reported a decreasing trend with latitude. However, in the current study, chaetognaths increased towards the south, which aligns with Swadling et al. (Reference Swadling, Kawaguchi and Hosie2010). Chaetognaths are generally known for their carnivorous role in the ecosystem, regulating the copepod population and maintaining ecosystem balance (Kruse et al. Reference Kruse, Brey and Bathmann2010). The increase in chaetognaths towards the south could be attributed to higher productivity, which supports a high abundance of herbivorous copepod species in these regions. It is estimated that individual chaetognaths consume ~100 herbivorous copepods daily to sustain themselves (Kruse et al. Reference Kruse, Brey and Bathmann2010).
In addition to spatial patterns, temporal variability also appears to influence the distribution of chaetognaths. A notable similarity with Sugioka et al. (Reference Sugioka, Matsuno, Takahashi, Makabe, Takahashi and Moteki2021) was observed in this study, in that a high biomass of chaetognaths was recorded before 12h00. Chaetognaths are known to undergo diel vertical migration but have shown no regular patterns in feeding (Johnson & Terazaki Reference Johnson and Terazaki2004). Sampling in this study was primarily conducted during the daytime, with peak sampling at 04h29. Given this early morning timing, it is probable that the bulk of chaetognath biomass was still concentrated in the upper epipelagic zone (0–200 m), although some individuals may have begun their downwards migration as daylight intensified. Based on the length measurements reported by Kruse et al. (Reference Kruse, Bathmann and Brey2009), the chaetognath individuals captured in this study were primarily juveniles (see Fig. S2). Kruse et al. (Reference Kruse, Bathmann and Brey2009) and Alvariño et al. (Reference Alvariño, Hosmer and Ford1983) observed that Eukrohnia juveniles are commonly found in the epipelagic layer and are more prevalent during summer, and these findings are reflected in the current results. These findings highlight the importance of considering vertical distribution patterns, sampling intervals and ontogenetic stages when assessing chaetognath dynamics in the SO.
In this study, juvenile stages of Thysanoessa macrura dominated the euphausiid community in both transects, with higher abundances at the southern stations. This finding is consistent with previous studies from both the western and eastern SO (Rombolá et al. Reference Rombolá, Franzosi, Tosonotto, Alder and Marschoff2019, Wallis et al. Reference Wallis, Maschette, Wotherspoon, Kawaguchi and Swadling2020). The presence of higher numbers of juveniles compared to adults can be attributed to their reproductive strategy (Pang et al. Reference Pang, Chi, Song, Li, Chen and Yang2023). Additionally, T. macrura has a flexible diet that allows juveniles to access enough food resources during their critical growth phases in the summer (Wallis et al. Reference Wallis, Maschette, Wotherspoon, Kawaguchi and Swadling2020). The abundance of food during this season supports the rapid growth of T. macrura (Wallis et al. Reference Wallis, Maschette, Wotherspoon, Kawaguchi and Swadling2020). A study by Färber-Lorda & Mayzaud (Reference Färber-Lorda and Mayzaud2010) found that T. macrura accumulated significant lipid reserves during summer, which are crucial for overwintering and future reproductive success.
Many previous studies have highlighted the contrasting population trends between krill (Euphausia superba) and salps, which are known to thrive under different environmental conditions. Salps are typically found in warmer waters, although in some years they have been recorded in cooler waters at higher latitudes, including the SACCF in the Indian sector of the SO (Kelly et al. Reference Kelly, Corney, Melbourne-Thomas, Kawaguchi, Bestley, Fraser and Swadling2020). Despite the similar range of temperature and salinity observed in this study compared with previous studies (Ariffian et al. Reference Ariffian, Swadling, Moteki and Ishak2024), no such individuals were found on Transect 2, and only a small number of solitary-stage salps were recorded on Transect 1, with the highest abundance and biomass recorded at station CP2, south of the SAF.
The absence of Salps thompsoni along Transect 2 reflects the findings of Hunt & Hosie (Reference Hunt and Hosie2006) along 140°E during the summer season. This absence may be attributed to the deep seasonal vertical migration, as S. thompsoni is known to migrate to depths exceeding 1000 m during early summer (Pakhomov et al. Reference Pakhomov, Hall, Williams, Hunt and Stevens2011). Hunt & Hosie (Reference Hunt and Hosie2006) observed that their surface abundance gradually increased and peaked in March, probably in response to the warming of the surface water and lower chl a concentrations, conditions that are favourable for them (Perissinotto & Pakhomov Reference Perissinotto and Pakhomov1998). Furthermore, Nishikawa & Tsuda (Reference Nishikawa and Tsuda2001) noted that salp individuals began to migrate upwards during complete darkness to take the opportunity to feed, which presents another possibility for explaining their absence from the samples collected in the present study.
Mean abundance (ind. 1000 m−3) for all species/taxon. Indicator Values (IndVals) greater than 25% for the group are shown in bold.

In addition, the effect of water mass advection might also be considered (Henschke et al. Reference Henschke, Espinasse, Stock, Liu, Barrier and Pakhomov2023) due to the presence of cyclonic eddies in the sampling regions (Mizobata et al. Reference Mizobata, Shimada, Aoki and Kitade2020). Furthermore, the presence of S. thompsoni on Transect 1 aligns with previous studies (Pakhomov & Hunt Reference Pakhomov and Hunt2017, Henschke et al. Reference Henschke, Pakhomov, Groeneveld and Meyer2018, Henschke et al. Reference Henschke, Cherel, Cotte, Espinasse and Hunt2021), as the warm water (3–4°C) and low (< 1 μg l−1) chl a concentrations were conducive to salp growth (Ariffian et al. Reference Ariffian, Swadling, Moteki and Ishak2024). In comparing these measurements of salps to those of Kelly et al. (Reference Kelly, Corney, Melbourne-Thomas, Kawaguchi, Bestley, Fraser and Swadling2020), it was found that the salps in this study were at a developmental stage, with sizes ranging from 38 to 45 mm (see Fig. S3).
Conclusion
The zooplankton community structure in the south-eastern Indian sector of the SO in the austral summer of 2022/2023 did not differ much from that found in other studies conducted within the same region. Copepods emerged as the dominant group in the zooplankton communities across the studied transects, where some species have been identified to be adapted to specific oceanic fronts. Factors such as body size and life stage also influenced species distribution, with smaller species being more abundant in the warmer northern waters and larger species being prevalent in the colder southern waters. Non-copepod taxa, such as chaetognaths (Eukrohnia sp. and Sagitta sp.) and S. thompsoni, exhibited distribution patterns that were driven by not only environmental conditions but also their capacity for vertical migration. Importantly, sampling timing may influence their presence and abundance relative to their migratory behaviour, which should be considered when interpreting community composition data. Overall, these findings improve our understanding of the spatial structuring of zooplankton communities in relation to oceanographical fronts and highlight the importance of both biological traits and physical factors in shaping species distributions. Such insights are critical for predicting the responses of zooplankton communities to the ongoing climate-driven changes in oceanographical conditions.
Supplementary material
To view supplementary material for this article, please visit http://doi.org/10.1017/S0954102025100412.
Acknowledgements
The authors sincerely thank the TRV Umitaka-maru captain and crew members for their assistance during zooplankton sampling and for ensuring our safety. The authors also appreciate Atsushi Yamaguchi (Hokkaido University) for help with identifying the unknown copepod species and Christine Weldrick for help with sample preparation.
Financial support
This study was supported by a Yayasan Penyelidikan Antartika Sultan Mizan (YPASM) Research Grant under the Smart Partnership Initiative 2020: ‘The Fate of Salps in a Changing Ocean: Emerging Environmental Consequences for the Indian Ocean Sector of the Southern Ocean’ (Vot No. 53479 to NHAI) and Grant-in-aid for Science (No. 17H06319 to MM).
Competing interests
The authors declare none.
Author contributions
KMS, MM and NHAI and conceived the project. NNAA, MM and NHAI contributed to data collection and fieldwork. PHK conducted the analysis for Figs 1–3, and NNAA performed the analysis for Figs 4–6 & Tables II & III. All authors participated in writing the manuscript, with KMS, MM and NHAI overseeing the research. PHK and MCO contributed to the revision of the text.


 Open access