
INTRODUCTION
Free data sets of LiDAR (Light Detection and Ranging) exist for Mexican researchers. Recently, Golden and colleagues (Reference Golden, Murtha, Cook, Shaffer, Schroder, Hermitt, Pirpi and Scherer2016) provided information on one LiDAR dataset produced for biologists. Here we provide an example of how another dataset available to cartographers and archaeologists may be employed. The Instituto Nacional de Estadística y Geografía (INEGI) provides the derivatives of the LiDAR data collected for different locales within Mexico at no charge to researchers who agree not to use it for commercial purposes (INEGI 2015; Williams et al. Reference Williams, Kleber and Arrowsmith2015). Throughout this paper, we discuss the utility and limitations of these INEGI data through application at the site of Matacanela, located in the Tuxtla Mountains of Veracruz.
LIDAR APPLICATIONS IN MESOAMERICA
The topographical mapping of sites is standard practice in archaeology. In Mesoamerica, as in other locations, it is useful for documenting monumental architecture, terraforming, and small-scale features, and situating them within broader contexts pertaining to the cultural landscape. More recently, the use of airborne LiDAR has increasingly aided the mapping of ancient landscapes (e.g., Chase et al. Reference Chase, Chase, Weishampel, Drake, Shrestha, Slatton, Awe and Carter2011, Reference Chase, Chase, Fisher, Leisz and Weishampel2012, Reference Chase, Chase, Awe, Weishampel, Iannone, Moyes, Yaeger, Brown, Shrestha, Carter and Díaz2014, Reference Chase, Reese-Taylor, Fernandez and Chase2016; Loughlin et al. Reference Loughlin, Pool, Shrestha and Fernandez2016; Rosenswig et al. Reference Rosenswig, López-Torrijos, Antonelli and Mendelsohn2013). This latter fact is well established, as is the realization that LiDAR can be especially efficient for covering large regions at a very fine grain of analysis—often to centimeters—in a matter of days. Because of LiDAR's ability to penetrate vegetation, and with additional processing to remove those camouflaging layers, LiDAR is especially beneficial in areas with dense forest cover that impedes or slows standard topographical mapping and inhibits the retrieval of other basic archaeological information based on standard survey procedures.
The early use of LiDAR technology to examine archaeological landscapes began in Europe (Bewley et al. Reference Bewley, Crutchley and Shell2005; Shell and Roughley Reference Shell and Roughley2004; Sittler Reference Sittler, Thies, Spiecker and Weinacker2004), and has since spread worldwide (Bewley Reference Bewley2003; Crow et al. Reference Crow, Benham, Devereux and Amable2007; Faltýnová and Nový Reference Faltýnová and Nový2014; Gallagher and Josephs Reference Gallagher and Josephs2008; NOAA 2012; Pluckhahn and Thompson Reference Pluckhahn and Thompson2012; Riley Reference Riley2009; Sithole and Vosselman Reference Sithole and Vosselman2004). In Mesoamerica, the benefits of LiDAR-based methods are well publicized and have been previously discussed for the regions surrounding Caracol (Chase et al. Reference Chase, Chase, Awe, Weishampel, Iannone, Moyes, Yaeger, Brown, Shrestha, Carter and Díaz2014) and Izapa (Rosenswig et al. Reference Rosenswig, López-Torrijos, Antonelli and Mendelsohn2013) in the tropical lowlands, and Angamuco near Lake Patzcuaro (Fisher et al. Reference Fisher, Leisz and Outlaw2011; see also Carter et al. Reference Carter, Shrestha, Fisher and Leisz2012), as well as other areas. As a result of the efficiency of LiDAR for mapping archaeological landscapes, its use is increasing in frequency (e.g., Chase et al. Reference Chase, Chase, Awe, Weishampel, Iannone, Moyes, Yaeger, Brown, Shrestha, Carter and Díaz2014; Hare et al. Reference Hare, Masson and Russell2014; Loughlin et al. Reference Loughlin, Pool, Shrestha and Fernandez2016; Prufer et al. Reference Prufer, Thompson and Kennett2015). Different kinds of airborne LiDAR produce different results: point, flash, and waveform rely on different methods of collection (Chase et al. Reference Chase, Chase, Awe, Weishampel, Iannone, Moyes, Yaeger, Brown, Shrestha, Carter and Díaz2014, Reference Chase, Reese-Taylor, Fernandez and Chase2016; Doneus et al. Reference Doneus, Briese, Fera and Janner2008). In addition to the kind of airborne LiDAR, the data collection interval determines the ability to detect minor elevation changes. Data collection interval tends to correspond with cost. Archaeological projects specifically designed to incorporate LiDAR as a primary data collection strategy are likely to include funds to cover the significant expense it incurs. This expense, for many projects, may be prohibitive, especially if their aims are not regional in scope or if the projects are designed as doctoral dissertation studies that have lower funding ceilings.
Archaeologists must also consider the limits of LiDAR data. The type of LiDAR used, how it is processed, and point density can all affect the data and how it can be interpreted. Point density reflects the number of laser returns per square meter. In general, a greater number of returns will typically increase the data accuracy, and permit greater detail visibility. Factors such as dense vegetation and post-collection processing, however, may affect the resolution (Prufer et al. Reference Prufer, Thompson and Kennett2015; Tinkham et al. Reference Tinkham, Huang, Smith, Shrestha, Falkowski, Hudak, Link, Glenn and Marks2011). Fernandez-Diaz et al. (Reference Fernandez-Diaz, Carter, Shrestha and Glenni2014) provide numerous examples highlighting data quality issues and canopy penetration. In a review of the data used for this paper, the authors examined other known and topographically mapped archaeological sites. For example, in the processing of these data, Loughlin (personal communication 2014) noticed that one of a pair of recorded mounds at the Epi-Olmec center Tres Zapotes was incorrectly classified as vegetation. In this instance, previously conducted topographical mapping of the site allowed for the error to be identified (Pool and Ohnersorgen Reference Pool, Ohnersorgen and Pool2003).
Balancing Resolution Concerns with Coverage and Budgets
Most research-grade commercial flyovers used by archaeologists contain more than 10 points per meter. By comparison, the original INEGI point cloud, often containing less than one point per meter, was processed to yield a five-meter elevation grid for Matacanela. The availability and price of the INEGI data, however, cannot be surpassed. Moreover, the INEGI LiDAR permit a scale of regional coverage that is typically out of the question for most archaeologists who are relying on standard topographical mapping procedures, and in many cases, can facilitate the construction of topographical maps before setting foot on site. Additionally, in regions where settlement pattern studies have already been documented, new funds intended to map known sites may not be given priority over the detection of unexplored areas. Although the data quality of research-grade LiDAR are far superior, lower point density datasets can nevertheless be especially useful aids in research design and budgeting, not only mapping.
The free LiDAR derivatives provided by INEGI facilitated the first topographical map of Matacanela's site core, outlying site areas including low platform groups, and nearby hinterland locations. Additional expansion of the LiDAR mapping program outward from this project's particular boundaries better facilitates regional integration of archaeological detail. In the case of Matacanela, the nearby Catemaco Valley, and the Hueyapan de Ocampo region, pedestrian archaeological surveys have been conducted, with only basic plan maps produced of obvious mounded architecture. If topographical maps were generated, they were only of formal architectural complexes and not of the surrounding landscape (Killion and Urcid Reference Killion and Urcid2001; Santley and Arnold Reference Santley and Arnold1996). The systematic application and evaluation of this INEGI dataset to a Tuxtlas case study is the first of its kind for the western Tuxtlas uplands, a region that has already been the subject of several studies of settlement patterns (Killion and Urcid Reference Killion and Urcid2001; Santley and Arnold Reference Santley and Arnold1996; Stoner Reference Stoner2012). The utility of this INEGI LiDAR data is that we can add new layers of depth that do not currently exist. These data will also help determine new potential areas for more intensive study in a region dominated by rugged terrain where many archaeological settlements are well beyond modern wheeled transportation corridors. In addition to mapping known sites with greater detail, new settlements will be located and a broader range of human-landscape modifications identified, ultimately improving the archaeological community's ability to preserve and interpret cultural patrimony. Paired with other free remote sensing techniques (e.g., Google Earth satellite imagery), powerful free or low-cost tools are available to make archaeological site recording and preservation more effective and efficient.
MATACANELA
The archaeological site of Matacanela is located in the south-central Tuxtla Mountains, a volcanic massif that erupted from the sedimentary coastal plain of the southern Gulf lowlands (Figure 1). Two main peaks divide the uplands and several others add additional relief. San Martin Tuxtla, active as recent as the late eighteenth century, is in the northwest and Santa Marta Tuxtla is in the southeast. Other lower peaks include Cerro el Vigía, Cerro Cintepec, and San Martin Pajapan. Lake Catemaco, one of Mexico's largest freshwater lakes, lies between San Martin and Santa Marta. Lake Catemaco, the Catemaco River, and most other drainages on the south slopes of San Martin and Santa Marta are tributaries of the Rio San Juan, which itself empties into the Papaloapan Basin. Matacanela is located near the west flank of Cerro Cintepec, a Plio-Pleistocene volcano exploited for basalt by Olmec centers (Gillespie Reference Gillespie1994; Williams and Heizer Reference Williams and Heizer1965). One has a commanding view of Lake Catemaco from the site, as well as access to the southern Tuxtlas foothills. Prehispanic occupation surrounds and underlies the modern community of Zapoapan de Cabañas, located in the municipio of Catemaco, Veracruz. The site's architectural core is divided by Federal Highway 180, which connects the Tuxtlas to regions to the north and west with those in the isthmian region to the south and east. Highway construction in the mid-twentieth century bisected at least two conical mounds at the site (Figure 2).
Regional map showing location of Matacanela in relation to select other Classic Period centers in the Tuxtla Mountains. Map by Venter.

Highway and utility cuts through a mound at Matacanela. Photograph by Venter.

The current research project at Matacanela began in 2014 (Venter Reference Venter2015) and includes topographical mapping (Cuevas Ordoñez and Shields Reference Cuevas Ordóñez and Shields2015), geophysical prospection (Crothers et al. Reference Crothers, Carlson, López and Litteral2015), systematic surface survey (León Estrada and Seale Reference León Estrada and Seale2015), excavation, and the analysis of materials from the site (Arnold Reference Arnold2015; Budar Jiménez Reference Budar Jiménez2015; Lindquist and León Estrada Reference Lindquist and Estrada2015; Venter Reference Venter2015). The emphasis of this project was on internal settlement dynamics for the Classic-Postclassic transition (ca. a.d. 650–1000), a time period that has not been defined with chronological precision (Venter Reference Venter2015). Thus, a subsurface-oriented strategy was crucial; it consequently diverted funds and time away from a more expansive project focused on horizontal excavations.
Early estimates of recovered data, along with a previously documented corpus of stone sculpture, indicate that Matacanela was occupied primarily during the Preclassic and Classic periods (ca. 1200 b.c–a.d. 800), with some minor occupation during the Postclassic (ca. a.d. 800–1521). Castro Leal (Reference Castro Leal1982; see also González Lauck Reference González Lauck1991) suggested an Olmec component, based on a seated animal interpreted as a small jaguar, whereas Coe (Reference Coe and Willey1965) highlighted affinities with Late Classic Maya sites, characteristics that are now generally accepted as being part of a pan-Gulf lowlands suite of attributes (Venter and Pool Reference Venter and Pool2014). Blom and LaFarge (Reference Blom and La Farge1925–1926) attributed several sculptural components to Postclassic inhabitants. Santley (Reference Santley2007) suggested that the center was perhaps subsidiary to Middle Classic Matacapan, whereas Stoner (Reference Stoner2012) has posited association with the center Teotepec, located on the north shore of Lake Catemaco (Arnold and Vanderwarker Reference Arnold and Vanderwarker2008; Thompson et al. Reference Thompson, Arnold, Pluckhaun and VanDerwarker2011). Budar Jiménez (Reference Budar Jiménez2015), in her assessment of stone boxes from the site, suggested that Matacanela's greatest affinities may be with Piedra Labrada and nearby sites on the north slope of Santa Marta.
Initial assessments by the Matacanela Archaeological Project (MAP) of temporality were based on stylistic comparisons with regional data that suggest that the site area was first occupied as late as the Middle Formative, growing in extent during the Late Formative, reaching its height during the Middle to Late Classic periods. The recovery of just a few Postclassic diagnostics suggests that the site was largely depopulated during the Postclassic and Early Colonial periods, but refined earthenwares and majolica patterns, along with early twentieth century accounts (Seler-Sachs Reference Seler-Sachs and Lehman1922; Blom and LaFarge Reference Blom and La Farge1925–1926), indicate reoccupation as late as the eighteenth century. Matacanela was a component of a tobacco plantation until the end of the Porfirio Diaz regime in the early twentieth century, when land reforms divided the site area into the ejidos (communal land holding groups mandated by the Mexican Constitution) of Zapoapan de Cabañas, La Victoria, and Pozolapan (Cartagena).
PREVIOUS MAPPING AT MATACANELA
Matacanela has been repeatedly visited by archaeologists, starting with Eduard and Caecilie Seler in 1922 (Seler-Sachs Reference Seler-Sachs and Lehman1922) and followed by Blom and La Farge (Reference Blom and La Farge1925–1926) a few years later. The stone sculpture from the site received most of the attention of these visitors in subsequent publications. Valenzuela (Reference Valenzuela1945) and Ruppert (in Valenzuela Reference Valenzuela1945) were ostensibly more interested in understanding the site's occupational history and, as a result, conducted trench excavations in some of the site's principal mounds, several of which are arranged into formal mound-plaza configurations. In a brief summary of the visit, Valenzuela (Reference Valenzuela1945) compared the principal mound-plaza group in the site core to another at nearby Teotepec (Arroyo Agrio) but, unlike his work at nearby Matacapan and Agaltepec, he produced no map of Matacanela. Valenzuela suggested that two long mounds in a quadripartite plaza might represent a ballcourt, but the mounds he referenced do not appear to be those included in Pool's sketch map (see discussion below). Valenzuela's comparisons of the plazas at Matacanela and Teotepec led Urcid and Killion (Reference Urcid, Killion, Arnold and Pool2008) to suggest that Matacanela contained a rare upland example of a Long-Plaza Group (LPG), an architectural configuration common to areas south of the Tuxtlas but not to the north, where a different architectural configuration, the Standard Plan, is dominant (Daneels Reference Daneels, Arnold and Pool2008; Stark Reference Stark, Arnold and Pool2008). Teotepec's LPG is characterized by the elongated plaza configuration that gives the particular mound-plaza group style its name. The in-line character of Teotepec's ballcourt, however, is more commonly found in Standard Plans, which are typically characterized by more square plaza dimensions. Ballcourts appended to LPGs are typically parallel to a framing long mound (e.g., Urcid and Killion Reference Urcid, Killion, Arnold and Pool2008:Figure 16). Arnold (personal communication 2016) suggests that hybrid features of the two styles exist at Teotepec. Indeed, hybridity of attributes is something that would be expected along the boundary of two distinct architectural style zones.
The clarification of the quadripartite architectural format at Matacanela was an important goal of the current project because of the implications it has regarding political boundaries in the Gulf lowlands (Venter and Pool Reference Venter and Pool2014). Clarification of this complex at Matacanela was aided by the processing of the INEGI LiDAR data and topographical mapping that are discussed here, as well as by shallow geophysical prospecting conducted in 2014 (Crothers et al. Reference Crothers, Carlson, López and Litteral2015).
In the 1970s, Francisco Beverido and Robert Squire included Matacanela in their regional survey but none of their results were published. It is unknown if they produced a map, as their notes are unavailable for review (Ponciano Ortiz, personal communication 2013). Thus, despite the history of early-to middle twentieth century site visits and excavations, no site plan or topographic map had ever been generated for Matacanela.
Only more recent visits have produced results relevant to the mapping of the site. The first known sketch of Matacanela's core was produced by Pool and Arnold in 1993 during a quick site visit. Although the map is not to scale, most of the mounds comprising Matacanela's architectural center are shown (Figure 3a). Pool's informal map shows the quadripartite plaza mentioned by Valenzuela; Pool delimited the plaza on its south side by a probable low ball court. Additional range and conical mounds are shown on both sides of the federal highway in Pool's map, some of which are arranged in formal complexes with varying degrees of access.
Prior sketch maps of Matacanela's architectural core: (a) unpublished field sketch by Christopher Pool, (b) sketch by Omar Campos (in Heredia Reference Heredia Barrera2007). Digitization by Venter.

More recently, Omar Campos produced another plan map of a portion of Matacanela's architectural core (Figure 3b; Heredia Reference Heredia Barrera2007). This map also shows some of the same architectural elements as Pool's sketch but the orientation on this map is not correct and some structures are inaccurately depicted. Campos's map also seems to include a portion of the natural hill that delimits the northeast edge of the architectural core. The plaza, which Pool noted as quadripartite, Campos leaves open. He does not note the modification of the natural rise to create the east mound of the mound-plaza group. Campos also omits the low mound that delineates the south side of the probable ball court on Pool's map. To the south, Campos depicts three mounds, two of them with great height, with one that was cut by the federal highway. He also shows the southern formal complex depicted by Pool. Campos also shows multiple mounds on the west side of the highway, indicating, as does Pool, that the settlement continues to the west. In the summer of 2011, an informal site visit by Venter and Arnold assessed the content of the two previous maps. Subsequent processing of LiDAR data and topographical mapping has created a more complete and detailed site plan.
LIDAR-DERIVED DATA FROM INEGI
In Mexico, INEGI provides its LiDAR derivatives at no charge. Although the point density of the INEGI data is low, it facilitated the first topographical map of Matacanela and environs (Williams et al. Reference Williams, Kleber and Arrowsmith2015). Stoner (Stoner and Pool Reference Stoner and Pool2015) used these regional LiDAR data in combination with published contour maps (in the case of Matacapan), to generate hybrid maps of Totocapan and Matacapan, two centers that are also located in the Tuxtla Mountains (Figure 1). Our application of LiDAR data to the Matacanela project area represents the first systematic critical assessment of their use in archaeological research design in the region. We hope that additional projects with access to low-resolution LiDAR in Mexico and elsewhere may benefit from our comparison of mapping methods. As a cautionary note, however, others have highlighted that lower resolution data and vegetative constraints will limit map accuracy and impede site identification (Fernandez-Diaz et al. Reference Fernandez-Diaz, Carter, Shrestha and Glenni2014; Vaughn Reference Vaughn2015). Vaughn (Reference Vaughn2015:43, 101), using similar quality INEGI data for northern Quintana Roo, determined these similar LiDAR derivatives were not entirely suitable for the detection of structures or undocumented Maya archaeological sites. Coarse resolution of the data, filtering algorithms used to produce the DSM and DTM, and vegetation ranging from wetlands to forests in various states of growth contributed to this determination. Fieldwork and ground-truthing are still necessary.
The airborne LiDAR data for Veracruz was collected in October 2010 by INEGI (2015). These data were collected as a point cloud of laser returns, or LAS files. The LAS was classified into distinct categories such as ground, vegetation, or water. These points were then used to generate raster surfaces (GRID files). Two types of raster layers provided by INEGI were utilized. These were Digital Surface Models (DSM), which shows all surfaces, including trees and buildings, and Digital Terrain Models (DTM), which are processed to show only the bare earth surface (Figure 4). The data was intended to support a five meter grid-cell raster and a vertical resolution of one meter.
Side-by-side comparison of DSM (left) and DTM maps (right), with a hill-shaded relief model visualization of a coffee grove in Matacanela's site core. Images by Shields.

DTMs and DSMs –Working with LiDAR-Derived Data
The INEGI LiDAR, though low quality, is extremely useful as a prescreening tool in advance of fieldwork. To better prepare project boundaries and field schedules, the DSM and DTM were used to examine a broad area around Matacanela prior to the initiation of fieldwork in 2014. A comparison between these newly generated maps and photos and notes from the previous year's visits showed a favorable relationship to what had already been documented. Notably detected were the parallel low long mounds that close the south side of the quadripartite plaza, lending greater evidence for the presence of a ball court (present in Pool's sketch, but partially absent from that of Campos [Figure 3]), additional low mounds around the margins of Matacanela's site core, and a great deal of detail regarding the landform on which the site is located—detail that is compressed on the 1:24,000 San Andrés topographic quadrangle. Subsequent shallow geophysical prospection of these mounds reinforced their ballcourt identification (Crothers et al. Reference Crothers, Carlson, López and Litteral2015). The presence of a ballcourt, found in combination with the other structures in this complex, places the construction style firmly within the range of variability documented for the southern LPG (sometimes referred to as the Villa Alta Quadripartite Architectural [Borstein Reference Borstein2005]) tradition, but with some features of the Standard Plan (discussed further below).
The two GRID files were opened using ESRI's ArcMap 10.2. Although there are low and no-cost GIS software programs (e.g., QGIS [Grass]), because of the wide institutional availability of ESRI software, we did not use them. In ArcMap 10.2, the region around Matacanela was clipped, allowing for easier manipulation of the data and generation of maps. Contours were created using the Spatial Analyst Extension within ArcToolbox. One-meter contours were generated from the DTMs. Additionally, for heuristic purposes, 25- and 50-centimeter (Figure 5) contours were also generated. While these finer contours likely have horizontal and vertical accuracy issues, if the point coverage was adequate within open and unvegetated areas, these contours and elevations might provide insights into areas that had relatively subtle architectural features. Maps showing all surfaces highlighted not only the landscape and terrain, but showed tree lines, field boundaries, and areas of dense vegetation. This information was particularly helpful in achieving a rough estimate of the number of parcel owners with whom to undertake negotiations regarding field survey access, and the type and duration of survey methods needed by area (e.g., surface artifact collection requiring vegetation removal). These data were especially useful when combined with information regarding slope.
One-meter contour version of the site area with a 0.5-km buffer. Image by Shields.

Degrees of slope and aspect were also created using this ESRI extension. These provided insight into the relative steepness of the terrain and watershed drainage patterns. Slope is also a consideration when determining field survey methods. Broad areas of low slope (less than 5 degrees) in the upland areas around Matacanela are conducive to agricultural (crop) production and have the greater potential to contain farmsteads and house clusters. Maps generating various degrees of slope highlighted these favorable areas (Figure 6). Areas of steep topography were considered less likely to contain prehispanic residential and monumental architecture. Conversely, level areas (less than 5 degrees of slope) were considered more likely to contain suitable terrain. Intermediate slopes (5–10 degrees) were also likely to contain evidence for occupation, but slope wash was more likely to characterize these areas than those of a lower gradient. General watershed drainage patterns could also provide insight into agricultural practices and areas of arable land.
Slopes in central Matacanela project area. Image by Shields.

For oblique views and a 3-dimensional perspective, data layers were opened and viewed using ESRI's ArcScene, with viewshed tools in both the 3D Analyst and Spatial Analyst extensions (Figure 7). These data were useful for identifying view shed and line-of-sight, particularly of the core of the site. Although the information generated from oblique and 3-D perspectives was not used in the preparation of the project budget, they may be especially important to the evaluation of settlement and its integration into systems of political authority (e.g., Sullivan Reference Sullivan2002), where lines-of-sight may have been important in regards to rulership and the creation and maintenance of community solidarity through demonstration of a shared ideology, as indicated by architectural symbols.
Oblique perspective of the architectural core facing east-southeast (note the path of Highway 180). Image by Shields.

Multiple enhancements to the raster were made to facilitate interpretation and visualization. The data were resampled using Cubic Convolution. Contrast and brightness were adjusted. Under the Symbology Tab, Hillshade was turned on, a low Z-factor was applied, and an appropriate color ramp was selected. Typically, no Stretch was applied. To work with and highlight specific elevations, the raster was Classified and Defined Intervals were selected. This enabled the color ramp to match specific elevations and contours while excluding higher and lower elevations not relevant to the project at hand. This work was quickly and easily completed prior to the initiation of fieldwork, over the course of a few evenings.
LiDAR-Derived Topographic Maps
Multiple maps were created from these data in the months prior to fieldwork. Maps showing the bare earth highlighted terrain and accurately reflected the ground surface within dense vegetation (Figure 4). These maps identified mounds, earthworks, and landforms with research potential.
One-meter contours were generated for the Matacanela research area, the center of which is shown in Figure 5. This process enabled the first accurate topographical map of Matacanela and its environs to be generated. Maps showing all surfaces highlight not only the landscape and terrain, but tree lines, field boundaries, and areas of dense vegetation (Figure 4). Oblique perspectives, while not accurate for mapping of assessments of scale, still provided insights into view sheds and architectural organization on the landscape (Figure 7). Slope is also a consideration when determining field survey (Figure 6). Broad areas of low slope in the upland areas around Matacanela are conducive to agricultural production and have the potential to contain farmsteads, house clusters, and other evidence for occupation and landscape modification. Maps generating various degrees of slope highlighted these favorable areas.
Together, these maps and images informed the project team prior to the initiation of fieldwork. They facilitated cost and time assessments for the purposes of budget preparation; identified key locations and landforms for initial investigation; and guided decisions on the levels of investigative effort. They also mapped larger areas quickly and easily, and at a relatively accurate scale so that on-the-ground mapping efforts could be more focused on key research areas.
MAKING THE TOPOGRAPHIC MAP
For the generation of the traditional, on-the-ground topographic map, various topographic interpretations were made with the use of satellite pictures, INEGI's 1:24,000 topographical quadrangles (San Andrés), and, of course, the topographic charts generated by the elevation models provided by INEGI. Subsequent confirmation of topographical relief was made on site by walk-over survey to detect both large and small structures and platforms. The mapping was made in a systematic way, with a Sokkia total station equipped with a wooden tripod, two reflectors and caps, one azimuthal compass, wooden sticks, one handheld GPS, and radios.
The process of generating the topographic map revealed 21 above-surface structures. These structures are much more nucleated than many centers in the region, perhaps because of the restricted availability of level terrain in this plateau-like location. The concentration of formal mounded architecture in the northern portion of the plateau would have facilitated an enhanced view of Lake Catemaco to the north, as well as sites along its shoreline and on the islands of Agaltepec and Tenaspi. Most other known regional centers are located in broad river valley floodplains and adjacent stream terraces, or along the shore of Lake Catemaco. Topographical mapping using the Sokkia total station indicates that Matacanela's tallest structure (from foot to peak), located on the west side of the quadripartite mound-plaza group, currently measures approximately 9 meters in height (Figure 8). Intensive cultivation in recent centuries has likely caused some erosion of the original height of this and other mounds.
View looking northwest along the approximate centerline of the quadripartite mound group at Matacanela. Photograph by Venter.

The 2014 map extended 1,450 m northwest-to-southeast, and measured 500 m on its widest axis. Additional mapping conducted in 2015 expanded this area in all directions, provided additional coverage of the mounds located to the west of Highway 180, and added detail to some of the structures identified during survey and through the INEGI LiDAR (Figure 9). Because of the size and relief in the 2015 mapping boundary, the map is produced here using one-meter contour intervals.
2015 Topographical map expansion. Map by Cuevas Ordóñez and Julio García Fernández.

With the western semi-conical mound as its anchor point, the quadripartite mound-plaza group is oriented approximately 60 degrees east of north; topographical mapping indicates that this complex is delimited by a ball court in the south, as suggested by Pool's sketch (Figure 3a), the LiDAR maps, and electromagnetic induction survey (Crothers et al. Reference Crothers, Carlson, López and Litteral2015). The confirmation of this appended parallel ballcourt, combined with the squarer dimensions of the plaza, yields an interesting contrast to the LPG at Teotepec. Whereas the LPG at Teotepec contains the long plaza axis typical of LPGs, the in-line ballcourt is a feature more common in Standard Plans. The position of these two sites at the intersection of the two architectural style zones indicates that the site planners were differentially incorporating elements found to the south and the north. Heterogeneity in material styles is to be expected of boundary zones where interactions are comparatively unfettered or regulated. Daneels (Reference Daneels, Arnold and Pool2008), Pool (Reference Pool, Arnold and Pool2008), Stark (Reference Stark, Arnold and Pool2008), and Urcid and Killion (Reference Urcid, Killion, Arnold and Pool2008) have linked mound-plaza configurations in the Gulf lowlands to the expression of political authority. The mixing of elements of two regional arrangements suggests that the strategies used in the expression of political affiliation may have been somewhat malleable at centers that sat at the margins of the two zones (Venter and Pool Reference Venter and Pool2014).
Two additional tall mounds are located to the south of the quadripartite mound-plaza group at Matacanela, with the conical mound cut by the federal highway. The mounds registered by Campos and Pool on the other side of the federal highway are also visible on the topographic map, along with the L-shaped composite platform south of the settlement. The “L-” or broken “U”-shaped superimposing structure depicted by Pool is also visible, along with end mounds and an interior “step.” This platform is bound on the northeast by a low platform. This composite platform parallels a range mound; together, the two give the appearance of a large ball court, but it is uncertain that the configuration truly represents an arena for the ball game. Several additional low platforms were included in the 21 structure total from the 2014 season. Others were detected during the LiDAR processing, during systematic surface collections, or during the 2015 topographic mapping program (Figures 10a and 10b).
Comparison of (a) LiDAR (contours and hillshade) and (b) 2015 topographic mapping results. Images by (a) Shields and (b) Cuevas Ordóñez.
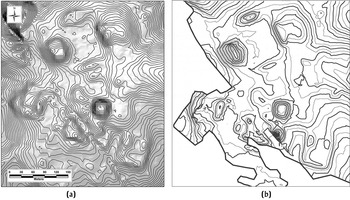
A QUICK COMPARISON
Side by side, one can see the relative accuracy of the LiDAR-derived mapping. But the ground-based mapping yields additional data on specific features that would be missed, especially at the 50-cm contour intervals shown in Figure 10a. For example, LiDAR-derived maps indicate the presence of mounds to the west of Highway 180, but standard topographic mapping declutters the area, making contrasts sharper, allowing for structures to be better delineated not only for their form, but for their size. Also, the large mound cut during highway construction and subsequent utility work is not well defined by the LiDAR imagery. Again, standard topographical procedures better define the structure. Other examples demonstrate how, even for the area of greatest monumental investment, on-the-ground topographical mapping allows for greater accuracy, despite the cost and time investment. Low resolution LiDAR is not without its advantages, however, and this current discussion would not be necessary had higher resolution LiDAR been available.
Benefits of using the INEGI LiDAR Data
There are multiple benefits to using these LiDAR data, both at Matacanela and elsewhere in the Mexican coverage area. First, data collection can cover a large region, and can be collected quickly when the environmental conditions are ideal. Second, unlike traditional topographical mapping, there are no landowner restrictions to collecting the data. Data derivatives can be processed quickly and easily, along with image and contour manipulation. Third, data processing can remove vegetation and structures to show only the bare earth surface, making the generation of accurate maps easier, especially when there are areas of dense vegetation. Fourth, maps showing all surfaces can highlight areas of dense vegetation, which can highlight survey issues early. It is also useful at mapping tree lines, which often indicate field boundaries or property lines, and can serve as reference points during fieldwork. Fifth, maps depicting the slope of the topography can identify areas of disturbance, as well as broad level areas conducive to prehistoric occupation and farming. Sixth, contours can be accurately generated at one-meter intervals. Finally, closer contour intervals, while not necessarily accurate for architectural detail and excavation purposes, can still show relative terrain features.
Limitations of Using the INEGI LiDAR Data
Not all LiDAR data is created equal and even research-grade point densities do not negate the need for fieldwork (Loughlin et al. Reference Loughlin, Pool, Shrestha and Fernandez2016). As detailed by others (e.g., Fernandez-Diaz et al. Reference Fernandez-Diaz, Carter, Shrestha and Glenni2014), some of the following limitations may apply to both lower resolution and higher resolution data. First, as a static data set, LiDAR data will not reflect recent changes to the environment and modifications to the landscape. The frozen moment in time reflected in the data may, however, provide important temporal reference points that allow subsequent landscape changes to be measured, contributing to the reconstruction of environmental histories and facilitating site preservation monitoring. Second, depending on the density of the LiDAR collection, there can be serious accuracy issues (note, however, that total station ground points may have the same issue). Some data sets enable the accurate creation of 10-centimeter contours. At one meter, the data set used for Matacanela is much less accurate. Third, as a result, the low-point density airborne LiDAR may not accurately capture subtle landforms and architecture. Fourth, though efficient, LiDAR collection can be relatively costly and sometimes weather dependent. Finally, there can be data classification issues in the processing of LiDAR, meaning that algorithmic adjustments are sometimes necessary so that mounds may be correctly classified and not removed from the imaging.
Combined Approach
LiDAR derivatives provided good preliminary information to assist in fieldwork planning. They facilitated the generation of contour estimates over a broad area. Yet the data had limitations that could be overcome only by ground-based topographic survey where detail was needed. While the accuracy is better with total station mapping, this method can be time consuming, expensive, and can be limited by vegetation and uncooperative landowners. Time considerations are compounded by a hilly volcanic landscape such as the Tuxtlas. When used together correctly, they allow for a more efficient use of time and money, allow for situational flexibility, and yield data that is sufficient for field projects such as this one.
FINAL CONSIDERATIONS
These LiDAR-based data enabled the first topographical map of Matacanela and its environs to be generated, the project area to be defined, and for cost and time assessments to be estimated for the purposes of budget preparation. Utilization of the INEGI data by other archaeological researchers working in Mexico should become commonplace, especially for preliminary exploration and planning purposes, when dense vegetation is not a limiting factor, and when costlier LiDAR procedures cannot be accommodated. Because of the uncertainty of the quality and resolution of the LiDAR data, we felt that topographical mapping of the site area was an important step to “ground-truth” the LiDAR, as well as to collect more fine-grained measurements from small-scale architectural features, artifact concentrations, and other cultural and natural features that may have been missed during the flyovers. The provisioning of this no-cost dataset by INEGI in Mexico is a tool that even relatively small budgets can and should attempt to utilize as a complementary field analysis strategy.
RESUMEN
En este trabajo, comparamos sistemáticamente los métodos utilizados para la cartografía topográfica de la zona arqueológica de Matacanela, situado en las montañas de Tuxtla, de Veracruz. Específicamente, se comparan los resultados de datos derivados de LiDAR que estan provechados sin cargo por el Instituto Nacional de Estadística y Geografía (INEGI) en México, con los resultados de mapeo topográfico tradicional, mediante una estación total Sokkia. Estos datos INEGI son de grano grueso en comparación con muchos de los conjuntos de datos de LiDAR de pago-por-servicio que se han generado para sitios y regiones de Mesoamérica, como Caracol (Chase et al. Reference Chase, Chase, Fisher, Leisz and Weishampel2012), Izapa (Rosenswig et al. Reference Rosenswig, López-Torrijos, Antonelli and Mendelsohn2013) y Tres Zapotes (Loughlin et al. Reference Loughlin, Pool, Shrestha and Fernandez2016). Para efectos de planificación del proyecto, los datos derivados de LiDAR de INEGI fueron procesados y mapas generados mediante GIS. Estos datos de LiDAR permitieron el primer mapa topográfico de Matacanela y sus alrededores que se generen, el área del proyecto a definir y costo y evaluaciones de tiempo estimado para efectos de la preparación del presupuesto antes de campo de trabajo. Sin embargo, debido a la incertidumbre de la calidad y resolución de los datos LiDAR para detectar elementos bajos, cartografía topográfica de la zona era considerada un paso importante para evaluar el LiDAR y para recoger más mediciones de grano fino de pequeños elementos arquitectónicos, las concentraciones de artefactos y otras características culturales y naturales que pueden haberse omitidos por el proceso. Aquí, tenemos en cuenta los dos enfoques y el tipo y calidad de los datos alcanzados por cada uno, así como las ventajas e inconvenientes de la utilización de cualquiera de los dos enfoques solos. Les recomendamos a los especialistas con acceso a estos datos INEGI o a otras bases de datos similares, que aprovechen la oportunidad de añadir análisis complementarios comparables a sus herramientas arqueológicas estándar.
ACKNOWLEDGMENTS
The Matacanela Archaeological Project is supported by the National Science Foundation (No. BCS-1358063, PI Marcie Venter). Institutional support was provided by the University of Kentucky during the 2014 season, and by the Pennsylvania State University during the 2015 season. Project permissions were granted by the Consejo de Arqueología of the Instituto Nacional de Antropología e Historia, and administered through the Centro Regional in Veracruz. Additional permissions and support for this project were provided by the Municipio of Catemaco and the Ejidos of Zapoapan de Cabañas, La Victoria, Pozolapan, and the community of Ahuatepec. Project assistance was provided by several individuals and project personnel, including Drs. Lourdes Budar Jiménez, Xochitl León, and Philip J. Arnold, as well as several local and student crew members. David Gárate and Julio García were especially capable assistants during the 2014 and 2015 mapping sessions. The quality of this manuscript was greatly improved by feedback by the Ancient Mesoamerica editorial staff, Dr. Deborah Nichols, Dr. Wesley D. Stoner, and several anonymous reviewers. Any inadvertent errors or omissions are the responsibility of the authors.


