





Plain language summary
Stories are not just a chain of events; they are built from changing relationships between characters. Friendships, rivalries and romances give shape to plots and guide how readers experience them. In this article, we study these patterns by tracing relational arcs, namely, how family ties, love, alliances and conflicts rise and fall across novels. Using the Artificial Relationships in Fiction (ARF) dataset, which includes over 120,000 annotated relationships from 96 novels (1850–1950), we find recurring shapes in how ties evolve and show that genres and historical periods favor different patterns. Our results show that relationships are a measurable structure of narrative.
Introduction
Relationships between characters are among the deepest structuring forces of narrative. Plots unfold not only through events, but through transformations of ties: friends become enemies, strangers become lovers and alliances fracture and reform. Classical narratology has long emphasized this relational logic. Aristotle’s Poetics framed recognition (anagnorisis) and reversal (peripeteia) as pivots of dramatic action (Aristotle 1997); Propp (Reference Propp and Wagner2010) described folktales as patterned exchanges between helpers and opponents; and Greimas formalized actantial roles as relational categories. Later theorists, such as Genette (Reference Genette1980), Brooks (Reference Brooks, Onega and Landa2014) and Phelan (Reference Phelan1989), reinforced the view that narrative progression and reader interpretation are inseparable from the evolving network of interpersonal relations. More recent perspectives, from Altman’s A Theory of Narrative (Altman Reference Altman2008) to Bakhtin’s dialogism (Bakhtin Reference Bakhtin2010), situate these transformations within broader systems of discourse and genre.
In recent years, computational approaches have expanded the scale at which these ideas can be explored. Scholars have modeled stories as social networks, showing that central characters in these networks often play the most pivotal narrative roles (Elson, Dames, and McKeown Reference Elson, Dames, McKeown, Hajič, Carberry, Clark and Nivre2010; Hamilton et al. Reference Hamilton, Hicke, Mimno, Wilkens, Hämäläinen, Öhman, Bizzoni, Miyagawa and Alnajjar2025; Moretti Reference Moretti2011). Datasets, such as BookNLP and LitBank (Bamman, Underwood, and Smith Reference Bamman, Underwood, Smith, Roth, Matsumoto and O’Connor2014; Bamman, Popat, and Shen Reference Bamman, Popat, Shen, Burstein, Doran and Solorio2019), now make it possible to automatically identify characters and trace their presence across a text. Studies of narrative dynamics have similarly uncovered recurring emotional and thematic “shapes,” such as “rags to riches,” “tragedy” or “recovery,” using sentiment and emotion analysis (Elkins Reference Elkins2022; Moreira et al. Reference Moreira, Bizzoni, Nielbo, Lassen, Thomsen, Akoury, Clark, Iyyer, Chaturvedi, Brahman and Chandu2023a; Öhman et al. Reference Öhman, Bizzoni, Moreira, Nielbo, Bizzoni, Degaetano-Ortlieb, Kazantseva and Szpakowicz2024; Reagan et al. Reference Reagan, Mitchell, Kiley, Danforth and Dodds2016). Yet, while events and emotions have been extensively modeled, the evolution of relationships themselves, the shifting architecture of kinship, alliance and enmity that underlies plot movement, remains underexplored.
Advances in natural language processing (NLP) now make this gap approachable. Relation extraction (RE) has evolved from rule-based and convolutional methods (Zeng et al. Reference Zeng, Liu, Lai, Zhou, Zhao, Tsujii and Hajič2014; Zhang et al. Reference Zhang, Zhong, Chen, Angeli, Manning, Palmer, Hwa and Riedel2017) to generative and few-shot frameworks leveraging large language models (LLMs; Jiang et al. Reference Jiang, Lin, Wang, Sun, Han, Duh, Gómez and Bethard2024; Wadhwa, Amir, and Wallace Reference Wadhwa, Amir, Wallace, Rogers, Boyd-Graber and Okazaki2023; Wei et al. Reference Wei, Cui, Cheng, Wang, Zhang, Huang and Xie2023; Xu et al. Reference Xu, Zhu, Wang, Zhang, Moosavi, Gurevych, Hou, Kim, Kim, Schuster and Agrawal2023). Recent surveys underscore both the methodological maturity of RE (Zhao et al. Reference Zhao, Yang, Yang, Wang, Zhang, Cheng, Lam, Shen and Ruifeng2024) and its limited adaptation to fiction, where relationships are often implicit, perspectival or metaphorical. To explore these challenges in literary contexts, we draw on the Artificial Relationships in Fiction (ARF) dataset (Christou and Tsoumakas Reference Christou, Tsoumakas, Kazantseva, Szpakowicz, Degaetano-Ortlieb, Bizzoni and Pagel2025), a large-scale, fiction-specific corpus of more than 120,000 automatically annotated relationships across 96 novels (1850–1950).
ARF was designed to make the study of narrative relationships both computationally tractable and narratologically meaningful. Each text is segmented into overlapping five-sentence windows and annotated via GPT-4o and a tailored ontology including ties, such as $lover_of$
,
$lover_of$
, $enemy_of$
and
$enemy_of$
and $companion_of$
. This framework allows kinship, friendship, romance and conflict to be analyzed systematically across genres and historical periods. Building on prior resources like BookNLP and LitBank (Bamman, Underwood, and Smith Reference Bamman, Underwood, Smith, Roth, Matsumoto and O’Connor2014; Bamman, Popat, and Shen Reference Bamman, Popat, Shen, Burstein, Doran and Solorio2019), ARF adds a crucial new dimension: it captures how social ties evolve throughout a story rather than treating them as static attributes.
$companion_of$
. This framework allows kinship, friendship, romance and conflict to be analyzed systematically across genres and historical periods. Building on prior resources like BookNLP and LitBank (Bamman, Underwood, and Smith Reference Bamman, Underwood, Smith, Roth, Matsumoto and O’Connor2014; Bamman, Popat, and Shen Reference Bamman, Popat, Shen, Burstein, Doran and Solorio2019), ARF adds a crucial new dimension: it captures how social ties evolve throughout a story rather than treating them as static attributes.
Building on this foundation, we introduce the concept of relational arcs, the trajectories of interpersonal ties as they rise and fall across a novel’s normalized timeline. This perspective bridges narratological theory and computational modeling, proposing that relationships are not merely narrative content but measurable structures of plot. Just as sentiment arcs have revealed recurrent emotional shapes in fiction (Reagan et al. Reference Reagan, Mitchell, Kiley, Danforth and Dodds2016), relational arcs expose recurring “social grammars” of storytelling, patterns such as escalating conflict, cyclical reconciliation or renewed alliance at closure, that organize narrative experience across genres and historical periods.
Methodologically, our work contributes to recent efforts to model narrative as a dynamic system (Pianzola Reference Pianzola2024) and to integrate multiple interpretive dimensions affective, social, perspectival into computational literary analysis (Bizzoni, Feldkamp, and Nielbo Reference Bizzoni, Feldkamp, Nielbo, Haverals, Koolen and Thompson2024b; Feldkamp et al. Reference Feldkamp, Kardos, Nielbo, Bizzoni, Johansson and Stymne2025). It aligns with hybrid frameworks that combine symbolic narratology with data-driven inference (Ranade et al. Reference Ranade, Dey, Joshi and Finin2022). By applying temporal normalization and clustering techniques to ARF’s relational data, we demonstrate that relationship trajectories can be compared across heterogeneous novels, revealing genre-specific “fingerprints” and diachronic shifts in fictional sociality.
In summary, we argue that relationships are not merely thematic or descriptive features of stories, but evolving structures that give measurable form to narrative. Building on the ARF dataset, we show that changes in social ties, such as alliances, rivalries, romances and kinships, constitute a dynamic scaffolding for plot. Our contributions are fourfold:
-
1. Relationship dynamics as structure. We model arcs of relational types across normalized book time to reveal consistent narrative patterns, such as alliances forming early, conflicts peaking near the climax and reconciliations emerging toward closure.
-
2. Temporal normalization for comparability. We align novels of differing lengths through a percent-of-book time scale, enabling corpus-wide comparison of relational trajectories.
-
3. Genre and diachronic variation. We show that genres (romance, adventure, mystery, etc.) and historical periods encode distinctive relational “fingerprints,” reflecting shifting social and cultural norms in fiction.
-
4. Arc families as prototypes. We cluster relationship arcs into a small set of recurrent shapes, specifically Rise, U-shape, Decline and Oscillating that resonate with classical and modern theories of story form (Brooks Reference Brooks, Onega and Landa2014; Reagan et al. Reference Reagan, Mitchell, Kiley, Danforth and Dodds2016).
By linking narratology and NLP, we demonstrate how data-driven methods can recover cultural and theoretical insights about plot, while contributing empirical resources to computational humanities.
The remainder of the article is organized as follows: the “Related work” section situates our work within narratology, computational literary studies and RE. The “Methods” section details our dataset, ontology and methodological pipeline. The “Relationship dynamics as narrative structure” section examines relationship dynamics as narrative scaffolds. The “Distribution and genre/diachronic patterns” section analyzes genre distributions and diachronic shifts. The “Arc families: Clustering trajectories of relations” section identifies recurring “arc families” of relational trajectories. The “Limitations and future directions” section discusses limitations and future directions, and the “Conclusion” section concludes the article.
Related work
The study of narrative relations connects two main traditions: the humanities’ long-standing concern with how stories organize human interaction, and computational methods which turns those ideas into measurable data. From classical narratology to recent large-scale modeling, scholars have tried to explain how characters’ ties, transformations and perspectives shape narrative structure. This section situates our work within four overlapping areas: (1) narratological theories of relational form; (2) computational analyses of narrative structure and dynamics; (3) RE and data resources for literary text; and (4) recent advances in dynamic relational modeling. Together, these literatures provide the conceptual and technical groundwork for modeling relational arcs as time-varying patterns of social meaning in fiction.
Narratology and relational form
Classical narratologists have long emphasized the role of relationships in stories. Aristotle described recognition (anagnorisis) and reversal (peripeteia) as key turning points in plot (Aristotle 1997), and Propp’s Morphology of the Folktale identified recurring roles, such as helpers or opponents, that are defined by their relationships (Propp Reference Propp and Wagner2010). Later scholars, such as Genette (Reference Genette1980), Brooks (Reference Brooks, Onega and Landa2014) and Phelan (Reference Phelan1989) showed how point of view and moral development shape the way readers perceive ties between characters. Altman (Reference Altman2008) and Bakhtin (Reference Bakhtin2010) also emphasized dialogue and interaction as the core of narrative communication.
These ideas have continued to influence more recent theories. Structuralist models, such as Greimas’s actantial scheme, describe characters through their functions and connections rather than their psychology. Modern theorists like Pianzola (Reference Pianzola2024) suggest that stories behave as dynamic systems, where meaning emerges through changing connections over time. Others link literary quality to patterns of coherence and complexity within these relational systems (Bizzoni, Feldkamp, and Nielbo Reference Bizzoni, Feldkamp, Nielbo, Haverals, Koolen and Thompson2024b; Feldkamp et al. Reference Feldkamp, Kardos, Nielbo, Bizzoni, Johansson and Stymne2025). At a broader scale, distant reading and digital literary studies have developed methods for identifying such patterns across hundreds or thousands of books (Jockers Reference Jockers2013; Moretti Reference Moretti2020; Piper Reference Piper2020; Underwood Reference Underwood2019). Our approach continues this line by focusing directly on how interpersonal ties evolve, treating relationships themselves as measurable parts of narrative structure.
Computational approaches to narrative structure
Computational narratology increasingly models stories as measurable systems of agents, events and emotions (Piper, So, and Bamman Reference Piper, So, Bamman, Moens, Huang, Specia and Yih2021; Ranade et al. Reference Ranade, Dey, Joshi and Finin2022). One major line of research, often termed social-network narratology, examines the social architectures of narrative worlds. Elson, Dames, and McKeown (Reference Elson, Dames, McKeown, Hajič, Carberry, Clark and Nivre2010) extracted character networks from Victorian novels based on dialogue proximity, while Moretti (Reference Moretti2011) visualized social graphs in Hamlet to reveal clusters of conflict and alliance. Subsequent work formalized characters probabilistically (Bamman, Underwood, and Smith Reference Bamman, Underwood, Smith, Roth, Matsumoto and O’Connor2014) and expanded annotation resources through corpora like LitBank (Bamman, Popat, and Shen Reference Bamman, Popat, Shen, Burstein, Doran and Solorio2019).
Beyond static networks, researchers have modeled temporal and affective dynamics. Vala et al. (Reference Vala, Jurgens, Piper, Ruths, Màrquez, Callison-Burch and Su2015) linked characters to locations to trace movement, while Iyyer et al. (Reference Iyyer, Guha, Chaturvedi, Boyd-Graber, Daumé, Knight, Nenkova and Rambow2016) and Chaturvedi et al. (Reference Chaturvedi, Iyyer and Daumé2017) used hidden Markov models to infer shifting alliances and rivalries. Reagan et al. (Reference Reagan, Mitchell, Kiley, Danforth and Dodds2016) showed that novels’ emotional trajectories cluster into recurring shapes, such as “rags to riches” and “tragedy,” inspiring a wave of arc-based analyses (Elkins Reference Elkins2022; Moreira et al. Reference Moreira, Bizzoni, Nielbo, Lassen, Thomsen, Akoury, Clark, Iyyer, Chaturvedi, Brahman and Chandu2023a, Reference Moreira, Bizzoni, Öhman, Nielbo, Šeļa, Jannidis and Romanowska2023b; Öhman et al. Reference Öhman, Bizzoni, Moreira, Nielbo, Bizzoni, Degaetano-Ortlieb, Kazantseva and Szpakowicz2024). Öhman et al. (Reference Öhman, Bizzoni, Moreira, Nielbo, Bizzoni, Degaetano-Ortlieb, Kazantseva and Szpakowicz2024) in particular demonstrate that emotional arcs correlate with literary reception, highlighting narrative form as a quantifiable dynamic. Together, these studies move toward a systemic understanding of plot as transformation across time. However, most treat relationships as context or consequence rather than as primary dynamic structures. Our work builds on these insights by modeling relationships themselves as evolving trajectories, relational arcs, that trace how interpersonal structures rise, fall and transform across a story’s timeline.
Relation extraction and literary corpora
RE is a key NLP task concerned with identifying semantic links between entities. Classical approaches combined feature-based classifiers and convolutional architectures (Zeng et al. Reference Zeng, Liu, Lai, Zhou, Zhao, Tsujii and Hajič2014; Zhang et al. Reference Zhang, Zhong, Chen, Angeli, Manning, Palmer, Hwa and Riedel2017; Andrew, Reference Andrew, Chen, Banchs, Duan, Zhang and Li2018), later extended by multi-task neural models that jointly learn entities, relations and coreference (Luan et al. Reference Luan, He, Ostendorf, Hajishirzi, Riloff, Chiang, Hockenmaier and Tsujii2018). A comprehensive survey by Zhao et al. (Reference Zhao, Yang, Yang, Wang, Zhang, Cheng, Lam, Shen and Ruifeng2024) documents the transition to LLM-based and generative RE paradigms, including work emphasizing interpretive fidelity over strict token accuracy (Jiang et al. Reference Jiang, Lin, Wang, Sun, Han, Duh, Gómez and Bethard2024; Wadhwa, Amir, and Wallace Reference Wadhwa, Amir, Wallace, Rogers, Boyd-Graber and Okazaki2023). These developments have greatly improved general-domain RE but remain underapplied to literary text.
Existing literary corpora primarily address entities and mentions, not relationships themselves. BookNLP and LitBank (Bamman, Underwood, and Smith Reference Bamman, Underwood, Smith, Roth, Matsumoto and O’Connor2014; Bamman, Popat, and Shen Reference Bamman, Popat, Shen, Burstein, Doran and Solorio2019) enable large-scale annotation of characters and references; Elson et al. (Reference Elson, Dames, McKeown, Hajič, Carberry, Clark and Nivre2010) and Vala et al. (Reference Vala, Jurgens, Piper, Ruths, Màrquez, Callison-Burch and Su2015) addressed character and location identification; while Soni et al. (Reference Soni, Sihra, Evans, Wilkens, Bamman, Rogers, Boyd-Graber and Okazaki2023) focused on grounding entities across narrative corpora for temporal consistency. Fictional RE poses unique challenges, as ties are often implicit, metaphorical or perspectival. Synthetic data generation using LLMs offers one promising solution: Xu et al. (Reference Xu, Zhu, Wang, Zhang, Moosavi, Gurevych, Hou, Kim, Kim, Schuster and Agrawal2023), Wei et al. (Reference Wei, Cui, Cheng, Wang, Zhang, Huang and Xie2023) and Jiang et al. (Reference Jiang, Lin, Wang, Sun, Han, Duh, Gómez and Bethard2024) demonstrate few-shot and generative RE with GPT-based models.
In the literary domain, Christou and Tsoumakas (Reference Christou and Tsoumakas2021) extracted semantic relations in Greek texts, while the ARF dataset (Christou and Tsoumakas Reference Christou, Tsoumakas, Kazantseva, Szpakowicz, Degaetano-Ortlieb, Bizzoni and Pagel2025) introduced a fiction-specific ontology and synthetic annotation pipeline across 96 novels (1850–1950). ARF provides systematically labeled ties, such as lover_of, enemy_of and companion_of, establishing a foundation for studying relational dynamics in narrative corpora. These developments signal an emerging subfield of “relational narratology,” combining RE with narrative theory to formalize patterns of social meaning in fiction.
Dynamic relational modeling
Research on narrative dynamics has moved beyond static social graphs and one-off relation labels to study how ties change over time (Iyyer et al., Reference Iyyer, Guha, Chaturvedi, Boyd-Graber, Daumé, Knight, Nenkova and Rambow2016; Chaturvedi et al., Reference Chaturvedi, Iyyer and Daumé2017; Prado et al., Reference Prado, Dahmen, Bazzan, Carron and Kenna2016). Early work in literary NLP used unsupervised sequence models to infer shifting alliances and rivalries within novels: Iyyer et al. tracked friendship/rivalry states with topic- and HMM-based methods (Iyyer et al. Reference Iyyer, Guha, Chaturvedi, Boyd-Graber, Daumé, Knight, Nenkova and Rambow2016), and Chaturvedi et al. modeled evolving ties with latent states over narrative timelines (Chaturvedi, Iyyer, and Daume III Reference Chaturvedi, Iyyer and Daumé2017). Related efforts broaden the scope of temporal social modeling: outside print fiction, dynamic character networks in television required methods like narrative smoothing to better align parallel storylines (Bost et al. Reference Bost, Labatut, Gueye, Linarès, Kaya, Kawash, Khoury and Day2018); in film, dynamic centrality shows that character importance is time-dependent (Jones, Quinn, and Koskinen Reference Jones, Quinn and Koskinen2020); and at historical scale, Hamilton et al. map literary social networks diachronically to reveal macro-patterns of connection and isolation across genres and periods (Hamilton et al. Reference Hamilton, Hicke, Mimno, Wilkens, Hämäläinen, Öhman, Bizzoni, Miyagawa and Alnajjar2025). Together, these studies show that dynamic relational analysis is both feasible and informative.
A closely related tradition models arcs over normalized narrative time, typically for emotions or information rather than for explicit social ties. Work on emotional arcs demonstrates that many novels follow a small set of recurring trajectories and popularizes methods for (i) normalizing narrative time and (ii) clustering curves (Elkins Reference Elkins2022; Moreira et al. Reference Moreira, Bizzoni, Nielbo, Lassen, Thomsen, Akoury, Clark, Iyyer, Chaturvedi, Brahman and Chandu2023a, Reference Moreira, Bizzoni, Öhman, Nielbo, Šeļa, Jannidis and Romanowska2023b; Öhman et al. Reference Öhman, Bizzoni, Moreira, Nielbo, Bizzoni, Degaetano-Ortlieb, Kazantseva and Szpakowicz2024; Reagan et al. Reference Reagan, Mitchell, Kiley, Danforth and Dodds2016). Parallel text-analytic studies identify staged progressions and cognitive tension as quantifiable structural processes (Boyd, Blackburn, and Pennebaker Reference Boyd, Blackburn and Pennebaker2020). For locating key shifts, offline change-point detection provides general tools for turn identification (Truong, Oudre, and Vayatis Reference Truong, Oudre and Vayatis2020). While influential for modeling plot movement, these approaches usually treat relationships as context or as static edges rather than as primary, evolving objects of analysis.
To our knowledge, there is no established, peer-reviewed framework in computational literary studies that explicitly defines and aligns relational arcs, that is, time-normalized trajectories of relationship type/strength traced across complete narratives and compared across texts. The closest antecedents are (a) evolving/dynamic character-relationship models and temporal character networks (Bost et al. Reference Bost, Labatut, Gueye, Linarès, Kaya, Kawash, Khoury and Day2018; Chaturvedi, Iyyer, and Daume III Reference Chaturvedi, Iyyer and Daumé2017; Hamilton et al. Reference Hamilton, Hicke, Mimno, Wilkens, Hämäläinen, Öhman, Bizzoni, Miyagawa and Alnajjar2025; Iyyer et al. Reference Iyyer, Guha, Chaturvedi, Boyd-Graber, Daumé, Knight, Nenkova and Rambow2016; Jones, Quinn, and Koskinen Reference Jones, Quinn and Koskinen2020) and (b) arc modeling for emotions and information (Boyd, Blackburn, and Pennebaker Reference Boyd, Blackburn and Pennebaker2020; Elkins Reference Elkins2022; Moreira et al. Reference Moreira, Bizzoni, Nielbo, Lassen, Thomsen, Akoury, Clark, Iyyer, Chaturvedi, Brahman and Chandu2023a, Reference Moreira, Bizzoni, Öhman, Nielbo, Šeļa, Jannidis and Romanowska2023b; Öhman et al. Reference Öhman, Bizzoni, Moreira, Nielbo, Bizzoni, Degaetano-Ortlieb, Kazantseva and Szpakowicz2024; Reagan et al. Reference Reagan, Mitchell, Kiley, Danforth and Dodds2016). We therefore position relational arcs as a novel operationalization that adapts techniques from temporal network modeling and arc analysis while taking relationships themselves as the unit of change.
We introduce relational arcs: continuous, time-normalized traces of how relationship families (e.g., kinship, romance, companionship/mentorship, conflict, societal/collective and ideational/moral) rise and fall throughout a story. Concretely, we (1) normalize narrative time via percent-of-book binning; (2) collapse fine-grained ties into six functional relation families; (3) identify turning points with offline change-point methods; (4) cluster arcs into recurrent shapes (Rise, U-shape, Decline and Oscillating); and (5) compare their distributions across genres and decades. This treats relationships as first-class dynamic objects, complementing static social-network approaches, emotional-arc studies and prior dynamic-state models, and extends RE in fiction through synthetic annotation tailored to literary domains (Christou and Tsoumakas Reference Christou, Tsoumakas, Kazantseva, Szpakowicz, Degaetano-Ortlieb, Bizzoni and Pagel2025).
Methods
Our analysis proceeds in three main stages: (1) constructing relationship arcs from the ARF corpus; (2) normalizing counts in both narrative and corpus time to enable cross-book and diachronic comparison; and (3) detecting local inflections and global trajectory types through change-point and clustering methods. Each methodological decision was guided by the dual need for interpretability within narratological theory and reproducibility in large-scale corpus analysis.
Dataset: Artificial relationships in fiction
Our study builds on the ARF dataset, a synthetically annotated corpus for RE in literary prose (Christou and Tsoumakas Reference Christou, Tsoumakas, Kazantseva, Szpakowicz, Degaetano-Ortlieb, Bizzoni and Pagel2025). ARF contains 96 English-language novels (ca. 1850–1950) sourced from Project Gutenberg and balanced across author gender and diverse topics. Texts are segmented into overlapping five-sentence windows (stride $=1$
), which serve as the fundamental analytical units (chunks). Using a fiction-specific ontology (48 relation types; 11 entity types) and a guided GPT-4o pipeline, ARF provides structured relation mentions at the chunk level. The release used here includes
$=1$
), which serve as the fundamental analytical units (chunks). Using a fiction-specific ontology (48 relation types; 11 entity types) and a guided GPT-4o pipeline, ARF provides structured relation mentions at the chunk level. The release used here includes $95{,}475$
annotated windows and
$95{,}475$
annotated windows and $>{}120{,}000$
relation mentions (mean
$>{}120{,}000$
relation mentions (mean $\approx 995$
chunks/book;
$\approx 995$
chunks/book; $\approx 1.34$
relations/chunk). Multiple relations can occur within a single chunk.
$\approx 1.34$
relations/chunk). Multiple relations can occur within a single chunk.
Annotation structure and reliability
The GPT-4o annotation pipeline followed a structured prompting schema combining textual extraction with ontology-driven reasoning. Each window was evaluated for all character pairs mentioned in its span, and the model returned zero or more relation tuples $\langle e_1,\,r,\,e_2\rangle $
. This design ensures high recall for local relation cues while maintaining controlled relation vocabulary, a balance comparable to human-assisted RE protocols in other interpretive domains (Jiang et al. Reference Jiang, Lin, Wang, Sun, Han, Duh, Gómez and Bethard2024; Wadhwa, Amir, and Wallace Reference Wadhwa, Amir, Wallace, Rogers, Boyd-Graber and Okazaki2023). Because windows overlap by four sentences, the dataset preserves contextual continuity but introduces partial dependence between adjacent chunks. This redundancy supports smoother temporal aggregation later on: counts are averaged per-bin (“Temporal normalization of relationship arcs” section) so that overlapping contexts contribute proportionally rather than inflating totals. The resulting intensity measures (events per chunk) thus approximate continuous relational density over narrative time.
$\langle e_1,\,r,\,e_2\rangle $
. This design ensures high recall for local relation cues while maintaining controlled relation vocabulary, a balance comparable to human-assisted RE protocols in other interpretive domains (Jiang et al. Reference Jiang, Lin, Wang, Sun, Han, Duh, Gómez and Bethard2024; Wadhwa, Amir, and Wallace Reference Wadhwa, Amir, Wallace, Rogers, Boyd-Graber and Okazaki2023). Because windows overlap by four sentences, the dataset preserves contextual continuity but introduces partial dependence between adjacent chunks. This redundancy supports smoother temporal aggregation later on: counts are averaged per-bin (“Temporal normalization of relationship arcs” section) so that overlapping contexts contribute proportionally rather than inflating totals. The resulting intensity measures (events per chunk) thus approximate continuous relational density over narrative time.
Formalization
For book b with $L_b$
chunks, let
$L_b$
chunks, let $\mathcal {R}_{b,i}$
denote the multiset of relation mentions in chunk
$\mathcal {R}_{b,i}$
denote the multiset of relation mentions in chunk $i\in \{1,\dots ,L_b\}$
. For each relation type r and each relation family f, raw counts are
$i\in \{1,\dots ,L_b\}$
. For each relation type r and each relation family f, raw counts are
 $$ \begin{align} C_{r,b}=\sum_{i=1}^{L_b}\Big|\{\,m\in\mathcal{R}_{b,i}:\mathrm{type}(m)=r\,\}\Big|, \qquad C_{f,b}=\sum_{r\in\mathrm{members}(f)}C_{r,b}. \end{align} $$
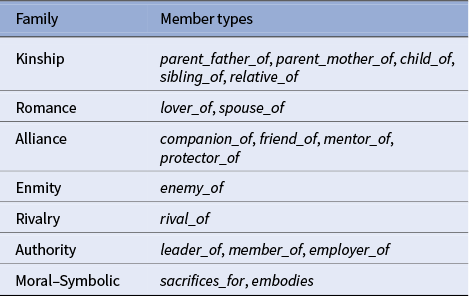
Relation families aggregate semantically related types to stabilize estimates, pool sparse categories and support cross-genre comparison (Table 1). Genre metadata are derived from Project Gutenberg’s multi-label topics; books contribute to every genre tag they hold.
Compact taxonomy of relation families derived from the ARF ontology
Relation typology and interpretive function
The six relation families correspond to canonical social functions in narratology: Kinship (blood relations, inheritance and obligation), Romance (intimacy, desire and union), Alliance (companionship, mentorship and cooperation), Enmity and Rivalry (antagonism and competition), Authority (hierarchy and leadership) and Moral–Symbolic (sacrifice and embodiment of ideals). These categories operationalize narratological oppositions, such as helper/opponent or eros/thanatos (Bakhtin Reference Bakhtin2010; Propp Reference Propp and Wagner2010), enabling comparison between modern statistical arcs and classical role structures. They also ensure interpretive coherence when clustering trajectories across genres (“Arc Families: Clustering Trajectories of Relations” section).
Corpus coverage and representativeness
ARF covers the period 1850–1950, spanning the high-Victorian novel, late realism and early modernist periods, and capturing transitions in relational norms from domestic kinship plots to professionalized and collective networks. Temporal coverage allows testing diachronic hypotheses such as the shift from kin-structured to companionship-driven plots (“Distribution and genre/diachronic patterns” section). The six genre groupings below were manually consolidated from Gutenberg topic metadata to balance interpretability and sample size. Multi-label assignment reflects overlapping literary taxonomies rather than exclusive categories.
Genres analyzed
For genre-sensitive results (“Relationship dynamics as narrative structure,” “Distribution and genre/diachronic patterns” and “Arc families: Clustering trajectories of relations” sections), we focus on six interpretable groupings derived from ARF topics; assignment is multi-label and title lists appear below:
-
• Domestic Fiction (“domestic fiction”);
-
• Love Stories (“love stories”);
-
• Adventure Stories (“adventure stories”);
-
• Historical Fiction (“historical fiction”);
-
• Mystery & Detective Stories (“mystery fiction” and “detective and mystery stories”);
-
• Children’s & Folk Narratives (“children’s stories,” “fairy tales” and “folklore”).
Overall, ARF offers a rare combination of narrative breadth and structural annotation depth, enabling quantitative modeling of how interpersonal ties evolve across time, genre and historical period.
Temporal normalization of relationship arcs
Because book length $L_b$
varies widely and chapters are inconsistently defined, we normalize narrative time to equal-length bins following established practices in cultural analytics and story-arc modeling (Jockers Reference Jockers2013; Reagan et al. Reference Reagan, Mitchell, Kiley, Danforth and Dodds2016). Each book is divided into N equal segments of relative length
$L_b$
varies widely and chapters are inconsistently defined, we normalize narrative time to equal-length bins following established practices in cultural analytics and story-arc modeling (Jockers Reference Jockers2013; Reagan et al. Reference Reagan, Mitchell, Kiley, Danforth and Dodds2016). Each book is divided into N equal segments of relative length $1/N$
(default
$1/N$
(default $N{=}20$
, i.e., 5% slices). Bin k covers all chunks satisfying
$N{=}20$
, i.e., 5% slices). Bin k covers all chunks satisfying
 $$ \begin{align} \mathcal{I}_{b,k}=\Big\{i:\Big\lfloor \frac{(i-1)N}{L_b}\Big\rfloor+1=k\Big\},\qquad k=1,\ldots,N. \end{align} $$
For relation type r, we compute its per-bin intensity as events per chunk:
 $$ \begin{align} f_{r,b,k}=\frac{1}{|\mathcal{I}_{b,k}|}\sum_{i\in\mathcal{I}_{b,k}}|\{m\in\mathcal{R}_{b,i}:\mathrm{type}(m)=r\}|. \end{align} $$
Family-level rates sum over member types:
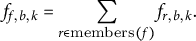 $$ \begin{align} f_{f,b,k}=\sum_{r\in\mathrm{members}(f)}f_{r,b,k}. \end{align} $$
The resulting vector $a_{x,b}=(f_{x,b,1},\dots ,f_{x,b,N})$
for
$a_{x,b}=(f_{x,b,1},\dots ,f_{x,b,N})$
for $x\in \mathcal {T}\cup \mathcal {F}$
constitutes the relationship arc for book b. Case-study books employ an adaptive number of bins to guarantee sufficient data density:
$x\in \mathcal {T}\cup \mathcal {F}$
constitutes the relationship arc for book b. Case-study books employ an adaptive number of bins to guarantee sufficient data density:
 $$ \begin{align} N=\min\!\big(20,\max(6,\lfloor R_b/m\rfloor)\big), \end{align} $$
where $R_b$
is the total number of relation events in b and
$R_b$
is the total number of relation events in b and $m{=}15$
is the target minimum number of mentions per bin. For visualization, a light
$m{=}15$
is the target minimum number of mentions per bin. For visualization, a light $2$
–
$2$
– $3$
bin moving average smooths noise, but no smoothing is applied in corpus-level analyses.
$3$
bin moving average smooths noise, but no smoothing is applied in corpus-level analyses.
Frequency normalization for distributions and diachrony
To compare relational prevalence across books of differing length, we report rates per 1,000 chunks:
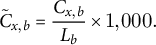 $$ \begin{align} \tilde{C}_{x,b}=\frac{C_{x,b}}{L_b}\times1,000. \end{align} $$
Since $L_b\approx 995$
on average, this scale approximates a “per-novel” rate and yields comparable magnitudes. We also verify robustness using per-book z-scores. To visualize both magnitude and relative prominence, we display (i) absolute-frequency heatmaps (per 1,000 chunks) and (ii) column-standardized panels, where each relation’s frequency is converted to percentile scores across genres.
$L_b\approx 995$
on average, this scale approximates a “per-novel” rate and yields comparable magnitudes. We also verify robustness using per-book z-scores. To visualize both magnitude and relative prominence, we display (i) absolute-frequency heatmaps (per 1,000 chunks) and (ii) column-standardized panels, where each relation’s frequency is converted to percentile scores across genres.
Turning-point detection (local inflections)
To capture internal modulation within arcs (e.g., onset, rupture or recovery), we apply a simple yet robust change-point detector (Truong, Oudre, and Vayatis Reference Truong, Oudre and Vayatis2020). For a discrete series $a=(a_1,\dots ,a_N)$
, let first differences
$a=(a_1,\dots ,a_N)$
, let first differences $\Delta a_k=a_{k+1}-a_k$
. A turning point at
$\Delta a_k=a_{k+1}-a_k$
. A turning point at $k^\ast $
is flagged if three conditions hold:
$k^\ast $
is flagged if three conditions hold:
-
1. $\mathrm {sign}(\Delta a_{k^\ast -1})\neq \mathrm {sign}(\Delta a_{k^\ast })$
(slope reversal);
$\mathrm {sign}(\Delta a_{k^\ast -1})\neq \mathrm {sign}(\Delta a_{k^\ast })$
(slope reversal); -
2.
$\min (|\Delta a_{k^\ast -1}|,|\Delta a_{k^\ast }|)\ge \tau $
, where
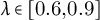
$\tau =\lambda \cdot \mathrm {MAD}(\Delta a)$
and
$\lambda \in [0.6,0.9]$
; -
3. local prominence exceeds a relative threshold
$\pi \approx 0.25$
(in z units) compared to neighboring bins.




Here, $\mathrm {MAD}(x)=\mathrm {median}(|x-\mathrm {median}(x)|)$
ensures robustness against outliers. Detected inflections are labeled Onset, Rupture, Recovery or Denouement based on their sign pattern and temporal position.
$\mathrm {MAD}(x)=\mathrm {median}(|x-\mathrm {median}(x)|)$
ensures robustness against outliers. Detected inflections are labeled Onset, Rupture, Recovery or Denouement based on their sign pattern and temporal position.
Distributional and diachronic analyses
For each book and relation type or family x, we compute normalized frequencies $\tilde {C}_{x,b}$
. Aggregating by genre yields mean values per genre g:
$\tilde {C}_{x,b}$
. Aggregating by genre yields mean values per genre g:
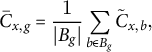 $$ \begin{align} \bar{C}_{x,g}=\frac{1}{|B_g|}\sum_{b\in B_g}\tilde{C}_{x,b}, \end{align} $$
where $B_g$
denotes the set of books tagged with genre g (multi-labeled books contribute to all tagged genres). Distinctiveness across genres is additionally summarized via log-odds ratios with a symmetric Dirichlet prior (Bamman, Underwood, and Smith Reference Bamman, Underwood, Smith, Roth, Matsumoto and O’Connor2014).
$B_g$
denotes the set of books tagged with genre g (multi-labeled books contribute to all tagged genres). Distinctiveness across genres is additionally summarized via log-odds ratios with a symmetric Dirichlet prior (Bamman, Underwood, and Smith Reference Bamman, Underwood, Smith, Roth, Matsumoto and O’Connor2014).
For diachrony, publication years are floored to decades ( $\mathrm {Decade}=\lfloor \mathrm {year}/10\rfloor \times 10$
). Trends are estimated by ordinary least squares:
$\mathrm {Decade}=\lfloor \mathrm {year}/10\rfloor \times 10$
). Trends are estimated by ordinary least squares:
 $$ \begin{align} \tilde{C}_{x,b}=\beta_0+\beta_1\,\mathrm{Decade}_b+\varepsilon_b, \end{align} $$
reporting slope $\beta _1$
, confidence intervals and p-values. For robustness, we also fit a Poisson or negative-binomial generalized linear model with book-length offset:
$\beta _1$
, confidence intervals and p-values. For robustness, we also fit a Poisson or negative-binomial generalized linear model with book-length offset:
 $$ \begin{align} \log\mathbb{E}[Y_{x,b}]&=\beta_0+\beta_1\,\mathrm{Genre}_g+\beta_2\,\mathrm{Decade}_b\nonumber\\&\quad+\beta_3\,(\mathrm{Genre}_g\times\mathrm{Decade}_b)+\log L_b. \end{align} $$
Given multiple comparisons across relation families and genres, we interpret results in terms of effect size and direction rather than null-hypothesis significance testing.
Clustering of arc families (global trajectory typology)
To identify recurrent global shapes, we cluster per-book arcs using a shape-based vectorization. Each arc is resampled to $N{=}20$
bins and z-normalized within book–relation pair:
$N{=}20$
bins and z-normalized within book–relation pair:
 $$ \begin{align} \bar{a}_{x,b,k}&=\frac{a_{x,b,k}-\mu_{x,b}}{\sigma_{x,b}},\quad \mu_{x,b}=\frac{1}{N}\sum_{k}a_{x,b,k},\nonumber\\ \sigma_{x,b}&=\sqrt{\frac{1}{N}\sum_{k}(a_{x,b,k}-\mu_{x,b})^2}. \end{align} $$
This centers on shape over scale. We employ Euclidean k-means and scan $k\in \{3,4,5,6\}$
, selecting
$k\in \{3,4,5,6\}$
, selecting $k{=}4$
by silhouette score and interpretability, yielding four principal prototypes: Rise, U-shape, Decline and Oscillating. Centroids are diagnosed by global slope, mid-vs.-end contrast, and number of inflections, following conventions in quantitative story-arc research (Jockers Reference Jockers2013; Reagan et al. Reference Reagan, Mitchell, Kiley, Danforth and Dodds2016).
$k{=}4$
by silhouette score and interpretability, yielding four principal prototypes: Rise, U-shape, Decline and Oscillating. Centroids are diagnosed by global slope, mid-vs.-end contrast, and number of inflections, following conventions in quantitative story-arc research (Jockers Reference Jockers2013; Reagan et al. Reference Reagan, Mitchell, Kiley, Danforth and Dodds2016).
Because arcs may differ in phase, we repeat clustering with dynamic time warping (DTW) distance and k-medoids, reporting the adjusted Rand index between partitions as a robustness metric. Rise and U-shape clusters prove highly stable, while Decline and Oscillating boundaries vary modestly. All random seeds are fixed for reproducibility.
Implementation and reproducibility
We implement the full pipeline in Python using datasets (HuggingFace) for corpus handling, numpy/pandas for aggregation, matplotlib for visualization and scikit-learn/ statsmodels for clustering and regression. Defaults are: $N{=}20$
bins (corpus/genre) or adaptive
$N{=}20$
bins (corpus/genre) or adaptive $N\in [6,10]$
(case studies); turning-point thresholds
$N\in [6,10]$
(case studies); turning-point thresholds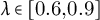 $\lambda \in [0.6,0.9]$
and
$\lambda \in [0.6,0.9]$
and $\pi \approx 0.25$
; decade
$\pi \approx 0.25$
; decade $=\lfloor $
year/10
$=\lfloor $
year/10 $\rfloor \times 10$
; and all analyses retain multi-label genres. Figures and tables are saved with stable filenames to ensure exact replication of all quantitative results and visualizations presented in the “Relationship dynamics as narrative structure,” “Distribution and genre/diachronic patterns” and “Arc families: Clustering trajectories of relations” sections.
$\rfloor \times 10$
; and all analyses retain multi-label genres. Figures and tables are saved with stable filenames to ensure exact replication of all quantitative results and visualizations presented in the “Relationship dynamics as narrative structure,” “Distribution and genre/diachronic patterns” and “Arc families: Clustering trajectories of relations” sections.
Methodological typology (design rationale)
Our methodological design combines two complementary aims: (1) Normalization for comparability: by aligning books of different lengths in both narrative and corpus time, we can compare trajectories across texts and periods and (2) Trajectory discovery and validation: by representing relationships as continuous arcs and clustering them by shape, we can recover recurrent relational prototypes that bridge narratological theory and quantitative modeling. These practices follow established paradigms in cultural analytics (Moretti Reference Moretti2020; Underwood Reference Underwood2019) and story-arc research (Öhman et al. Reference Öhman, Bizzoni, Moreira, Nielbo, Bizzoni, Degaetano-Ortlieb, Kazantseva and Szpakowicz2024; Reagan et al. Reference Reagan, Mitchell, Kiley, Danforth and Dodds2016), while extending them to explicitly social and relational dimensions of narrative.
Relationship dynamics as narrative structure
A long-standing claim in narratology is that plots are organized not only by events but by transformations of relationships. Helpers and opponents emerge, coalitions form and fracture, and lovers separate and reconcile (Aristotle 1997; Brooks Reference Brooks, Onega and Landa2014; Propp Reference Propp and Wagner2010). While sentiment arcs reveal broad story shapes (Elkins Reference Elkins2022; Öhman et al. Reference Öhman, Bizzoni, Moreira, Nielbo, Bizzoni, Degaetano-Ortlieb, Kazantseva and Szpakowicz2024; Reagan et al. Reference Reagan, Mitchell, Kiley, Danforth and Dodds2016), typed relational arcs have not been examined at scale. Building on our ARF corpus and ontology (Christou and Tsoumakas Reference Christou, Tsoumakas, Kazantseva, Szpakowicz, Degaetano-Ortlieb, Bizzoni and Pagel2025),Footnote 1 we model how relation types evolve over normalized narrative time and show that these trajectories function as plot scaffolds at the book, corpus and genre levels.
We represent an arc as the intensity of a relation type (events per chunk) in equal-length percent-of-book bins. For per-book case studies, we use adaptive binning (6–10 bins) to ensure $\geq $
15 events/bin across tracked types; for corpus- and genre-level analyses, we use 20 bins (5% each). Relation types are also grouped into seven compact Relation Families (Kinship, Romance, Alliance, Enmity, Rivalry, Authority and Moral–Symbolic) for comparability across genres, reflecting canonical social functions in narratology, such as obligation, intimacy, cooperation, conflict and hierarchy (Bakhtin Reference Bakhtin2010; Bamman, Underwood, and Smith Reference Bamman, Underwood, Smith, Roth, Matsumoto and O’Connor2014; Hamilton et al. Reference Hamilton, Hicke, Mimno, Wilkens, Hämäläinen, Öhman, Bizzoni, Miyagawa and Alnajjar2025).
$\geq $
15 events/bin across tracked types; for corpus- and genre-level analyses, we use 20 bins (5% each). Relation types are also grouped into seven compact Relation Families (Kinship, Romance, Alliance, Enmity, Rivalry, Authority and Moral–Symbolic) for comparability across genres, reflecting canonical social functions in narratology, such as obligation, intimacy, cooperation, conflict and hierarchy (Bakhtin Reference Bakhtin2010; Bamman, Underwood, and Smith Reference Bamman, Underwood, Smith, Roth, Matsumoto and O’Connor2014; Hamilton et al. Reference Hamilton, Hicke, Mimno, Wilkens, Hämäläinen, Öhman, Bizzoni, Miyagawa and Alnajjar2025).
Illustrative case studies: Relationship arcs in individual novels
To show how typed ties map onto familiar plot moves, we select one novel per genre (Domestic Fiction, Love Stories, Adventure Stories, Historical Fiction, Mystery & Detective Stories and Children’s & Folk Narratives) and compute per-book arcs for six central relation types: companion_of, relative_of, lover_of, spouse_of, enemy_of and rival_of. Texts are partitioned into 6–8 equal bins (adaptive to relation frequency; here eight), and intensities are measured as events per chunk (Figure 1).Footnote 2
Per-book relationship arcs for six genres. Each panel plots six relation types across adaptive 6–8 bins (normalized narrative time; eight shown). Intensities are events per chunk. Case studies: East Lynne (Domestic), Under the Greenwood Tree (Love), Jungle Tales of Tarzan (Adventure), The Long Roll (Historical), The Experiences of a Barrister, and Confessions of an Attorney (Mystery) and The Legends of King Arthur and His Knights (Children’s & Folk).
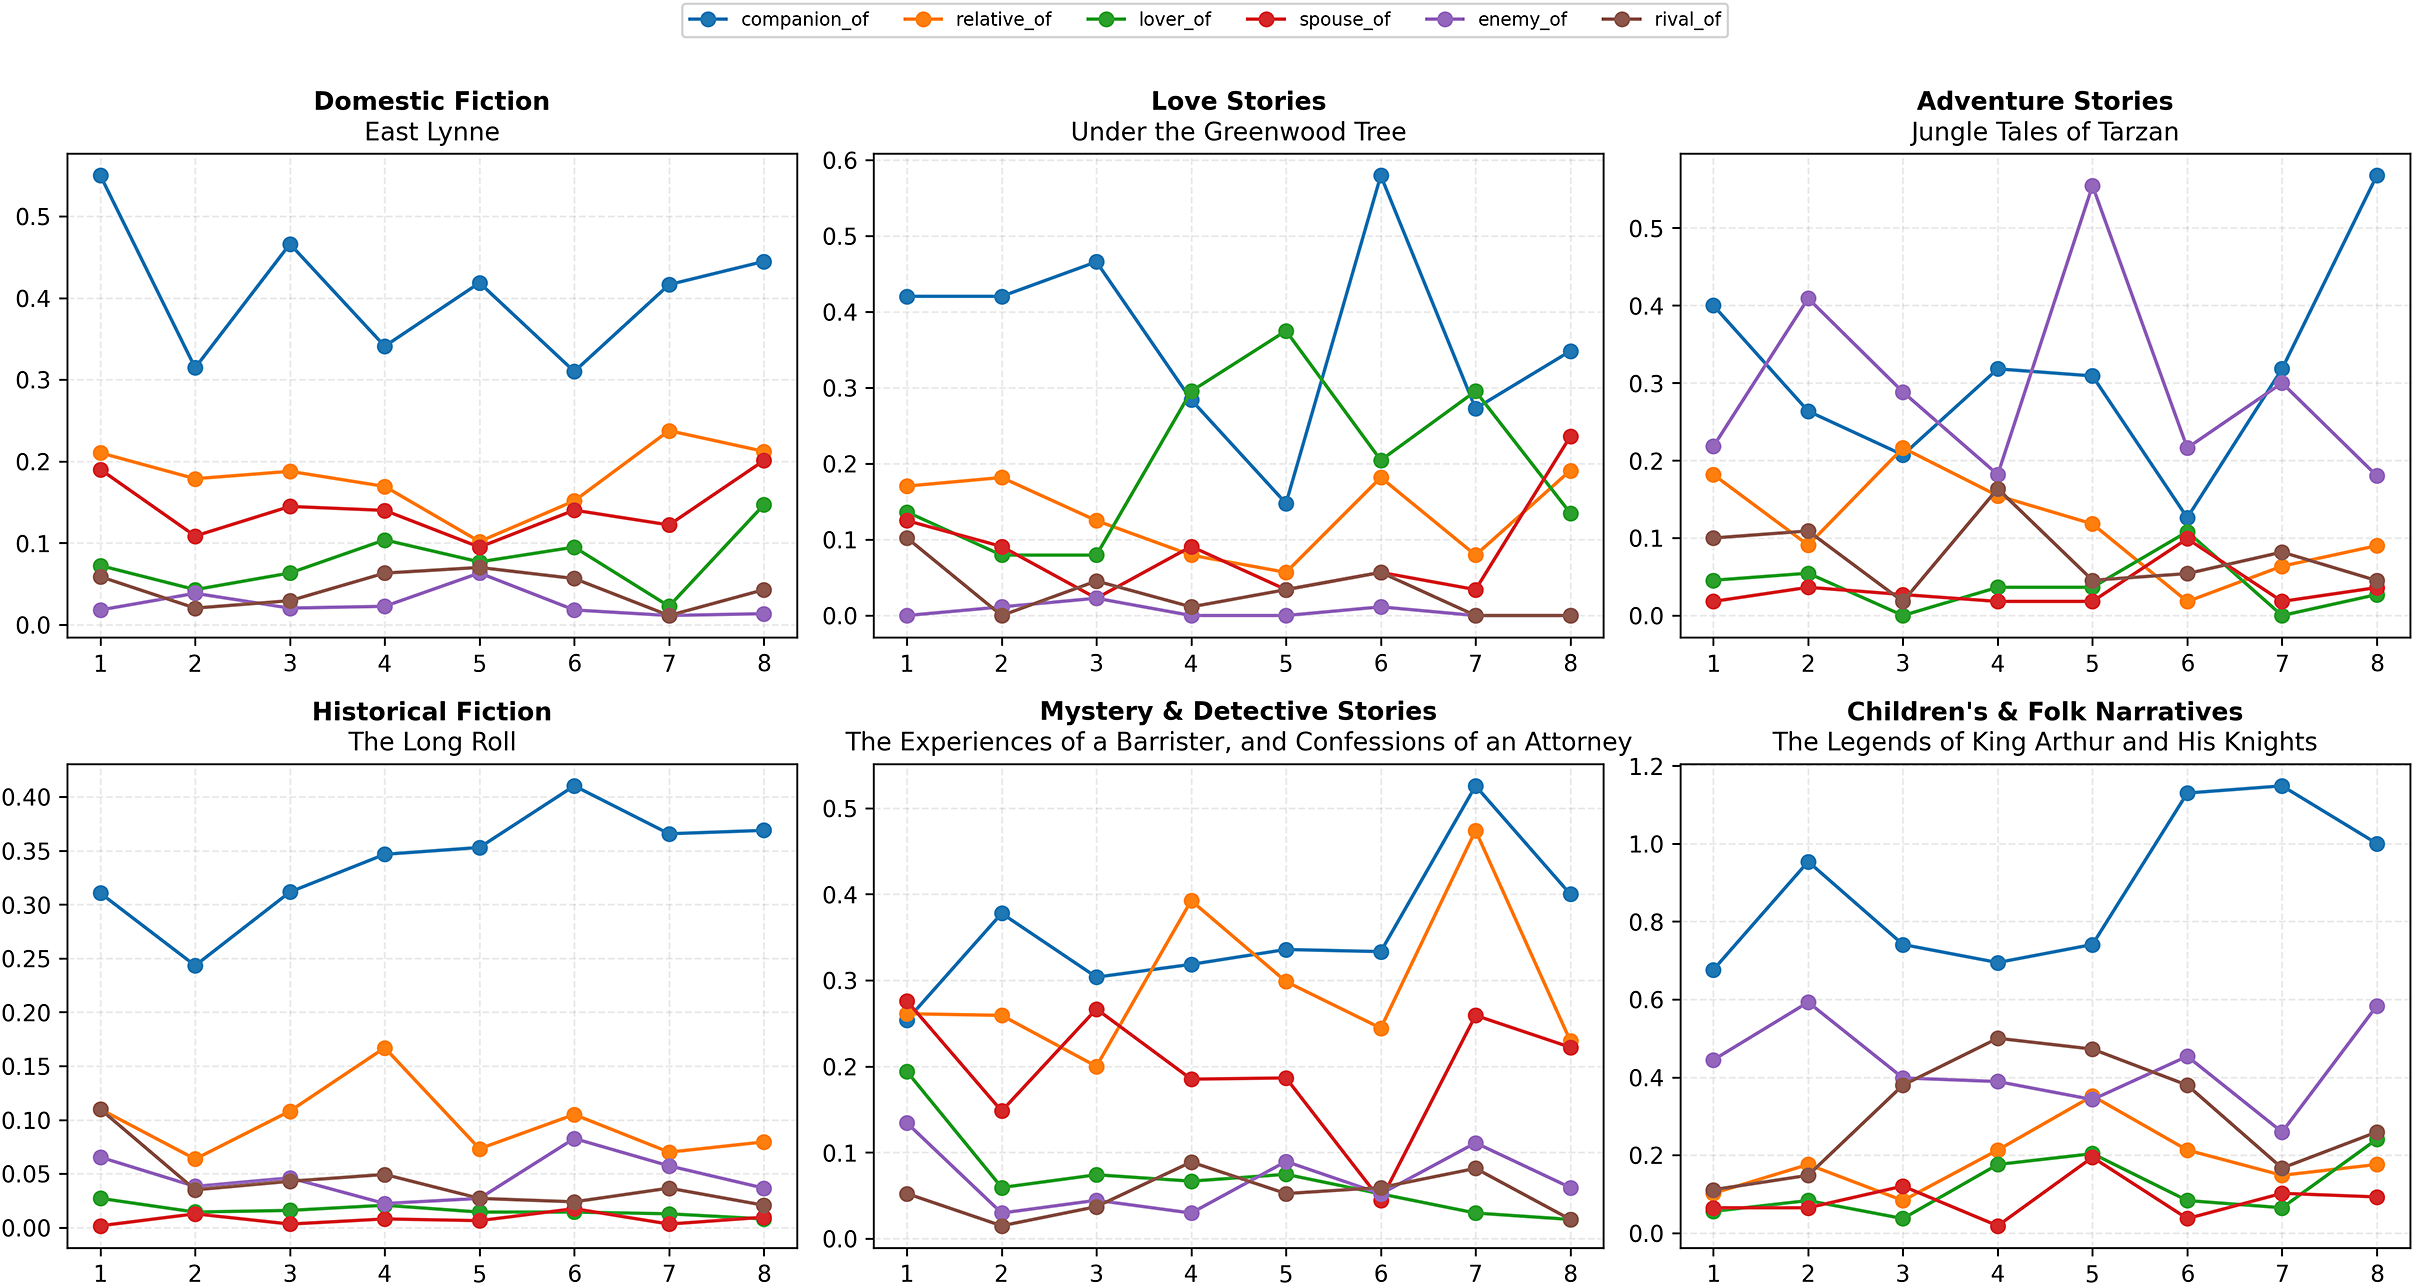
Cross-cutting regularities: Three patterns recur across panels. (1) Expository alliance: books typically open with high companion_of and stable relative_of, scaffolding introductions and co-presence. (2) Climactic antagonism: rival_of tends to surface earlier and enemy_of later, with local trade-offs where dips in one coincide with rises in the other (most clearly in Adventure and Mystery). (3) Romantic closure: when romance is structurally central, lover_of rises after a mid-story dip, and spouse_of remains low until late commitment scenes. These tendencies align with helper/opponent dynamics in classical narratology (Greimas, 1987) and with plots as vectors toward resolution (Brooks, 1984).
Per-genre readings:
-
• Domestic fiction (East Lynne). companion_of dominates early and fluctuates mid-narrative; romantic ties rise late. Notably, spouse_of is more frequent than lover_of (while sharing its lateward trend), consistent with resolution via domestic regularization.
-
• Love stories (Under the Greenwood Tree). A mild U-shape in lover_of with late recovery; spouse_of stays lower throughout but overtakes in the final bin, signaling conversion from courtship to commitment. companion_of is strong early and dips mid-story (temporary rupture).
-
• Adventure (Jungle Tales of Tarzan). Alliances appear early (companion_of); enemy_of spikes mid-narrative (bin
$\approx $
5) and stabilizes late. rival_of is intermittent and tends to recede as enmity escalates. -
• Historical fiction (The Long Roll). Steady companionship with only modest late antagonism, mirroring institutionally framed climaxes; romantic ties remain peripheral.
-
• Mystery & detective (Experiences of a Barrister). Robust companion_of (detective–ally pattern); rival_of surfaces earlier (suspicion/competition), while enemy_of intensifies late during reveal and pursuit.
-
• Children’s & folk (King Arthur). Sustained companion_of with punctuated late surges; rival_of and enemy_of are episodic, fitting quest episodicity and set-piece finales; romance remains marginal.

These case studies quantify phases usually identified by close reading: setup (Familial/Companionship), climax (Conflict) and resolution (Romantic/Ideational), while revealing local trade-offs between rival_of and enemy_of as competition escalates to open opposition.
Dyadic arcs: From macro shape to pairwise causation
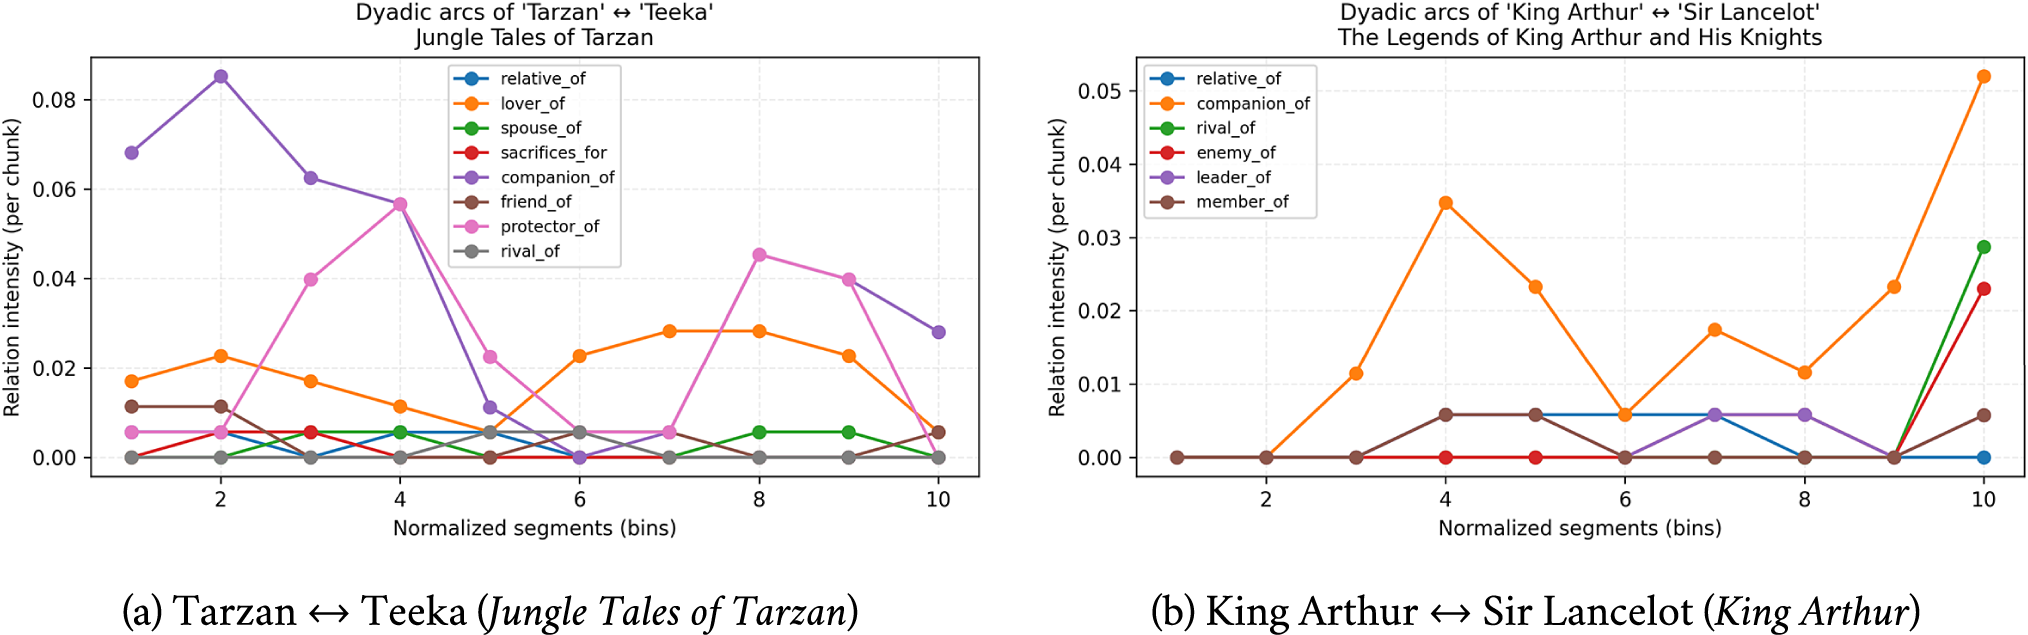
To show how corpus-level patterns emerge from micro-interactions, Figure 2 tracks a focal dyad per novel.
Dyadic relationship arcs. Intensities across 10 equal bins (events per chunk) for selected character pairs. Dyadic traces expose the micro-structure that aggregates into the panel-level shapes in Figure 1.
In Tarzan $\leftrightarrow $
Teeka (Figure 2a), companion_of and protector_of crest early (bins 2–4), decay through the middle, then partially rebound near closure (bins 8 and 9). Small mid-arc sacrifices_for events co-occur with the companionship trough suggesting the narratological pattern of fracture and repair in adventure subplots.
$\leftrightarrow $
Teeka (Figure 2a), companion_of and protector_of crest early (bins 2–4), decay through the middle, then partially rebound near closure (bins 8 and 9). Small mid-arc sacrifices_for events co-occur with the companionship trough suggesting the narratological pattern of fracture and repair in adventure subplots.
In Arthur $\leftrightarrow $
Lancelot (Figure 2a), companion_of accumulates across the book but ends with sharp terminal peaks in rival_of and enemy_of (bin 10), consistent with catastrophic final trials in Arthurian cycles. Brief mid-late leader_of/member_of episodes point to institutional allegiance as a hinge for the betrayal turn.
$\leftrightarrow $
Lancelot (Figure 2a), companion_of accumulates across the book but ends with sharp terminal peaks in rival_of and enemy_of (bin 10), consistent with catastrophic final trials in Arthurian cycles. Brief mid-late leader_of/member_of episodes point to institutional allegiance as a hinge for the betrayal turn.
Aggregate dynamics: Corpus-level patterns
Zooming out from individual novels and averaging arcs across the full set of 96 novels (20 equal 5% bins) reveals a clear relationship-based story grammar (Figure 3). Alliance is the dominant stratum across the whole timeline and indeed peaks early (bin 5, $\sim $
0.63), but the curve is not simply front-loaded: after a mid-book sag (hovering around 0.48–0.51) it re-intensifies toward the end (bins 18–20 up to
$\sim $
0.63), but the curve is not simply front-loaded: after a mid-book sag (hovering around 0.48–0.51) it re-intensifies toward the end (bins 18–20 up to $\sim $
0.58), indicating renewed coalition activity at or near closure. Kinship is the second-largest family; it shows an early shoulder (bin 5,
$\sim $
0.58), indicating renewed coalition activity at or near closure. Kinship is the second-largest family; it shows an early shoulder (bin 5, $\sim $
0.40), a mid-narrative trough (lowest around bin 15,
$\sim $
0.40), a mid-narrative trough (lowest around bin 15, $\sim $
0.30), and then a pronounced late surge in the penultimate bin (bin 19,
$\sim $
0.30), and then a pronounced late surge in the penultimate bin (bin 19, $\sim $
0.47) before settling near
$\sim $
0.47) before settling near $\sim $
0.40 in the final bin – consistent with familial reckoning and restoration at the end of many plots. Romance drifts upward with mild undulations (roughly 0.11 at the start to
$\sim $
0.40 in the final bin – consistent with familial reckoning and restoration at the end of many plots. Romance drifts upward with mild undulations (roughly 0.11 at the start to $\sim $
0.15 at bin 20), matching reconciliation and commitment scenes concentrated late. Authority remains modest but exhibits a sharp, transient spike around bin 17 (up to
$\sim $
0.15 at bin 20), matching reconciliation and commitment scenes concentrated late. Authority remains modest but exhibits a sharp, transient spike around bin 17 (up to $\sim $
0.10–0.11), aligning with institutional acts in denouements, such as marriage, arrest or restoration (Bakhtin Reference Bakhtin2010). For conflict, Rivalry is comparatively flat, with only a small mid–late hump (peak
$\sim $
0.10–0.11), aligning with institutional acts in denouements, such as marriage, arrest or restoration (Bakhtin Reference Bakhtin2010). For conflict, Rivalry is comparatively flat, with only a small mid–late hump (peak $\approx $
bin 14 at
$\approx $
bin 14 at $\sim $
0.065), whereas Enmity shows several local rises (e.g., bins 7 and 11) and then a decisive terminal surge (bin 20,
$\sim $
0.065), whereas Enmity shows several local rises (e.g., bins 7 and 11) and then a decisive terminal surge (bin 20, $\sim $
0.11), placing the strongest adversarial pressure at closure rather than strictly at two-thirds. Moral–Symbolic stays near floor with small pulses mid-to-late.
$\sim $
0.11), placing the strongest adversarial pressure at closure rather than strictly at two-thirds. Moral–Symbolic stays near floor with small pulses mid-to-late.
Corpus-level relation family arcs (20 bins). Mean intensity (events per chunk) per family over normalized narrative time across 96 novels. Alliance and Kinship scaffold exposition; Rivalry rises first and Enmity peaks later toward the climax; Romance and Authority concentrate near closure. Note: For each book b and family $f,$
we compute a 20-bin per-chunk rate vector and average equally across books (multi-tagged books contribute to each tagged genre in later analyses). No smoothing is applied in Figure 3.
$f,$
we compute a 20-bin per-chunk rate vector and average equally across books (multi-tagged books contribute to each tagged genre in later analyses). No smoothing is applied in Figure 3.
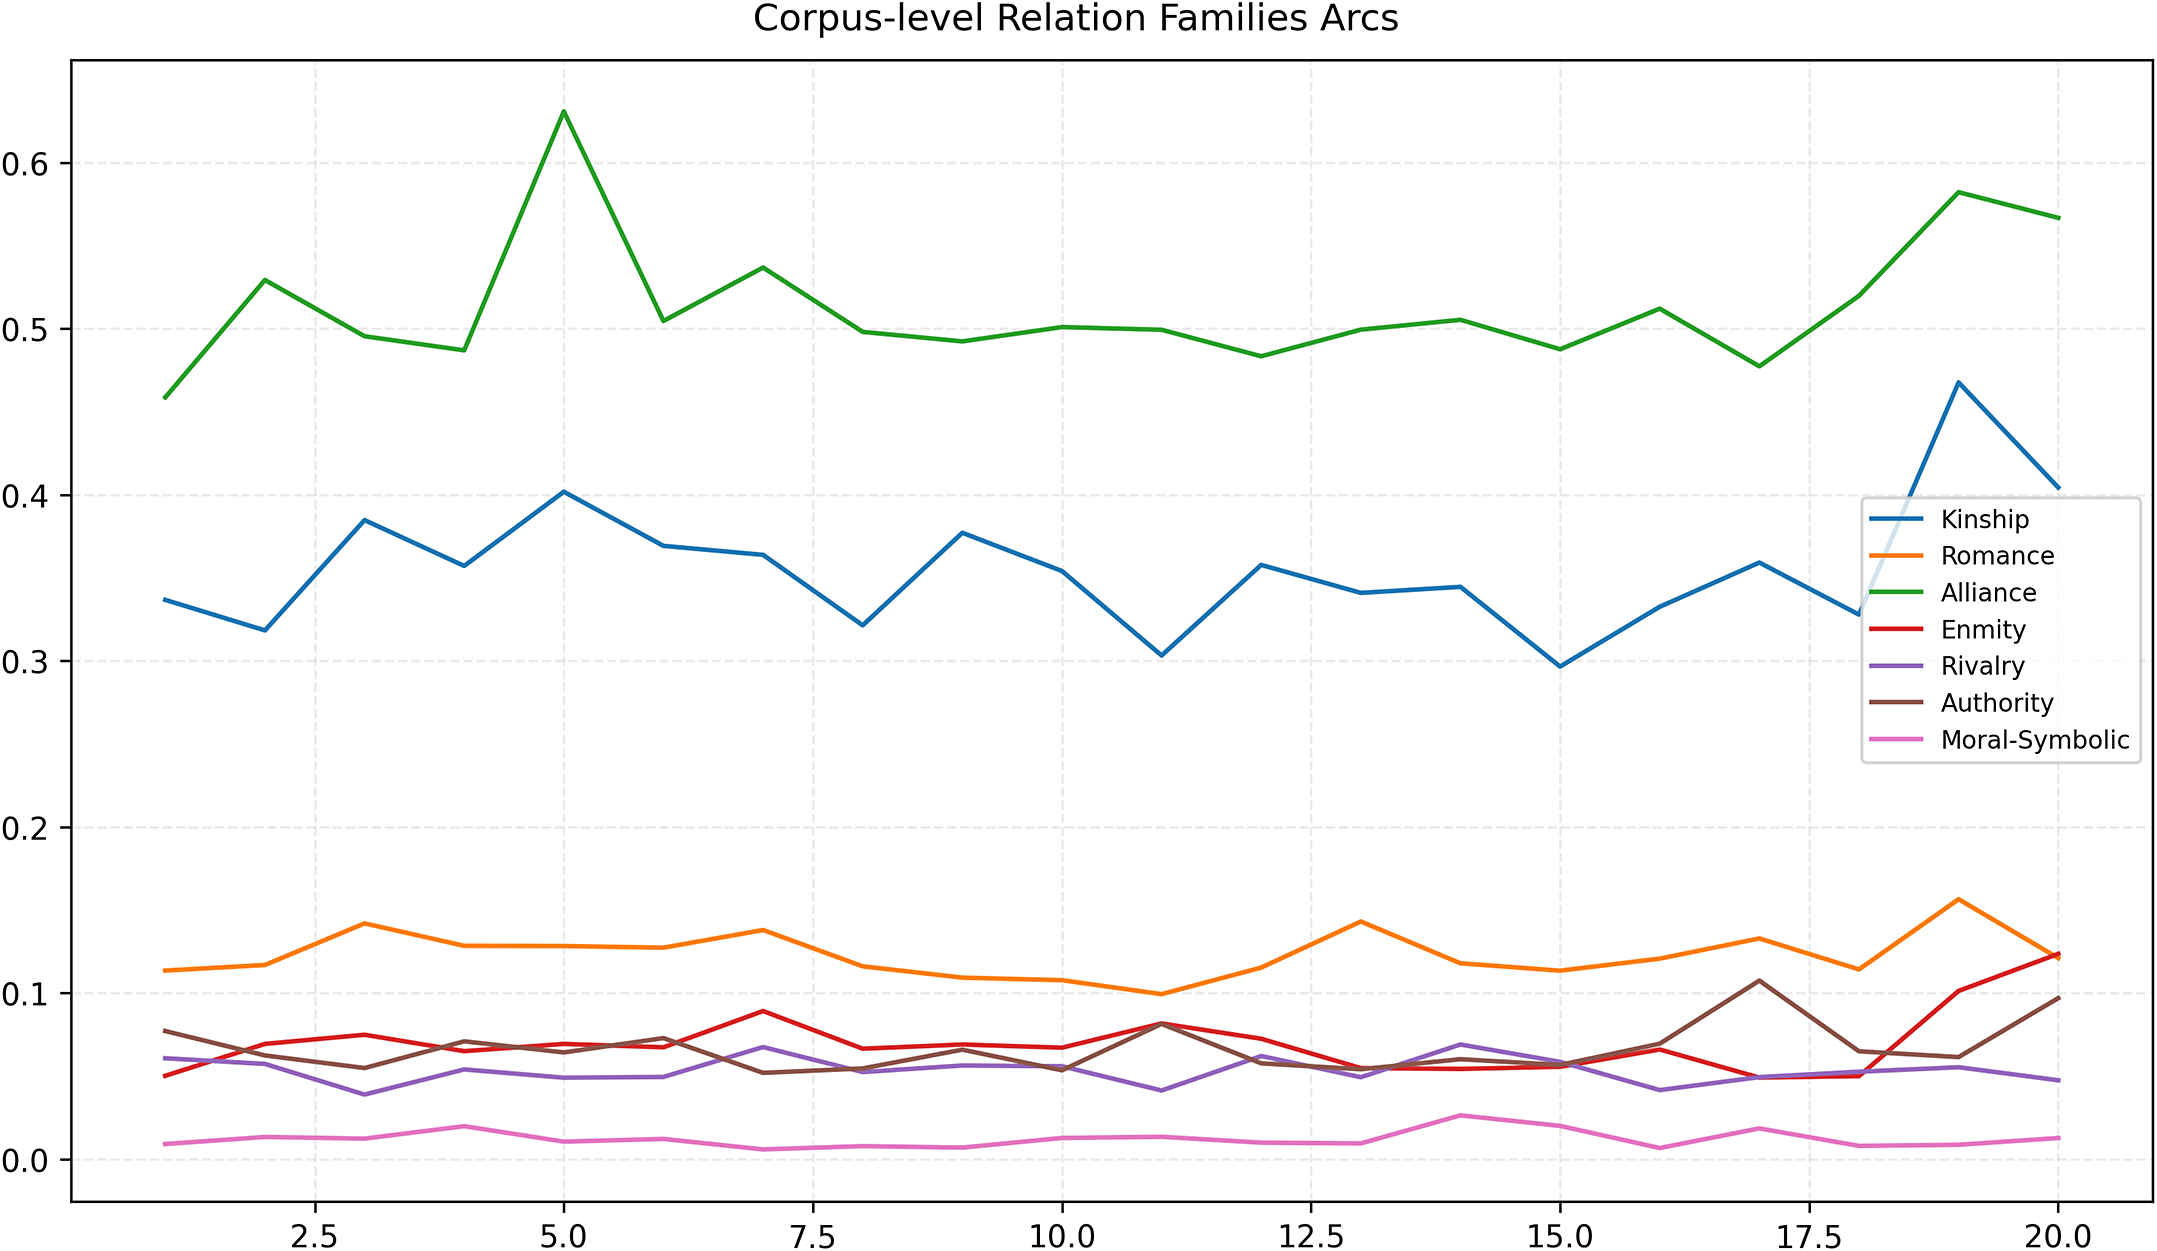
Read together, these trajectories support a relationship-centric template, early social scaffolding (alliances and kin), mid escalation and late consolidation, while refining the simple “climax-at-two-thirds” picture of narrative structure. In aggregate, the largest adversarial crest arrives in the final bin, co-occurring with renewed alliance and kinship and with institutional resolution (Aristotle 1997; Brooks Reference Brooks, Onega and Landa2014; Elkins Reference Elkins2022; Öhman et al. Reference Öhman, Bizzoni, Moreira, Nielbo, Bizzoni, Degaetano-Ortlieb, Kazantseva and Szpakowicz2024; Reagan et al. Reference Reagan, Mitchell, Kiley, Danforth and Dodds2016). This pattern quantitatively substantiates the narratological principle that plots resolve not only through event closure but through the reorganization of social bonds.
Genre-specific signatures: Timing and trajectory
Stratifying arcs by genre produces recognizable relational fingerprints: the same families recur, but their timing and magnitude differ in systematic ways (Figure 4). Across all genres, Alliance and Kinship provide the backbone of narrative time, while Romance, Enmity/Rivalry and Authority supply genre-specific accents. What changes is when these families rise and how strongly.
Genre-stratified relation family arcs (20 bins). Mean intensity (events per chunk) over normalized narrative time. Books with multiple genre tags contribute to each tagged genre’s average. Across panels, Alliance and Kinship scaffold openings; Enmity concentrates from mid to late with genre-specific timing; Romance is steady rather than spiky in Love Stories; Authority tends to appear in end-state resolutions.
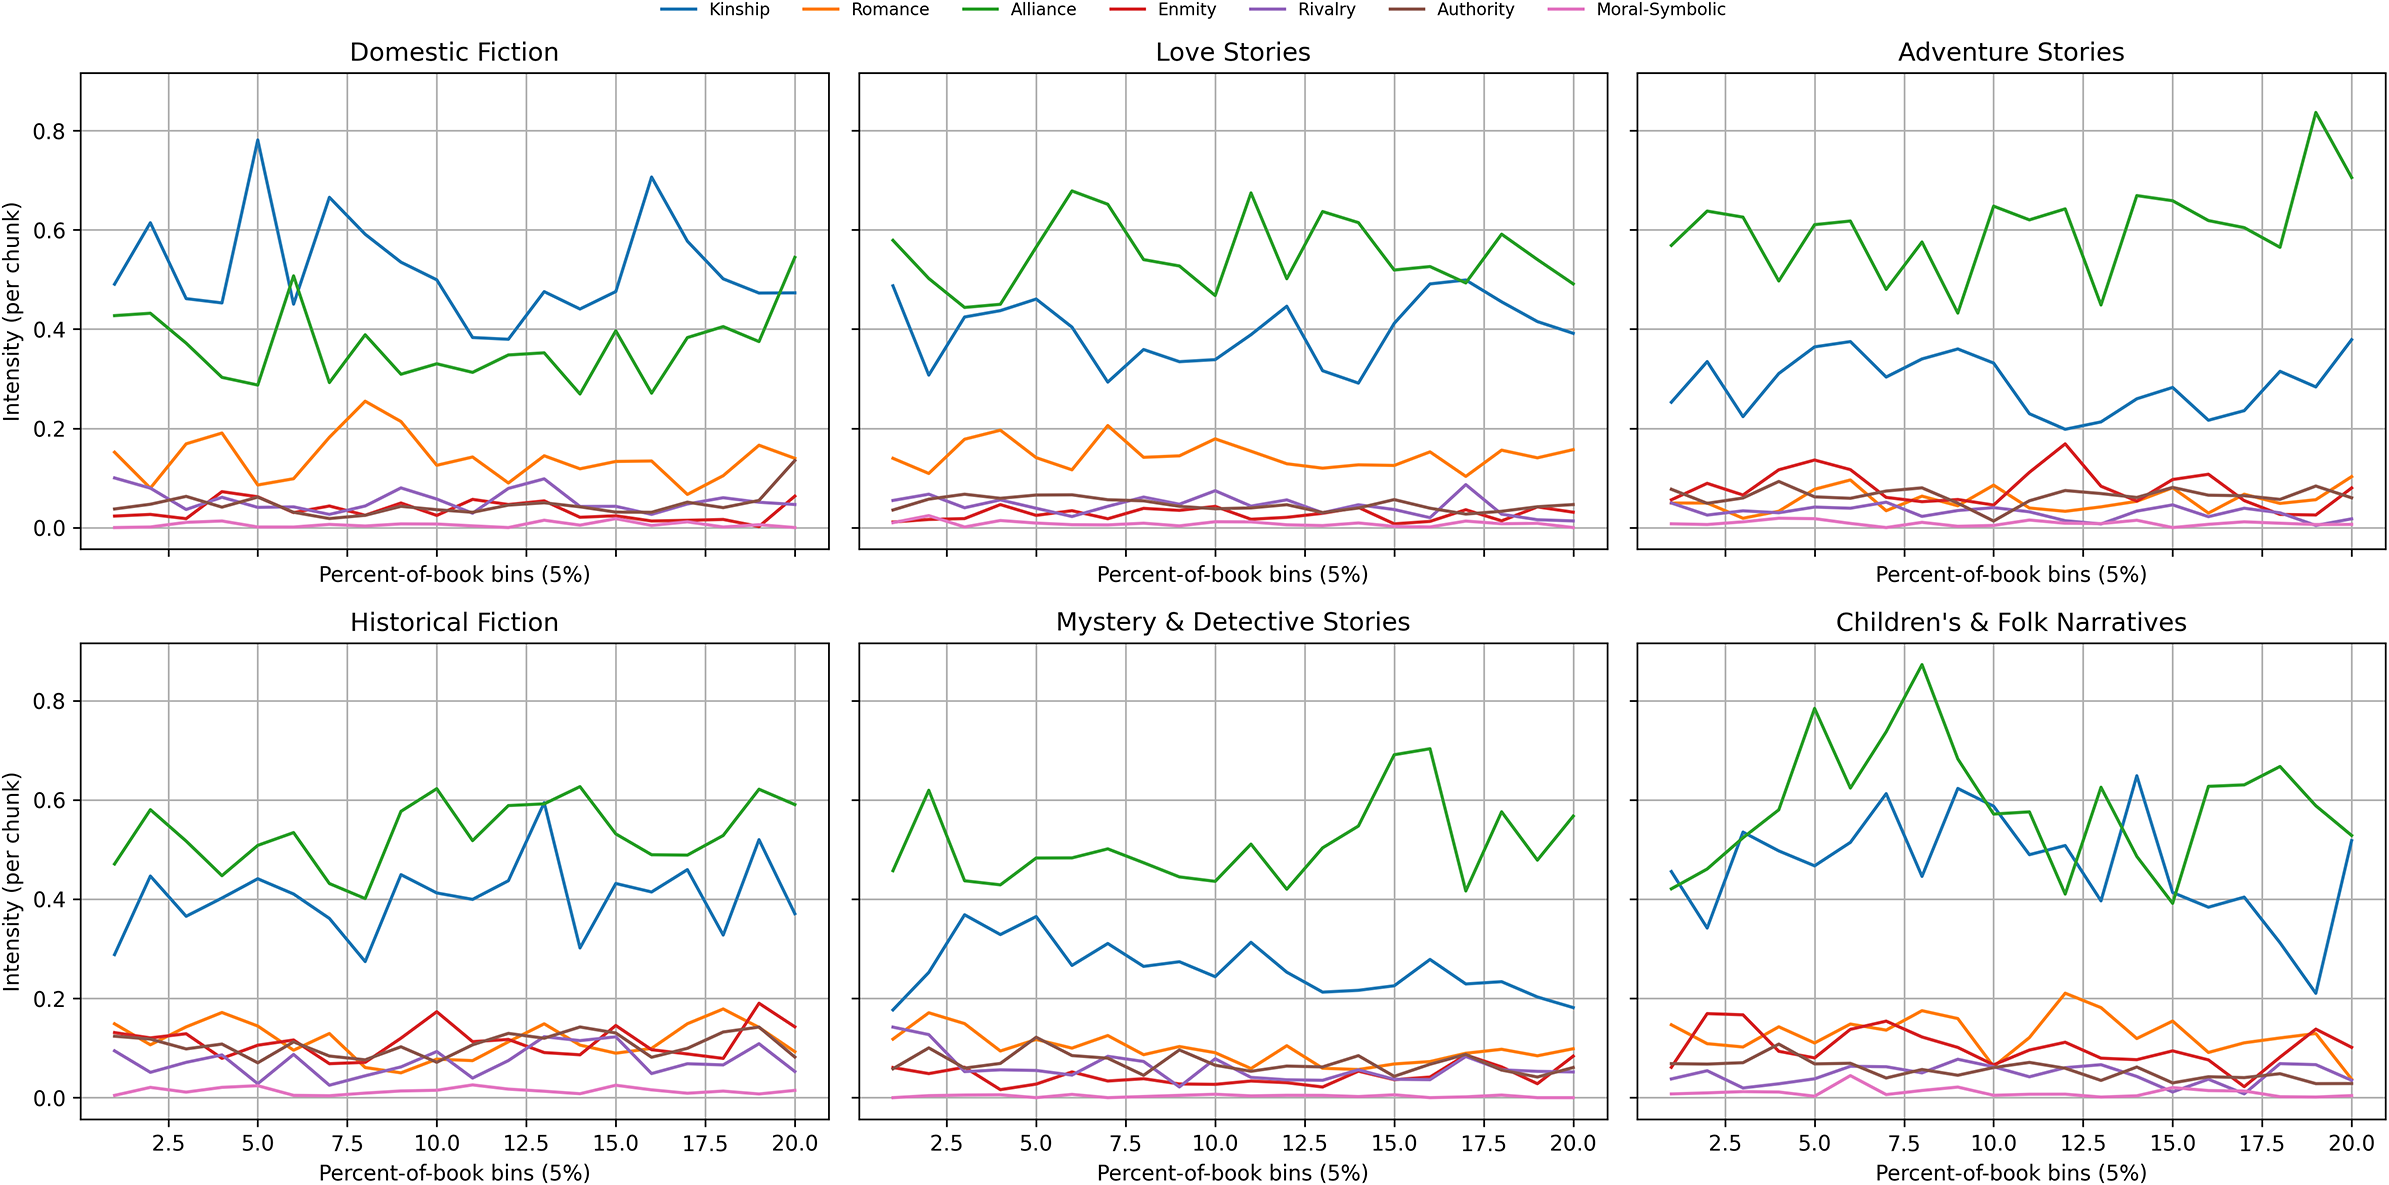
Domestic fiction. Kinship is prominent and volatile, with sharp spikes in the first third and again around bins 14–16, reflecting long-standing cultural narratives of domestic desire and moral regulation (Beetham, Reference Beetham2003). Alliance sits in the 0.30–0.40 range with a gentle late lift. Romance does not only rise at the very end; it shows a pronounced mid-book bulge (around bins 8–10, up to $\sim $
0.25) and then tapers. Conflict remains modest overall, though Rivalry has a small mid–late bump; Enmity stays low.
$\sim $
0.25) and then tapers. Conflict remains modest overall, though Rivalry has a small mid–late bump; Enmity stays low.
Love stories. Alliance is strong and smooth throughout (peaks around bins 6–8), and Kinship increases into the later bins. Romance is steady rather than dramatic, hovering $\sim $
0.12–0.18 without a sharp terminal spike; it is therefore persistent rather than dominant in amplitude. Enmity and Rivalry stay subdued; Authority remains low.
$\sim $
0.12–0.18 without a sharp terminal spike; it is therefore persistent rather than dominant in amplitude. Enmity and Rivalry stay subdued; Authority remains low.
Adventure stories. Alliance is very high and dynamic, culminating in a late surge (bins 19 and 20). Baseline Kinship is comparatively low for this genre. Enmity forms a clear mid–late hump (around bin 12) with another rise near the end, while Rivalry remains minimal. Romance is scarce, and Authority appears only in small late pulses, consistent with recognition or restoration scenes.
Historical fiction. Alliance is stable at a mid–high level; Kinship is active but less spiky than in Domestic fiction. Both Enmity and Authority increase toward the end, with Enmity showing two noticeable peaks (around bins 10 and 18). This profile suggests climaxes mediated by institutions (military, civic and legal) rather than pure personal antagonism.
Mystery & detective stories. Alliance (detective–ally) is consistently present; Kinship is lower and drifts downward into the final third. Rivalry surfaces earlier than Enmity, a small mid-book rise that fits suspicion/competition, followed by a late increase in Enmity and Authority (bins 18 and 19), matching reveal–pursuit–arrest closures. Romance remains low.
Children’s & folk narratives. Alliance is extremely high from the start and peaks early–mid (bins 6–8), dips around the middle, then rises again near the end. Kinship is inverted-U rather than U-shaped: it climbs to a central peak (around bin 10) and then declines before a small end rise. This pattern is consistent with aesthetic theories of children's literature that emphasize mid-narrative moral testing followed by simplified closure (Nikolajeva, Reference Nikolajeva2005). Enmity appears in episodic bumps (early, mid and late), while Romance and Authority remain relatively flat and low, consistent with quest-and-ordeal structures centered on comradeship.
Comparative synthesis. Genres draw on a shared palette but organize it differently: Domestic leans on volatile Kinship with a mid-arc Romance swell; Love Stories keep Romance steady while maintaining strong Alliance; Adventure concentrates Alliance and mid–late Enmity; Historical builds toward institutionally inflected endings; Mystery shifts from early Rivalry to late Enmity/Authority; Children’s & Folk rely on very high Alliance with a central Kinship peak. These timings operate as structural fingerprints rather than mere topical differences.
Distribution and genre/diachronic patterns
The “Arc families: Clustering trajectories of relations” section established when relationship arcs peak. Here, we ask a complementary question: which relations are emphasized overall in each genre, and how those emphases change historically. In short, we move from temporal form to content fingerprints (counts and frequencies of relations). All analyses in this section use the ARF dataset described earlier, with per-book counts normalized by length (per 1,000 chunks) and aggregated under multi-label genres.Footnote 3 The section proceeds from cross-sectional genre differences (“Genre distributions of relations” section), to corpus-level diachronic trends (“Diachronic shifts in relation families” section), and finally to genre-specific diachronic trajectories (“Genre-differentiated diachronic trajectories” section). These connect character relations to narratological accounts of how genres structure sociality and how norms evolve over time (Bakhtin Reference Bakhtin2010; Moretti Reference Moretti2011; Piper Reference Piper2020; Underwood Reference Underwood2019). For dataset background and ontology design, see Christou and Tsoumakas (Reference Christou, Tsoumakas, Kazantseva, Szpakowicz, Degaetano-Ortlieb, Bizzoni and Pagel2025).
Genre distributions of relations
For each book, we count the occurrences of each relation type (and its family), normalize by book length (per 1,000 chunks), and then average within genres. Because books carry multiple topical tags, a book contributes to every genre it is tagged with; we also report the number of books per genre elsewhere for transparency.
Figure 5 summarizes family-level emphases by genre (column-normalized). Several stable signatures emerge:
-
• Domestic fiction leads the Kinship family, consistent with plots centered on household reconfiguration and care obligations.
-
• Love stories lead Romance (with a secondary presence of Alliance), while adversarial families remain muted, a pattern long associated with the ideological and affective functions of popular romance (Radway, Reference Radway2009).
-
• Adventure is top-ranked for Alliance and shows mid-to-high values for Enmity/Rivalry, reflecting quest parties and set-piece conflicts.
-
• Historical fiction is high for Enmity, Rivalry and Authority, indexing war, factionalism and institutional structure.
-
• Children’s and folk narratives combine Kinship with Alliance (proximity, caretaking), and a comparatively elevated Moral–Symbolic footprint.
-
• Mystery and detective stories emphasize Authority and some Rivalry while downplaying Moral–Symbolic.
These contrasts align with the idea that genres encode distinct “logics of interaction” rather than mere topics (Bamman, Underwood, and Smith Reference Bamman, Underwood, Smith, Roth, Matsumoto and O’Connor2014; Moretti Reference Moretti2011), and they resonate with actantial roles at a family scale.
Genre $\times $
relation family. Cell values are column percentiles: within each family (column), darker cells indicate genres at higher percentiles of that family’s normalized frequency. This emphasizes relative prominence within a family (rank-like signal), not absolute magnitude.
$\times $
relation family. Cell values are column percentiles: within each family (column), darker cells indicate genres at higher percentiles of that family’s normalized frequency. This emphasizes relative prominence within a family (rank-like signal), not absolute magnitude.
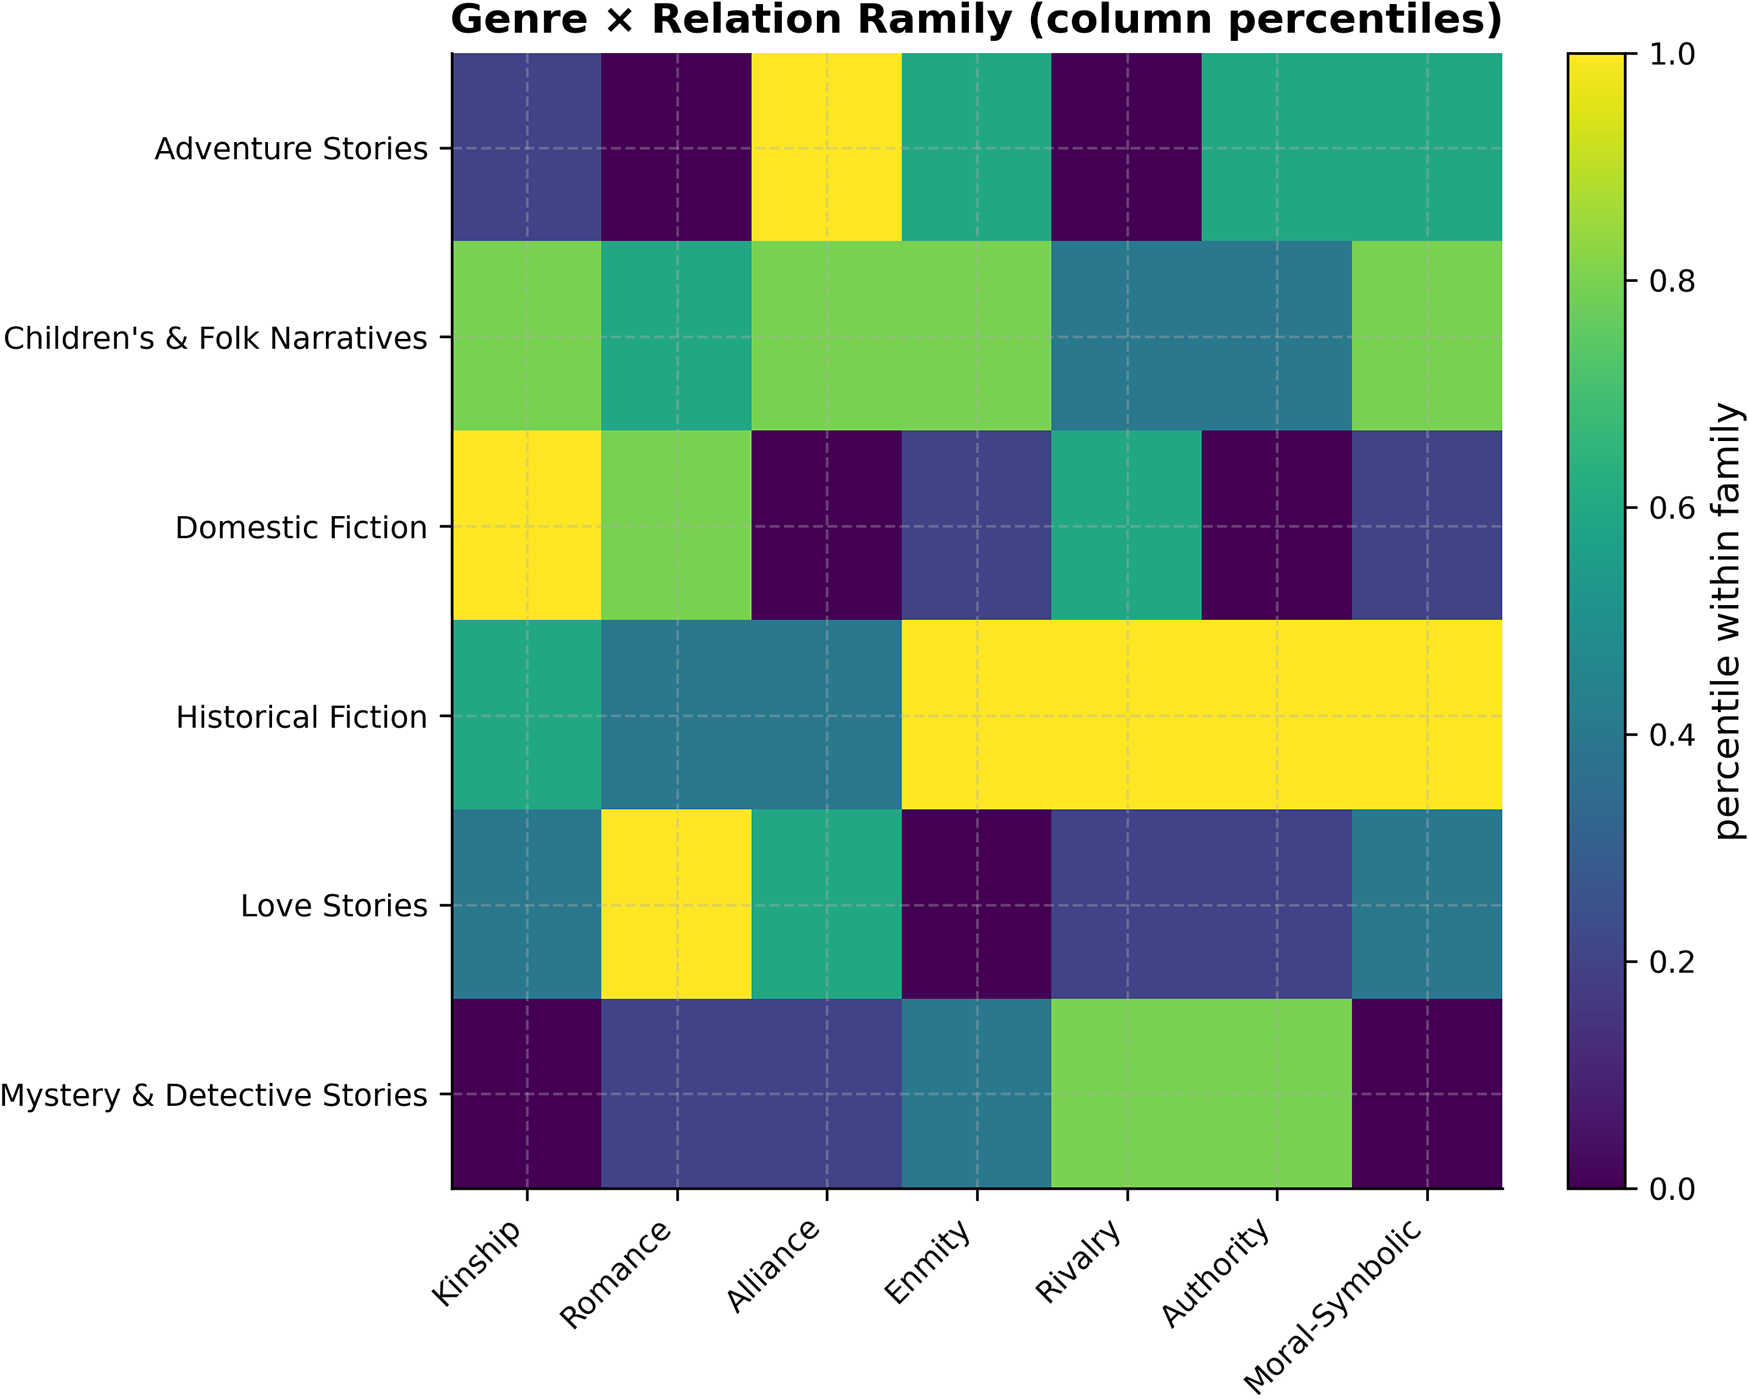
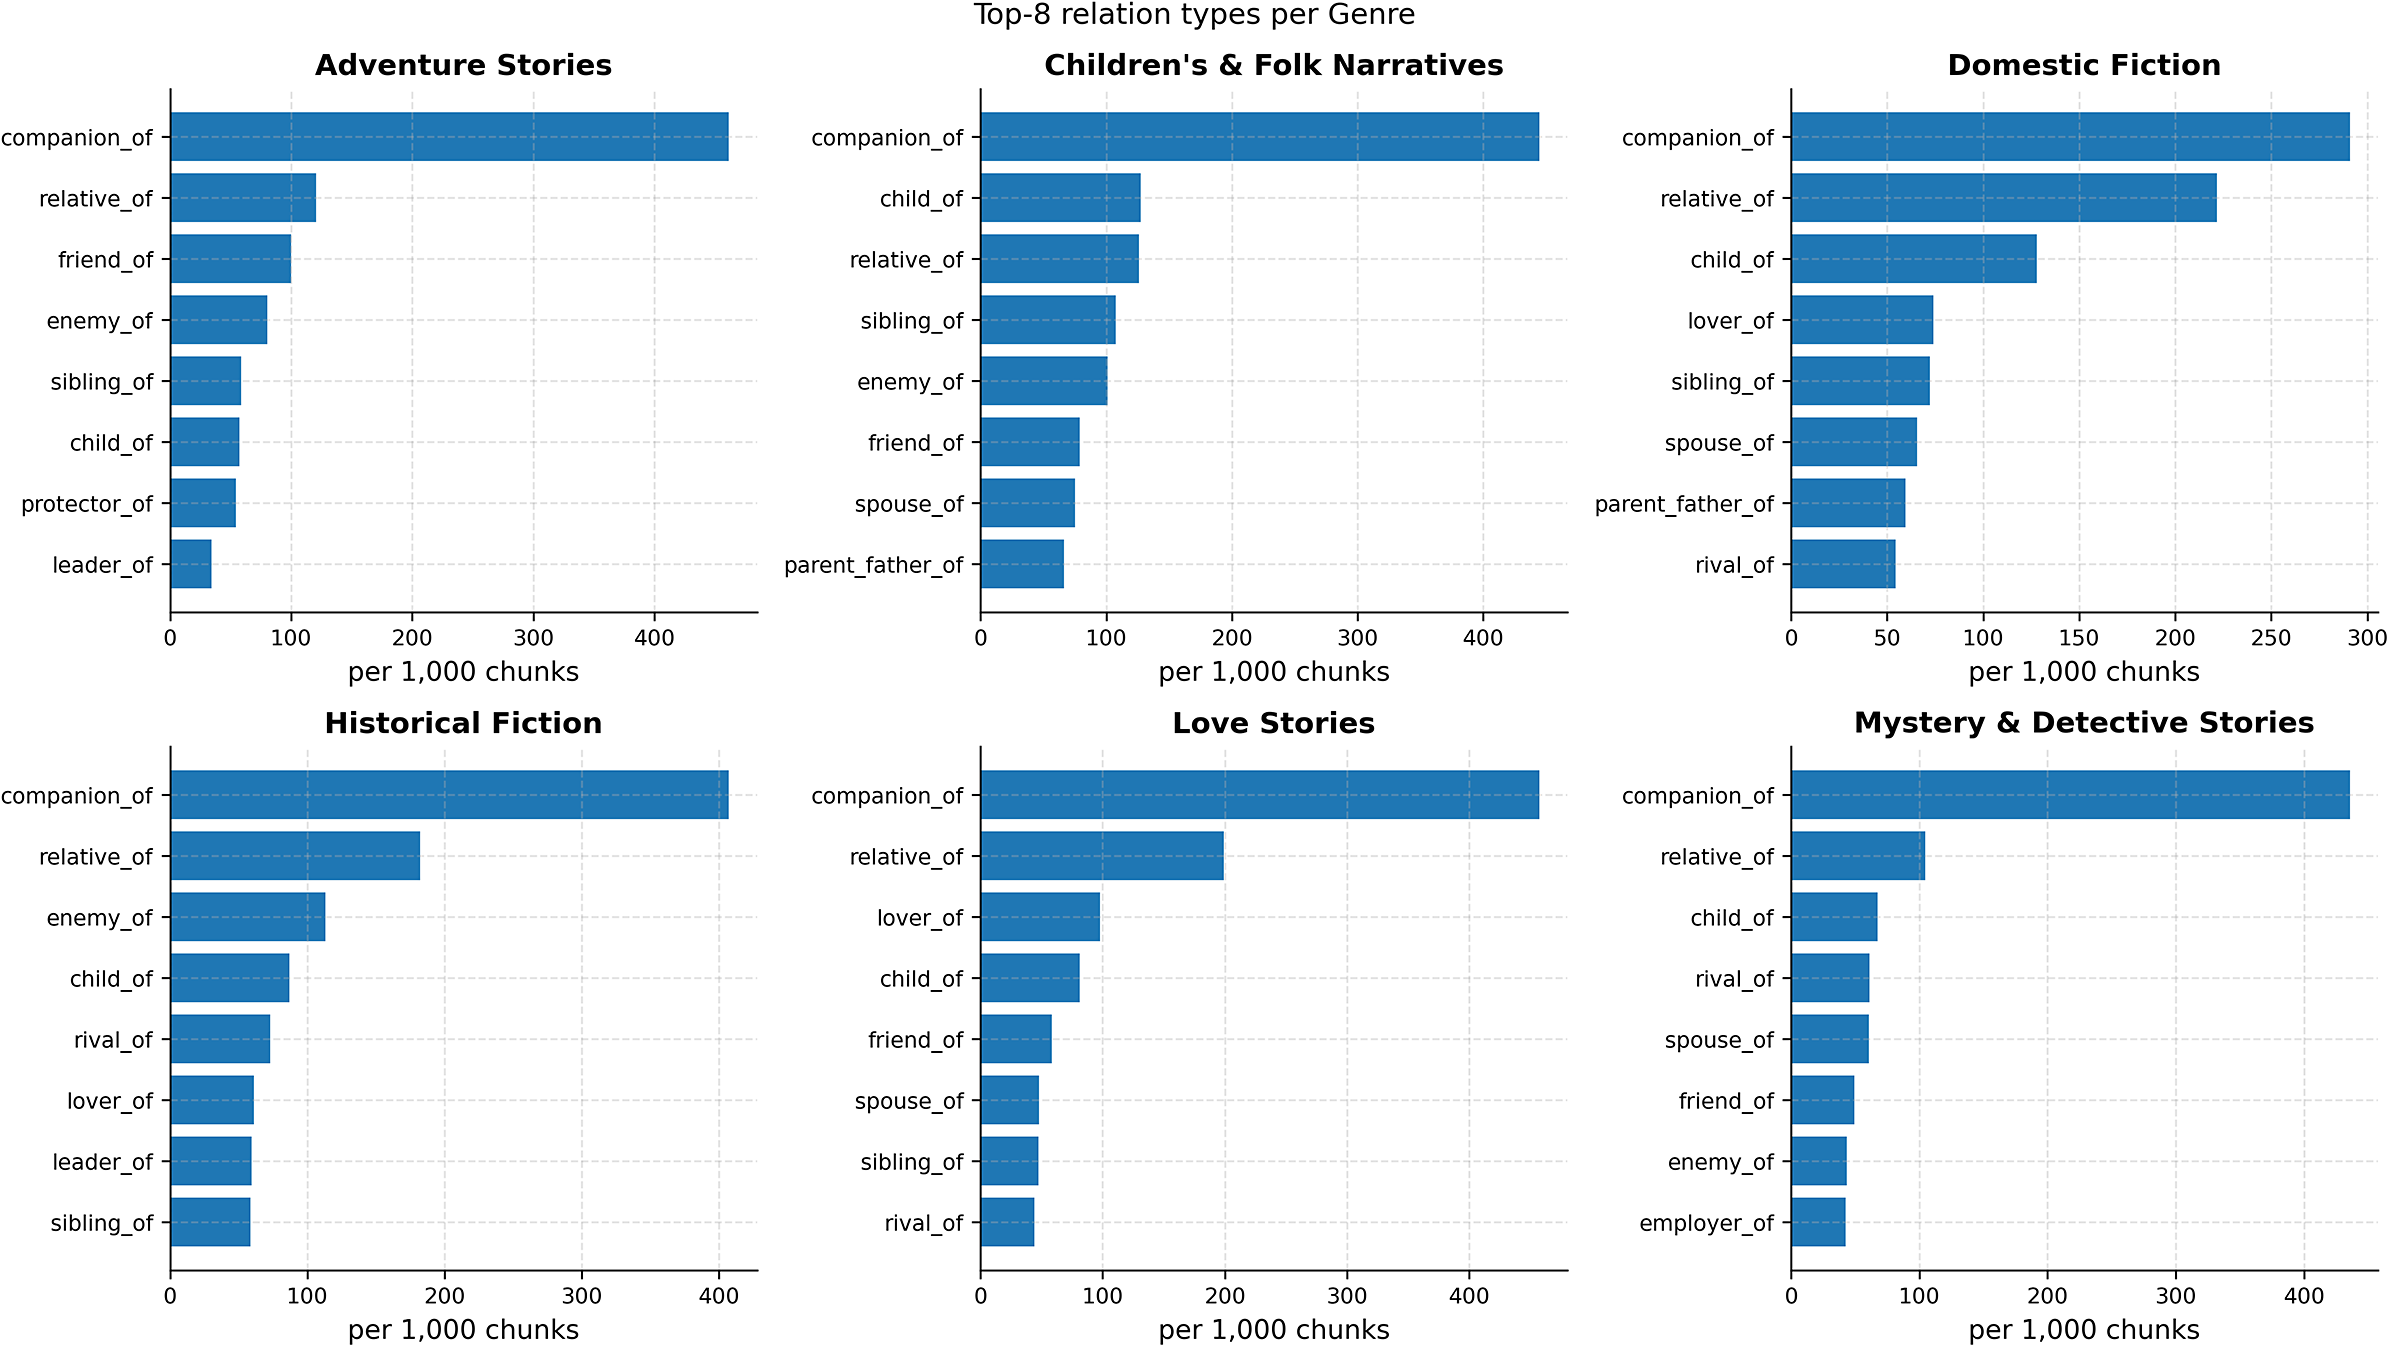
Figure 6 complements the heatmap by exposing the types driving each family’s signal. Three robust patterns stand out:
-
1. Relational glue is ubiquitous. companion_of is the top relation in every genre, often by a wide margin. This is a cross-genre baseline of proximate co-presence and cooperation.
-
2. Family and intimacy differentiate domestic and love. relative_ of and child_of are consistently high in domestic fiction; lover_of/spouse_of are distinctly elevated in love stories (and secondarily in domestic fiction).
-
3. Adversarial and hierarchical ties mark historical, adventure and mystery. enemy_of and rival_of rise in historical and adventure; leader_of (historical/adventure) and employer_of (mystery) index institutional structure.
Together, Figures 5 and 6 show that family-level fingerprints are informative while type-level bars clarify their concrete narrative realizations.
Top-8 individual relation types per genre (normalized per 1,000 chunks). Bars reveal which types instantiate each family’s footprint. Across genres, companion_of dominates, followed by relative_of; genre-specific markers include lover_of/spouse_of (love, domestic), enemy_of/rival_of (historical, adventure) and leader_of/employer_of (historical, mystery).
Diachronic shifts in relation families
Next, we examine diachronic variation in relationship families, grouping books by decade of publication (1850–1950). We bin books by decade of publication (metadata decade); for each decade, we compute average family frequencies (per 1,000 chunks).
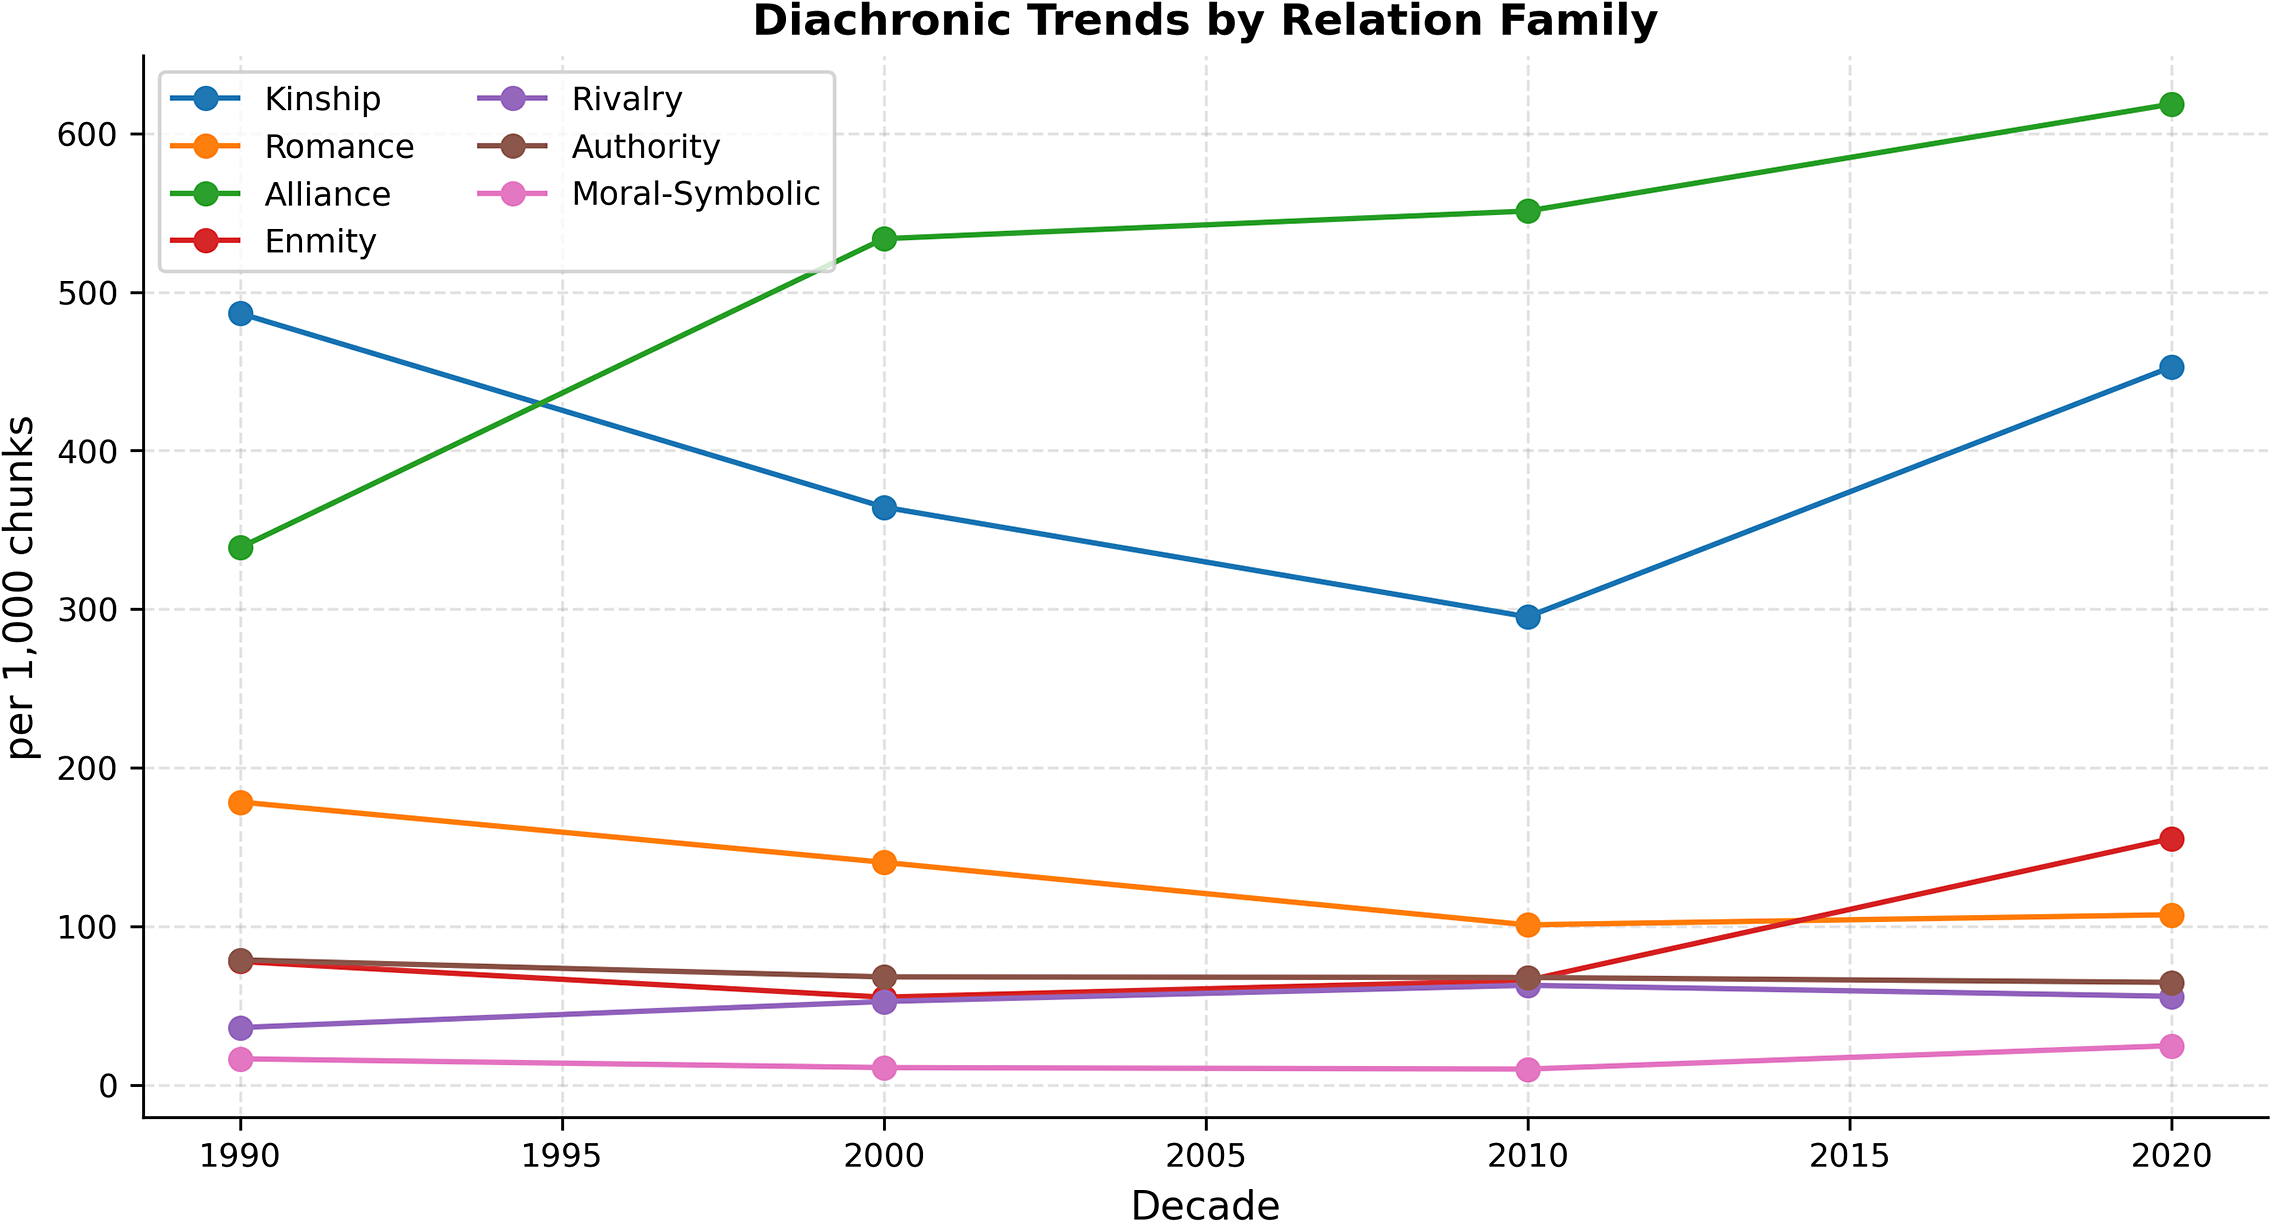
At the corpus level (Figure 7), Alliance rises steadily and becomes the most frequent family overall; Kinship declines and then partially rebounds; Enmity increases late in the series; Romance shows a gentle long-run decline; Authority remains comparatively stable and Moral–Symbolic remains low but ticks upward in the last decade. Read narratologically, these trends suggest a gradual shift from kin-structured plots toward plots organized by companionship and group action, with a late intensification of open antagonism. Such patterns accord with accounts of changing novelistic norms and markets (Underwood Reference Underwood2019; Piper, So, and Bamman Reference Piper, So, Bamman, Moens, Huang, Specia and Yih2021) and with genre histories of romance and popular fiction (Hunt Reference Hunt1994; Regis Reference Regis2013).
Diachronic trends by relation family. Each line shows per decade means of normalized family frequencies (per 1,000 chunks). Decades correspond to those available in the present subset; line height reflects magnitude, not rank.
Genre-differentiated diachronic trajectories
Finally, we consider genre-specific diachronic trajectories for key families.
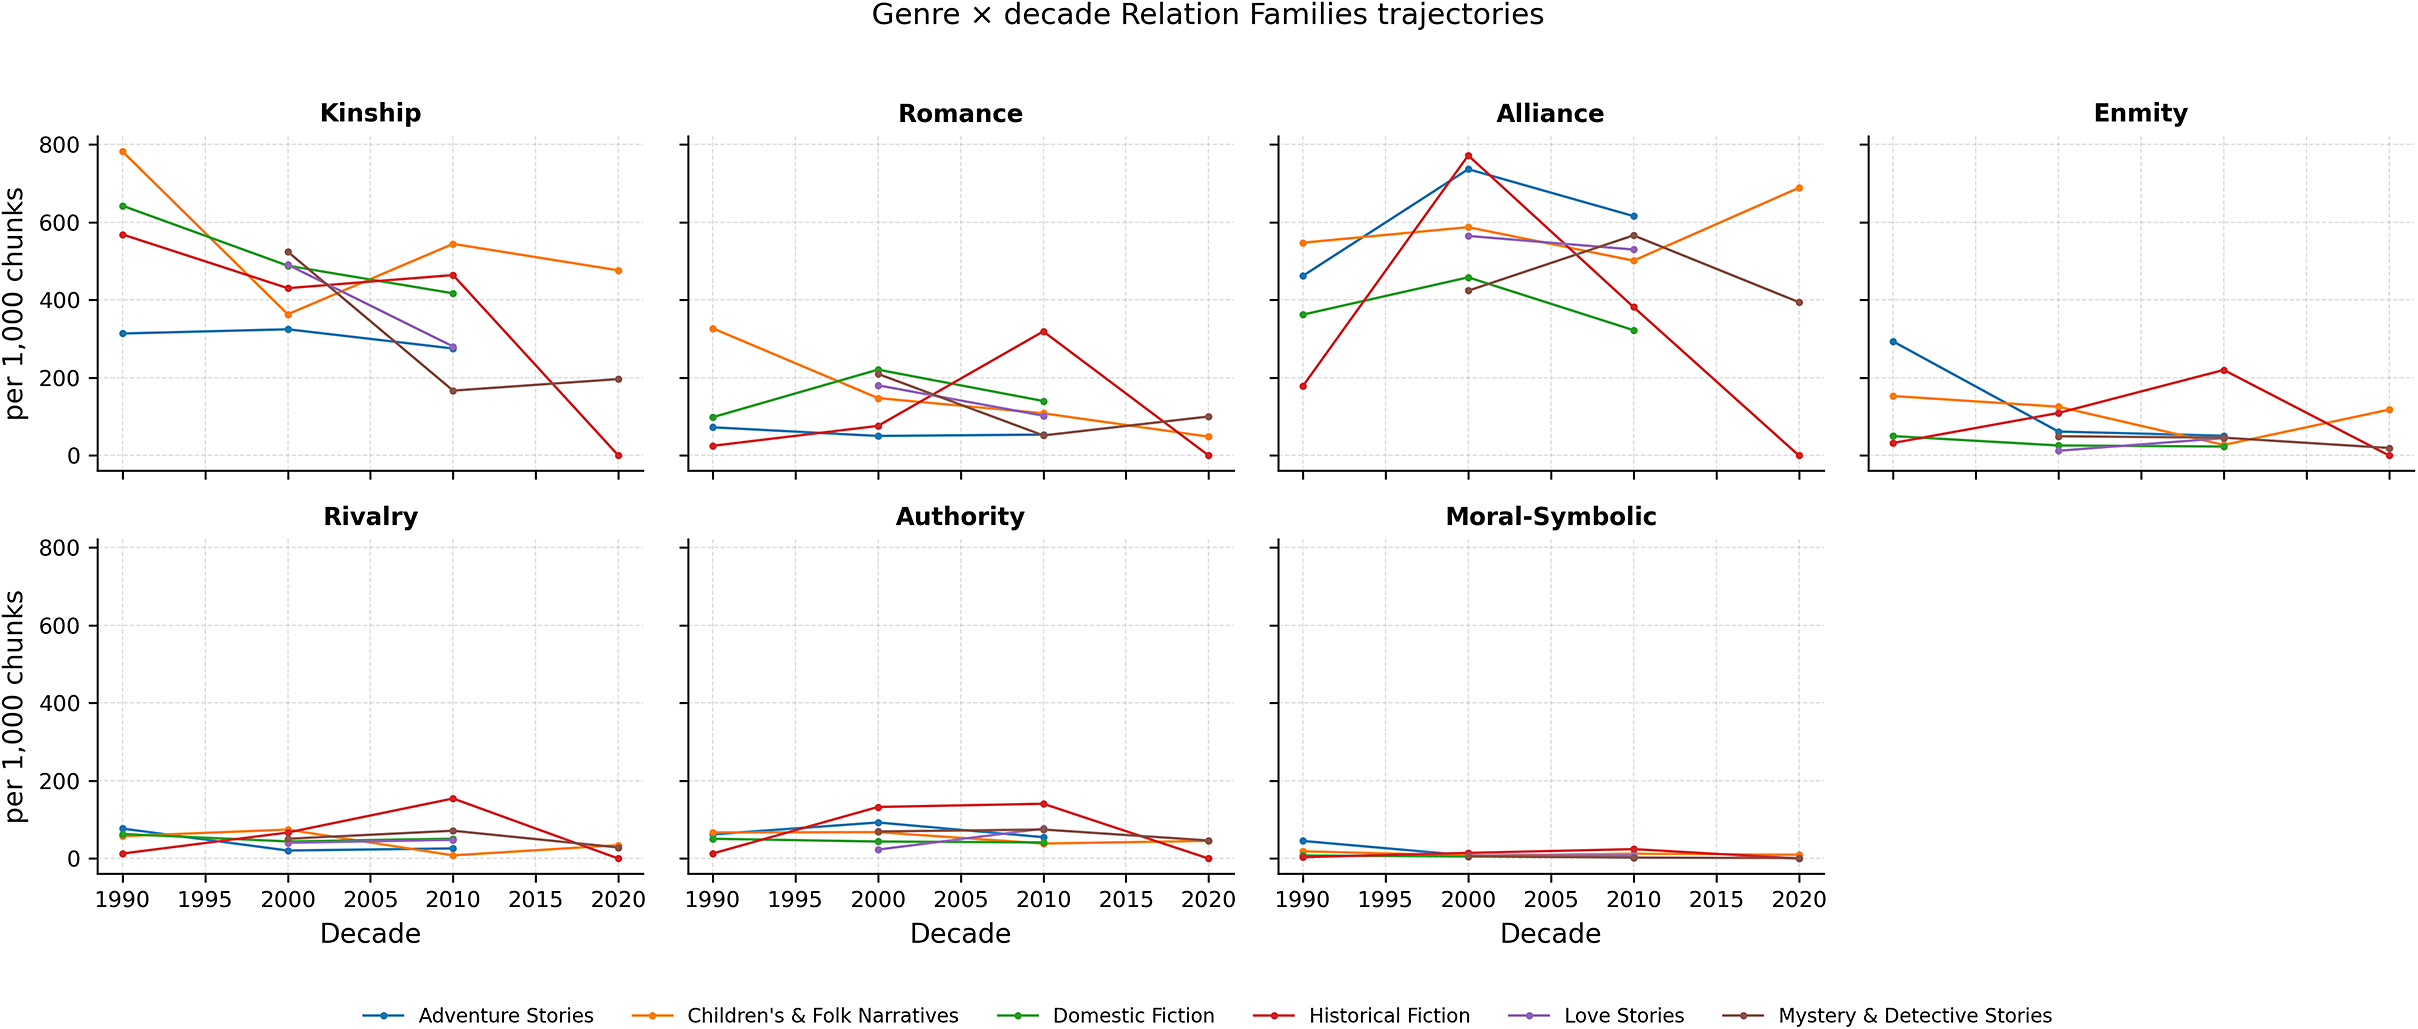
Disaggregating by genre (Figure 8) reveals uneven uptake of historical change:
-
• Romance grows sharply within love stories at a mid-late decade and remains comparatively flat elsewhere.
-
• Enmity/Rivalry/Authority concentrate in historical fiction (peaking together), with weaker but visible adversarial baselines in adventure and mystery.
-
• Alliance shows different rhythms: early peaks in adventure and historical, later growth in children’s/folk, and moderate, steady levels in mystery.
-
• Kinship stays high in domestic and children’s/folk but declines in other genres over time.
-
• Moral–Symbolic remains low overall, with mild increases in historical and children’s/folk.
These small multiples make clear that “global” patterns (“Diachronic shifts in relation families” section) are composites of divergent genre rhythms: genres act as filters that modulate how relational prototypes evolve (Underwood, Reference Underwood2019). For robustness, one can model counts with a Poisson (or negative-binomial) GLM with an offset for book length and a Genre ×Decade interaction:
 $$\begin{align*}\log\!\big(E[Y_{bg}]\big) &= \beta_0 + \beta_1 \cdot \text{Genre}_g + \beta_2 \cdot \text{Decade}\nonumber\\&\quad + \beta_3 \cdot (\text{Genre}_g \times \text{Decade}) + \log(\text{Length}_b)\,, \end{align*}$$
where Y bg is the count for book b labeled with genre g. Coefficients for Romance, Enmity and Kinship typically capture the qualitative contrasts visible in Figure 8.
Genre $\times $
decade trajectories for each family. Small multiples; each panel tracks one family, with lines for genres. Values are per-decade means (per 1,000 chunks). Missing or truncated lines indicate sparse decades for that genre.
$\times $
decade trajectories for each family. Small multiples; each panel tracks one family, with lines for genres. Values are per-decade means (per 1,000 chunks). Missing or truncated lines indicate sparse decades for that genre.
Reading the figures
Figures 5–8 intentionally use different normalizations: the heatmap reports within-family percentiles (for cross-genre ranking), while the bars and lines show per-decade/genre magnitudes (for size). Used together, they separate prominence from volume.
Key takeaways are that genres have stable, interpretable social “fingerprints.” Over time, companionship increasingly organizes narratives at the corpus level, while kinship weakens outside the genres that canonically center it. Last, historical conflict and hierarchy cluster in specific genres and decades. These patterns complement prior work on networks and plot logic in fiction (Bamman, Underwood, and Smith Reference Bamman, Underwood, Smith, Roth, Matsumoto and O’Connor2014; Moretti Reference Moretti2011) and demonstrate how an RE-driven pipeline can make narratological categories empirically tractable at scale.
Arc families: Clustering trajectories of relations
Narrative theorists have long proposed that stories recur in a few structural shapes like tragic falls, reconciliations and episodic quests (Brooks Reference Brooks, Onega and Landa2014; Propp Reference Propp and Wagner2010). Computational work has echoed this point for sentiment arcs (Reagan et al. Reference Reagan, Mitchell, Kiley, Danforth and Dodds2016). We extend the argument to relationship arcs: how ties, such as kinship, romance, alliance or enmity rise and fall over a book’s timeline. Rather than treating relations as static counts, we model their within-book dynamics and ask whether they cluster into a small number of recurrent prototypes.
For each book–relation pair, we compute a 20-bin arc over normalized book time (1–20). Each arc is z-normalized within book–relation so that clustering is driven by shape rather than magnitude. We then cluster all arcs.
Core arc families identified
We selected $k{=}4$
families after testing
$k{=}4$
families after testing $k{=}3{\ldots }6$
with silhouette analysis; the
$k{=}3{\ldots }6$
with silhouette analysis; the $k{=}4$
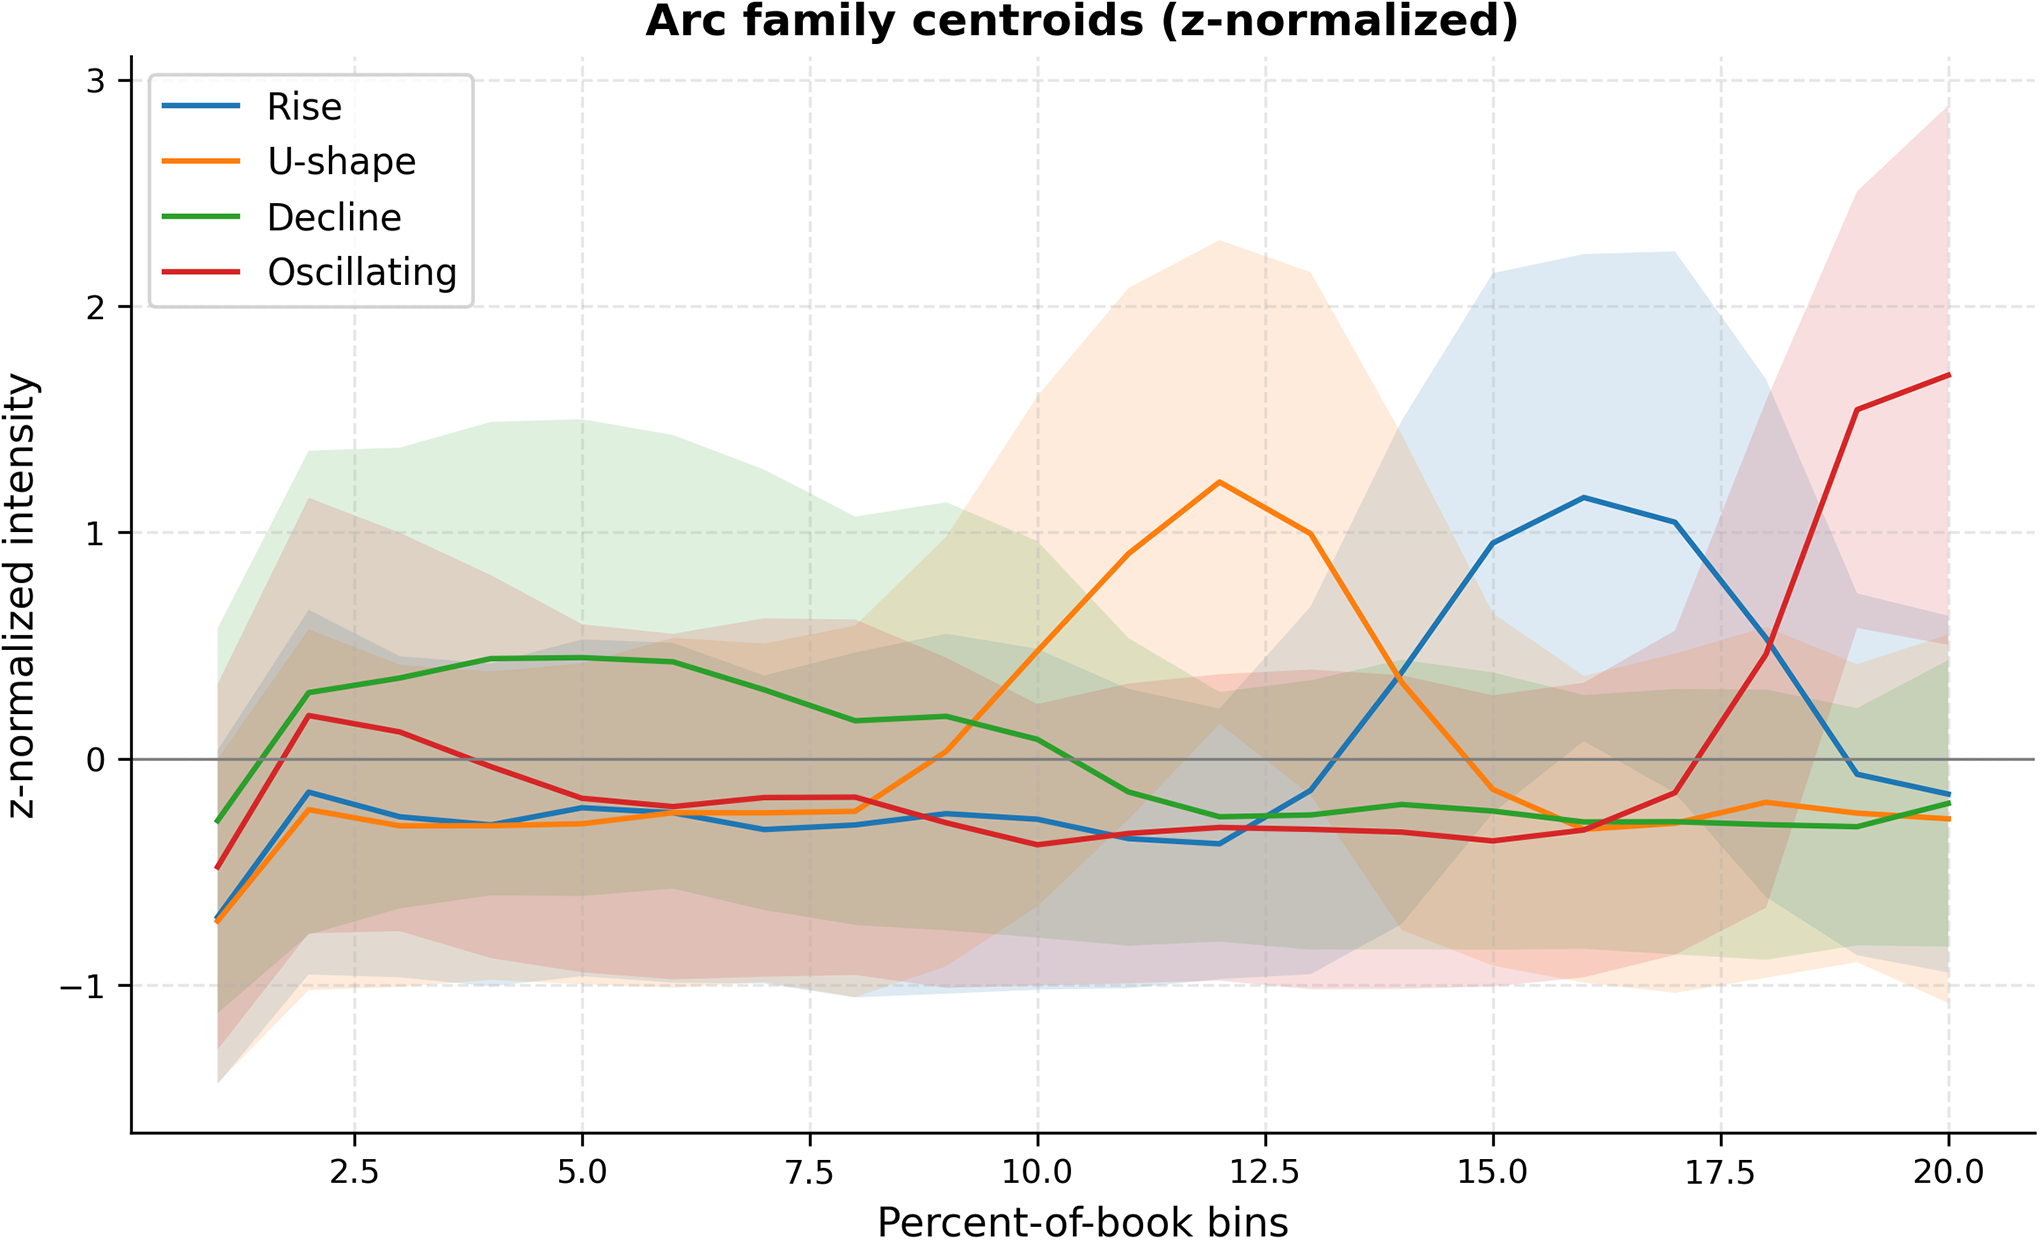
solution was competitive and narratologically interpretable (Brooks, Reference Brooks, Onega and Landa2014). Four robust prototypes emerged (Figure 9):
$k{=}4$
solution was competitive and narratologically interpretable (Brooks, Reference Brooks, Onega and Landa2014). Four robust prototypes emerged (Figure 9):
-
• Rise: a late increase peaking around 80–85 percent of the book, consistent with escalation toward climax (often in enemy_of/rival_of ties).
-
• U-shape: mid-book dip followed by recovery (apex near 60%–65%), typical of separation–reconciliation in romantic or alliance ties.
-
• Decline: strong early presence tapering off; common for kinship and protective ties that set up stakes and then recede.
-
• Oscillating: alternating troughs and peaks, with a frequent late surge; reflects unstable alliances, investigations or didactic episodes.
Arc family centroids (z-normalized) with $\pm 1$
SD bands. Shaded areas show within-family dispersion. Rise peaks late; U-shape recovers after a mid-book dip; Decline is front-loaded; Oscillating alternates and often surges near the end. Shapes reflect relative change within an arc, not absolute frequency.
$\pm 1$
SD bands. Shaded areas show within-family dispersion. Rise peaks late; U-shape recovers after a mid-book dip; Decline is front-loaded; Oscillating alternates and often surges near the end. Shapes reflect relative change within an arc, not absolute frequency.
Single-book exemplars for each family. These are illustrative instances (titles and relation types shown above each panel), not typical magnitudes. They help anchor the prototypes in concrete narrative trajectories.

These four shapes resonate with masterplots in literary theory, including reconciliation, rise to confrontation and episodic questing (Bakhtin Reference Bakhtin2010; Regis Reference Regis2013).
Relation types across arc families
How do relation families (Kinship, Romance, Alliance, Enmity, Rivalry, Authority and Moral/Symbolic) distribute over the four arc shapes? Figure 11 summarizes two views: the global share of each arc family (left) and, on the right, row-normalized shares within each relation family.
Arc families in aggregate (left) and within each relation family (right). Left: global proportions of Rise, U-shape, Decline and Oscillating. Right: for each relation family (row-normalized), the share of its arcs that take each shape.
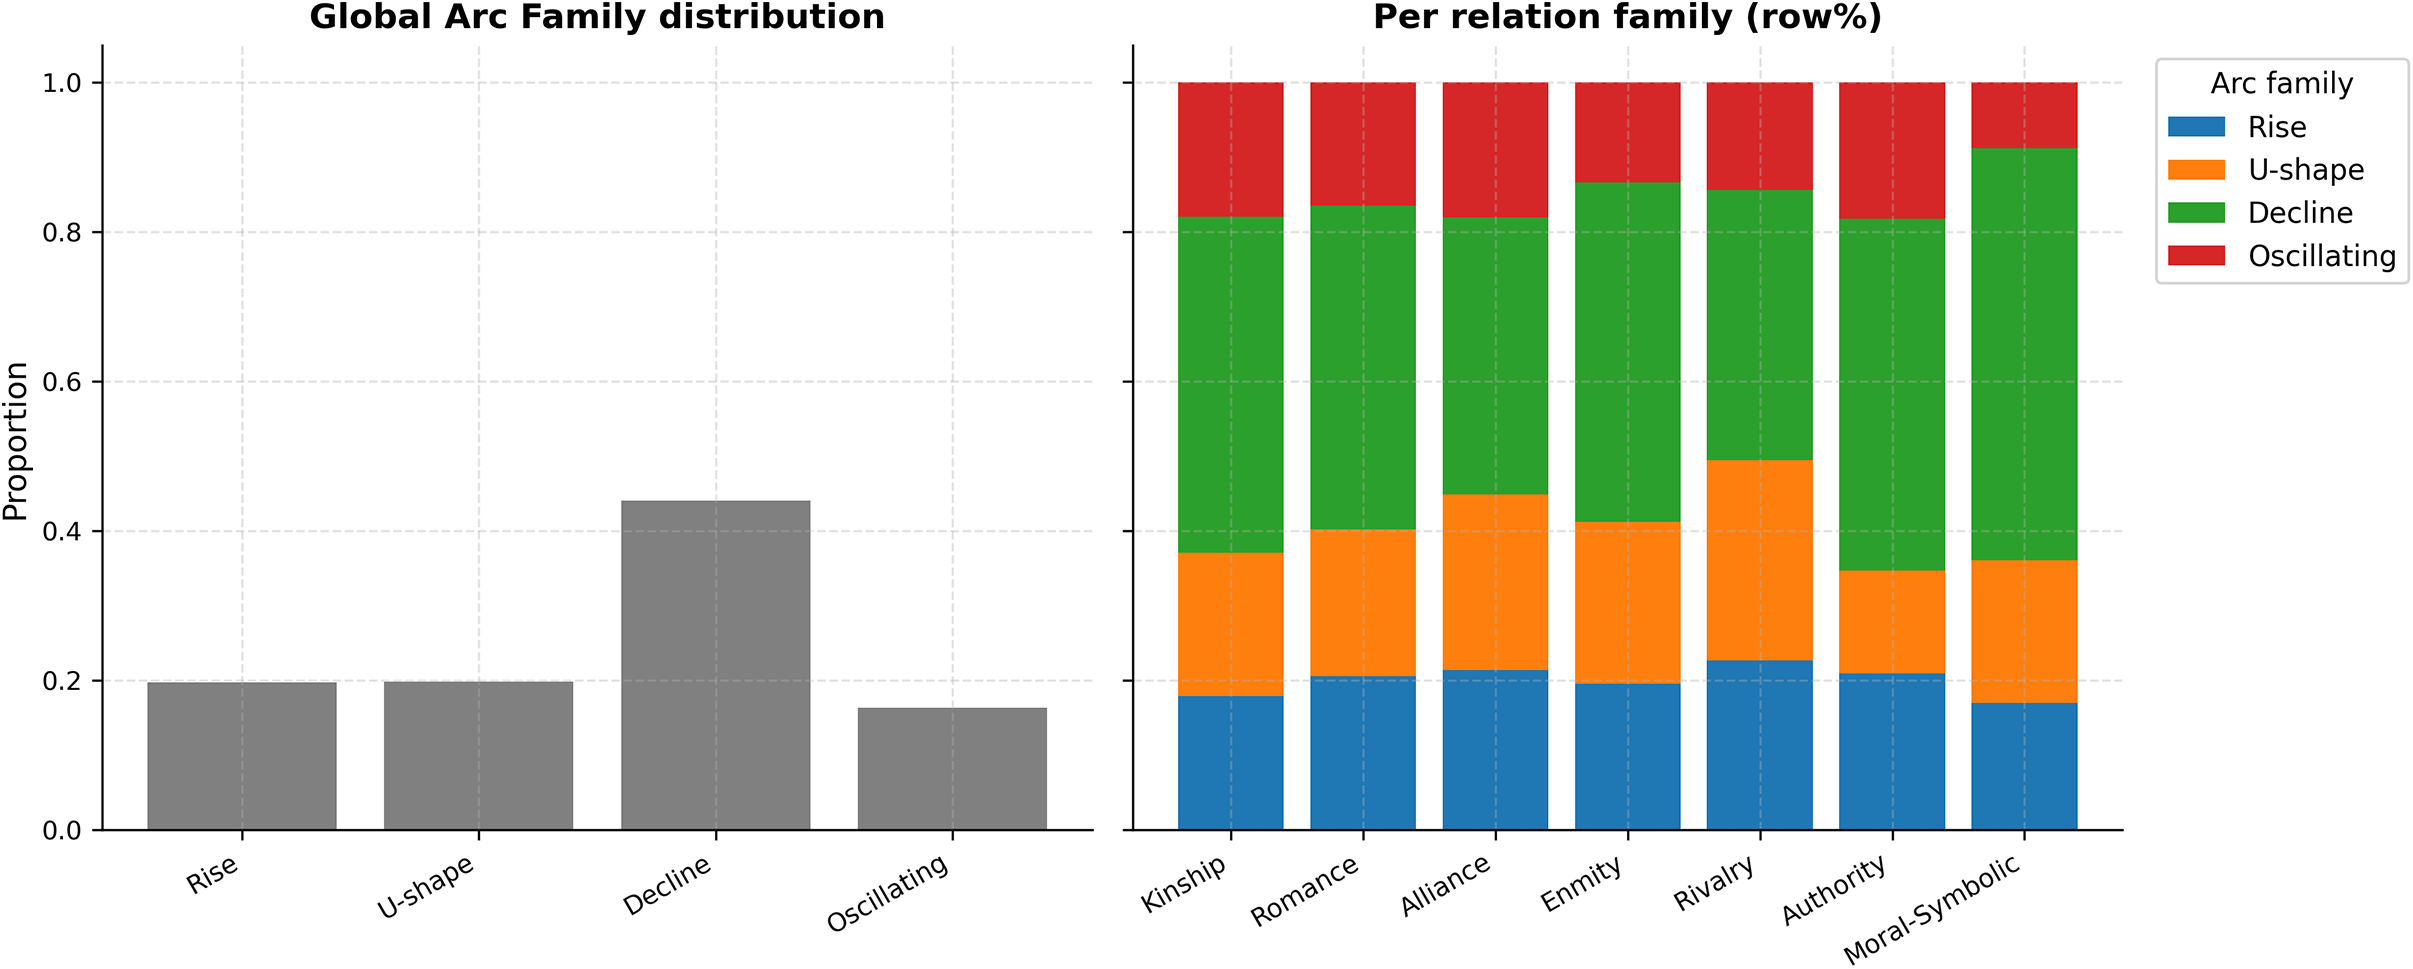
Among the arc prototypes we identified, Decline emerges as by far the most prevalent trajectory, both across the corpus as a whole and within every individual relation family. This recurrent pattern does not imply that relationships vanish from the narrative altogether. Rather, under the logic of z-normalization, it indicates that many ties are disproportionately foregrounded at the beginning of stories, during the phases of world-building, obligation setting or alliance recruitment, and then gradually recede in relative intensity as the narrative moves toward its conclusion. What is being measured, therefore, is not absolute disappearance but a relative de-emphasis: the shift from initial narrative work of establishing ties to later narrative work of resolving or closing them. Such a trajectory resonates closely with classical narratological accounts of plot structure, in which the middle and end of stories are marked by falling action and closure. From this perspective, Decline may be understood as a baseline rhythm of fictional narration: relationships are introduced and elaborated early, but are gradually subsumed under the demands of resolution, denouement and the restoration of equilibrium.
At the same time, the right panel of Figure 11 reveals patterned departures from this baseline: certain relation families consistently privilege alternative shapes, such as Rise, U-shape or Oscillating arcs, indicating that genres and ties selectively mobilize different trajectories to produce reconciliation, suspense or instability. Precisely:
-
• Romance, Alliance and (to a lesser degree) Rivalry exhibit comparatively larger U-shape shares, consistent with rupture–repair and temporary separations.
-
• Enmity and Authority show relatively more Rise, capturing escalation of conflict and power struggles as the plot advances.
-
• Kinship and Moral–Symbolic are most strongly Decline, echoing early exposition and late didactic closure.
Genre signatures within families
Because Decline is ubiquitous, we also examine genre differences after filtering out Decline to surface the most informative contrasts (Figure 12). Within each genre panel, bars show the proportion of Rise, U-shape and Oscillating for each relation family (row-normalized, Decline removed); stars mark the modal choice.
Genre differences in arc shapes, Decline removed. For each genre (panel) and relation family (x-axis), stacked bars show the distribution over Rise, U-shape and Oscillating; the star marks the largest share. This view highlights departures from the global Decline baseline.
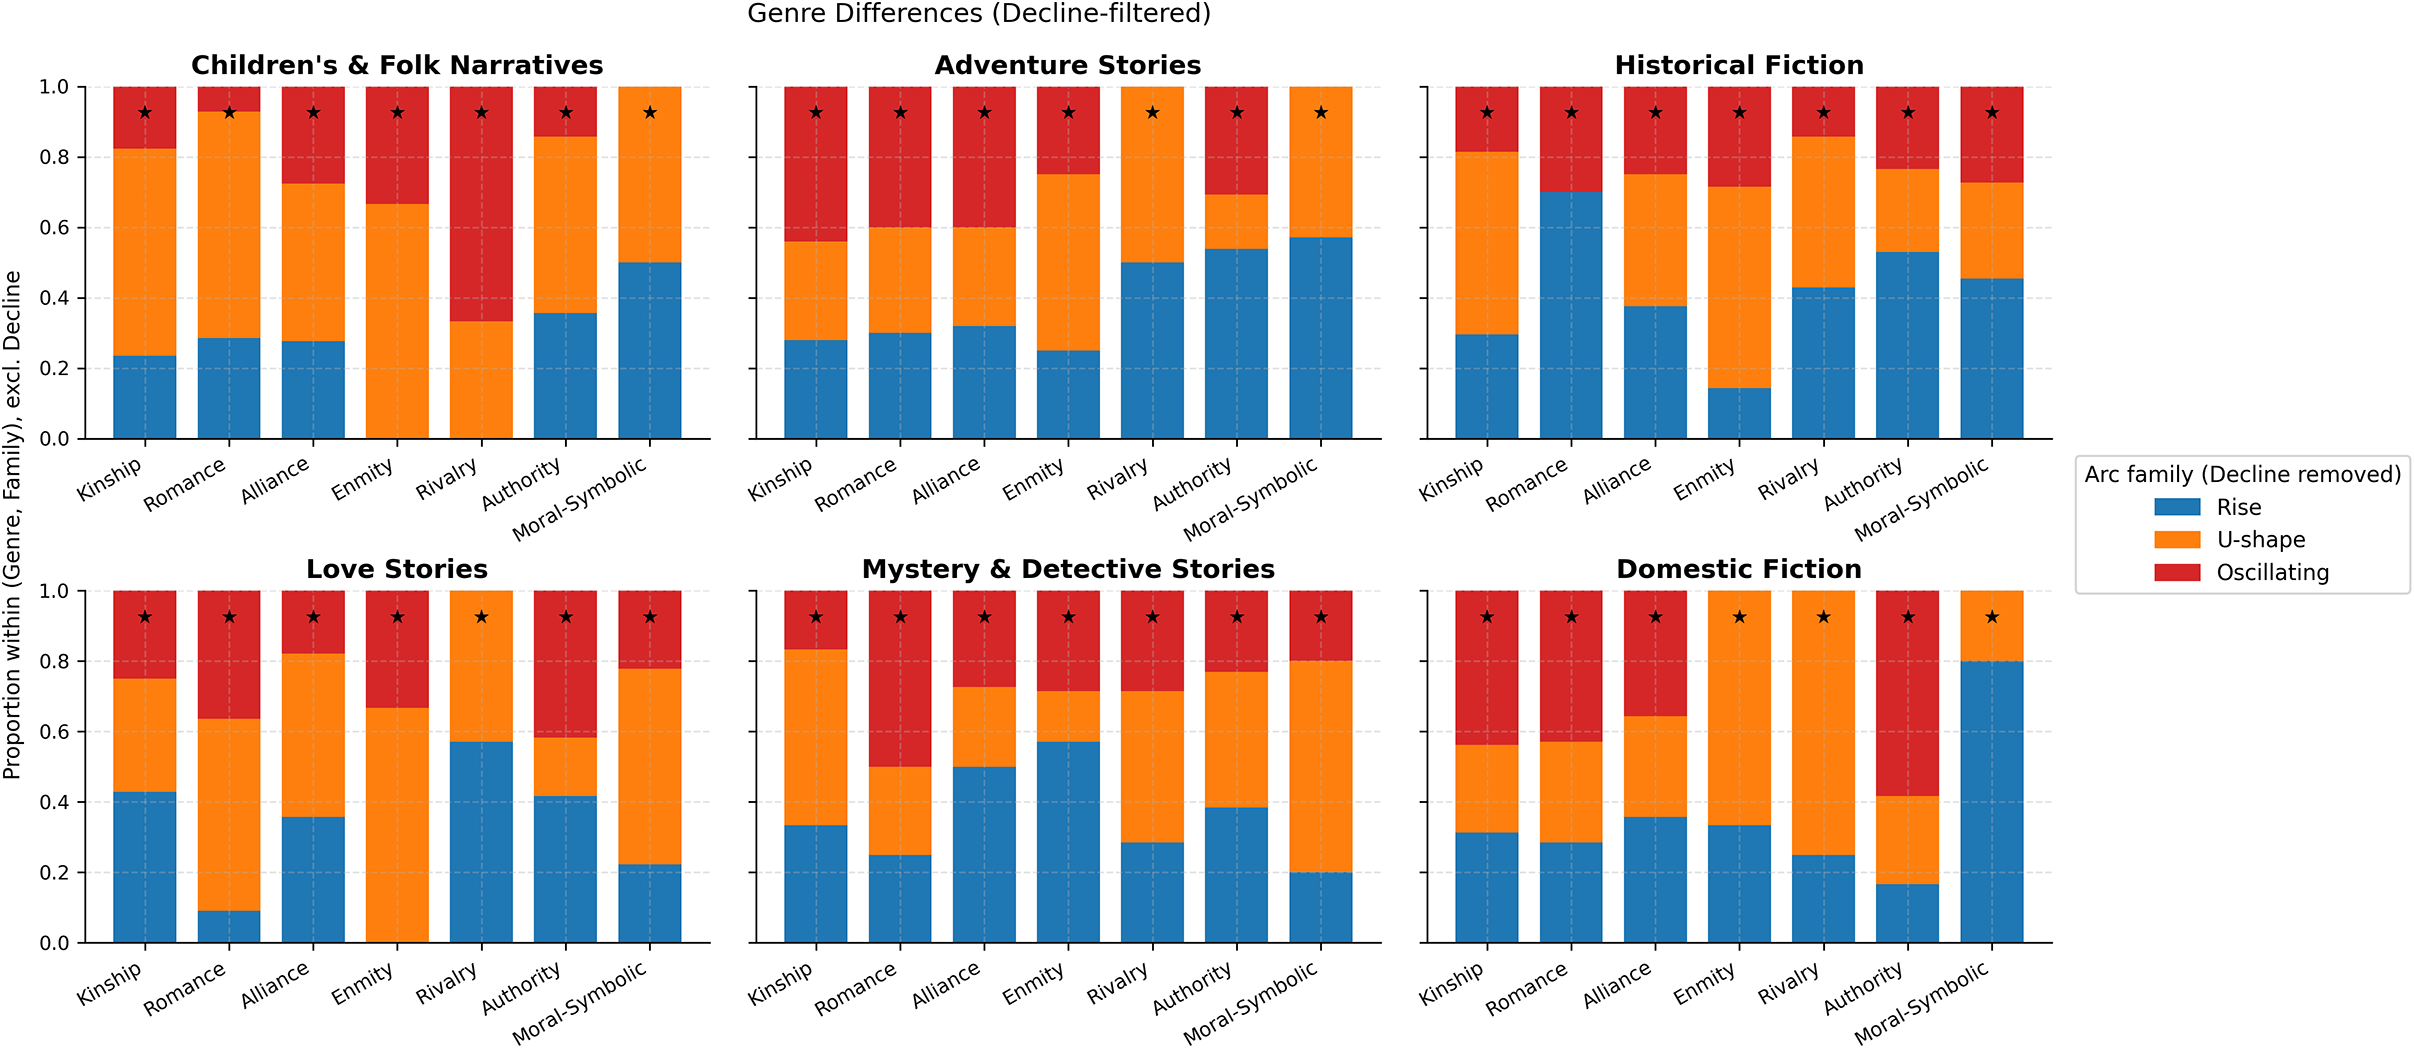
Several stable signatures emerge:
-
• Love stories favor U-shapes for Romance (and often for Alliance/Rivalry), aligning with separation–reunion plots.
-
• Adventure and historical fiction show more Rise for Enmity/Rivalry and a mix of Rise/Oscillating for Authority, indexing escalation toward climactic confrontations and institutional power play.
-
• Mystery & detective narratives lean Oscillating for Authority and Alliance, reflecting cycles of suspicion, interrogation and temporary cooperation.
-
• Domestic fiction keeps U-shapes comparatively salient in Romance/Kinship, consistent with reconciliation within the household.
-
• Children’s & folk narratives often combine U-shape in Kinship/Alliance with low but present Oscillation in Moral–Symbolic, compatible with didactic closure.
Interpretation
Putting Figures 9–12 together, we obtain a coherent picture. First, a small set of global prototypes governs how relations unfold. Second, Decline functions as a structural default (early foregrounding, late resolution), while genres selectively privilege marked alternatives: U-shapes in love plots; Rise in conflict-centered genres; Oscillation in investigation and quest structures. The result is a bridge between narratological theory (masterplots, actant roles) and large-scale, data-driven measurement.
Limitations and future directions
While this study advances computational narratology by modeling relationships as dynamic narrative structures, several limitations qualify our findings and point toward promising directions for future research. The first concerns the nature of synthetic annotation. The ARF dataset relies on LLMs, specifically GPT-4o, for RE. Although the model adheres closely to the ontology and performs consistently across diverse contexts, automatically generated annotations inevitably introduce both stochastic noise and interpretive bias. In literary narrative, where relationships are often metaphorical, implied or perspectival, models may overemphasize explicit ties while underrepresenting latent or evolving ones. These tendencies can shape the contour of observed arcs, privileging surface-level social events over deeper narrative tensions. Combining synthetic generation with human-in-the-loop validation, as recent work recommends for interpretive NLP tasks (Jiang et al. Reference Jiang, Lin, Wang, Sun, Han, Duh, Gómez and Bethard2024; Wadhwa, Amir, and Wallace Reference Wadhwa, Amir, Wallace, Rogers, Boyd-Graber and Okazaki2023), would improve calibration and allow the identification of systematic blind spots through targeted manual review.
A second limitation involves narrative continuity and coreference. Our approach tracks relation mentions within overlapping five-sentence windows, a segmentation that ensures local coherence but fragments long-range connections: dyads extending across chapters may appear disjointed or duplicated. Without discourse-level entity resolution, such ties cannot be seamlessly tracked throughout the text. Incorporating coreference and entity linking (Luan et al. Reference Luan, He, Ostendorf, Hajishirzi, Riloff, Chiang, Hockenmaier and Tsujii2018) would allow for continuous dyadic arcs that capture the evolving identity of characters and the persistence of relationships over the course of an entire novel. This refinement would not only improve technical precision but also engage a central narratological concern: how character identity and interpersonal bonds are maintained or transformed over narrative time.
The third set of limitations concerns metadata and normalization choices. Genre labels in ARF derive from Project Gutenberg classifications, which are often coarse, overlapping and inconsistent across historical periods. While our multi-label analysis mitigates some of this noise, more systematic bibliographic or computational genre modeling could yield clearer relational fingerprints (Piper Reference Piper2020; Underwood Reference Underwood2019). Similarly, our temporal normalization scheme, 20 equal bins (5% each) and per-1,000-chunk scaling, provides a transparent and reproducible baseline but does not exhaust the range of possible temporal segmentations. Alternatives, such as adaptive binning based on change-point detection (Truong, Oudre, and Vayatis Reference Truong, Oudre and Vayatis2020), chapter-level segmentation or narratologically motivated phases (exposition, conflict and resolution), may highlight different structural emphases. Testing robustness across these alternatives would clarify which relational patterns reflect genuine narrative tendencies and which arise from modeling conventions.
Another limitation concerns clustering sensitivity and model expressiveness. Our identification of four relational arc prototypes (Rise, U-shape, Decline and Oscillating) is supported by silhouette analysis and interpretability, yet the partitioning of continuous trajectories into discrete categories remains partly subjective. Alternative approaches, such as Bayesian mixture modeling, hierarchical clustering or neural sequence modeling, could reveal additional or more nuanced relational trajectories, capturing transitional states between archetypal forms (Chaturvedi, Iyyer, and Daume III Reference Chaturvedi, Iyyer and Daumé2017; Soni et al. Reference Soni, Sihra, Evans, Wilkens, Bamman, Rogers, Boyd-Graber and Okazaki2023). Future work might also integrate micro- and macro-level analysis by aligning dyadic arcs with corpus-level prototypes, thereby connecting local narrative events to global structural patterns.
Finally, there are broader cultural, linguistic and medial constraints. The present corpus focuses on English-language prose fiction from 1850 to 1950, a historically coherent but geographically and stylistically narrow domain. Whether similar relational arc families recur across languages, genres or media (film, drama and oral storytelling) remains an open question. Comparative extensions could test whether the structural patterns observed here reflect universal principles of narrative organization or culturally specific storytelling conventions (Bizzoni, Feldkamp, and Nielbo Reference Bizzoni, Feldkamp, Nielbo, Haverals, Koolen and Thompson2024b; Pianzola Reference Pianzola2024). Such comparative work could also examine how different literary traditions encode power, obligation or intimacy within their relational grammars. Equally important, future research should explore how these structural features intersect with reader experience. Work on narrative perception and literary quality (Bizzoni et al. Reference Bizzoni, Moreira, Lassen, Thomsen, Nielbo, Calzolari, Choukri and Isahara2024a; Feldkamp et al. Reference Feldkamp, Kardos, Nielbo, Bizzoni, Johansson and Stymne2025) suggests that patterns of relational coherence and transformation contribute to aesthetic and emotional engagement. Incorporating affective or reception-oriented data through sentiment alignment, empathy modeling or reader surveys could thus extend the study of relationships from textual structure to experiential meaning.
Taken together, these limitations underscore the need for methodological refinement, interpretive validation and cross-cultural expansion. Addressing them will not only improve empirical reliability but also deepen the theoretical contribution of relational arcs as a bridge between quantitative modeling and narratological interpretation. The framework presented here should therefore be viewed not as a conclusion but as a foundation: an initial attempt to render visible, at scale, the dynamic social logic that narratology has long sought to describe.
Conclusion
This study has demonstrated that the architecture of narrative is fundamentally relational. By tracing the rise and fall of social ties like kinship, romance and enmity, we have shown that relational arcs are not merely thematic elements but core, measurable structures of plot. Our analysis revealed a recurring “social grammar” across a century of fiction, from the baseline scaffolding provided by alliance and kinship to the genre-specific timing of conflict and romance. Furthermore, we identified four archetypal shapes (Rise, U-shape, Decline and Oscillating) that provide quantitative evidence for long-standing narratological theories of story form.
As our work on genre and diachronic change shows, these patterns are not static; they reflect the evolving cultural and literary norms of how we tell stories. While grounded in a specific corpus and methodology, our findings open up new avenues for research, from cross-linguistic comparisons to analyses of different media. The framework presented here is a foundation for a deeper inquiry: moving from mapping the structure of relationships to understanding their effect and how these dynamic arcs shape reader experience, create aesthetic engagement and reflect the cultural evolution of sociality itself. By treating relationships not as static backdrops but as the dynamic engine of plot, we gain a better understanding of what drives a story forward.
Data availability statement
All data used in this study are publicly available at https://huggingface.co/datasets/Despina/project_gutenberg, specifically within the synthetic_relations_in_fiction_books subset. The dataset includes a detailed description of its contents, supporting transparency, verification and reproducibility.
Disclosure of Use of AI Tools
Generative AI tools were used to assist with code debugging and to provide minor suggestions related to grammar, spelling, and word choice. No AI tools were used beyond these limited purposes.
Ethical standards
The research meets all ethical guidelines, including adherence to the legal requirements of the study country.
Author contributions
Conceptualization and Writing – review and editing: D.C. and G.T.; Methodology, Data curation, Data visualization, Formal analysis and Writing – original draft: D.C.; Supervision: G.T. Both authors approved the final submitted draft.
Funding statement
This research was conducted as part of a Ph.D. programme at the School of Informatics, Aristotle University of Thessaloniki, and received no specific grant from any funding agency in the public, commercial or not-for-profit sectors.
Competing interests
The authors declare none.
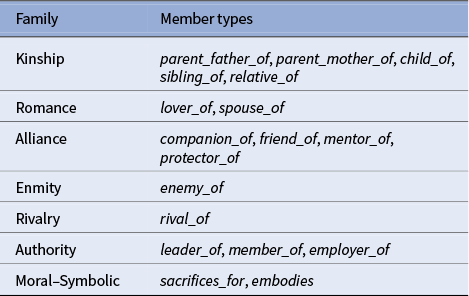
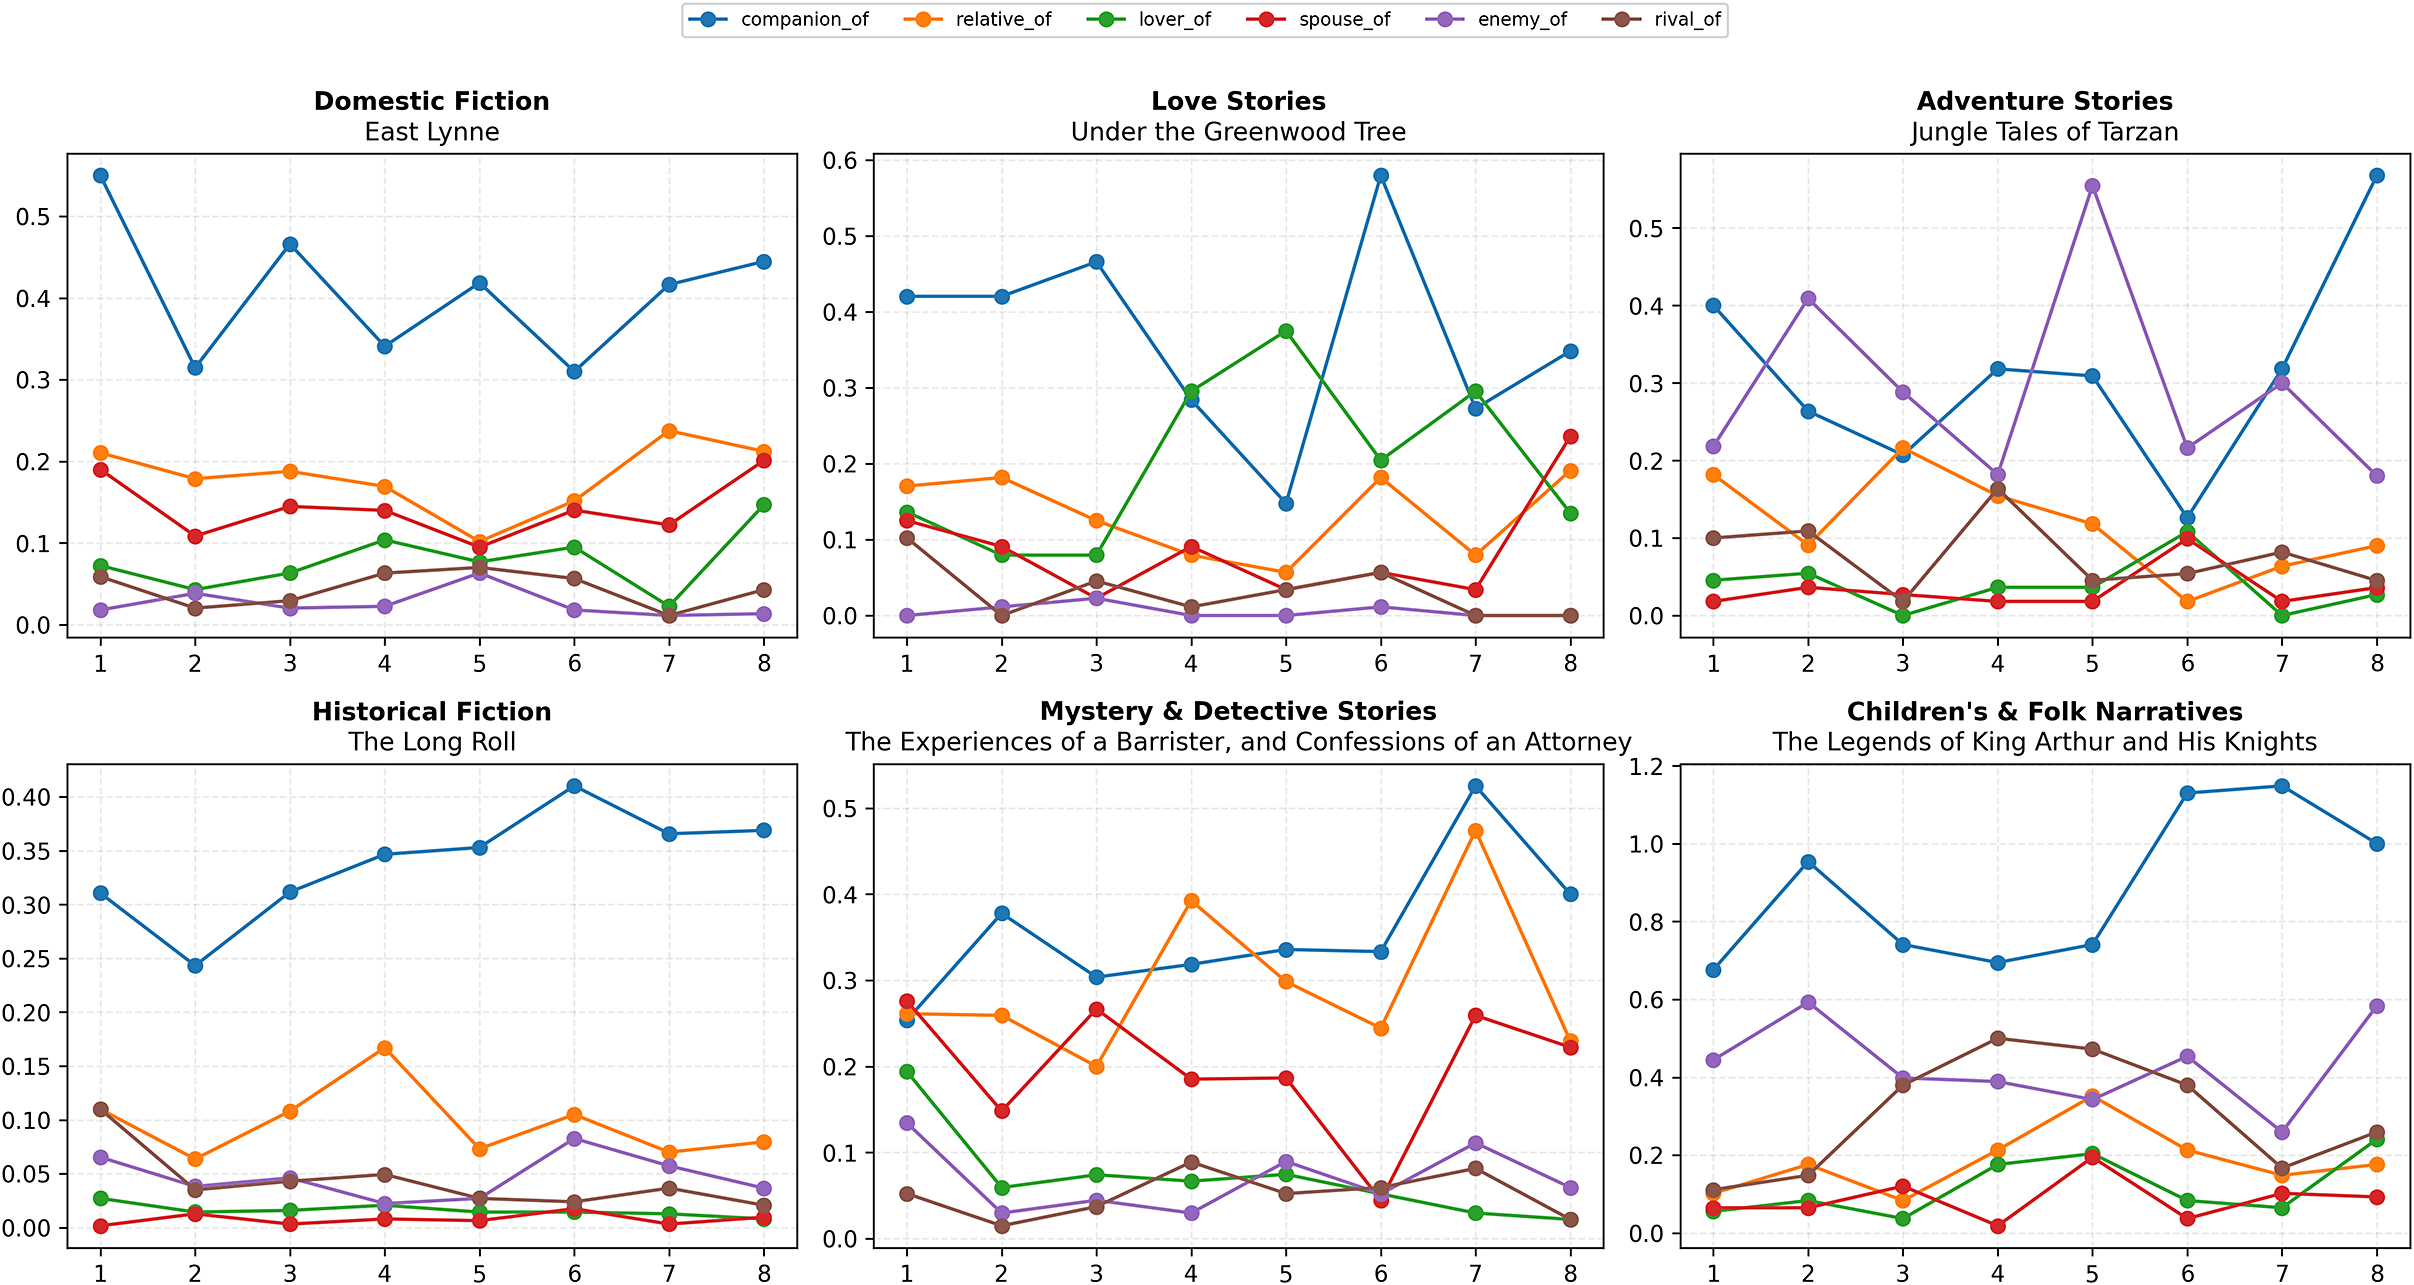
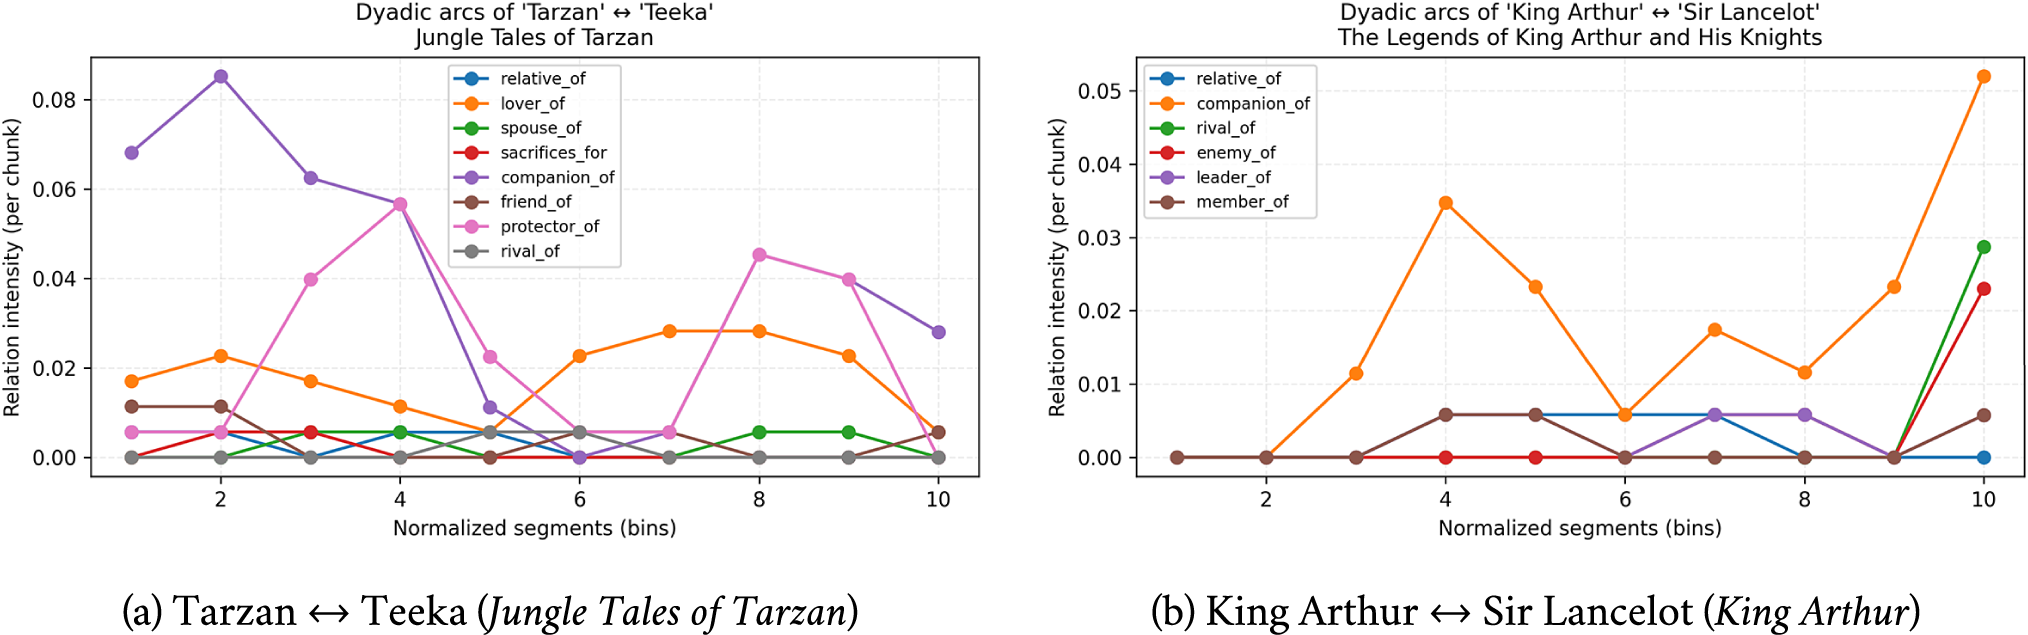
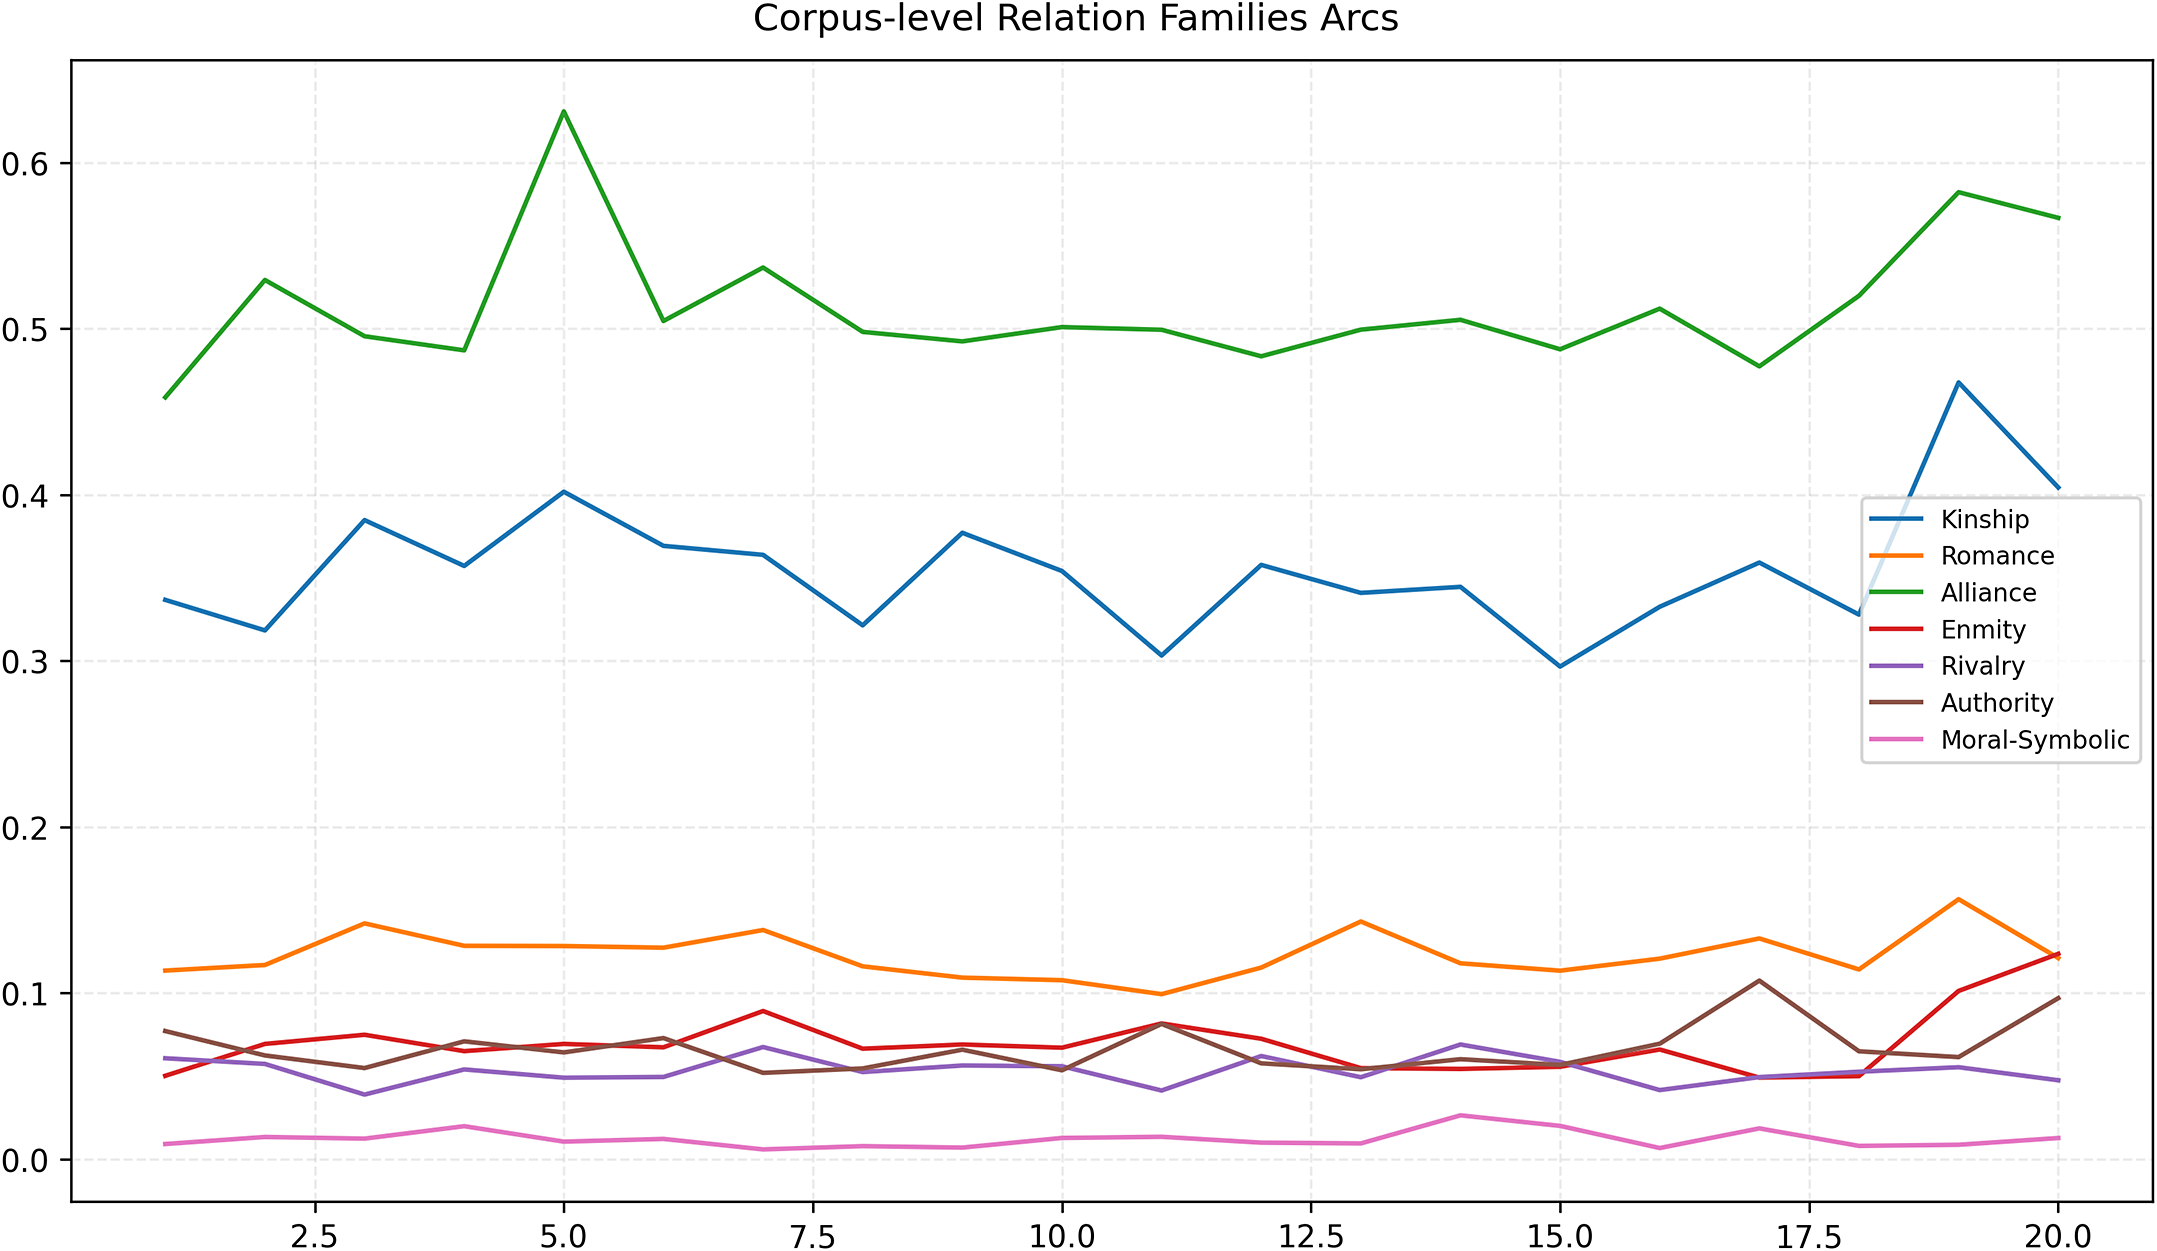

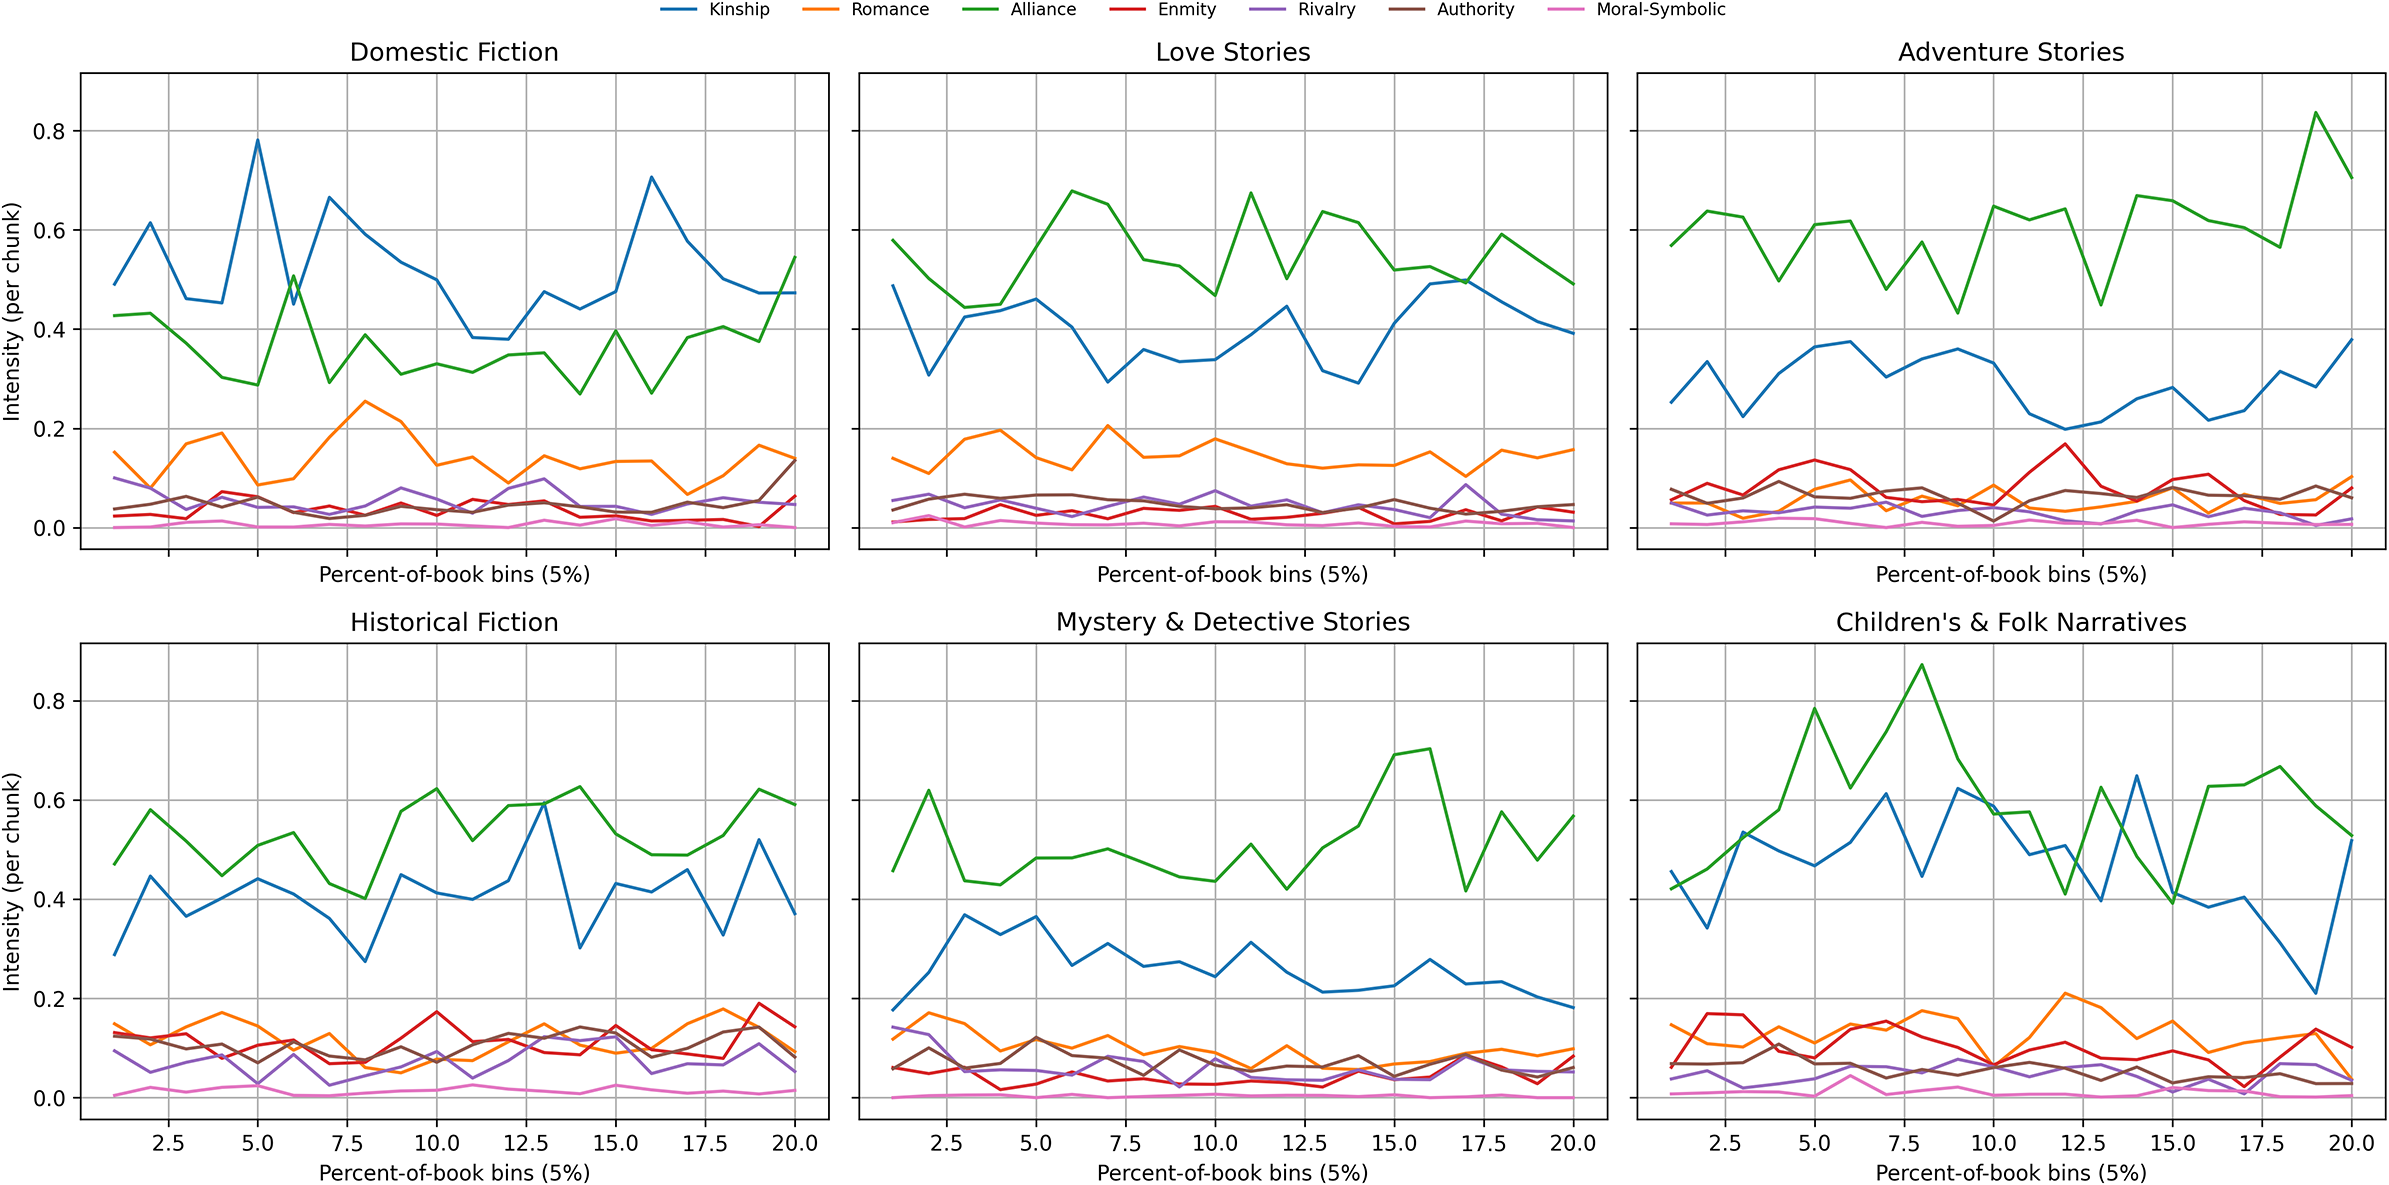
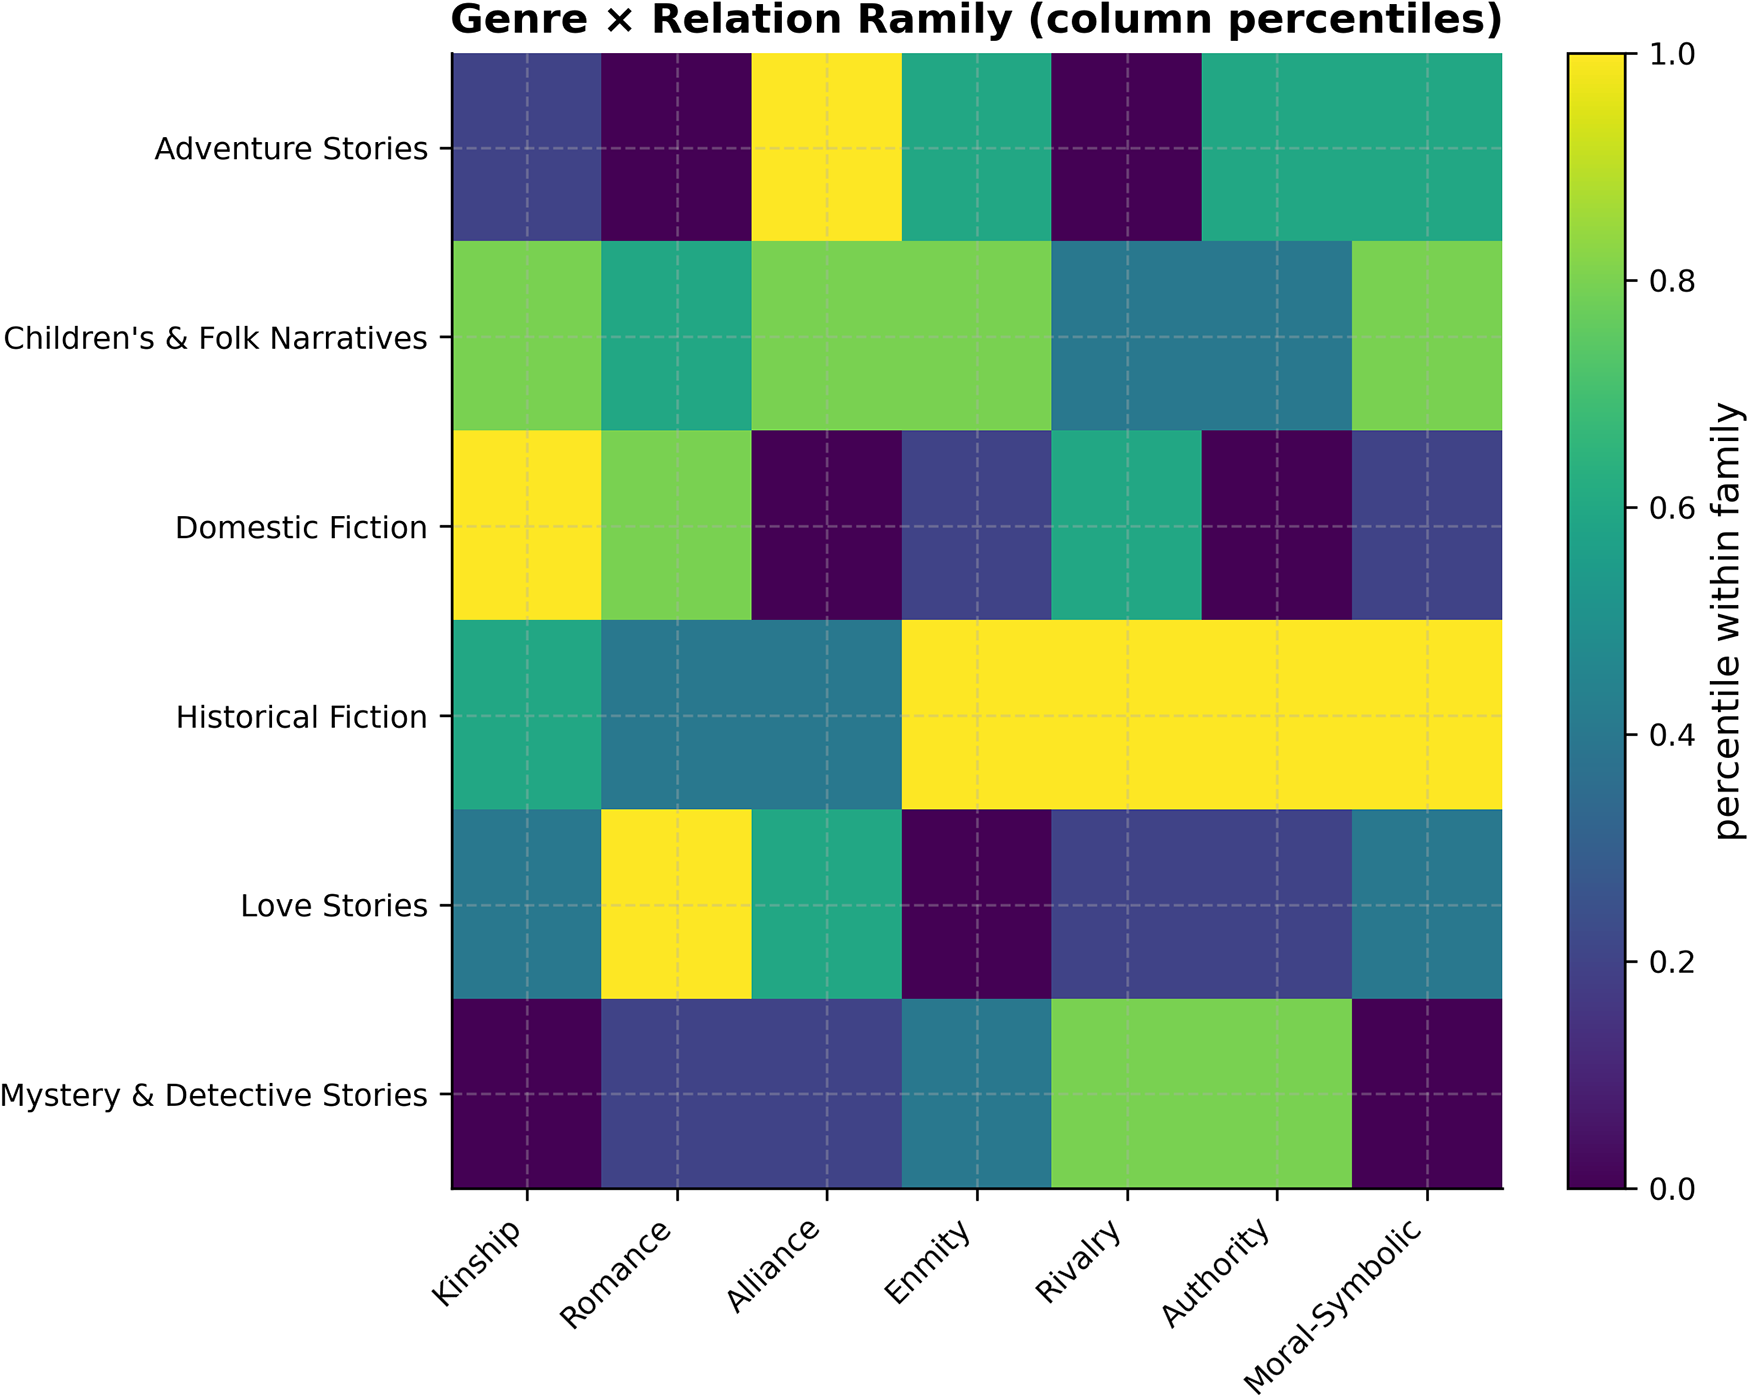

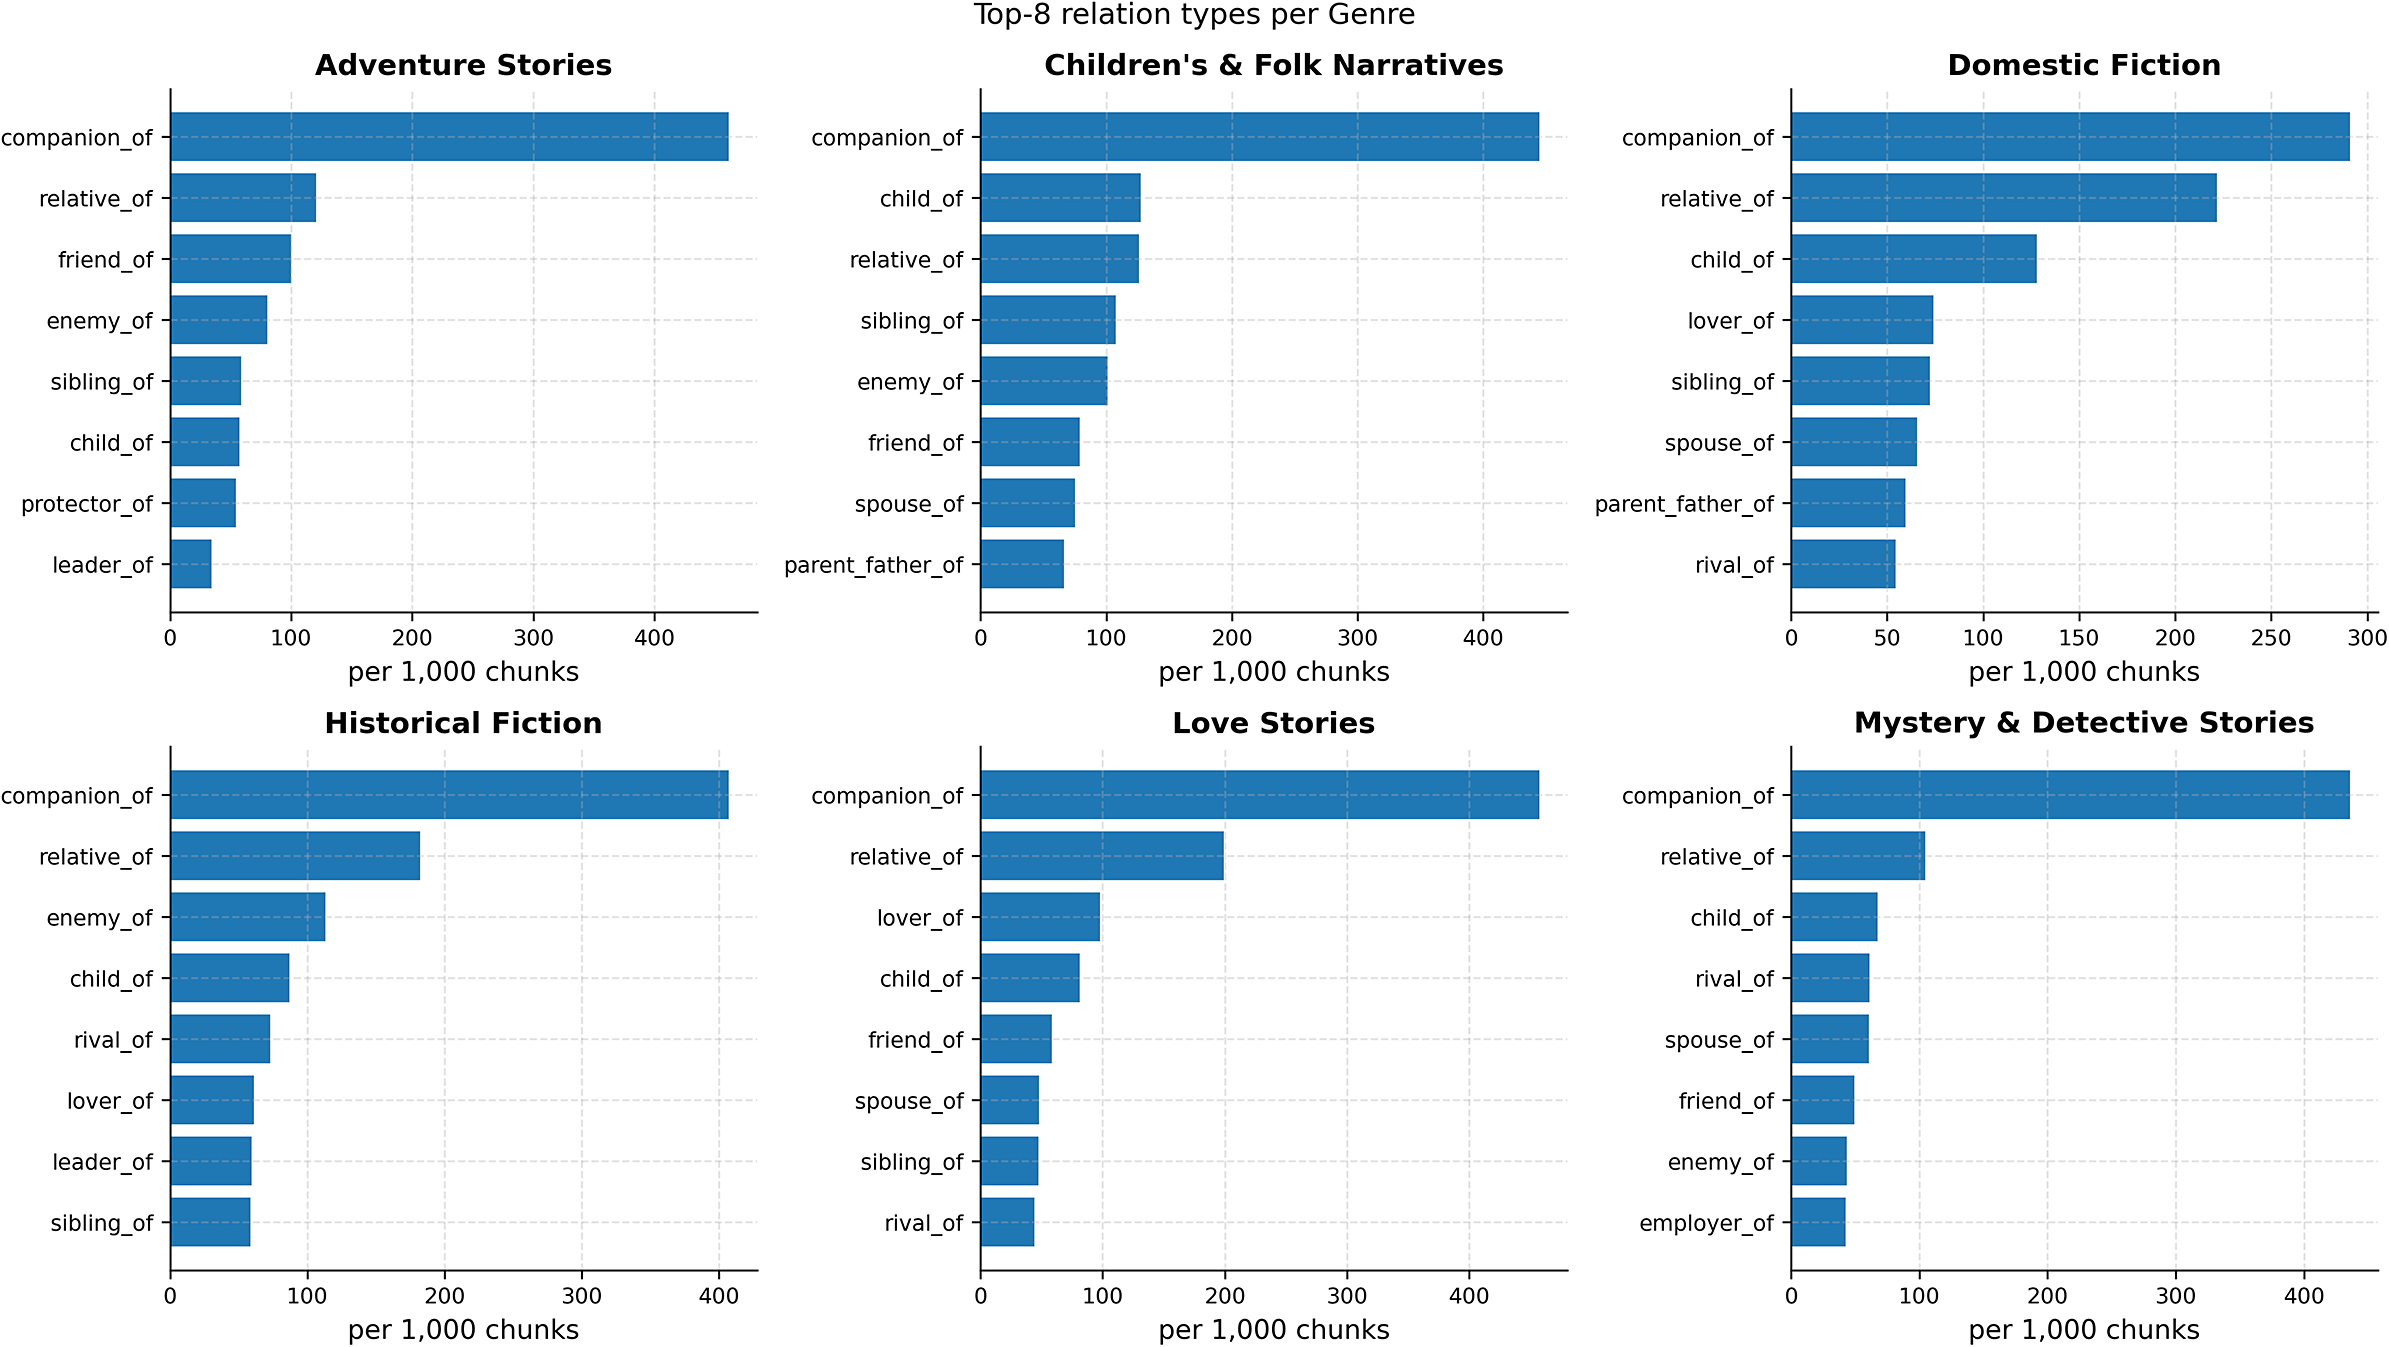
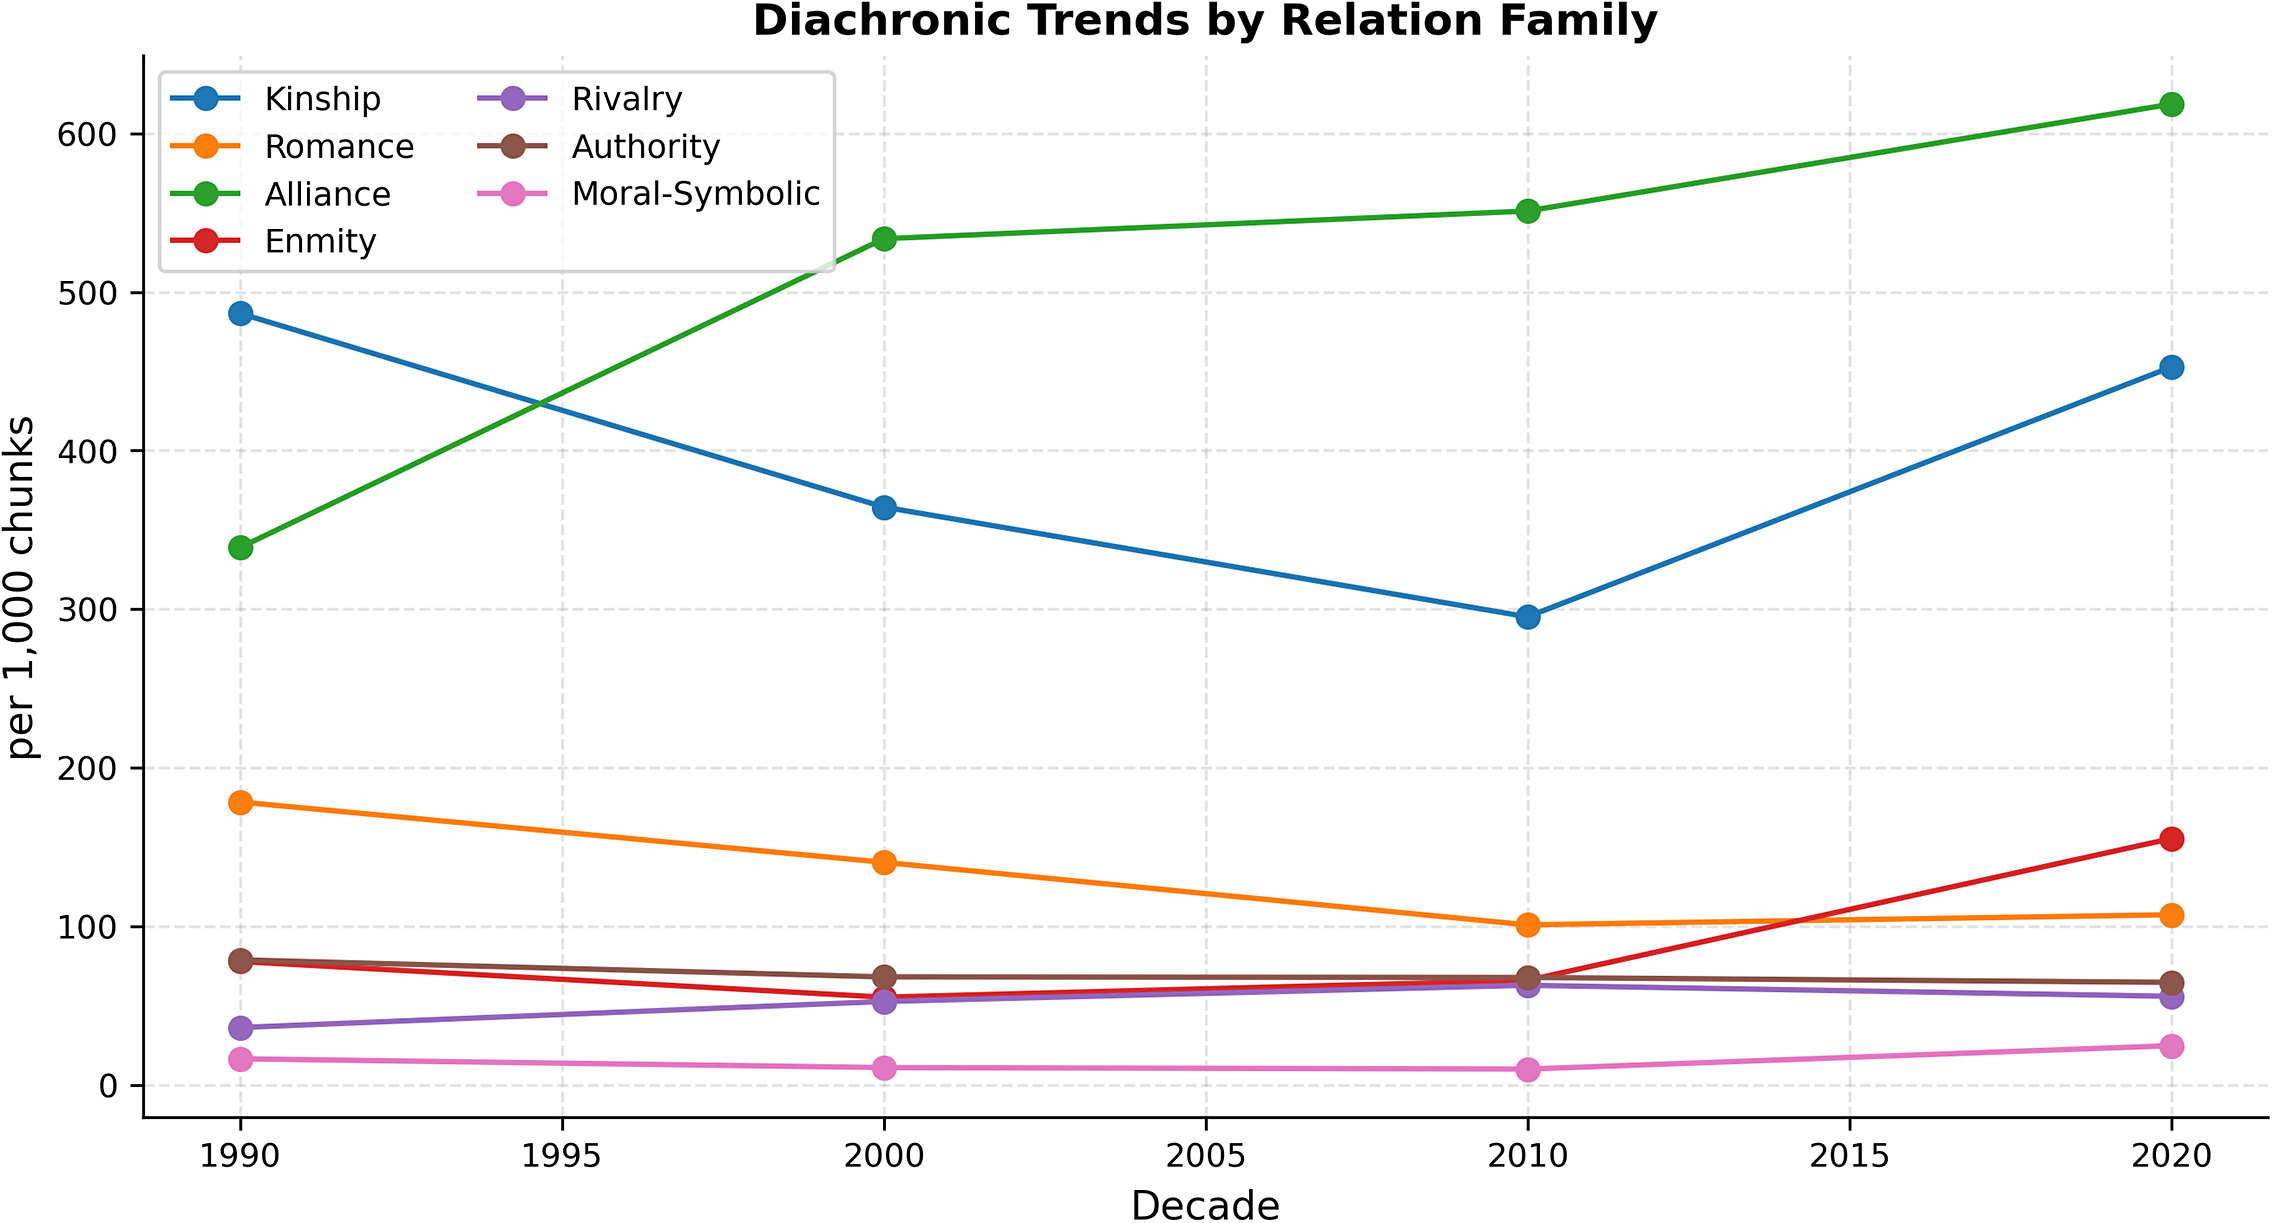
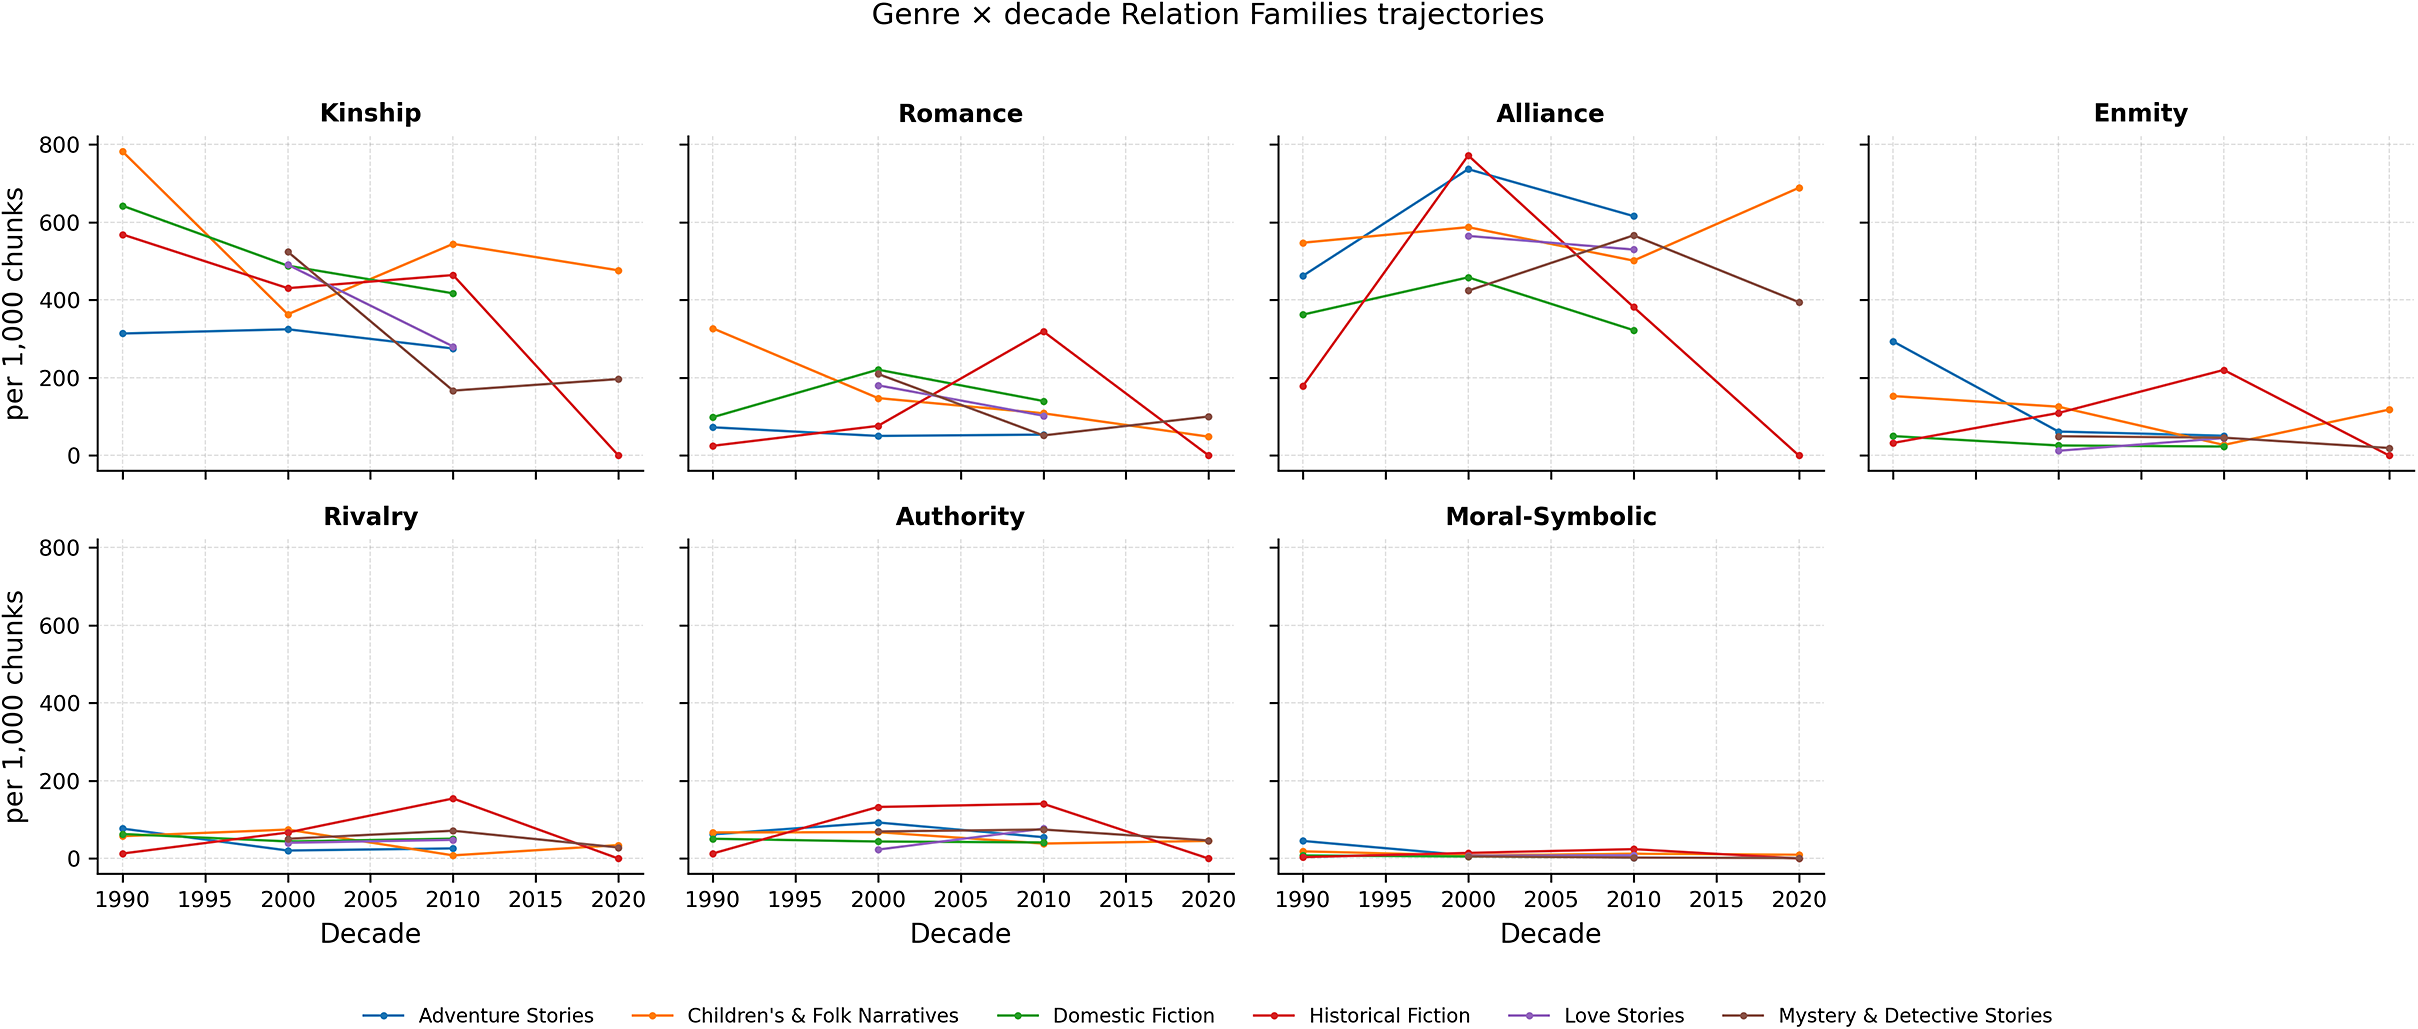

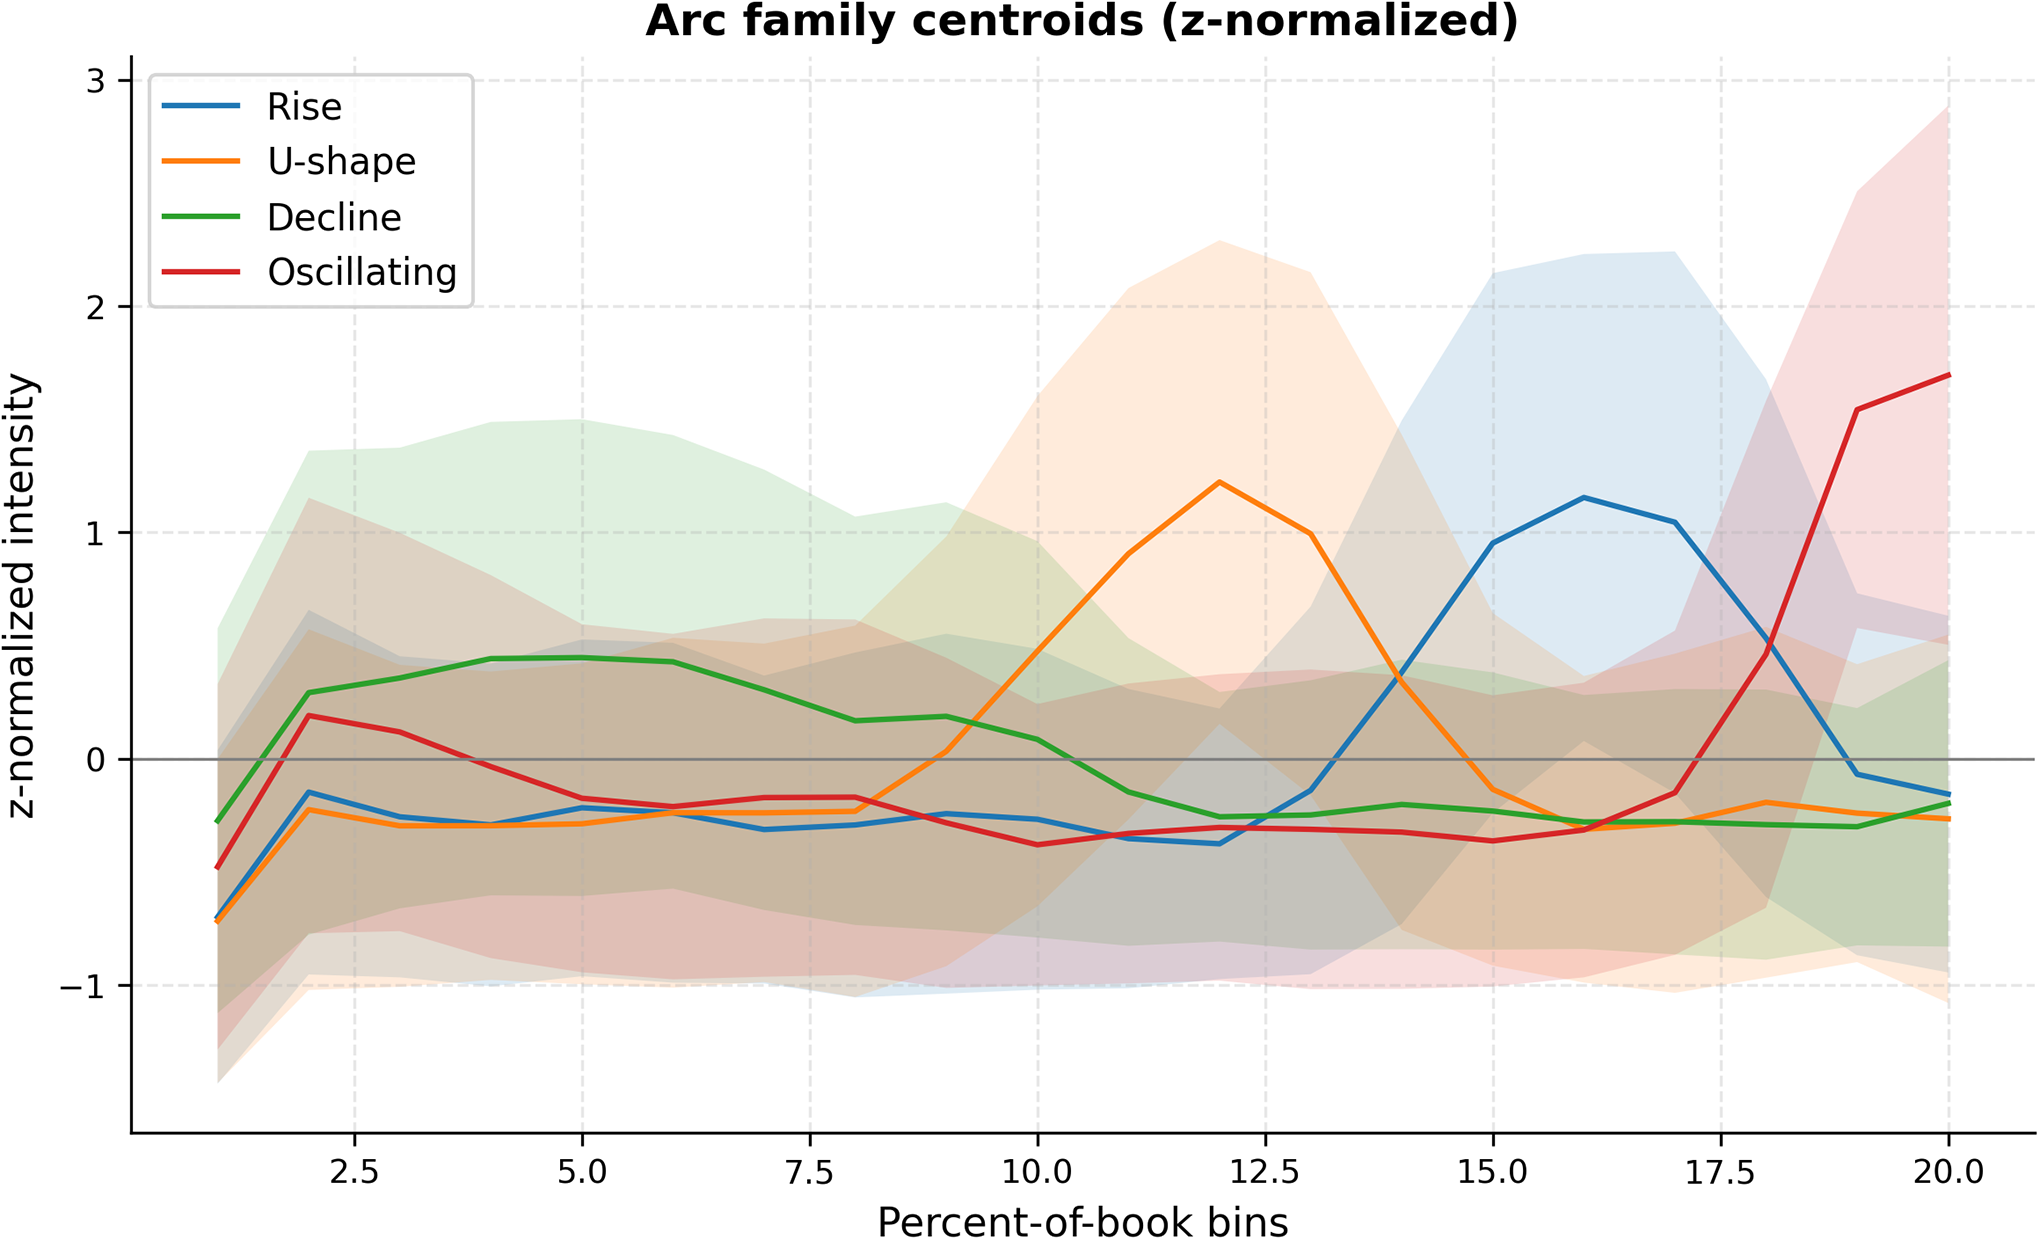


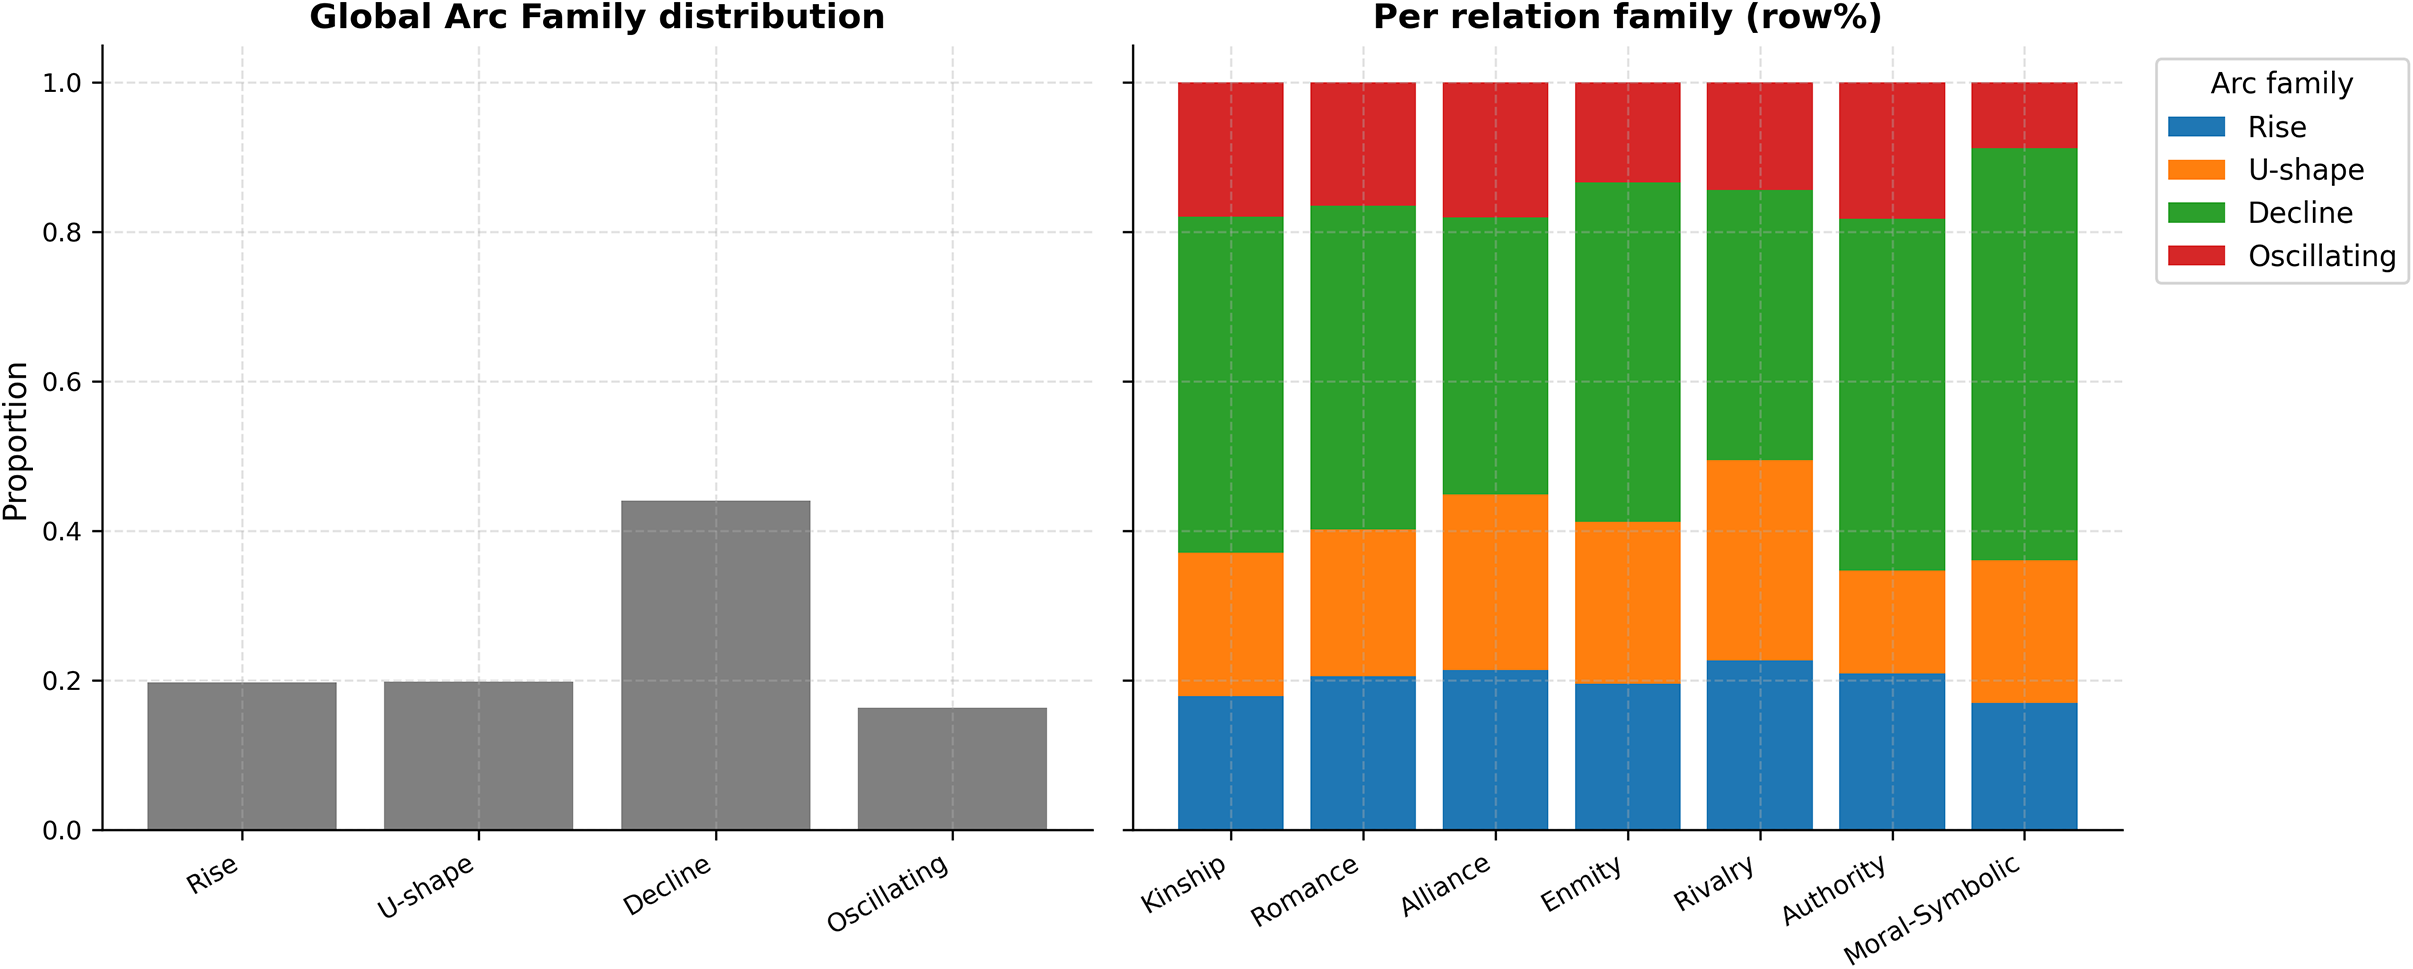
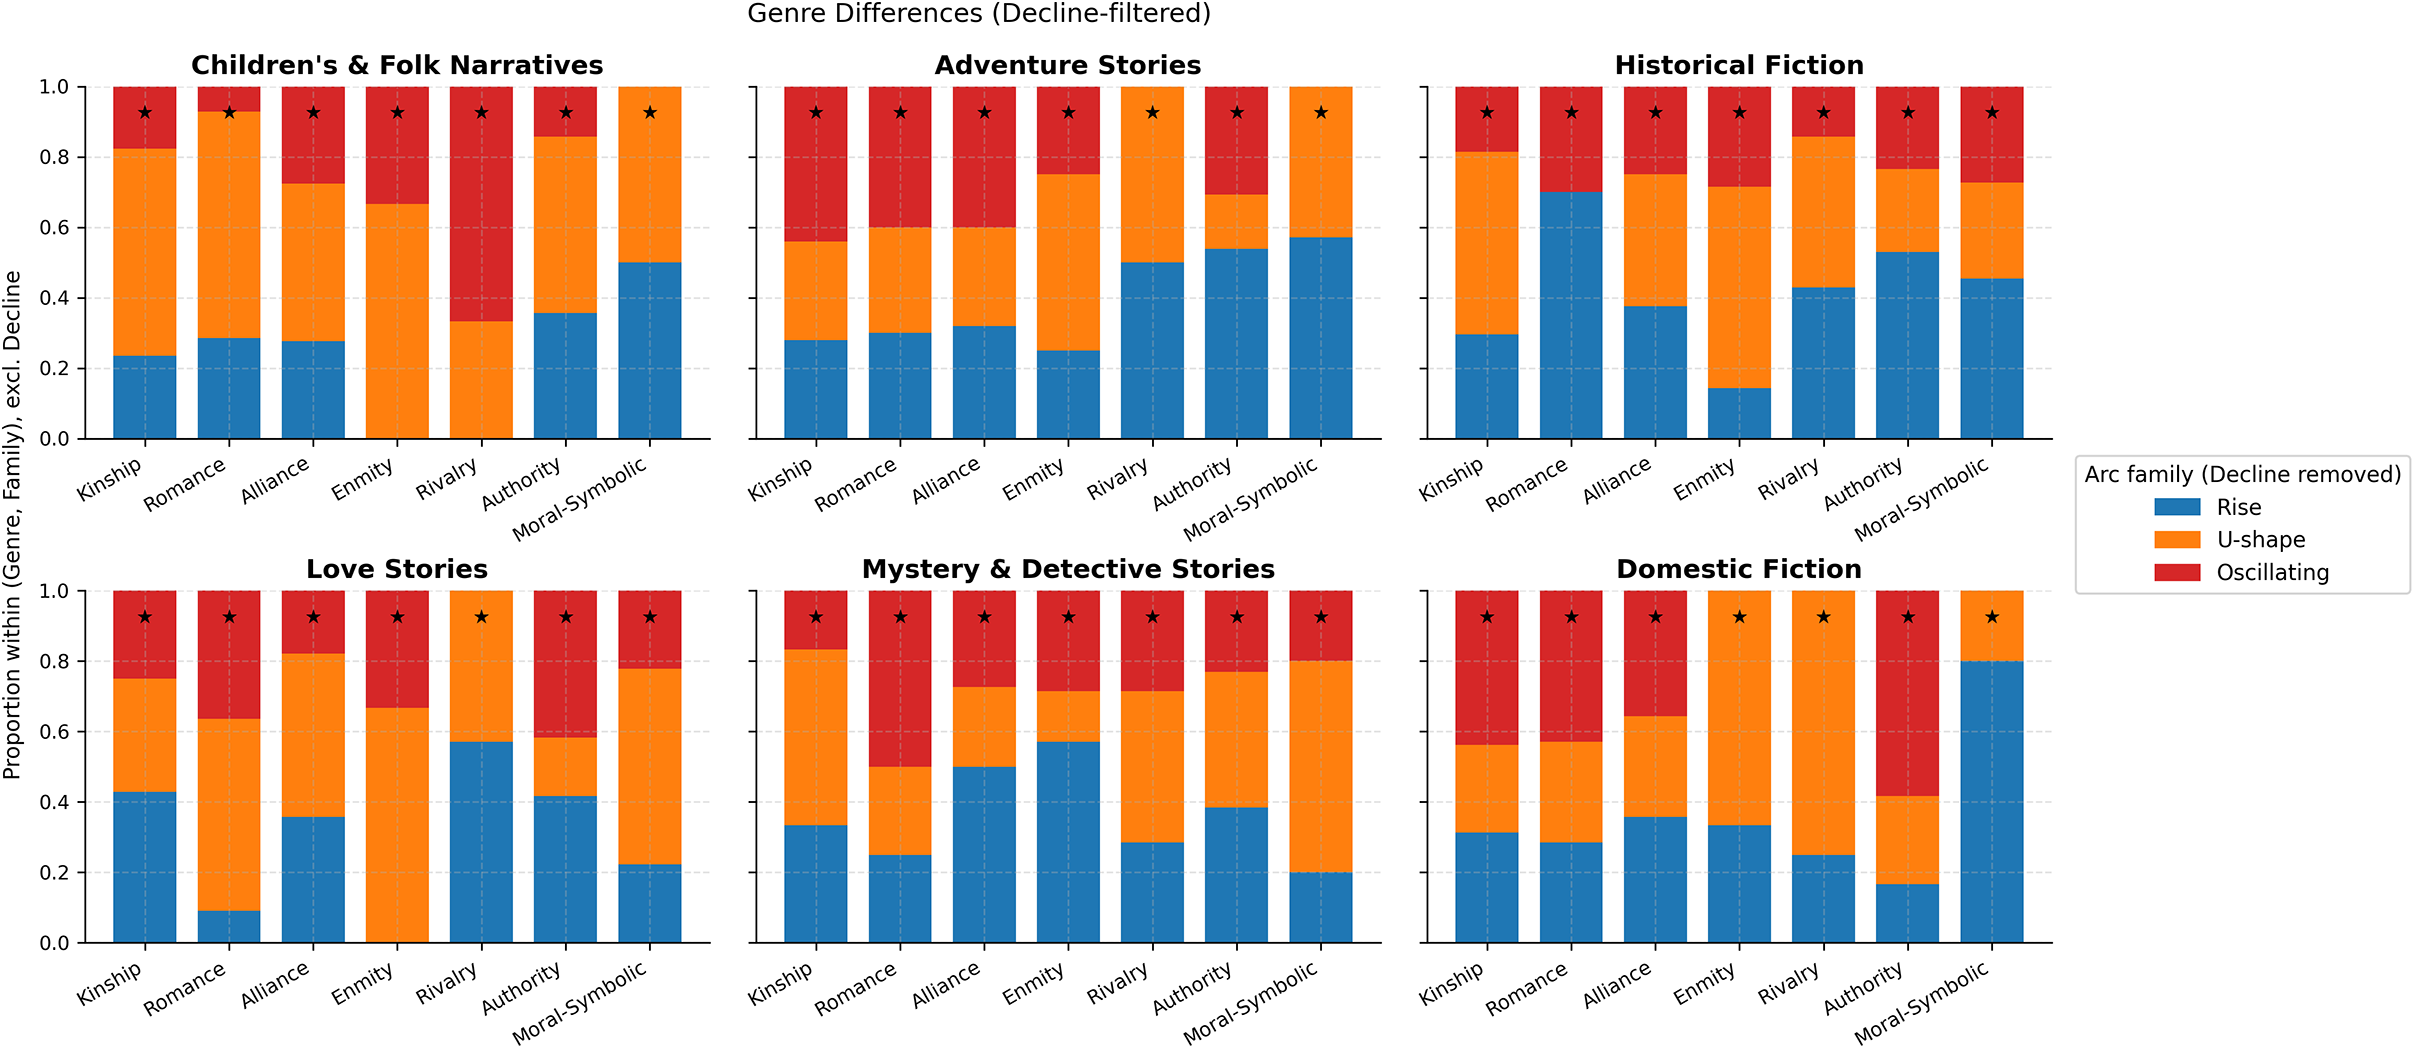

 Open access


Rapid Responses
No Rapid Responses have been published for this article.