


1 Introduction
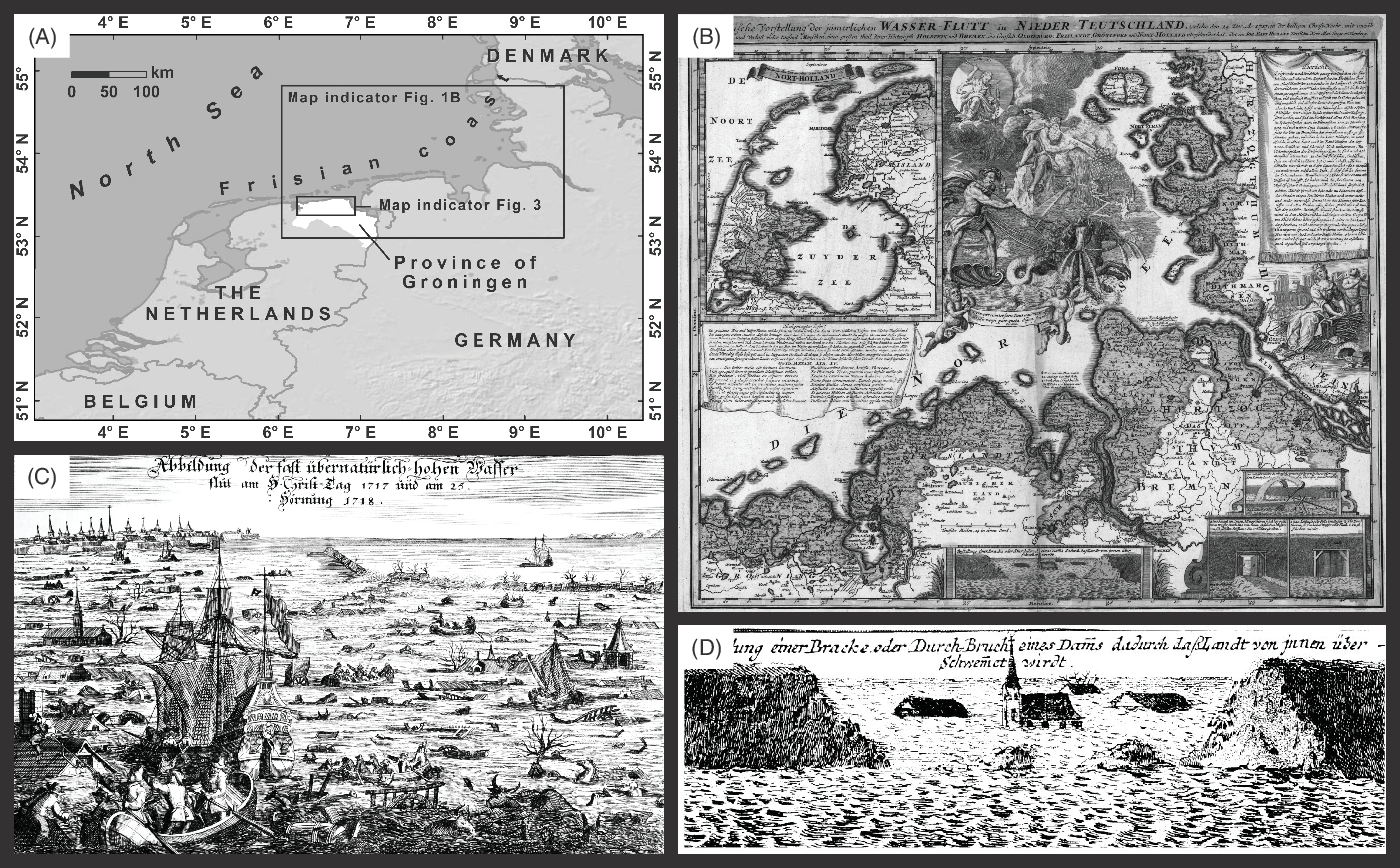
Extratropical cyclones in the zone of the Westerlies frequently cause severe storm surges in the North Sea. Being highly exposed to northerly and westerly winds and showing low land elevations (few metres above/below sea level), the coast of Frisia (Netherlands and Germany; Fig. 1A) is particularly vulnerable to storm surges. As a consequence, the Frisian coast has been repeatedly flooded in history, resulting in considerable loss of human life and vast devastation. Furthermore, storm surges have caused severe changes in the coast’s morphology and thereby significantly contributed to its recent shape. This is particularly obvious for the North Frisian islands and the large inlets and estuaries of West and East Frisia (Zausig, Reference Zausig1939; Kelletat, Reference Kelletat1992; Ahrendt & Thiede, Reference Ahrendt, Thiede, Daschkeit and Schottes2002; Streif, Reference Streif2004; Behre, Reference Behre2008; Homeier et al., Reference Homeier, Stephan and Niemeyer2010; Hadler et al., Reference Hadler, Vött, Newig, Emde, Finkler, Fischer and Willershäuser2018).
(A) Overview map of the southeastern North Sea and the Frisian coast including the Province of Groningen (displayed in white) and map indicators for the maps shown in (B) and Figure 3. (B) Copperplate print by Homann (Reference Homann1718) showing the extensive flooding (grey shaded area) associated with the 1717 Christmas flood (cf. Houben, Reference Houben2018). (C) Copperplate print illustrating the severe flooding and dyke breaching at the Frisian coast during the 1717 Christmas flood (Adelsheim, Reference Adelsheim1719). (D) Excerpt of the copperplate print by Homann (Reference Homann1718) showing a dyke failure.
Catastrophic flooding of the Frisian coast is known from numerous historical storm surges, such as the St Marcellus flood in 1219 (here and in the following AD), the Grote Mandrenke in 1362, the All Saints’ flood in 1570, the Burchardi flood in 1634, the Christmas flood in 1717 and the February flood in 1825, each of which caused thousands of casualties (Ehlers, Reference Ehlers2008; Peters et al., Reference Peters, Recke and Remmers2017; FWU, 2019). However, severe storm surges at the Frisian coast also occurred in more recent times, for example the Hamburg flood in 1962 (around 350 casualties).
It is often stated that the devastating effects of the historical storm surges in particular have to be ascribed to the poor condition and design of contemporary coastal protection measures, especially dykes and sluices (e.g. Busch, Reference Busch1936; Henningsen, Reference Henningsen2002; Meier, Reference Meier2004; Newig, Reference Newig2014). At the same time, however, the sheer intensity of these storm surges has to be considered responsible for the huge human and economic losses. This is implied by (i) the fact that most people were living in the higher-elevation areas of the coast or on terps, while the population density in the low-lying polders, which were prone to flooding, was small, (ii) written accounts describing the extraordinary strength of the historical storm surges in terms of the atmospheric conditions and hydro-/morphodynamic processes (e.g. Hekelius, Reference Hekelius1719; Lamb, Reference Lamb2005; Meier, Reference Meier2011), as well as by (iii) geoscientific and historical evidence indicating that storms in Europe were especially strong and frequent during the Little Ice Age (c.1300 to 1850; e.g. Foster et al., Reference Foster, Albon, Bardell, Fletcher, Jardine, Mothers, Pritchard and Turner1991; Meeker & Mayewski, Reference Meeker and Mayewski2002; Matulla et al., Reference Matulla, Schöner, Alexandersson, von Storch and Wang2008; Clarke & Rendell, Reference Clarke and Rendell2009; Bampton et al., Reference Bampton, Kelley, Kelley, Jones and Bigelow2017; Goslin & Clemmensen, Reference Goslin and Clemmensen2017).
Despite the huge impact of historical storm surges on the Frisian North Sea coast, our knowledge of the hydro- and morphodynamic processes during these events is restricted. This knowledge, however, is essential to improve our understanding of extreme storm surge dynamics, their influence on the coastal landscape and the associated hazards for the coastal population (e.g. Dangendorf et al., Reference Dangendorf, Müller-Navarra, Jensen, Schenk, Wahl and Weisse2014). This is even more true considering the projected sea-level rise (Nicholls et al., Reference Nicholls, Wong, Burkett, Codignotto, Hay, McLean, Ragoonaden, Woodroffe, Parry, Canziani, Palutikof, van der Linden and Hanson2007; Church & Clark, Reference Church, Clark, Stocker, Qin, Plattner, Tignor, Allen, Boschung, Nauels, Xia, Bex and Midgley2013; Rietbroek et al., Reference Rietbroek, Brunnabend, Kusche, Schröter and Dahle2016) and potential increase in storminess (Seneviratne et al., Reference Seneviratne, Nicholls, Easterling, Goodess, Kanae, Kossin, Luo, Marengo, McInnes, Rahimi, Reichstein, Sorteberg, Vera, Zhang, Field, Barros, Stocker, Qin, Dokken, Ebi, Mastrandrea, Mach, Plattner, Allen, Tignor and Midgley2012; Haigh et al., Reference Haigh, Wadey, Wahl, Ozsoy, Nicholls, Brown, Horsburgh and Gouldby2016; Goodwin et al., Reference Goodwin, Haigh, Rohling and Slangen2017) for the North Sea, which may result in an increase in coastal flooding.
In this paper, we investigate the geomorphological onshore response and hydrodynamic conditions associated with the 1717 Christmas flood in the Province of Groningen (Netherlands; Fig. 1A). The 1717 Christmas flood is one of the most catastrophic storm surges the Frisian coast has ever experienced (Buisman, Reference Buisman1984, Reference Buisman2006; Lamb, Reference Lamb2005). With more than 13,700 casualties in the Netherlands, Germany and Denmark it is the last severe storm surge with a death toll of this order (e.g. Sundberg, Reference Sundberg2015). At the same time, little is known about the hydro- and morphodynamic processes of this storm surge (Hekelius Reference Hekelius1719; Jakubowski-Tiessen, Reference Jakubowski-Tiessen1992; Hagen, Reference Hagen and Ohlig2005a,b; Meier, Reference Meier2011; Lindemann, Reference Lindemann2017), making it particularly worth investigating.
In the Netherlands, the Province of Groningen was particularly badly affected by the 1717 Christmas flood (Section 2). The area suffered vast flooding and numerous dyke failures, which are well documented (Hacquebord & Hempenius, Reference Hacquebord and Hempenius1990; Nienhuis, Reference Nienhuis2017) and often are still visible in the field in the form of erosional pothole (scour) structures and fan deposits further inland. These geomorphological structures witness the intense hydrodynamic processes during dyke failures such as flow convergence in the area of the breaking dyke (sediment erosion) and flow divergence landwards of the dyke (sediment deposition). Therefore, the dyke failures in the Province of Groningen provide an excellent opportunity to gain insight into the geomorphological onshore response and associated hydrodynamic processes of the 1717 Christmas flood in the dyke area and its surroundings.
In this study, we (i) present a concise overview of the chronology and main features of the Christmas flood relevant to the current investigation (Section 2), (ii) reconstruct the course of the 1717 dykes in the Province of Groningen and (iii) determine dyke failure locations associated with the Christmas flood based on historical maps, literature as well as lidar data (Section 4.1). In Section 4.2, we (iv) present sedimentary field evidence of three major dyke failures in the Province of Groningen. Section 4.3 deals (v) with the results of hydro- and morphodynamic numerical simulations of the dyke failure detected at one of the three fieldwork sites, i.e. the village of Wierhuizen. Subsequently, (vi) the dyke failures as reconstructed based on the literature and lidar data are compared and synthesised with the field data and the outcomes of the numerical simulations (Section 5) in order to (vii) draw conclusions (Section 6) on the maximum water levels, the flooding dynamics and the geomorphological response associated with the dyke failures during the 1717 Christmas flood.
2 The 1717 Christmas flood
Numerous historical reports and more recent publications describe the chronology, features and consequences of the 1717 Christmas flood (e.g. Hekelius, Reference Hekelius1719; Lang, Reference Lang1963; Buisman, Reference Buisman1984, Reference Buisman2006; Jakubowski-Tiessen, Reference Jakubowski-Tiessen1992; Hagen, Reference Hagen and Ohlig2005a,b; Lamb, Reference Lamb2005; Meier, Reference Meier2011; Sundberg, Reference Sundberg2015; Lindemann, Reference Lindemann2017). Based on this literature, this section gives a concise overview of the main features of the Christmas flood relevant to the current study.
The 1717 Christmas flood was caused by an extratropical cyclone originating from the North Atlantic Ocean near Greenland passing the North Sea on 24 and 25 December 1717. Following a longer period of southwesterly weather conditions earlier in December that year, hurricane-like northwesterly winds hit the Frisian coast on the evening of 24 December 1717 with the arrival of the cyclone, which was one week before spring tide. While the high-tide water level on the evening of 24 December was slightly above expected, the lasting northwesterly winds caused the following low tide around midnight to reach the mean high tide level. The peak of the storm coincided with the following high tide in the early morning hours of 25 December 1717, resulting in an abrupt increase in water levels and extensive overflowing and failures of the dykes. Because the storm surge occurred in the dark and most people were sleeping, dyke failures were not fixed and the flooding continued unhindered. On the afternoon of 25 December 1717, the wind lost strength; however, the storm and the flooding lasted two more days.
The storm surge affected the entire southeastern North Sea coast, starting in the northern Netherlands, then moving to the German Bight and finally to southern Denmark. The copperplate print by Homann (Reference Homann1718) in Figure 1B shows the extensive flooding (area shaded in grey) associated with the 1717 Christmas flood (cf. Lang, Reference Lang1963; Houben, Reference Houben2018). Despite some inaccuracies (e.g. the Frisian islands are not grey shaded but are known to have suffered severe flooding) and the fact that the map basis used by Homann (Reference Homann1718) contains several errors, the illustrated flooding extent is believed to be reliable (Lang, Reference Lang1963; Houben, Reference Houben2018). Besides this map, several contemporary paintings show the dramatic flooding of the Frisian coast (Fig. 1C) including illustrations of numerous dyke failures reported by eyewitnesses (Fig. 1C, D).
The majority of victims of the 1717 Christmas flood were reported from Germany (c.9,000; Jakubowski-Tiessen, Reference Jakubowski-Tiessen1992) and the northern Netherlands (c.2,500; Buisman, Reference Buisman2006; Sundberg, Reference Sundberg2015), in particular the Province of Groningen, i.e. the study area in this paper. These death tolls do not count many more who fell victim to later consequences of the flood such as disease (e.g. tertian malaria) and starvation, the latter being related to the huge number of cattle, horses, sheep and pigs that drowned during the Christmas flood (more than 100,000 in total; Jakubowski-Tiessen, Reference Jakubowski-Tiessen1992; FWU, 2019).
Storm surge water levels associated with the 1717 Christmas flood are known for only a few locations along the entire Frisian coast. The nearest location to the Province of Groningen is the city of Emden on the Dutch–German border with a reported water level of 4.62 m NAP (Normaal Amsterdams Peil ≈ mean sea level), which is the fifth highest water level ever recorded at Emden (absolute maximum: almost 5.20 m NAP on 13 March 1906 and on 1 November 2006; Rohde, Reference Rohde1977; van Malde, Reference van Malde2003; Hagen, Reference Hagen2005b; BAW, 2007; Lindemann, Reference Lindemann2017). A slightly higher storm surge level of 4.89 m NAP during the Christmas flood is documented for the village of Dangast situated in the German Jade Bight (Erchinger & Stromann, Reference Erchinger and Stromann2004), while the maximum storm surge level of 3.10 m NAP reported for Egmond aan Zee (c.33 km to the northwest of Amsterdam) is significantly lower (van Malde, Reference van Malde2003). This implies an increase in storm surge levels of the 1717 Christmas flood from the west to the east (cf. Jakubowski-Tiessen, Reference Jakubowski-Tiessen1992).
3 Methodology
3.1 Determination of the 1717 dyke and dyke failures
The Province of Groningen is characterised by numerous historical impoldering phases associated with frequent shifts of the dyke line in a seaward direction. The course of the abandoned dykes is well documented in historical maps (Vredenberg-Alink, Reference Vredenberg-Alink1974; Hacquebord & Hempenius, Reference Hacquebord and Hempenius1990; Schroor, Reference Schroor2003; Wijk, Reference Wijk2006; Nienhuis, Reference Nienhuis2017) and is still visible in the topography, including the dyke which was in use at the time of the 1717 Christmas flood. In most places, this 1717 dyke was not in use during severe storm surges occurring before the Christmas flood and it was replaced by a new dyke located further seawards immediately after the Christmas flood (Vredenberg-Alink, Reference Vredenberg-Alink1974; Hacquebord & Hempenius, Reference Hacquebord and Hempenius1990; Schroor, Reference Schroor2003; Wijk, Reference Wijk2006; Nienhuis, Reference Nienhuis2017). This, together with written accounts, allowed a reliable identification of numerous dyke failure locations in the Province of Groningen that are associated with the 1717 Christmas flood. Besides the information given by Hacquebord & Hempenius (Reference Hacquebord and Hempenius1990) and Nienhuis (Reference Nienhuis2017), the dyke failure locations were identified based on typical morphological features which are associated with dyke breaching and – more than 300 years later – are still visible in the recent topography of the study area. Such features include pothole structures in the form of dry or water-filled potholes in the area where the dyke has breached, caused by flow convergence and associated erosion, and higher-elevation areas landwards of the dyke where eroded material has been deposited in the form of sediment fans, caused by flow divergence. Pothole structures and sediment fans were first identified based on the analysis of a high-resolution digital elevation model (DEM) derived from lidar data (resolution 0.5 m by 0.5 m; AHN, 2009) and subsequently evaluated during preparatory field surveys. For each dyke failure location, a detailed topographic map was created illustrating the reconstructed course of the 1717 dyke and of older/younger dykes as well as the outline of the pothole structures and sediment fans as derived from the topography in the DEM and from the field surveys.
3.2 Field methods and laboratory analyses
Geomorphological field surveys and mapping were performed at all identified dyke failure locations. Extensive fieldwork was carried out at three selected sites spread over the Province of Groningen. The fieldwork included vibracoring and various geophysical prospection methods focusing on the area of the pothole structures and especially of the fan deposits. In a first step, electrical resistivity tomography (ERT) measurements by means of a Syscal R1 plus Switch 48 multi-electrode system (Iris instruments) were conducted in order to determine appropriate vibracoring sites (for further details on the ERT method see Hecht, Reference Hecht and Wagner2007). For this, Wenner–Schlumberger arrays were measured with 0.25 m, 0.5 m and 1 m electrode spacings resulting in maximum prospection depths of c.1.4 m, 2.8 m and 5.5 m, respectively. ERT data were post-processed using the RES2DINV software tool.
Based on a preliminary analysis of the ERT measurements in the field, vibracoring was performed at selected sites along the ERT transects by means of an automotive Nordmeyer RS 0/2.3 drilling rig and a handheld engine-powered Atlas Copco coring device (type Cobra mk1). We used 80 mm, 60 mm and 50 mm core diameters for gouge augers and 60 mm core diameter for a closed steel auger system based on plastic inliners. The maximum core depth was 6 m below ground surface (m b.s.). All vibracores were documented by digital photographs and described regarding their sedimentary features, such as grain size, texture, colour, fossil content and pedogenetic properties (cf. Ad Hoc-AG Boden, 2005). Based on samples taken from all stratigraphic units of each vibracore, grain-size analyses were conducted in the laboratory using the sieving and pipette method according to Köhn (Reference Köhn1929) and Barsch et al. (Reference Barsch, Billwitz and Bork2000).
At all vibracoring sites, direct push cone penetration tests (DP CPTs) by means of a Geotech probe NOVA were carried out during which the tip resistance, the pore pressure and the local friction were measured at a vertical resolution of the order of 1 mm. The three measured parameters mainly depend on the solidity, the grain size and the water saturation of the subsurface and allow a detailed determination of the sediment stratigraphy (Missiaen et al., Reference Missiaen, Verhegge, Heirman and Crombé2015; Obrocki et al., Reference Obrocki, Vött, Wilken, Fischer, Willershäuser, Koster, Lang, Papanikolaou, Rabbel and Reicherter2020). Finally, the exact location and elevation of all vibracoring/direct-push sites and ERT transects were measured using a Topcon DGPS-device (type HiPer Pro FC-250) with a horizontal and vertical resolution c.2 cm.
3.3 Numerical model set-up
For the environs of the village of Wierhuizen (Fig. 3, further below), where detailed fieldwork was performed, we created a process-based hydro- and morphodynamic numerical model in order to gain more insight into the local flooding dynamics and the geomorphological response associated with the dyke failure during the 1717 Christmas flood. Besides a better quantification of the flooding dynamics (such as maximum water levels, flow velocities etc.) and sedimentary processes (such as extent and amount of erosion/deposition) in the sampling area, the model provides valuable information on the hydro- and morphodynamic processes in the surroundings as well.
The numerical model was created using the D-Flow FM module of the Delft3D Flexible Mesh modelling suite developed by Deltares (2020). The D-Flow FM module is a multidimensional (1-D, 2-D, 3-D) simulation program. It solves the non-linear shallow water equations of unsteady flow and transport phenomena based on the Navier–Stokes equations for incompressible free surface flow (Deltares, 2020). D-Flow FM is designed for flow phenomena where the horizontal spatial and temporal scales are considerably larger than the vertical scales, such as storm surges, flood waves, tsunamis or tidal waves. In the case of Wierhuizen, we applied a 2-D, i.e. depth-averaged, model taking account of all the relevant hydro- and morphodynamic processes during the dyke failure.
The model domain/computational mesh covers the wider surroundings of Wierhuizen with a W–E extent of c.4600 m and a N–S extent of c.6300 m (Fig. 2). The mesh is generally based on rectangular cells and uses triangular cells to connect areas of different resolutions. The mesh resolution amounts to 100 m by 100 m in the offshore and inland part and increases stepwise to a maximum 10 m by 10 m in the wider area of dyke failure. An even finer mesh resolution of 1 m by 1 m did not significantly change the simulated erosion and sedimentation and was therefore not applied in the final simulations. In total, the mesh comprises 16,479 computational cells.
Computational mesh of the process-based hydro- and morphodynamic Delft3D Flexible Mesh model created for the study area of Wierhuizen (for the location see Fig. 3). The white/black dashed lines in the north mark the hydrodynamic offshore boundaries of the model.

For the initial bed level of the model (i.e. the bed level before the dyke failure occurred), we removed all detected geomorphological features associated with the dyke failure (in particular, pothole structures, fan deposits) and dykes younger than the 1717 dyke from the recent DEM of the study area (AHN, 2009). Furthermore, the bed was smoothed and adjusted in order to have a realistic ratio between the contemporary elevations seawards (0.5 m NAP) and landwards (1 m NAP) of the 1717 dyke. Finally, the 1717 dyke with its reconstructed course (Section 3.1) and original dimensions (c.45 m wide and 4.5 m NAP high; Lindemann, Reference Lindemann2017; Nienhuis, Reference Nienhuis2017) was added to the bed. In the area of the three breaches indicated in Figure 4 (further below), the dyke was removed from the initial bed level, resulting in an absolute bed level at the dyke failures of c.0.8 m NAP. This was done since, in this approach, the dyke-breaching process itself is not simulated. Instead, the simulation starts immediately after the dyke has breached.
Based on the sediment transport formulations by van Rijn (Reference van Rijn1993) for non-cohesive sediment and by Partheniades (Reference Partheniades1965) for cohesive sediment, the model takes account of the two dominant sediment fractions in the study area, i.e. fine sand (Ø = 0.125 mm, treated as non-cohesive sediment by the model) and mud (Ø < 0.063 mm, treated as cohesive sediment by the model). While the 1717 dyke is purely made up of mud in the model, the subsurface in the remaining model domain consists of 60% fine sand and 40% mud, which, in terms of the volume ratio is consistent with vibracore data from the study area (Section 4.2).
The model is forced along the three offshore boundaries indicated in Figure 2. The hydrodynamic boundary conditions are defined in the form of a water level time series based on the regional tidal curve and on three different maximum water levels, i.e. 4 m, 5 m and 6 m NAP, which scatter around the maximum water level of 4.62 m NAP recorded at Emden during the Christmas flood (Rohde, Reference Rohde1977; van Malde, Reference van Malde2003; Hagen, Reference Hagen2005b; Lindemann, Reference Lindemann2017; Section 2). These values were chosen in order to test the model’s sensitivity of the maximum water level with respect to the sedimentary response in the dyke failure area. The maximum water levels of 4 m, 5 m and 6 m NAP were reached three times in the model during three simulated tidal cycles to study the effects of multiple inundation phases on the erosion/sedimentation patterns. This was done particularly because historical reports mention that the dykes in Groningen were overflowed during high tide on the night of 25 December 1717 and again during the following two high tides (e.g. Hekelius, Reference Hekelius1719; Lang, Reference Lang1963; Buisman, Reference Buisman1984, Reference Buisman2006; Lindemann, Reference Lindemann2017).
All simulations start at 0 a.m. on 25 December 1717 and run for 36 h (three tidal cycles). During the simulation, the bed level in the model is permanently updated according to the computed sediment transport and associated erosion and sedimentation. According to the sparsely vegetated study area, we employ a uniform Manning’s n roughness coefficient of 0.03 s m−⅓.
4 Results
4.1 The 1717 dyke and dyke failures
Figure 3 shows the DEM of the Province of Groningen including the reconstructed course of the 1717 main and secondary dykes (white lines) and potential dyke failures (red dots) associated with the devastating Christmas flood of 1717. Several abandoned dyke lines resulting from various impoldering phases are still visible in the recent topography (see coast-parallel contours in brown colour). This together with historical maps (Vredenberg-Alink, Reference Vredenberg-Alink1974; Hacquebord & Hempenius, Reference Hacquebord and Hempenius1990; Schroor, Reference Schroor2003; Wijk, Reference Wijk2006; Nienhuis, Reference Nienhuis2017) allowed a detailed and reliable reconstruction of the dyke line that was in use at the time of the 1717 Christmas flood as well as of older and younger dyke lines. In areas where historical maps are less precise and dyke remains are more sporadic, the 1717 dyke line is labelled as likely (white dashed line), although the reconstructed course is still accurate enough for the purpose of this study.
DEM (resolution: 0.5 m by 0.5 m) based on lidar data (AHN, 2009) of the Province of Groningen (Netherlands; for the location see Fig. 1A) including the reconstructed course of the dyke (solid and dashed white line) and potential dyke failures (red dots) associated with the devastating Christmas flood of 1717. See Section 3.1 for the methodology of the reconstruction of the dyke and dyke failure locations.
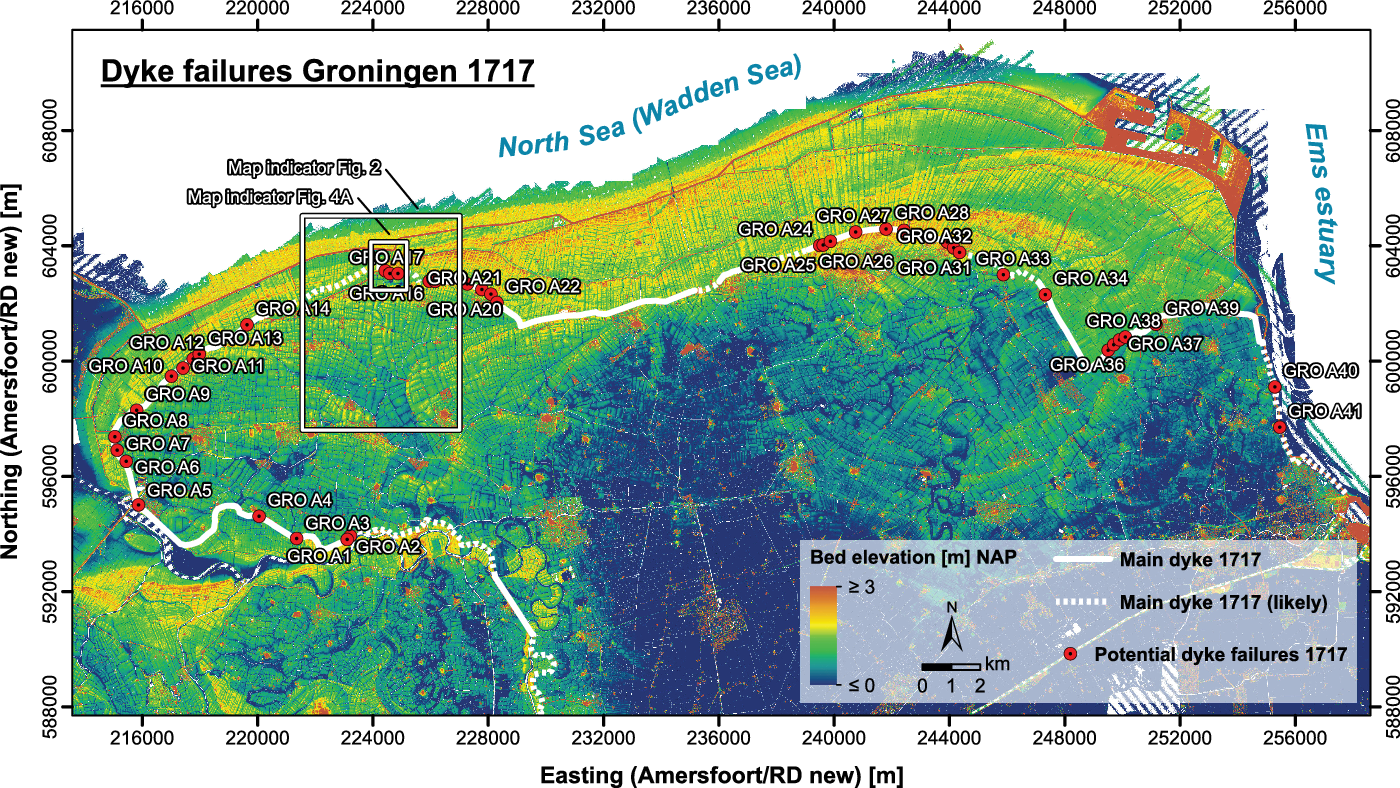
Based on the dyke failure locations described by Hacquebord & Hempenius (Reference Hacquebord and Hempenius1990) and Nienhuis (Reference Nienhuis2017) as well as on the analysis of the DEM and the field surveys in search of pothole structures and sediment fans (cf. Section 3.1), a total of 41 dyke failure locations and corresponding sediment fans were identified in the Province of Groningen (Fig. 3). Most of these locations are situated in the western and eastern part of the province and concentrate in the vicinity of villages that already existed in 1717. This might be related to the fact that dyke failures were probably better documented in more inhabited areas with more people being present.
Figure 4A shows a detailed topographic map of the dyke failure locations (GRO A15–A17) identified north of the village of Wierhuizen in northwestern Groningen (Fig. 3), which is one of the three sites where comprehensive fieldwork was carried out. According to Hacquebord & Hempenius (Reference Hacquebord and Hempenius1990) and Nienhuis (Reference Nienhuis2017) as well as an information panel in the field, the site is known to have experienced major dyke failures during the 1717 Christmas flood. These are indicated by three pothole structures in the form of local (dry) depressions (low elevations displayed in blue; red outline) in the area of the 1717 dyke as well as by raised elevation areas landwards of the dyke (displayed in green to yellow; white dashed outline) representing the potential fan deposits. The largest, westernmost pothole structure is c.170 m wide and shows a minimum elevation of c.−0.3 m NAP, which is more than 1 m deeper than the immediate surroundings (Fig. 4B). The associated potential sediment fan shows a maximum landward extent of c.260 m and a maximum elevation of almost 1.40 m NAP, i.e. c.0.5 m higher than the immediate landward surroundings.
DEM based on lidar data (AHN, 2009) of Wierhuizen located in the northwestern Province of Groningen (Netherlands; for location see Fig. 3). The figure shows the course of the Oude dijk (main dyke until 1717), Middendijk (main dyke as of 1718) and De Waker (recent main dyke) as well as the areas of the 1717 dyke failures (GRO A15–A17), pothole structures and related fan deposits as derived from the recent topography. Fieldwork was performed in the area of the largest, westernmost dyke failure along a NNE–SSW running transect. The fieldwork included vibracoring, direct push (DP) and electrical resistivity tomography (ERT) measurements, the locations of which are illustrated in the figure.

Comparable dimensions of the pothole structure and the related sediment fan observed north of Wierhuizen were also found for most of the other identified dyke failure locations displayed in Figure 3, including the two other fieldwork sites in the Province of Groningen, i.e. the village of Vierhuizen in the far west of the province (dyke failure location GRO A8) and the village of Kohol (dyke failure location GRO A34) in the east of the province. Also for these locations, there is historical evidence of major dyke failures during the 1717 Christmas flood (Hacquebord & Hempenius, Reference Hacquebord and Hempenius1990; Nienhuis, Reference Nienhuis2017). At both locations, Vierhuizen and Kohol, significant pothole structures (c. 150 m to 200 m wide, respectively) and associated potential sediment fans (each reaching almost 300 m inland) are still visible in the topography. The approximate elevation difference between the highest parts of the identified sediment fans and the surroundings is of the order of 0.5 m.
4.2 Field evidence
In this paper, we present detailed field data collected at the above-described westernmost dyke failure location at Wierhuizen (Fig. 4). Fieldwork was performed along a NNE–SSW running transect, which is the assumed direction of flooding (≈ rectangular to the dyke line). Altogether, four vibracores (2 m to 6 m deep), six geoelectrical tomograms (electrode spacings of 0.25 m, 0.5 m and 1 m) and one DP CPT (3 m deep) were taken, most of them in the area of the potential sediment fan, which is currently used for the cultivation of potatoes.
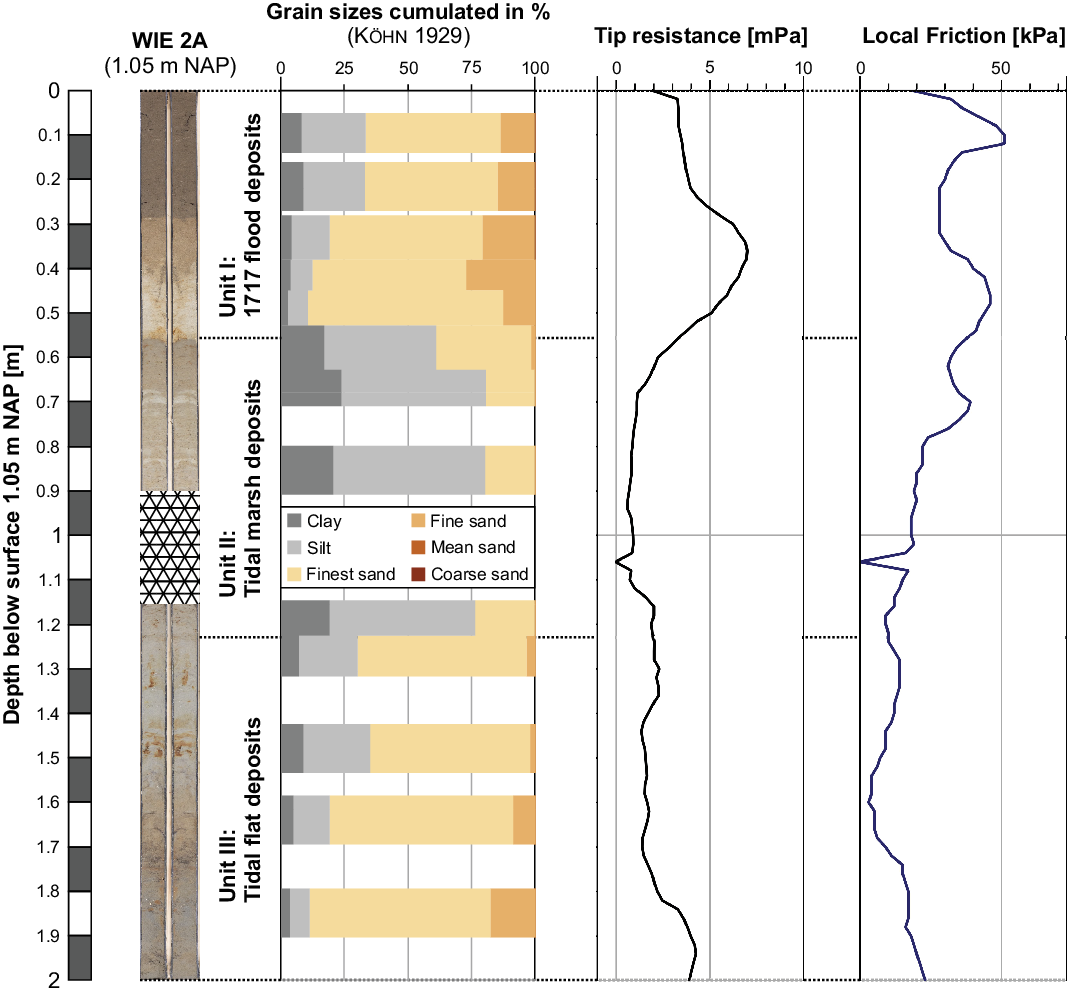
Figure 5 shows the photograph, the stratigraphy and the grain-size distribution of the vibracore as well as the results of the DP CPT at sampling location WIE 2A (1.05 m NAP), which is situated in the assumed centre of the potential sediment fan. The base of core WIE 2A (Unit 1; 2 m to 1.23 m b.s.) is made up of grey silty fine sand (i.e. finest sand and fine sand, here and in the following referred to as fine sand; see comment in the caption of Fig. 5) with a low clay content, and shows several iron concretions and shell fragments. Within this layer, the fine sand content decreases in an upward direction, while the silt and clay contents increase. This is reflected by the measured tip resistance and local friction of the DP CPT both showing decreasing values towards the top of the layer, indicating a decrease in the average grain size. This trend continues in the following stratigraphic unit (Unit 2; 1.23 m to 0.70 m b.s.), which consists of brownish-grey clayey silt containing numerous thin layers of silty fine sand and iron concretions. The fine grain size in this unit is clearly indicated by the low values measured for the tip resistance (absolute minimum in the whole profile). Divided by a distinct erosional contact, the uppermost layer (Unit 3; 0.56 m to ground surface) is characterised by a sudden increase in grain size in the form of a brownish light silty fine sand with a low clay content. The abrupt change from finer to coarse sediment is reflected by a significant increase in the tip resistance and local friction. Within the uppermost layer, a slight fining-upward trend can be observed. The homogeneous texture of the upper c.0.30 m indicates ploughing activities related to the cultivation of the field. This observation agrees with the ploughing depth of c.0.30 m stated by the owner of the field.
Photograph, grain-size distribution according to Köhn (Reference Köhn1929) and results of the direct push cone penetration test (tip resistance and local friction) as well as interpreted stratigraphy of vibracore WIE 2A (1.05 m NAP; for the location see Fig. 4). The vibracore shows three clear stratigraphic units, i.e. tidal flat deposits at the base, tidal marsh deposits and, at the top, coarser-grained 1717 flood deposits. The grain-size classes are based on the following equivalent diameters: Ø < 0.002 mm (clay), 0.002 mm ≤ Ø < 0.063 mm (silt), 0.063 mm ≤ Ø < 0.125 mm (finest sand), 0.125 mm ≤ Ø < 0.2 mm (fine sand), 0.2 mm ≤ Ø < 0.63 mm (mean sand), 0.63 mm ≤ Ø < 2 mm (coarse sand). The grain-size classes finest sand and fine sand are referred to as fine sand (0.063 mm ≤ Ø < 0.2 mm) in the text, which corresponds to the grain size applied in the numerical model for fine sand Ø = 0.125 mm).
Similar to the stratigraphy of vibracore WIE 2A, vibracores WIE 1 (coring depth 6 m), WIE 3 (coring depth 2 m) and WIE 4 (coring depth 3 m), situated at the landward/seaward margins of the potential fan/in the centre of the pothole respectively (Fig. 4), also show a silty fine sand with a low clay content at the base, followed by clayey silt containing thin layers of silty fine sand. The uppermost layer found at WIE 2A, i.e. silty fine sand with a low clay content and an erosional contact at the base, is significantly thinner at WIE 1 (c.0.2 m) and almost absent at WIE 3 while completely missing at WIE 4 situated in the inner pothole.
Figure 6 shows three geoelectrical tomograms measured across sampling locations WIE 2A (WIE ERT 6, electrode spacings 0.25 m; WIE ERT 2, electrode spacings 1 m) and WIE 1 (WIE ERT 1, electrode spacings 1 m). In all tomograms, the tidal marsh and mudflat deposits are characterised by relatively low specific electrical resistivity values (c.<50 Ωm) and thereby stand in clear contrast to the higher resistivity (c.>50 Ωm) of the uppermost coarser-grained layer. The tomograms corroborate that the coarser deposits found at the top of profiles WIE 2A, WIE 1 and WIE 3 form a continuous layer which has its maximum thickness around sampling location WIE 2A and thins out towards sampling locations WIE 1 and WIE 3.
Electrical resistivity tomograms measured across the potential sediment fan located landwards of the largest, westernmost dyke failure detected to the north of Wierhuizen (for the location see Fig. 4). Tomograms WIE ERT 6 (electrode spacings 0.25 m) and WIE ERT2 (electrode spacings 1 m) were measured across sampling location WIE 2A in the centre of the fan, tomogram WIE ERT 1 (electrode spacings 1 m) across sampling location WIE 1 at the southern margin of the fan. The tomograms clearly indicate the 1717 flood deposits as a zone of higher electrical resistivity values in contrast to the underlying in situ tidal marsh and tidal flat deposits.

The field findings from the study area north of Wierhuizen (dyke failure locations GRO A15–A17) are representative for the two other fieldwork sites in the Province of Groningen, i.e. the village of Vierhuizen (dyke failure location GRO A8) and the village of Kohol (dyke failure location GRO A34; Fig. 3). For both Vierhuizen and Kohol, the vibracore stratigraphies in the areas of the assumed sediment fans show in situ sediments at the base, covered by coarser-grained fine sandy deposits with a maximum thickness of 0.5 m and 0.7 m, respectively. Neighbouring vibracores and ERT data imply a thinning of these deposits towards the margins of the assumed sediment fans.
4.3 Numerical simulations
Aside from multiple calibration runs, a set of three final simulations were analysed regarding the simulated hydrodynamics and simulated erosion–sedimentation patterns and were evaluated based on the comparison with the field findings presented in Sections 4.1 and 4.2. The three different maximum water levels turned out to have a significant impact on the simulated hydro- and morphodynamics in the study area. While a maximum water level of 4 m NAP resulted in a simulated pothole structure and sediment fan clearly smaller than indicated in Figure 4, the extent of both features was too large in the model in the case of a maximum water level of 6 m NAP. Figure 7 shows the results of the scenario with a maximum water level of 5 m NAP. As further discussed in Section 5, for this scenario the best agreement was found between the simulated erosion–sedimentation pattern and the pothole structure and sediment fan as indicated by the topography (Section 4.1) and by the field data (Section 4.2). During each high tide of the three tidal cycles in this scenario, the simulated water level at sampling location WIE 2A reaches almost 5 m NAP (Fig. 7A), which corresponds to the maximum water level of 5 m NAP seawards of the dyke. The resulting maximum inundation depth at WIE 2A (elevation 1.05 m NAP) amounts to c.4 m. The maximum depth-averaged flow velocity of c.3 m s −1 is reached at the beginning of the simulation during the first inflow of the seawater through the dyke failure (25 December 1717 02:50; Fig. 7B). Subsequently, a much smaller velocity peak of c.0.6 m s −1 (c.1.1 m s −1 at sampling location WIE 4 in the inner pothole) can be observed during the backflow of the water in a seaward direction (25 December 1717 10:00). During the following two tidal cycles, the inflow velocities are significantly smaller (up to 1.25 m s −1) compared to the first inflow, while the backflow velocities are of the same order as during the first backflow.
Results of the hydro- and morphodynamic numerical simulation approach for the study area of Wierhuizen in northwestern Groningen (for the location see Figs 3, 4). (A) The simulated inundation depth at sampling location WIE 2A (25 December 1717 00:00 to 26 December 1717 12:00); (B) the simulated depth-averaged flow velocity magnitude at sampling location WIE 2A (25 December 1717 00:00 to 26 December 1717 12:00); (C) the simulated maximum depth-averaged flow velocity magnitudes and associated flow vectors (25 December 1717 02:50) in the area of the investigated pothole and assumed sediment fan; and (D) the simulated cumulative erosion and sedimentation after the first tidal cycle (25 December 1717 12:30) for the scenario with a maximum water level of 5 m NAP and with three tidal cycles. (C) and (D) further illustrate the reconstructed courses of the ‘Oude dijk’ (the 1717 main dyke) and the ‘Middendijk’ (the post-1717 main dyke) as well as the sampling and ERT locations (for further details see the legend of Fig. 4A).

Figure 7C shows the depth-averaged flow velocity magnitudes and corresponding flow vectors for the study area during the first inflow of seawater when the maximum flow velocities occur (25 December 1717 02:50). The flow field is characterised by a strong funnelling and increase in velocities (up to 4 m s −1) in the area of the dyke failure which forms a significant bottleneck for the inflowing seawater and strong flow convergence. Landwards of the dyke failure, the flow velocities continuously decrease in the zone of the flow divergence to values between 2 m s −1 and 1.5 m s −1 at the margins of the assumed sediment fan. A similar flow field and associated flow velocities can be observed for the neighbouring dyke failure located further eastwards, although the flow field shows a more elongated shape caused by the smaller diameter of this dyke failure.
Due to the pronounced flow convergence and divergence, strong erosion and sedimentation can be observed in the wider area of the dyke failure in the numerical model. Generally, the simulated erosion and sedimentation after the first tidal cycle (25 December 1717 12:30; illustrated in Fig. 7D) is almost identical to the final simulated erosion and sedimentation, i.e. at the end of the simulation after three tidal cycles. Consequently, the morphodynamics are most intense during the first inflow of the seawater during the absolute peak in flow velocities (see above). As a direct result of the large flow velocities of up to 4 m s −1 in the convergence zone, the area of the dyke failure (c. 170 m wide) is characterised by significant erosion by more than 2 m. The erosion zone approximately coincides with the extent of the pothole structure as derived from the topography (see red outline), while the simulated depth of the pothole is larger than found in the present topography. Further landwards, the erosion zone abruptly stops and a fan-shaped area of sedimentation associated with flow divergence can be observed. The sedimentation area is a maximum of 400 m wide and shows a maximum landward extent similar to that of the assumed sediment fan (see black dashed outline). The maximum sedimentation amounts to almost 0.6 m in the central part of the fan, where sampling location WIE 2A is also situated. At this location, the deposited sediment in the model consists of c.94% fine sand (Ø = 0.125 mm) and 6% mud (Ø < 0.063 mm), which is representative for the sedimentary composition of the entire sediment fan although the mud content slightly increases towards the landward margins of the fan. The model indicates that the fan deposits mostly originate from the erosion zone of the pothole. As is the case for the flow field, the erosion–sedimentation pattern also looks similar at the neighbouring dyke failure located further eastwards, although more elongated.
5 Discussion
Based on (i) the sedimentary features of the stratigraphic units of the vibracore profiles and geoelectrical tomograms (Section 4.2), (ii) the general geographical setting of the fieldwork site and (iii) the pothole/fan structure indicated by the topography (Section 4.1), three distinct sedimentary environments were derived for the area (see corresponding labels in the profile of WIE 2A in Fig. 5 and in the geoelectrical tomograms in Fig. 6):
-
Unit 1: The lowermost layer, made up of silty fine sand with a low clay content and several shell fragments (present in all vibracore profiles), points to mid-energy conditions in a mudflat environment at the time before the area was impoldered and was still part of the Wadden Sea tidal flats.
-
Unit 2: The fining-upward trend observed in Unit 1 and the even finer grain sizes in the covering Unit 2 (clayey silt; also present in all vibracore profiles), in which macroscopic shell fragments are no longer present, imply a continuous decrease of the energetic conditions and marine influence. This indicates a change from a tidal flat to a tidal marsh sedimentary environment related to a retreat of the local coastline. Sporadic flooding of the tidal marsh environment is reflected by the numerous thin layers of silty fine sand intersecting the second stratigraphic unit.
-
Unit 3: Subsequent to the mid- to low-energy facies of Unit 1 and Unit 2, the erosional contact and abrupt increase in grain size in the uppermost layer point to a sudden change towards a high-energy environment. The observations that (i) an abrupt change towards high-energy conditions occurs from Unit 2 to Unit 3 (in contrast to the gradual change from the mudflat to tidal marsh environment), that (ii) the uppermost layer shows its maximum thickness in profile WIE 2A (located in the centre of the assumed sediment fan as indicated by the topography), but is thinner in profiles WIE 1 and WIE 3 (situated at the margins of the assumed fan) and is absent inside the pothole (WIE 4), and that (iii) the investigated dyke failure can directly be ascribed to the 1717 Christmas flood (Section 4.1) lead to the conclusion that the uppermost layer reflects fan sediments deposited in the zone of flow divergence during the 1717 Christmas flood when the dyke breached. The 1717 fan deposits form the uppermost layer at sampling sites WIE 2A, WIE 1 and WIE 3 because the new Middendijk replaced the former Oude dijk in 1718 and there are neither reports nor evidence in the topography and stratigraphy that document flooding of the area during storm floods after 1717. The increasing clay and mud content in the upper part of the fan deposits, which forms a plough horizon, can be explained by weathering processes and the enrichment by organic matter since 1717.
The dimensions of the sediment fan as derived from the field data (Figs 5, 6) show a close agreement with the dimensions indicated by the topography (Fig. 4). In particular, the maximum fan thickness of 0.56 m recorded in vibracore WIE 2A coincides with the elevation difference (i.e. the assumed maximum fan thickness) between the highest, central part of the assumed sediment fan and the surroundings of c.0.5 m. Furthermore, sampling locations WIE 1 and WIE 3 as well as ERT data imply a significant thinning of the fan deposits towards the assumed margins of the fan and by this point to a comparable inland extent of the fan of almost 260 m as indicated by the topography. Similar observations were made for the two other field study sites Vierhuizen and Kohol. At both locations, in situ mudflat and tidal marsh deposits are covered by coarser-grained fan deposits, which show a thickness of between 0.5 m and 0.7 m in the central part and thin out towards the margins of the assumed sediment fans reaching c. 300 m inland. Fan thicknesses of the same order (c.0.5 m) are implied by the elevation differences in the present topography between the highest parts of the identified sediment fans and the surroundings. All in all, the pothole structures and associated sediment fans detected at the three fieldwork sites therefore show similar dimensions.
The numerical simulation results corroborate the findings derived from the analysis of the topography and field data of the dyke failure location north of Wierhuizen. As was demonstrated in Section 4.3, a flood with a maximum water level of 5 m NAP results in a simulated erosion–sedimentation pattern in excellent accordance with the pothole and sediment fan as reconstructed based on the topography and field data (cf. Fig. 7D). In this scenario, the maximum thickness of the sediment fan is predicted for the same area within the fan as is documented by sedimentary evidence at site WIE 2A, ERT data and the relative peak in land elevations in the topography. Furthermore, the absolute thickness of the fan predicted by the model (0.6 m) closely agrees with the thickness of the fan deposits detected at site WIE 2A (0.56 m) and the thickness derived from the elevation differences between the highest parts of the assumed fan and the surroundings (c. 0.5 m). A similar good match is observed for sampling location WIE 1, where the predicted fan thickness is 0.25 m and the thickness of the fan deposits detected in the vibracore amounts to 0.2 m. At sampling location WIE 3, a very thin layer of fan deposits is documented in the vibracore, while the model predicts slight erosion for this area. However, since sampling location WIE 3 is located at the southwesternmost margin of the predicted erosion zone and the model predicts sedimentation just 20 m further south-southwest, this is considered as a small discrepancy between field data and simulation results.
Besides the thickness of the fan, the extent of the simulated sediment fan also closely agrees with the extent derived from the topography and field data, although the model predicts a more regular shape of the fan than indicated by the topography. This might be related to later reworking and a redistribution of the fan sediments, particularly in connection with ploughing activities. Finally, the extent of the simulated pothole structure also shows a close match with the extent derived from the topography, although the predicted maximum erosion of c.2 m implies a larger depression compared to the surroundings than indicated by the recent topography (c.1 m). Also this mismatch might be related to ploughing of the field and associated filling of the depression.
The numerical model indicates that the fan deposits consist of more than 94% fine sand and mainly originate from the erosion zone of the pothole. This is in line with the sediment stratigraphies observed at the four sampling locations (in particular at sampling location WIE 1 taken inside the pothole), showing that a considerable volume of fine sand, especially in the form of the tidal flat deposits, is available for erosion. Consequently, the fan deposits mainly consist of the fine sandy tidal flat and tidal marsh sediments eroded in the area of the pothole.
Neither the topography nor the numerical simulation results indicate the presence of a sediment fan on the seaward site of the dyke failure in the area of flow divergence of the backflow (cf. Figs 4, 7D). The absence of a sediment fan in this area is related to the relatively small flow velocities of maximum 1.1 m s −1 observed in the model during the backflow. The discrepancy between the large inflow velocities and relatively small outflow velocities can be explained by the fact that the area of the dyke failure is strongly eroded during the inflow which widens the cross section of the dyke failure for the subsequent outflows and inflows. Moreover, even during low tide, the water levels seawards of the dyke do not drop under 1m NAP, resulting in a smaller water level gradient than at the time of the inflow. The larger cross section of the dyke failure and the smaller water level gradient after the first inflow further explain why both the pothole structure and the associated sediment fan are mainly formed during the first inflow of the seawater but hardly reshaped during the subsequent in- and outflow.
6 Conclusions
The 1717 Christmas flood is one of the most catastrophic storm surges the Frisian coast has ever experienced. With more than 13,700 casualties in the Netherlands, Germany and Denmark, it is the last severe storm surge with a death toll of this order, while, at the same time, little is known about the hydro- and morphodynamic conditions. In the Netherlands, particularly the Province of Groningen was affected by the Christmas flood, suffering vast flooding and numerous dyke failures. The latter are well documented and often are still visible in the topography in the form of erosional pothole structures and associated sediment fans further inland. These morphological features originate from the intense hydrodynamics during dyke failures such as flow convergence in the area of the breaking dyke (sediment erosion) and flow divergence landwards of the dyke (sediment deposition).
In this study, for the first time, dyke failures associated with the 1717 Christmas flood were systematically reconstructed and mapped by using historical maps and literature and by analysing the recent topography in search of typical pothole structures and sediment fans. Based on this approach, altogether 41 potential dyke failures and related sediment fans were identified in the Province of Groningen. Most of the identified pothole structures and sediment fans show similar dimensions, with widths of between 100 m and a few hundred metres. For all three fieldwork sites of this study, i.e. the villages Wierhuizen, Vierhuizen and Kohol, the topography indicates pothole structures 150 m to 200 m wide and sediment fans reaching 260 m to 300 m inland. Judging from the elevation differences between the highest parts of the identified sediment fans and the surroundings, the fans show a thickness of the order of 0.5 m. The dimensions of the sediment fans as derived from the topography show a close agreement with the dimensions indicated by vibracore profiles, direct push tests and ERT data taken at the three fieldwork sites and, moreover, with the fan dimensions as simulated using a morphodynamic numerical model for one of the three sites, Wierhuizen. Consequently, the recent topography, although more than 300 years later, is still indicative for the locations and dimensions of dyke failures and sediment fans associated with the 1717 Christmas flood in the Province of Groningen.
Stratigraphic data and numerical model results demonstrate that the sediment fans in Groningen are mostly made up of fine sand discordantly overlying finer coarse-grained in situ tidal marsh deposits. The fan deposits are mainly accumulated during the first inflow of seawater and mostly originate from the erosion zone of the related pothole structures. Consequently, the formation of potholes and associated sediment fans is a morphodynamic process taking place on a very local scale. However, considering the large number of detected dyke failure locations, 41 (which certainly underestimates the actual number of dyke failures during the Christmas flood in Groningen) and the relatively large dimensions of the potholes and particularly of the sediment fans up to few hundred metres wide and up to 0.7 m thick, this study demonstrates the significant morphological effects of the 1717 Christmas flood on the mainland of the Province of Groningen.
Based on the applied numerical simulation approach and the comparison of model results with field data and field observations, a maximum seaward water level of 5 m NAP for the dyke failure at Wierhuizen during the Christmas flood can be derived. The associated maximum depth-averaged flow velocities in the area of the pothole are of the order of 4 m s −1. Since the width of the pothole and the dimensions of the sediment fan (including its thickness) at Wierhuizen are similar to those observed at Vierhuizen and Kohol (with similar sediment stratigraphies), it is concluded that the regional maximum water level during the dyke failure of the 1717 Christmas flood was of the order of 5 m NAP. This level is in good agreement with the maximum storm surge level of 4.62 m NAP historically documented for the city of Emden located almost 50 km to the east of Wierhuizen, which is the fifth highest water level ever recorded at Emden.
The results of the current study demonstrate that the reconstruction of historical dyke failures based on (i) historical sources, (ii) recent lidar/high-resolution topographical data, (iii) multi-proxy sedimentary field data and (iv) hydro- and morphodynamic numerical simulations is a highly promising approach to derive hydrodynamic conditions and the morphological onshore response of the 1717 Christmas flood in the Province of Groningen. This knowledge is essential to improve our understanding of extreme storm surge dynamics, their influence on the coastal landscape and the associated hazards for the coastal population. This is particularly true considering the projected sea-level rise and potential increase in storminess for the North Sea, which may result in an increase in coastal flooding.
Future research should take account of more of the identified dyke failure locations and, based on sedimentary field data and numerical simulations, derive the local hydro- and morphodynamic conditions associated with the dyke failures and storm surge. The same methodology may also be applied for the neighbouring German state of Lower Saxony, which, similar to Groningen, was strongly affected by the 1717 Christmas flood and suffered numerous dyke failures. This will give insight into the supraregional storm surge conditions and regional differences between the various study sites and thereby will help to reconstruct the 1717 Christmas flood in more detail.


 Open access