


Clostridium difficile infection (CDI) is the most frequently reported healthcare-associated infection (HAI) in the United StatesReference Leffler and Lamont 1 and the major infective cause of nosocomial diarrhea in developed countries,Reference Davies, Longshaw and Davis 2 incurring billions of dollars in excess medical costs per year.Reference Zimlichman, Henderson and Tamir 3 Estimates of the per-patient cost of CDI have varied from $2,871 to $122,318 due to differences in methodology, patient inclusion criteria, and regional costs.Reference Ghantoji, Sail, Lairson, DuPont and Garey 4 – Reference Gabriel and Beriot-Mathiot 6 Given the high hospital-to-hospital variability of these costs,Reference Stevens, Khader and Nelson 7 , Reference Lofgren, Cole, Weber, Anderson and Moehring 8 infection control officers, hospital administrators, and clinicians would benefit from estimates tailored to their particular populations and healthcare practices. Concretely defining the potential economic savings of CDI prevention would empower stakeholders to prudently choose among the many available validated interventions.Reference Katz 9 , Reference Dubberke, Carling and Carrico 10
Measuring costs within healthcare systems is notoriously difficult; many hospitals do not have access to itemized reimbursement data linked to medical records.Reference Cooper, Craig, Gaynor and Van Reenen 11 Even institutions that have informatics retrospectively linking these data have relied on the curation of select variables and chart review to estimate attributable CDI cost.Reference Dubberke, Schaefer, Reske, Zilberberg, Hollenbeak and Olsen 12 – Reference Greco, Shi and Michler 14 Nevertheless, electronic medical record (EMR) systems are used by most first-world acute-care facilities.Reference Henry, Pylypchuk, Searcy and Patel 15 , Reference Gray, Bowden, Johansen and Koch 16 Part of the rationale for these systems is that hospitals may leverage EMR data for optimal decision making by inferring causal relationships from raw observations during routine care.Reference Etheredge 17 – Reference Pak and Kasarskis 19 An analysis based on automatically extractable data from an EMR that quantifies preventable hospital costs, such as those attributable to an HAI like CDI, would be of great value in building a continuously learning healthcare system.Reference Krumholz, Terry and Waldstreicher 20 EMRs contain many structured fields relevant to this analysis, including diagnosis codes and lab results demonstrating onset of HAIs; thousands of variables for procedures, problems, and medications that can serve as covariates for adjustment in observational studies; and importantly, the length of stay (LOS) for each visit, which is the primary contributor to excess costs for most HAIs, including CDI.Reference Zimlichman, Henderson and Tamir 3 , Reference Wilcox, Cunniffe, Trundle and Redpath 21 , Reference McGlone, Bailey and Zimmer 22
The goal of this study was to generate a robust estimate of local cost associated with CDI using data that are automatically extractable from a typical EMR. We used all available structured data recorded within 24 hours of admission in the EMR (including >20,000 variables, such as medications reported and administered, abnormal lab values, and problem list entries) to build fully data-driven models for CDI risk using a machine-learning algorithm to avoid the potential bias of preselected covariates and manual chart review. CDI risk models trained on uncurated data from EMRs have already outperformed models that only incorporate variables for known risk factors, indicating that CDI risk may be nuanced in particular care settings.Reference Wiens and Campbell 23 We then use these trained CDI risk models for propensity score matching, which allowed estimation of changes in LOS associated with CDI. Most previous studies of CDI cost have not accounted for the possibility that longer LOS increases the risk of CDI (ie, reverse causation), and therefore likely overestimate the cost of CDI.Reference Stevens, Khader and Nelson 7 , Reference Mitchell, Gardner, Barnett, Hiller and Graves 24 To adjust for this, we stratified our analysis by the time of CDI diagnosis to find the change in LOS conditional on minimal prior exposure to the hospital environment. Finally, we compared these results to a multistate model of competing time-dependent risks between discharge and the onset of CDI.
METHODS
Data Source
This study was conducted at The Mount Sinai Hospital, a 1,171-bed tertiary-care hospital in New York City. Records of warehoused adult inpatient EMR visit data were deidentified using the Health Insurance Portability and Accountability Act of 1996 (HIPAA) Safe Harbor method, 45 CFR §164.514(b)(2). Data were collected on demographics, LOS, time of death, admission sources, reported medications, and the presence of a “008.45” International Classification of Disease, Ninth Revision (ICD-9) principal or secondary visit diagnosis code denoting “Intestinal infection due to Clostridium difficile.” Furthermore, all records of medications administered, abnormal lab results, surgery procedure codes, or problem list ICD-9 codes within the first 24 hours after admission were collected as Boolean variables (ie, presence or absence). All variables that were uniform across the study population were dropped from the dataset. The relationships between collected data elements are summarized in Figure 1A. The Mount Sinai Institutional Review Board deemed this research to be exempt from the need for approval.
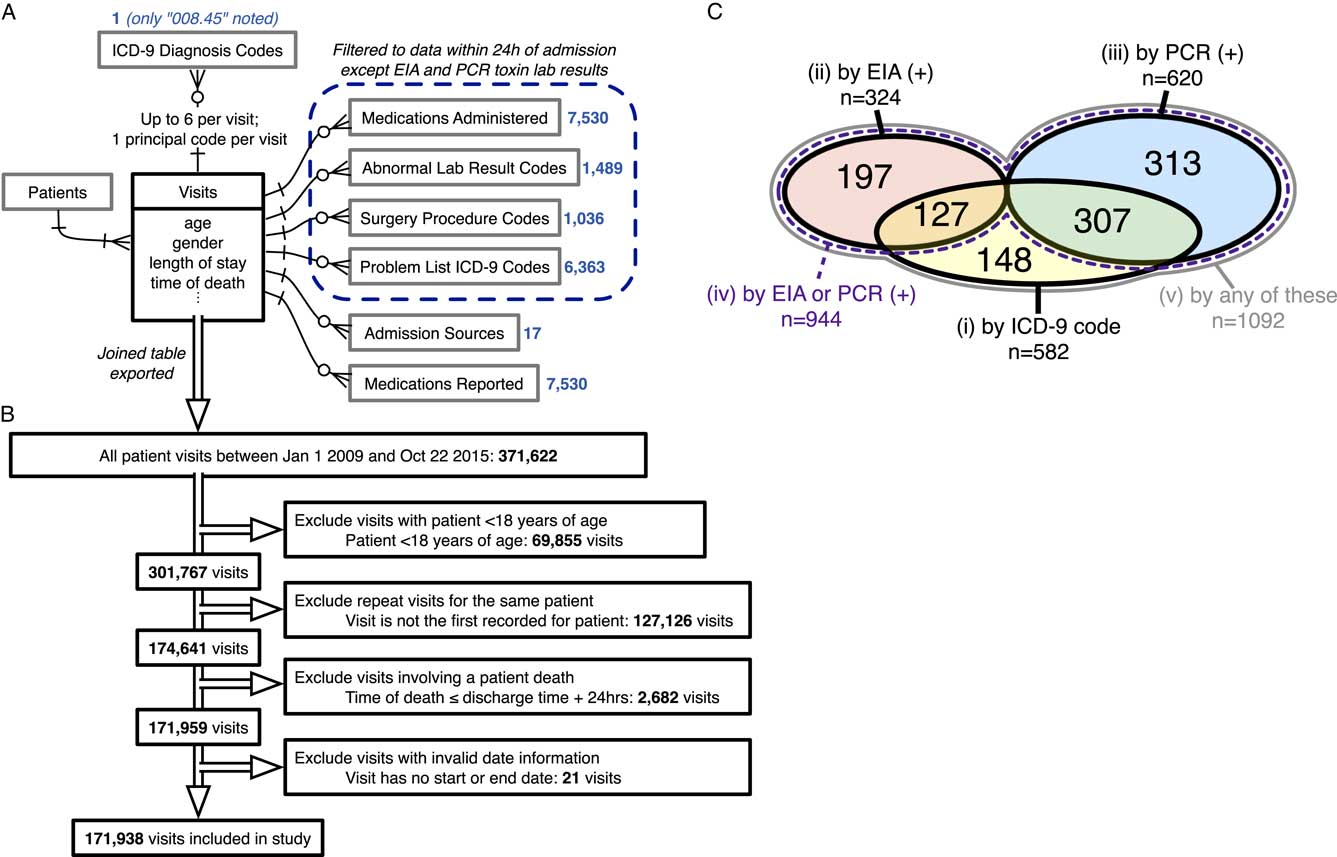
Data sources, inclusion/exclusion criteria, and cohort sizes before matching. (A) Entity-relationship diagram for all EMR data used to generate models of CDI propensity, using information engineering notation.Reference Halpin and Morgan 44 Boxes represent tables of entities with any directly associated attributes (fields) listed below; single lines represent relationships, with arrowheads indicating the cardinality of each side of the relationship; crow’s foot arrowhead with circle represents “zero or more”; crow’s foot arrowhead with a cross stroke represents “1 or more”; cross-stroke arrowhead represents “exactly one.” Blue numbers indicate the number of variables extracted from each associated table for each visit. (B) Inclusion/exclusion procedure for the present study. Double-line arrows indicate the procession of visit records. (C) Venn diagram of case cohort sizes for each of the 5 CDI case definitions before matching, including sizes of all intersections between case definitions (overlaps). Areas are not to scale. There is no intersection between definitions 2 and 3 because only the first positive toxin assay result for each visit was examined. Definition 4, “by EIA or PCR (+),” is a strict superset of definitions 2 and 3. Definition 5, “by any of these,” is a strict superset of definitions 1, 2, and 3. Sizes of matched case cohorts are provided in Table 1. EMR, electronic medical record; CDI, Clostridium difficile infection.
Study Population
The cohort included all patients 18 years of age or older admitted between January 1, 2009, and October 22, 2015 (Figure 1B). For each patient, visits following the first recorded visit in the time range were excluded so that each patient corresponded to a single visit. Visits involving a patient death, defined as a recorded time of death within 24 hours after discharge, were excluded (2,682 adult patients; 1.5%). Visits with missing or invalid date information were excluded (<0.01% of all records).
Study Design
Prior studies vary on the use of ICD-9 discharge codes versus positive laboratory tests to define CDI casesReference Zhang, Palazuelos-Munoz, Balsells, Nair, Chit and Kyaw 5 , Reference Gabriel and Beriot-Mathiot 6 and identify differing positive predictive values for immunoassay and nucleic acid–based laboratory tests.Reference Polage, Gyorke and Kennedy 25 – Reference Moehring, Lofgren and Anderson 27 To ensure maximally robust results and to allow comparison with prior studies, we repeated our analysis for 5 definitions of CDI:
Definition 1: An “008.45” ICD-9 visit diagnosis code
Definition 2: ≥1 positive stool toxin enzyme immunoassay (EIA) lab result
Definition 3: ≥1 positive stool toxin polymerase chain reaction (PCR) lab result
Definition 4: Definition 2 or definition 3
Definition 5: Definition 1, 2, or 3
Our study period included both a period during which the EIA assay was the standard hospital laboratory test (~3 years) followed by a period during which the PCR assay was standard (~4 years). For case cohorts involving definitions 2 and 3, comparisons were only permitted with controls from the period during which that same test was standard. The hospital laboratory protocol requires unformed stool samples for either toxin assay.
Statistical Analysis
Details of propensity model development, matching, evaluation of matching performance, and LOS comparisons are available in Supplementary Methods. Briefly, propensity models for CDI based on the 5 case definitions were trained using logistic regression with elastic net regularization. After exact matching on gender and age bins, nearest-neighbor 1:1 matching on the propensity score was performed with a caliper of 0.2 standard deviations of the logit of the propensity score (Figure S1).Reference Austin 28 Matching was repeated using the matched controls against remaining unmatched controls to create a rematched cohort, testing whether matching alone is associated with changes in LOS. For each case definition of CDI, differences of the median LOS between cases and matched controls were calculated, and statistical significance was determined using with the 2-sided Mann-Whitney U test. Although violation of the proportional hazards assumption (Figure S2) pre-empted traditional Cox survival analysis, nonparametric Kaplan-Meier estimates of the time-dependent risk of discharge were plotted for matched cohorts.
To further address the possible effect of time to infection on CDI risk and measured LOS differences, we repeated the analysis for definition 4, stratifying by the time of the first positive toxin assay using 3 ranges: 0–3 days, 3–8 days, and ≥8 days. Propensity models were again fitted to each of these case cohorts for matching as described previously, with the added condition that controls discharged before the start of the CDI time window were ineligible for matching.Reference Li, Propert and Rosenbaum 29 LOS comparisons followed the same procedure as above. Furthermore, we fit a nonparametric multistate model consistent with previous studies,Reference Stevens, Khader and Nelson 7 , Reference Mitchell, Gardner, Barnett, Hiller and Graves 24 , Reference van Kleef, Green and Goldenberg 30 under which the mean excess LOS was estimated as the average difference in LOS between patients that had or had not transitioned through the infected state for all timepoints, weighted by the distribution of times spent in the uninfected state. Analyses were performed in R 3.2.2 (R Foundation for Statistical Computing, Vienna, Austria); all software code is available at https://github.com/powerpak/cdi-cost.
RESULTS
In total, 371,622 records of visits during the study time range were queried from the EMR, with 23,968 variables extracted for each visit (Figure 1A and 1B). After filtering for the index visit per adult patient and excluding deaths and invalid dates, 171,938 visits were deemed eligible for inclusion and were classified into 5 overlapping case definitions for CDI. Case cohort sizes before matching and their overlaps are depicted in Figure 1C. Regularized logistic regression models predicting the risk of CDI acquisition were fitted to EMR data from the first 24 hours of each admission for each case definition, with consistently high predictive performance (Supplementary Methods; Figure S3).
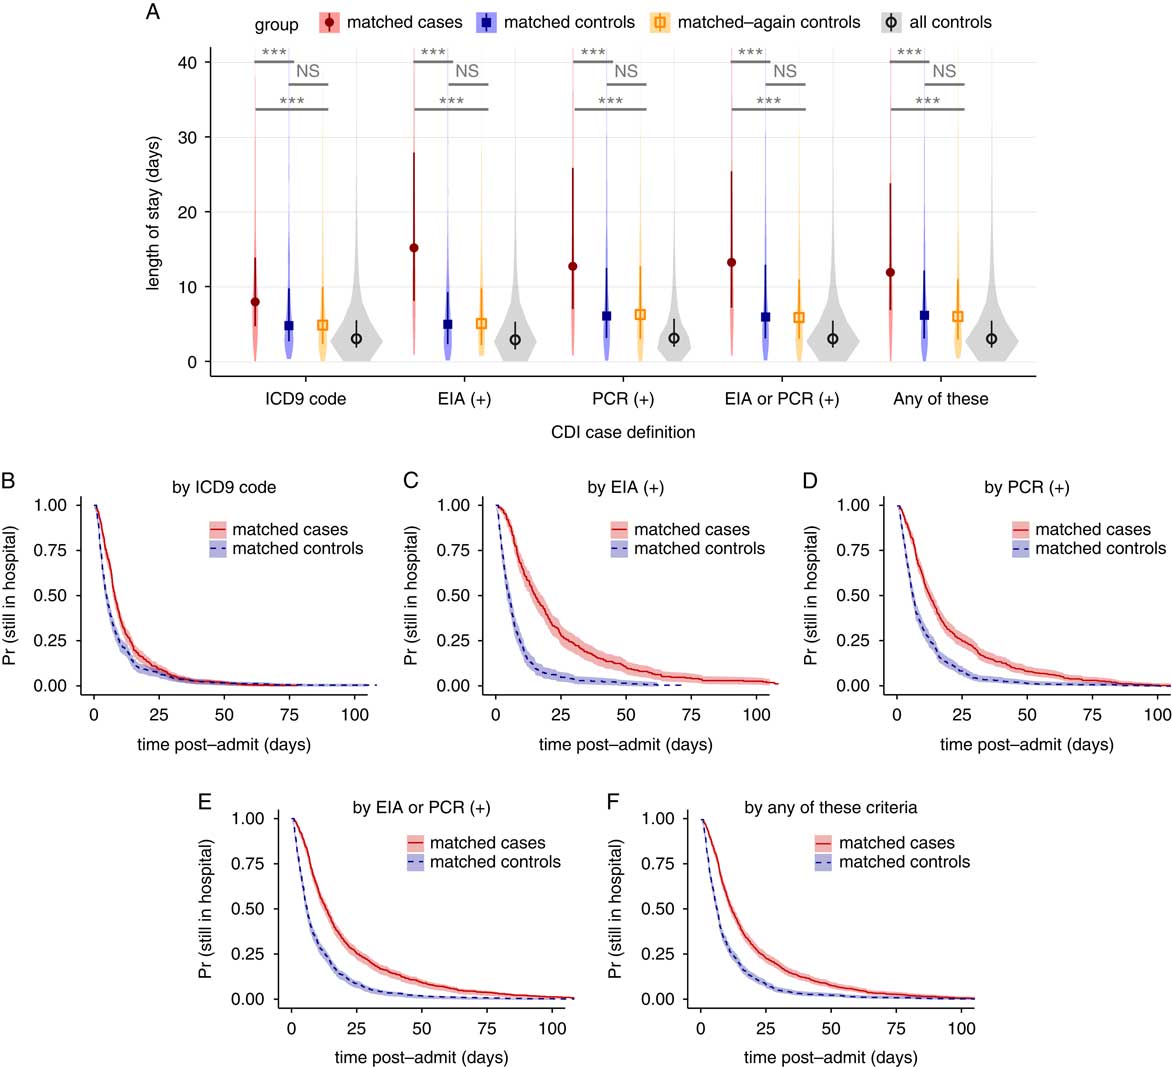
For each case definition, >75% of cases were successfully matched by propensity score to controls (Figure 1C and Table 1). The groups are well matched on demographics and propensity scores (Table 1 and Figure S4). Differences in the median LOS between matched case and control cohorts for all CDI case definitions were strongly statistically significant, although the magnitude of the differences varied greatly between definitions (Figure 2A). The differences in the median LOS, by case definition, were definition 1 (by ICD-9 code), 3.1 days (95% confidence interval [CI], 2.2–3.9); definition 2 (by positive toxin EIA), 10.1 days (95% CI, 7.3–12.2); definition 3 (by positive toxin PCR), 6.6 days (95% CI, 5.0–8.1); definition 4 (by either toxin assay), 7.2 days (95% CI, 5.8–8.3); and definition 5 (by any of these), 5.7 days (95% CI, 4.5–6.6). There were no significant differences in LOS for a second round of matching between matched controls and remaining controls (rematched controls) for any of the case definitions (Figure 2A). Kaplan-Meier curves for the time-dependent risk of being discharged from the hospital showed significant differences between matched case and control cohorts up to post-admission day 60 for all case definitions except ICD-9 code (Figure 2B–F).
Changes in length of stay for 5 case definitions of Clostridium difficile infection, not accounting for time of infection. (A) Violin plots of the distributions in length of stay for matched cases, matched controls, matched-again controls, and all controls, for each of the 5 case definitions. Darker points and vertical bars depict the median and interquartile range for each group. Horizontal bars depict Mann-Whitney U tests for significance of differences between groups (***, Bonferroni-corrected P<.001; NS, not significant [P>.1]). (B–F) Kaplan-Meier plots of the time-dependent probability for a patient to still be in the hospital, comparing matched cases and controls for each case definition of CDI. Shaded areas depict 95% confidence intervals calculated from standard errors. CDI, Clostridium difficile infection; ICD-9, International Classification of Diseases Ninth Revision; EIA, enzyme immunoassay; PCR, polymerase chain reaction.
Demographic Characteristics of the Study Population and Matched Cohorts
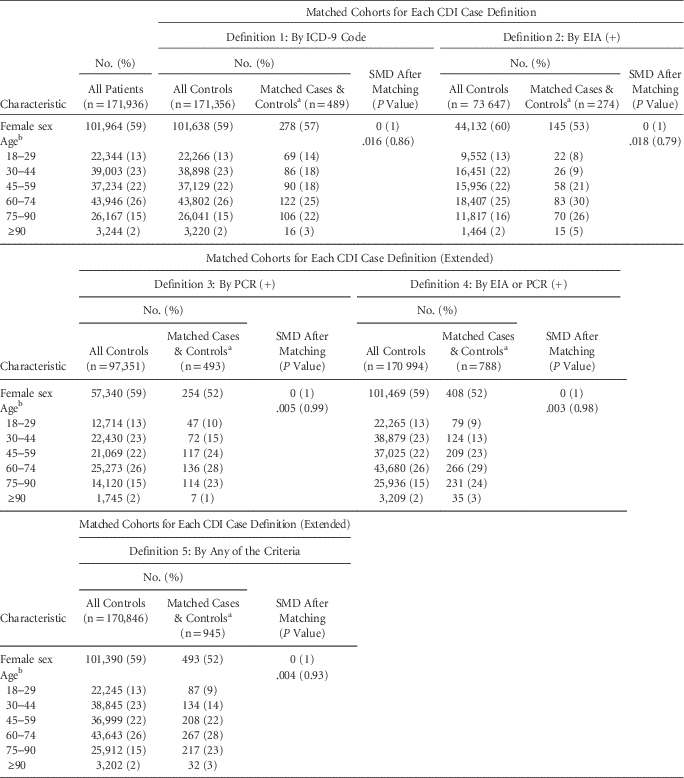
NOTE. CDI, Clostridium difficile infection; ICD-9, International Classification of Diseases Ninth Revision; EIA, enzyme immunoassay; PCR, polymerase chain reaction; SMD, standardized mean difference.
a Separate columns are unnecessary because 1:1 exact matching was performed on the characteristics shown, and therefore all values are identical.
b SMD is shown for age treated as a continuous variable; coarsened exact matching was performed using the listed age ranges.
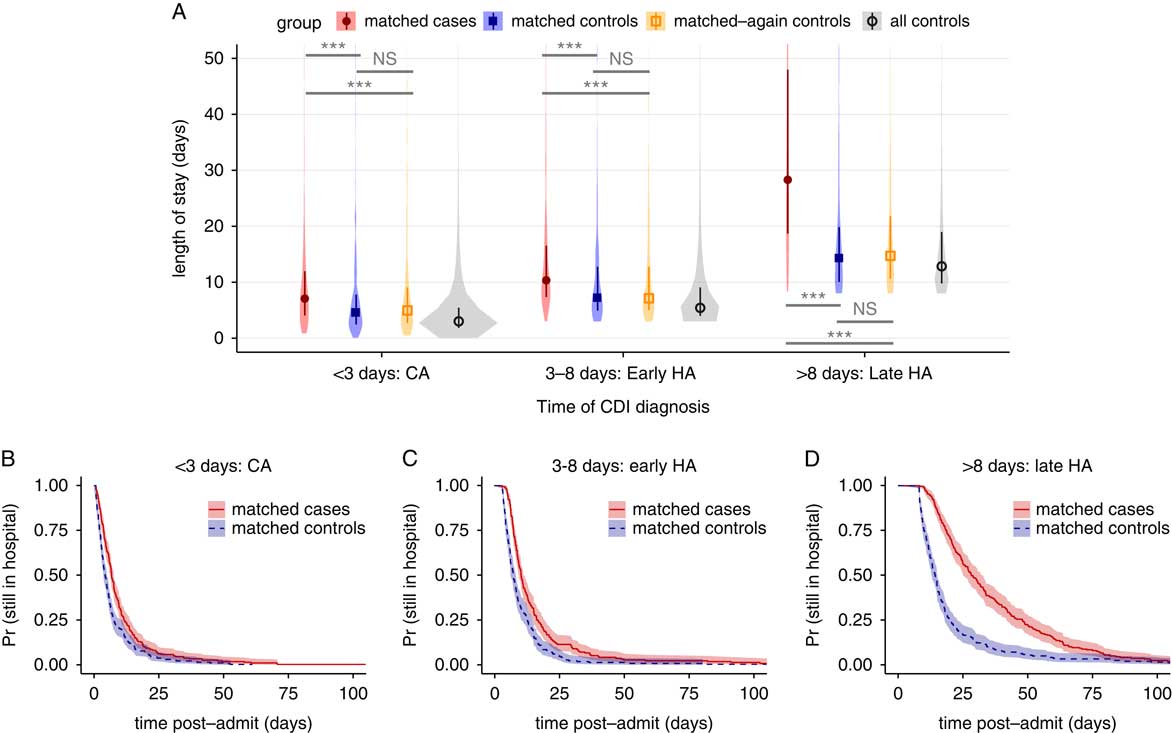
Estimates of LOS associated with CDI are inflated by dependencies on time-to-infection; longer preinfection LOS increases CDI risk (ie, reverse causation) and leads to overestimates in attributable cost.Reference Stevens, Khader and Nelson 7 , Reference Mitchell, Gardner, Barnett, Hiller and Graves 24 Therefore, we performed 2 follow-up analyses to account for this. First, we stratified the LOS comparison by the time of CDI diagnosis for case definition 4 into case cohorts of 0–3 days, 3–8 days, and ≥8-days, training new propensity models for rematching, with similar performance (Figure S5). Because 3 days is a typical cutoff for differentiating community-acquired (CA) from healthcare-associated (HA) CDI,Reference Polage, Gyorke and Kennedy 25 , Reference Longtin, Paquet-Bolduc and Gilca 31 these strata were named “CA,” “early HA,” and “late HA,” respectively. As suspected, stratification revealed a positive correlation between time of diagnosis and CDI-associated difference in LOS (Figure 3A). The differences in medians were (1) for CA, 2.5 days (95% CI, 1.2–3.4); (2) for early HA, 3.1 days (95% CI, 1.8–4.4); and (3) for late HA, 14.0 days (95% CI, 9.9–17.1). All comparisons between matched cases and controls were again strongly statistically significant, and comparisons with rematched controls were not significant (Figure 3A). Kaplan-Meier plots likewise confirmed a correlation between time of CDI diagnosis and differences in time-dependent discharge risk (Figure 3B–D).
Changes in length of stay for Clostridium difficile infection defined by any positive toxin assay, stratified by the time to infection. (A) Violin plots of the distributions in length of stay for matched cases, matched controls, rematched controls, and all controls, for 3 ranges of the result time for the first positive toxin assay. Points and vertical bars depict the median and interquartile range for each group. Horizontal bars depict Mann-Whitney U tests for significance of differences between groups (***, Bonferroni-corrected P<.001; NS, not significant [P>.1]). (B–D), Kaplan-Meier plots of the time-dependent probability for a patient to still be in the hospital, comparing matched cases and controls for the same 3 ranges of the time of the first positive toxin assay. Shaded areas depict 95% confidence intervals calculated from standard errors. CDI, Clostridium difficile infection; CA, community acquired; HA, healthcare associated.
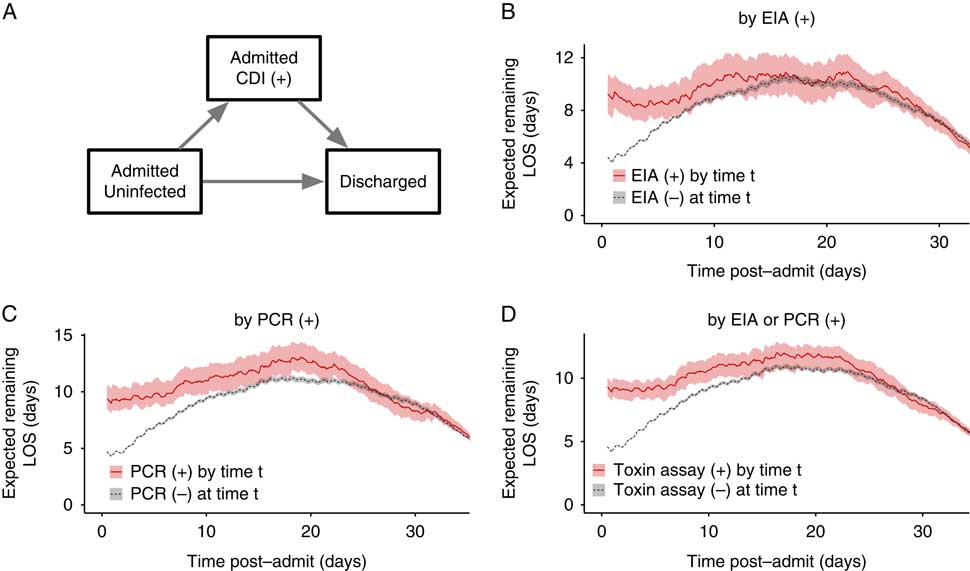
To further address reverse causation, we fit a multistate model similar to previously published studiesReference Stevens, Khader and Nelson 7 , Reference Mitchell, Gardner, Barnett, Hiller and Graves 24 , Reference van Kleef, Green and Goldenberg 30 that explicitly estimates time-dependent, competing risks of transitioning to CDI versus discharge. Figure 4A depicts the model’s states and transitions. After fitting the model for the case definitions with a time of diagnosis (definitions 2, 3, and 4), the expected remaining LOS can be compared across cohorts that have already transitioned to the CDI infected state versus those that are still CDI negative at any given timepoint (Figure 4B–D). To summarize the overall relationship between CDI and LOS, differences in LOS were weighted by the distribution of times spent in the initial state and averaged. The average differences for each case definition were: definition 2 (by positive toxin EIA), 3.0 days (95% CI, 2.0–4.0); definition 3 (by positive toxin PCR), 3.5 days (95% CI, 2.7–4.5); and definition 4 (by either toxin assay), 3.3 days (95% CI, 2.6–4.0). Notably, the 95% CI for the difference in the definition 4 cohort overlaps the 3.1-day difference for the “early HA” stratum of the propensity-matched analysis in the same cohort.
Multistate model of expected remaining length of stay for Clostridium difficile infection case definitions involving toxin assays. (A) The 3 states of the multistate model and allowed transitions. Patients may only transition in the direction of the arrows. (B–D) Expected remaining LOS for each post-admission time t depending on whether the patient has had a positive (+) toxin assay by that timepoint, for each of the case definitions involving toxin assays. Shaded areas depict 95% confidence intervals calculated from 1,000 bootstrap samples. CDI, Clostridium difficile infection; EIA, enzyme immunoassay; PCR, polymerase chain reaction; LOS, length of stay.
DISCUSSION
This study examined nearly 7 years of uncurated EMR data for a single hospital and determined associated costs of CDI as defined by either visit diagnosis codes or lab results. In the analysis unadjusted for time to infection, differences in LOS were often greater than national averages from similar unadjusted studies,Reference Zimlichman, Henderson and Tamir 3 , Reference Zhang, Palazuelos-Munoz, Balsells, Nair, Chit and Kyaw 5 , Reference Gabriel and Beriot-Mathiot 6 but changes in the case definition resulted in substantial changes in the estimated differences in LOS. Although 2 hospitals reported good concordance between ICD-9 codes and CDI toxin assay results,Reference Dubberke, Reske, McDonald and Fraser 32 , Reference Scheurer, Hicks, Cook and Schnipper 33 this is not necessarily the case for all hospitals. We found that 75% of ICD-9 coded visits involved a positive toxin assay, while only 46% of visits with a positive toxin assay had the ICD-9 code (Figure 1C). Changes in LOS were not significantly different between EIA and PCR toxin assays, although our study was limited by a smaller sample size for EIA-positive cases. Toxin assays are likely a more reliable CDI definition given their basis in clinical symptoms and evidence for CDI, whereas medical coding suffers from biases introduced by billing and reimbursement.Reference Rhee, Murphy, Li, Platt and Klompas 34 , Reference Romano and Mark 35
Treating CDI as a baseline condition by ignoring the relationship between preinfection hospital exposure and CDI risk overestimates associated costs.Reference Stevens, Khader and Nelson 7 , Reference Mitchell, Gardner, Barnett, Hiller and Graves 24 , Reference Graves, Harbarth, Beyersmann, Barnett, Halton and Cooper 36 Unlike visit diagnosis codes, toxin assay results provide a presumptive time to infection that we incorporated into 2 different statistical methods addressing time-dependent bias. When using a case definition of either toxin assay being positive, the measured difference in LOS in the multistate model corresponded closely with the difference seen in the “early HA” stratum of a time-stratified propensity-matched analysis (3.3 vs 3.1 days). This finding suggests that measured differences in this study robustly reflect associated costs of HA-CDI in our patient population. Because estimates for each time-to-infection stratum in the matching analysis differed greatly (Figure 3), time to infection clearly contributed bias to the unstratified analysis (Figure 2), demonstrating how the many studies that ignore this biasReference Zimlichman, Henderson and Tamir 3 , Reference Zhang, Palazuelos-Munoz, Balsells, Nair, Chit and Kyaw 5 , Reference Gabriel and Beriot-Mathiot 6 produce inflated estimates. In our dataset, ignoring time-dependent bias would lead to a >2-fold overestimation of CDI-associated LOS. Given our findings, we cautiously interpret the results of meta-analyses that conflate ICD-9 code and toxin assay case definitions and often ignore time-dependent bias.Reference Ghantoji, Sail, Lairson, DuPont and Garey 4 – Reference Gabriel and Beriot-Mathiot 6
To our knowledge, this is the first study to use machine learning on uncurated EMR data to estimate the local cost of CDI. Our models of CDI risk performed on par with prior models fitted to lower-dimensional data.Reference Wiens and Campbell 23 , Reference Dubberke, Yan and Reske 37 , Reference Tanner, Khan, Anthony and Paton 38 Because our models are based on tens of thousands of structured fields in the EMR that require neither chart review nor manual curation beyond masking known CDI-related effects, reanalysis of future data is inexpensive. Starting from exported visit data, the entire analysis runs in several hours on standard desktop computers. Therefore, the effects of new interventions against CDI can be efficiently monitored over time, for example, continually testing whether new treatments actually lower the CDI-associated LOS or quantifying cost savings of new preventive strategies that decrease CDI incidence. Changes in LOS can be extrapolated to approximate economic costs by multiplying by the average cost of extra inpatient days, as LOS is the main contributor to the cost of CDI.Reference Zimlichman, Henderson and Tamir 3 , Reference Wilcox, Cunniffe, Trundle and Redpath 21 , Reference McGlone, Bailey and Zimmer 22 , Reference Graves, Harbarth, Beyersmann, Barnett, Halton and Cooper 36 In our dataset, using the time-dependency adjusted differences in LOS of 3.1–3.3 days and the national average cost of additional inpatient days for CDI cases,Reference Zimlichman, Henderson and Tamir 3 the median cost associated with each case would be approximately $10,600–11,300. This cost is substantial in comparison to the national average price for an inpatient visit, which was approximately $13,000 in 2011.Reference Cooper, Craig, Gaynor and Van Reenen 11 Using the average yearly case load observed in the dataset for toxin assay positive cases, our figures represent an annual accounting cost to Mount Sinai of approximately $1.5 million, not including the opportunity cost of bed occupancy by CDI patients or the impact on infection control resources.Reference Graves, Harbarth, Beyersmann, Barnett, Halton and Cooper 36 In principle, our analysis is generalizable to any HAI where laboratory results recorded in the EMR robustly reflect the incidence of infections.
Our study has several limitations. The analysis was designed conservatively, preferring that models underestimate rather than overestimate CDI-associated changes. For example, we censored all patient visits ending in death; therefore, our results are conditioned on patient survival, although a sensitivity analysis that included 12%–16% additional cases ending in patient death yielded similar quantitative and qualitative results. Additionally, restricting our analysis to 1 index visit per patient certainly excluded many repeat visits for recurrent CDI, which are known to incur higher costs.Reference Dubberke, Schaefer, Reske, Zilberberg, Hollenbeak and Olsen 12 , Reference Dubberke, Reske, Olsen, McDonald and Fraser 13 , Reference Rodrigues, Barber and Ananthakrishnan 39 We preferred a relatively simple, fast machine learning technique, elastic net regularized generalized linear models, whereas more advanced techniques might marginally improve propensity model accuracy.
Propensity score matching itself has been criticized for potentially introducing bias via collider variables.Reference Pearl 40 However, substantial empirical comparisons of estimates from observational and randomized controlled trial data show that propensity matching often reduces bias.Reference Lonjon, Boutron and Trinquart 41 Recent investigations of penalized regression propensity matching also show a reduction in bias.Reference Athey, Imbens and Wager 42 , Reference Antonelli, Cefalu, Palmer and Agniel 43 We believe our implementation reduced bias because our estimate of the effect of CDI on LOS demonstrated significant deviations from unmatched analyses and concordance with the multistate matching analysis (which did not leverage propensity scores or matching). We also note that propensity-matched estimates offer a conservative effect size, which was the intention of this study.
EMR data have known drawbacks compared to clinical research data, such as limitations in time precision, the sparsity of the data, and increased opportunity for coding error. We did not have structured billing data, so we were unable to characterize the exact relationship between LOS and costs beyond the proportional estimate above. Finally, data for only 1 hospital were available for this study. We provide complete code for our analysis so that it may be reimplemented elsewhere and improved by the community.
In conclusion, 2 independent statistical analyses adjusting for time-dependent bias produced similar results for the CDI-associated change in LOS at Mount Sinai (3.1 and 3.3 days), suggesting that automated methods based on machine learning and uncurated EMR data robustly and conservatively estimate the local cost of an HAI in both LOS and financial terms. This procedure is transparent, reproducible, and inexpensive, suggesting that hospitalists and infection control officers can leverage EMR data to estimate their specific, local costs of HAIs on an ongoing basis rather than relying on widely varying benchmarks published by other institutions.
ACKNOWLEDGMENTS
We thank Deena Altman, Camille Hamula, and Gopi Patel for their assistance in improving the design of the study and reviewing the manuscript.
Financial support: This study was supported by the Icahn Institute for Genomics and Multiscale Biology at Mount Sinai, in part by the National Institute of Allergy and Infectious Diseases (grant nos. F30AI122673 and R01AI119145), and through the resources and expertise of the Department of Scientific Computing at the Icahn School of Medicine at Mount Sinai.
Potential conflicts of interest: E.R.S. receives salary support from and acts as an advisor for Sema4 Inc. All other authors report no conflicts of interest relevant to this article.
SUPPLEMENTARY MATERIAL
To view supplementary material for this article, please visit https://doi.org/10.1017/ice.2017.214.


 Open access

