


I. INTRODUCTION
Birefringence is unexpected in ideal high-symmetry cubic minerals, such as common silicate garnet, [8]X 3[6]Y 2[4]Z 3[4]O12. Such birefringence was reported over a century ago (Brewster, Reference Brewster1853; Mallard, Reference Mallard1876; Brauns, Reference Brauns1891), but the origin remains debatable, and is addressed in this study with regard to spessartine, ideally {Mn2+ 3}[Al2](Si3)O12. Some spessartine, grossular, {Ca3}[Al2](Si3)O12; andradite, {Ca3}[Fe3+ 2](Si3)O12; uvarovite, {Ca3}[Cr3+ 2](Si3)O12, etc. may show birefringence under cross-polarized light, which may indicate that they are not optically cubic (Deer et al., Reference Deer, Howie and Zussman1992). Several reasons were given as the cause of the birefringence, but the main one appears to be cation order in the X or Y site and symmetry reduction from cubic to lower symmetry in which their structure refinements were carried out (Takéuchi et al., Reference Takéuchi, Haga, Umizu and Sato1982; Akizuki, Reference Akizuki1984; Allen and Buseck, Reference Allen and Buseck1988; Kingma and Downs, Reference Kingma and Downs1989; Griffen et al., Reference Griffen, Hatch, Phillips and Kulaksiz1992; Akizuki et al., Reference Akizuki, Takéuchi, Terada and Kudoh1998; Shtukenberg et al., Reference Shtukenberg, Punin, Frank-Kamenetskaya, K. and Sokolov2001, Reference Shtukenberg, Popov and Punin2005; Wildner and Andrut, Reference Wildner and Andrut2001; Frank-Kamenetskaya et al., Reference Frank-Kamenetskaya, Rozhdestvenskaya, Shtukenberg, Bannova and Skalkina2007; Boiocchi et al., Reference Boiocchi, Bellatreccia, Della Ventura and Oberti2012). Synthetic MgSiO3 majorite (and analogues CaGeO3, CdGeO3, and MnSiO3) were reported to be birefringent with tetragonal space group I41/a, which has important implications for phase transitions in the transition zone in the mantle (Prewitt and Sleight, Reference Prewitt and Sleight1969; Fujino et al., Reference Fujino, Momoi, Sawamoto and Kumazawa1986; Angel et al., Reference Angel, Finger, Hazen, Kanzaki, Weidner, Liebermann and Veblen1989; Parise et al., Reference Parise, Wang, Gwanmesia, Zhang, Sinelnikov, Chmielowski, Weidner and Liebermann1996; Nakatsuka et al., Reference Nakatsuka, Yoshiasa, Yamanaka and Ito1999a, Reference Nakatsuka, Yoshiasa, Yamanaka, Ohtaka, Katsura and Ito1999b, Reference Nakatsuka, Chaya and Yoshiasa2005). The various reasons for the birefringence in garnet were recently discussed by Antao and Klincker (Reference Antao and Klincker2013a, Reference Antao and Klincker2013b) and Antao (Reference Antao2013a, Reference Antao2013b, Reference Antao2013c). They showed that birefringent silicate garnet contained an intergrowth of a few cubic phases, which were not observed in the previous studies.
Novak and Gibbs (Reference Novak and Gibbs1971) reported the cubic structure of a spessartine [Mn2.58Fe0.34Ca0.08Al1.99Fe0.01Si3O12, Sps86Alm11Grs3, a = 11.612(1); Si–O = 1.637(1) Å] from Minas Gerais, Brazil. Smyth et al. (Reference Smyth, Madel, McCormick, Munoz and Rossman1990) examined the cubic structure of a (F,OH)-rich spessartine, [Mn2.67Fe0.33Ca0.05Al1.97Si2.70O10.7F1.0(OH)0.36, Sps87Alm11Grs2, a = 11.628(1); Si–O = 1.656(1) Å] from Clear Creek County, Colorado, with a striking birefringence of δn ≈ 0.008, similar to hydrogarnet. The structure of spessartine was refined in space group $Ia\overline{3} d$
by several other researchers (e.g., Gramaccioli et al., Reference Gramaccioli, Pilati and Demartin2002; Rodehorst et al., Reference Rodehorst, Geiger and Armbruster2002). For synthetic end-member spessartine, Geiger and Armbruster (Reference Geiger and Armbruster1997) obtained a = 11.619(1) and Si–O = 1.640(1) Å, which are similar to those obtained by Novak and Gibbs (Reference Novak and Gibbs1971). For a spessartine sample from S. Piero, Campo, Elba Isle, Gramaccioli et al. (Reference Gramaccioli, Pilati and Demartin2002) obtained a = 11.630(1) and Si–O = 1.646 Å. Recently, Boiocchi et al. (Reference Boiocchi, Bellatreccia, Della Ventura and Oberti2012) examined the structure of a birefringent (F,OH)-rich spessartine [(Mn2.87Fe0.09Ca0.04)(Al1.94Fe0.06)Si2.52O10.08F0.81(OH)1.11, a
tet = 11.6347 (3) Å, c
tet = 11.6449 (3) Å; a
cub = 11.6380 (3) Å] in the tetragonal space group I41/acd. Using the polarizing microscope, they observed that the broken fragments showed prominent zoned extinction. Their tetragonal unit-cell metrics are, in fact, nearly cubic (c/a = 1.006). Their a
cub cells are larger than that reported by Smyth et al. (Reference Smyth, Madel, McCormick, Munoz and Rossman1990) because their samples contain more (F,OH)4 groups. They indicated that the cubic-structure refinement of Smyth et al. (Reference Smyth, Madel, McCormick, Munoz and Rossman1990) should be reconsidered and that the tetragonal symmetry and birefringence are related to ordering of the (F,OH)4 groups. All the above samples were reported as chemically homogeneous and multiple cubic phases in birefringent spessartine were not observed in their single-crystal studies.
$Ia\overline{3} d$
by several other researchers (e.g., Gramaccioli et al., Reference Gramaccioli, Pilati and Demartin2002; Rodehorst et al., Reference Rodehorst, Geiger and Armbruster2002). For synthetic end-member spessartine, Geiger and Armbruster (Reference Geiger and Armbruster1997) obtained a = 11.619(1) and Si–O = 1.640(1) Å, which are similar to those obtained by Novak and Gibbs (Reference Novak and Gibbs1971). For a spessartine sample from S. Piero, Campo, Elba Isle, Gramaccioli et al. (Reference Gramaccioli, Pilati and Demartin2002) obtained a = 11.630(1) and Si–O = 1.646 Å. Recently, Boiocchi et al. (Reference Boiocchi, Bellatreccia, Della Ventura and Oberti2012) examined the structure of a birefringent (F,OH)-rich spessartine [(Mn2.87Fe0.09Ca0.04)(Al1.94Fe0.06)Si2.52O10.08F0.81(OH)1.11, a
tet = 11.6347 (3) Å, c
tet = 11.6449 (3) Å; a
cub = 11.6380 (3) Å] in the tetragonal space group I41/acd. Using the polarizing microscope, they observed that the broken fragments showed prominent zoned extinction. Their tetragonal unit-cell metrics are, in fact, nearly cubic (c/a = 1.006). Their a
cub cells are larger than that reported by Smyth et al. (Reference Smyth, Madel, McCormick, Munoz and Rossman1990) because their samples contain more (F,OH)4 groups. They indicated that the cubic-structure refinement of Smyth et al. (Reference Smyth, Madel, McCormick, Munoz and Rossman1990) should be reconsidered and that the tetragonal symmetry and birefringence are related to ordering of the (F,OH)4 groups. All the above samples were reported as chemically homogeneous and multiple cubic phases in birefringent spessartine were not observed in their single-crystal studies.
In garnet, [8]X 3[6]Y 2[4]Z 3[4]O12, the eight-coordinated dodecahedral X site contains Mg, Ca, Mn2+, or Fe2+ cations, the six-coordinated octahedral Y site contains Al, Cr3+, Fe3+, Ti4+, or Zr4+ cations, and the four-coordinated tetrahedral Z site contains Si atoms (Novak and Gibbs, Reference Novak and Gibbs1971). There are Si-atom deficiencies in some garnet samples that are occupied by Fe3+, Al, or (F, O4H4) (e.g., Armbruster et al., Reference Armbruster, Birrer, Libowitzky and Beran1998). The crystal structure of garnet consists of alternating ZO4 tetrahedra and YO6 octahedra with X cations filling cavities to form XO8 dodecahedra. The eight O atoms in the XO8 polyhedra occur at the corners of a distorted cube (Figure 1). Each O is coordinated by two X, one Y, and one Z cations in a tetrahedral configuration.
(Color online) Projection of the cubic garnet structure down c showing the ZO4 tetrahedra (grey), YO6 octahedra (yellow), and XO8 dodecahedra (blue) that occur as a distorted cubic shape. The dense packing of the polyhedral are obvious from the four unit cells displayed, which shows the prominent edge-sharing and zigzag arrangement of alternating octahedra and dodecahedra.

Some spessartine (this study), grossular (Antao, Reference Antao2013c), andradite-grossular (Antao, Reference Antao2013b), andradite (Antao and Klincker, Reference Antao and Klincker2013a, Reference Antao and Klincker2013b), and Ti-rich andradite (Antao, Reference Antao2013a) have high-resolution powder X-ray diffraction (HRPXRD) patterns that show splitting of reflections. All reflections were indexed using slightly different cubic unit-cell parameters (two or three different cubic phases) and the crystal structure of the multiple cubic phases was refined using the Rietveld method. These recent studies have shown that the birefringent garnet samples contain an intergrowth of two or more cubic phases, whereas isotropic garnet samples are single phase with cubic symmetry.
This study examines the crystal structure of four spessartine samples: three are birefringent and one is isotropic. Electron microprobe results indicate homogeneous compositions for each sample. The isotropic spessartine from Brazil is a single cubic phase. The other three birefringent samples contain an intergrowth of two different cubic phases that cause strain because of mismatch of the cubic structural parameters, and result in strain-induced birefringence. Preliminary reports were presented (Antao et al., Reference Antao, Klincker and Round2013a, Reference Antao, Klincker and Round2013b).
II. EXPERIMENTAL
A. Sample characterization and electron-microprobe analysis (EMPA)
The spessartine samples are from: (1) Navegador Mine, Conselheiro Pena, Minas Gerais, Brazil (burgundy/brown-red in color); (2) Little Three Mine, Ramona, San Diego County, California, USA (light orange/peach in color); (3) Loliondo, Tanzania (orange color); and (4) Ruby Mt., near Nathrop Chaffee County, Colarodo, USA (amber color). Except for sample 1 from Brazil, the other three samples are birefringent. They appear optically homogeneous in plane- and cross-polarized light. Some of the birefringent samples have a mottled, tweed texture, or zoned extinction. An example of the birefringent sample from Colorado is shown (Figure 2). Some birefringent garnet samples contain complex features such as twinning, “bow-tie”, lamellar, and concentric zoning (Akizuki, Reference Akizuki1984, Reference Akizuki1989; Allen and Buseck, Reference Allen and Buseck1988; Jamtveit, Reference Jamtveit1991; Brown and Mason, Reference Brown and Mason1994; Akizuki et al., Reference Akizuki, Takéuchi, Terada and Kudoh1998; Badar et al., Reference Badar, Akizuki and Hussain2010; Antao, Reference Antao2013b; Antao and Klincker, Reference Antao and Klincker2013a, Reference Antao and Klincker2013b; Badar et al., Reference Badar, Niaz, Hussain and Akizuki2013).
(Color online) Optical microscopy thin-section images for spessartine from Colorado. (a) plane-polarized with the corresponding cross-polarized light image (b). The scale bars represent 100 µm (bottom).

The four samples were analyzed with a JEOL JXA-8200 WD-ED EMPA. The JEOL operating program on a Solaris platform was used for ZAF correction and data reduction. The wavelength-dispersive (WD) operating conditions were 15 kV, 20 nA, 5 µm beam diameter, and using various standards [e.g., almandine-pyrope (MgKα), grossular (CaKα), almandine (FeKα, AlKα, SiKα), rutile (TiKα), spessartine (MnKα), and chromite (CrKα)]. Based on the EMPA results from eight spots from different areas of each crystal (≈2 mm diameter in size), the samples are chemically homogeneous (Table I). Back-scattered images from EMPA were featureless. The EMPA data were analyzed using the method and spreadsheet from Locock (Reference Locock2008).
EMPA results for four spessartine samples.
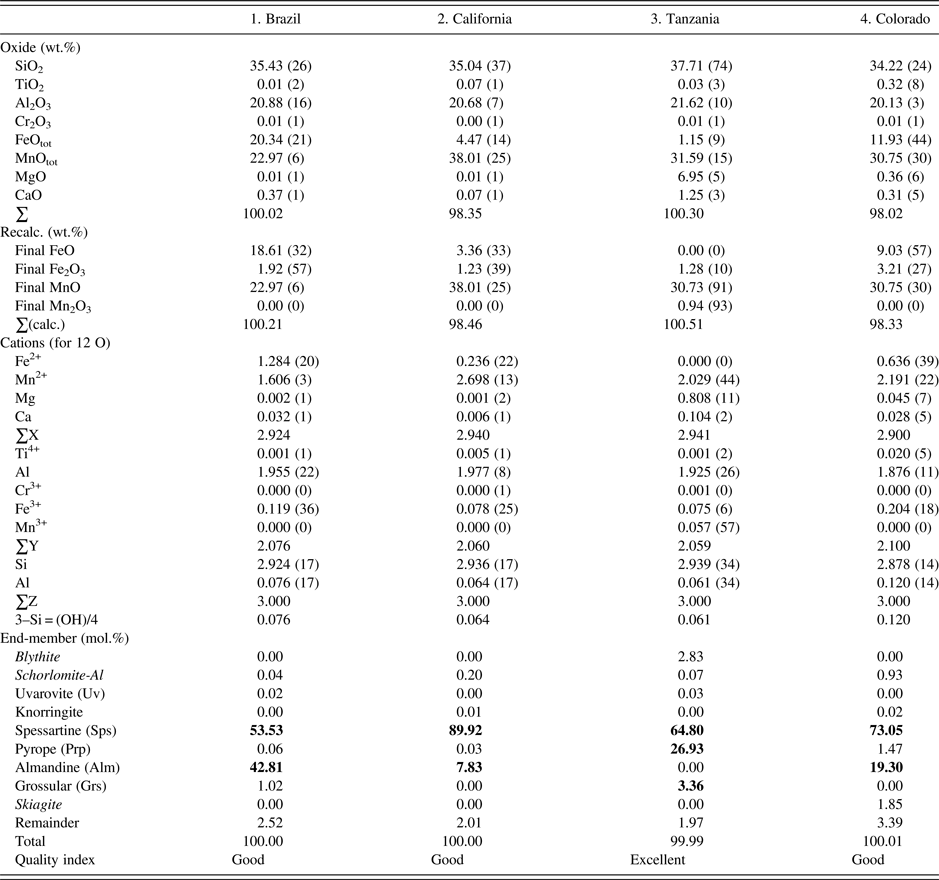
The esds in brackets are based on average analyses of eight spots and large values indicate minor chemical variations. Numbers in bold indicate significant end-members.
B. Synchrotron HRPXRD
The four samples were studied by HRPXRD experiments that were performed at beamline 11-BM, Advanced Photon Source (APS), Argonne National Laboratory (ANL). A crystal fragment from each sample (≈2 mm in diameter) was crushed to a fine powder using an agate mortar and pestle. The crushed samples were loaded into Kapton capillaries (0.8 mm internal diameter) and rotated during the experiment at a rate of 90 rotations per second. The data were collected at 23 °C to a maximum 2θ of about 50° with a step size of 0.001° and a step time of 0.1 s per step. The HRPXRD traces were collected with 12 silicon (111) crystal analyzers that increase detector efficiency, reduce the angular range to be scanned, and allow rapid acquisition of data. A silicon (NIST 640c) and alumina (NIST 676a) standard (ratio of ⅓ Si: ⅔ Al2O3 by weight) was used to calibrate the instrument and refine the monochromatic wavelength used in the experiment (Table II). Additional details of the experimental set-up are given elsewhere (Antao et al., Reference Antao, Hassan, Wang, Lee and Toby2008; Lee et al., Reference Lee, Shu, Ramanathan, Preissner, Wang, Beno, Von Dreele, Ribaud, Kurtz, Antao, Jiao and Toby2008; Wang et al., Reference Wang, Toby, Lee, Ribaud, Antao, Kurtz, Ramanathan, Von Dreele and Beno2008).
HRPXRD data and Rietveld refinement statistics for four spessartine samples.
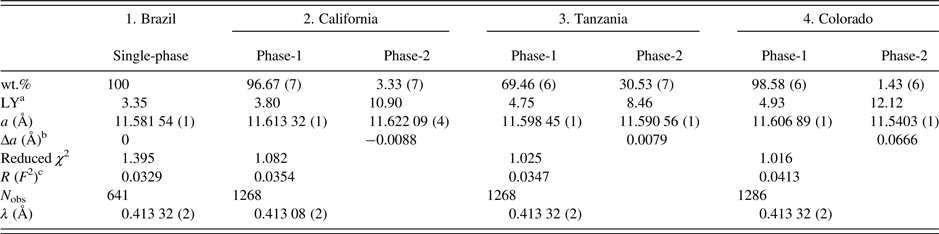
aLY is related to the strain and the values are quite large compared to the single-phase spessartine or the unstrained dominant phase.
bBased on the thin film, both the strain and birefringence between the substrate and film are proportional to Δa=(a substrate − a film) (Kitamura and Komatsu, Reference Kitamura and Komatsu1978). Two Δa values are similar to the birefringence, δn ≈ 0.008, reported by Smyth et al. (Reference Smyth, Madel, McCormick, Munoz and Rossman1990).
c R (F 2) = Overall R-structure factor based on observed and calculated structure amplitudes = [∑(F o 2 − F c 2)/∑(F o 2)]1/2. 2θ range = 2–50°. The number of data points is 479 91 for each trace.
C. Rietveld structure refinements
The HRPXRD data were analyzed using the Rietveld method (Rietveld, Reference Rietveld1969), as implemented in the GSAS program (Larson et al., Reference Larson and Von Dreele2000), and using the EXPGUI interface (Toby, Reference Toby2001). Scattering curves for neutral atoms were used. The starting atom coordinates, cell parameter, and space group $Ia\overline 3 d$
, were taken from Antao (Reference Antao2013b). The background was modeled using a Chebyschev polynomial. The reflection-peak profiles were fitted using type-3 profile in the GSAS program. Full-matrix least-squares refinements were carried out by varying the parameters in the following sequence: a scale factor, cell parameter, atom coordinates, and isotropic displacement parameters. Except for the single-phase sample from Brazil, examination of the HRPXRD traces shows the presence of two cubic phases with different unit-cell parameters (Figures 3 and 4). The two phases were refined together with the site occupancy factors (sofs) in terms of the dominant atom in each of the X, Y, and Z sites. Toward the end of the refinement, all the parameters were allowed to vary simultaneously, and the refinement proceeded to convergence. The birefringent samples contain two cubic phases, but they are less obvious in the California sample-2 (Figure 4). The isotropic sample-1 from Brazil is a single cubic phase (Figure 4(a)). No impurity peaks were observed in the samples and all the diffraction peaks were indexed using one or two cubic unit-cell parameters.
$Ia\overline 3 d$
, were taken from Antao (Reference Antao2013b). The background was modeled using a Chebyschev polynomial. The reflection-peak profiles were fitted using type-3 profile in the GSAS program. Full-matrix least-squares refinements were carried out by varying the parameters in the following sequence: a scale factor, cell parameter, atom coordinates, and isotropic displacement parameters. Except for the single-phase sample from Brazil, examination of the HRPXRD traces shows the presence of two cubic phases with different unit-cell parameters (Figures 3 and 4). The two phases were refined together with the site occupancy factors (sofs) in terms of the dominant atom in each of the X, Y, and Z sites. Toward the end of the refinement, all the parameters were allowed to vary simultaneously, and the refinement proceeded to convergence. The birefringent samples contain two cubic phases, but they are less obvious in the California sample-2 (Figure 4). The isotropic sample-1 from Brazil is a single cubic phase (Figure 4(a)). No impurity peaks were observed in the samples and all the diffraction peaks were indexed using one or two cubic unit-cell parameters.
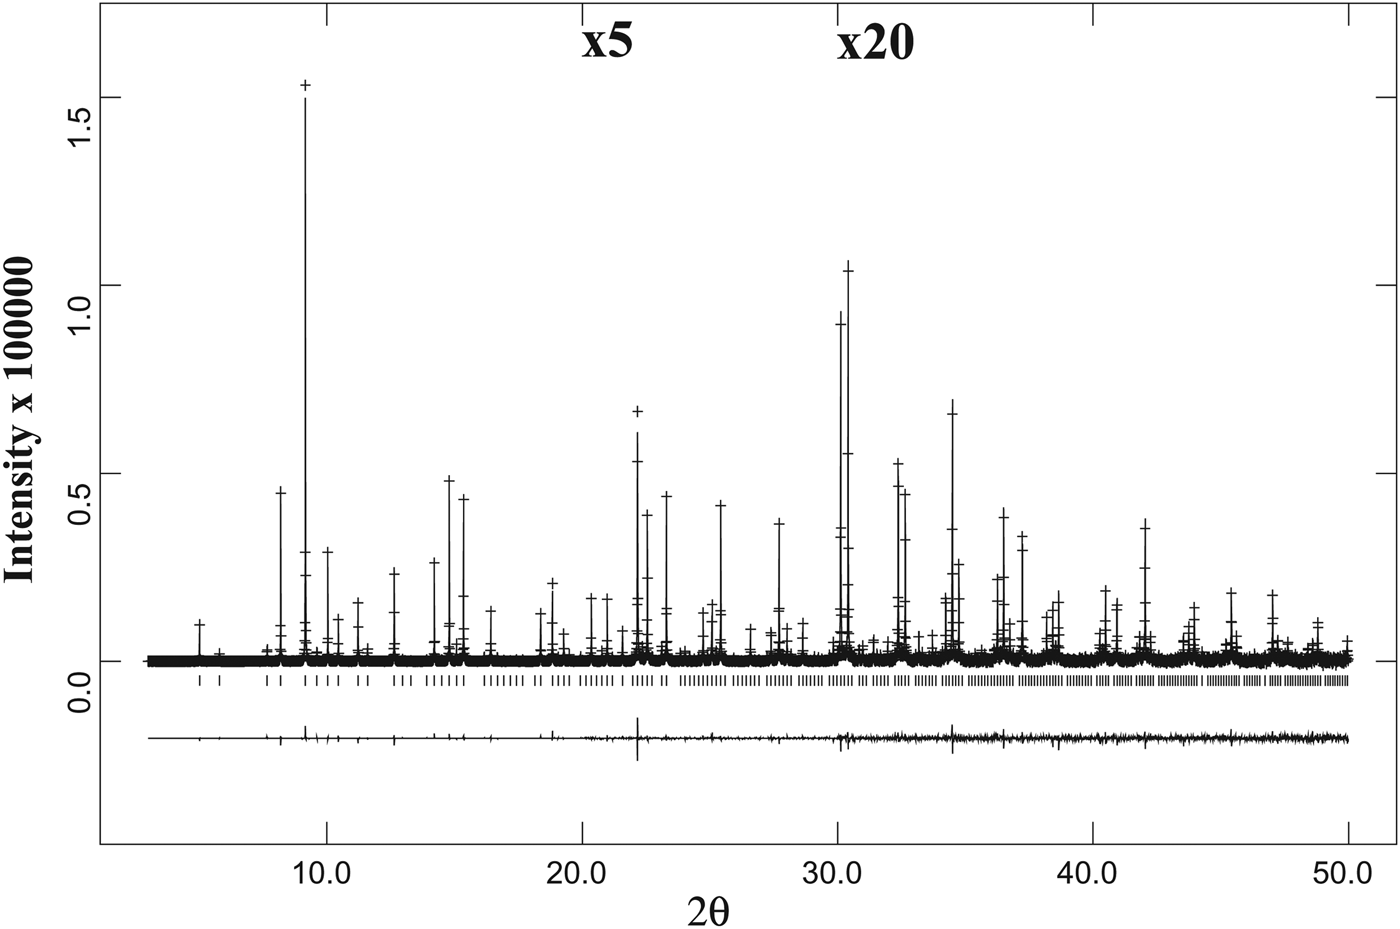
A full HRPXRD trace for the isotropic spessartine from Brazil. The difference curve (I obs − I calc) is shown at the bottom. The short vertical lines indicate allowed reflection positions. The intensities for the trace and difference curve that are above 20° and 30° 2θ are scaled by factors of ×5 and ×20, respectively.
Comparison of the same reflections in spessartine samples from (a) Brazil, (b) California, and (c) Tanzania. (d) The low-angle 2θ region for the Colorado sample shows a second phase on the right shoulder of reflections from phase-1. Except for the single-phase sample from Brazil with narrow peak widths (a), the other three data sets were fitted using two different cubic phases (b–d) that are clearly observed in the Tanzania sample (c) and in the low angle 2θ region of the Colorado sample (d). The two cubic phases in the California sample (b) are detected from the peak asymmetry and is a bit difficult to observe.

The unit-cell parameters and the Rietveld refinement statistics for the four samples are listed in Table II. Atom coordinates, isotropic displacement parameters, and sofs are given in Table III. Bond distances are given in Table IV.
Atom coordinatesa, isotropic displacement parameters, U (Å2), and sofs for four spessartine samples.
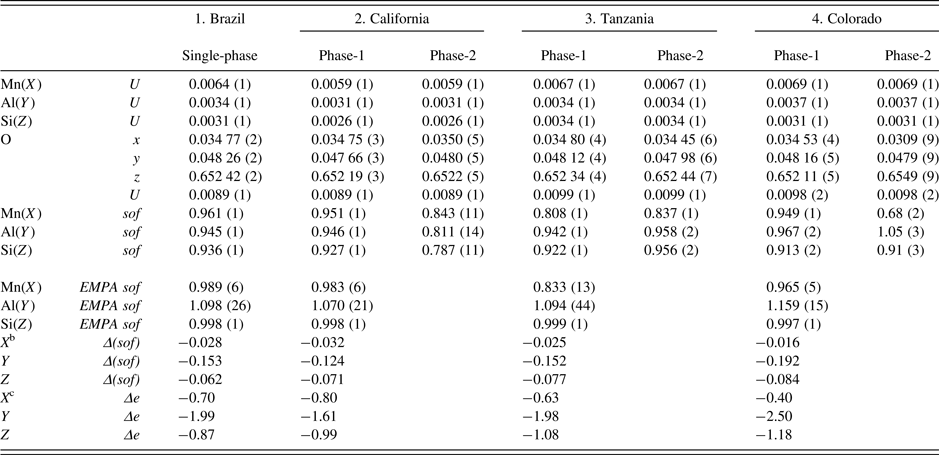
a X at (0, ¼, ⅛) with Mn dominant, Y at (0, 0, 0) with Al dominant, and Z at (⅜, 0, ¼) with Si dominant. In the two-phase refinement, the U for the same site was constrained to be equal.
bΔ(sof) = sof (HRPXRD refinement) – sof (EMPA).
cΔe = electrons (HRPXRD refinement) – electrons (EMPA). For sample-2, phase-2 (wt.% = 3), the Si(Z) sof may be underestimated because the Si–O distance is about the same as in the other samples (Figure 5).
Selected distances (Å) for four spessartine samples.
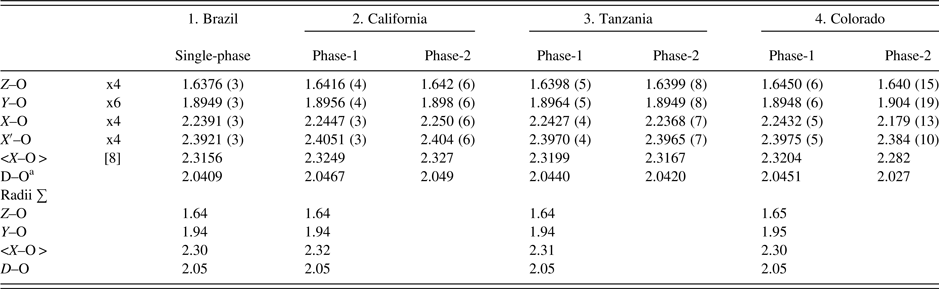
aD–O = {(Z–O) + (Y–O) + (X–O) + (X′–O)}/4. For the calculated radii sum distances, denoted by X in Figure 5, the following radii from Shannon (Reference Shannon1976) were used (X site: Fe2+ = 0.92, Mn2+ = 0.96, Mg = 0.89 Å, Ca = 1.12 Å; Y site: Ti4+ = 0.605, Al = 0.535, Cr3+ = 0.615, Fe3+ = 0.645, Mn3+ = 0.645, Mg = 0.72 Å; Z site: Si = 0.26, Al = 0.39; O = 1.38 Å. These distances are shown in Figure 5 for comparison to published data.
III. RESULTS AND DISCUSSION
The EMPA results for the four homogeneous samples are (Table I):
-
(1) {Mn2+ 1.61Fe2+ 1.28Ca0.03}Σ2.92[Al1.96Fe3+ 0.12]Σ2.08(Si2.92Al0.08)Σ3O12, Sps54Alm43 (Brazil);
-
(2) {Mn2+ 2.70Fe2+ 0.24Ca0.01}Σ2.94[Al1.98Fe3+ 0.08]Σ2.06(Si2.94Al0.06)Σ3O12, Sps90Alm8 (California);
-
(3) {Mn2+ 2.03Mg0.81Ca0.10}Σ2.94[Al1.93Fe3+ 0.08Mn3+ 0.06]Σ2.06(Si2.94Al0.06)Σ3O12, Sps64Prp27 (Tanzania); and
-
(4) {Mn2+ 2.19Fe2+ 0.64Mg0.05Ca0.03}Σ2.90[Al1.88Fe3+ 0.20Ti4+ 0.02]Σ2.10(Si2.88Al0.12)Σ3O12, Sps73Alm19 (Colorado).
The dominant cation in the X site is Mn, Y site is Al, and Z site is Si. The X site in sample-2 contains the most Mn2+ cations (2.7 apfu). The Al atoms in the Y site are ≥1.9 apfu. The Si atoms in the Z site are 2.9 apfu in sample-4 from Colorado, which may indicate a minor OH content, but in the EMPA calculation, the Si deficiency is assumed to be filled with Al (Table I). Previous EMPA studies on other spessartine samples show the same general features (see the Introduction section).
The same diffraction peaks for three samples are compared (Figures 4(a)–4(c)), and that for sample-4 is for a different 2θ range (Figure 4(d)). Sample-1 is a single cubic phase and has sharp narrow peaks that show no splitting (Figure 4(a)). The peaks in the three birefringent samples are split into two, indicating two different cubic phases (Figures 4(b)–4(d)). The two phases in sample-2 are not clear, but they can be observed from the large peak width and asymmetry in the peak shape (Figure 4(b)). However, splitting of the reflections is clearly seen in Figures 4(c) and 4(d).
The sofs calculated from the EMPA chemical analysis are shown for comparison to the sofs obtained by the Rietveld refinements, and their values are similar (Table III). The deficient refinement sof values for the Si site indicate that there may be minor (O4H4) replacing SiO4, as the Si–O distance is nearly constant. The two separate phases in the birefringent samples could not be detected using EMPA, indicating that they occur as a fine-scale intergrowth. However, the HRPXRD technique clearly shows two different cubic phases (Figure 4). Many refinements of the garnet structure have used the single-crystal method, and those studies may miss the minor phases in birefringent multi-phase samples. The single-crystal method is not the appropriate technique to examine such multi-phase samples.
The unit-cell parameters and bond distances for the four samples compare well to each other and to other published work (Figure 5). In general, the calculated distances based on radii sum are also reasonable, so the EMPA results are acceptable (Table IV; Figure 5). Smyth et al. (Reference Smyth, Madel, McCormick, Munoz and Rossman1990; a = 11.628 Å) obtained a large cubic unit-cell parameter because their sample contains some (F,OH)4 groups that give rise to an Si–O = 1.656(1) compared to 1.637(1) Å for the anhydrous sample studied by Novak and Gibbs (Reference Novak and Gibbs1971). Our Brazil and Tanzania samples have Si–O = 1.6376 (3) and 1.6398 (5) Å, respectively (Table IV). However, our California and Colorado samples have Si–O = 1.6416 (4) and 1.6450 (6) Å, respectively. These larger values indicate minor O4H4 substitution for SiO4, as is indicated by the chemical analyses, especially for the sample from Colorado (Table I).
(Color online) Structural variations across the part of the pyralspite series. The mean <D–O> distance varies linearly with the a parameter across the full series. Linear trend lines are based on literature data and only some relevant data points are displayed [see Antao (Reference Antao2013b) for details]. Data of this study are between those from Smyth et al. (Reference Smyth, Madel, McCormick, Munoz and Rossman1990; a = 11.628 Å) and almandine (Alm; a = 11.531 Å).

In ideal spessartine, the X and Y sites are completely occupied with Ca and Al atoms, respectively, so the question of cation order does not arise. In our birefringent spessartine samples, all the diffraction peaks in the HRPXRD trace belongs to two cubic phases. There is no impurity or un-indexed peaks. All the refinements were done in the cubic space group, so spessartine contains no cation order.
Based on thin-film observations, the ideas presented by Kitamura and Komatsu (Reference Kitamura and Komatsu1978) can explain the birefringence in the samples used in this study and those birefringent garnet samples used in the previous studies that show concentric, oscillatory, or lamellar zoning, or tweed-like features (e.g., Akizuki, Reference Akizuki1984; Antao and Klincker, Reference Antao and Klincker2013a; Badar et al., Reference Badar, Niaz, Hussain and Akizuki2013). If a garnet sample contains a few cubic phases, a fine-scale mixture will show birefringence and EMPA will show a homogeneous sample. If the phases occur as large-scale lamellae, EMPA will show compositional variations. In both cases, HRPXRD will show different cubic unit-cell parameters. So a unique solution to the birefringence problem in spessartine is provided where two-phase intergrowths result in mismatch of the cubic structural parameters that gives rise to strain-induced birefringence. Similar multi-phase intergrowths occur in other birefringent samples such as andradite (Antao, Reference Antao2013a, Reference Antao2013b; Antao and Klincker, Reference Antao and Klincker2013a), grossular (Antao, Reference Antao2013c), spessartine (this study), almandine, morimotoite, schorlomite, uvarovite, etc. (unpublished results). Isotropic garnet occurs as a single cubic phase. The two-phase intergrowth in spessartine is similar to hetero-epitaxial or epitaxial intergrowths because of the similarity of the structural parameters.
The formation of two-phase intergrowths may be related to changes in oxygen fugacity (f O2), activity of SiO2 (a SiO2), etc., as the crystals grow at low temperature that prevents diffusion or homogenization. Alternatively, the multiphase assemblage may be the stable form. Intergrowths in minerals are not uncommon and were also observed in the helvine-group minerals (Antao and Hassan, Reference Antao and Hassan2010), apatite (Baikie et al., Reference Baikie, Schreyer, Wong, S.S., Klooster, Ferraris, McIntyre and White2012), and many silicate garnets.
ACKNOWLEDGEMENTS
R. Marr is thanked for help with the EMPA data collection. The HRPXRD data were collected at the X-ray Operations and Research beamline 11-BM, Advanced Photon Source (APS), Argonne National Laboratory (ANL). Use of the APS was supported by the US Department of Energy, Office of Science, Office of Basic Energy Sciences, under Contract No. DE-AC02-06CH11357. This work was supported with a NSERC Discovery Grant and an Alberta Ingenuity Award to SMA.


