


Introduction
Electroconvulsive therapy (ECT) is currently the most effective intervention for patients with treatment resistant depression. Despite its high efficacy, ECT remains underutilized, as only 1–2% of patients with severe or persistent depression receive ECT (Slade, Jahn, Regenold, & Case, Reference Slade, Jahn, Regenold and Case2017). Although approximately 48% of treatment resistant patients recover with ECT, it is also associated with adverse cognitive effects and may be regarded as more invasive than other treatment options because the use of anesthesia is necessary (Heijnen, Birkenhager, Wierdsma, & van den Broek, Reference Heijnen, Birkenhager, Wierdsma and van den Broek2010). Furthermore, ECT is relatively expensive and non-responsiveness can only be determined after multiple sessions. Information that better predicts treatment outcome would enable patient selection thereby further improving the overall response rate and avoiding ineffective treatment with adverse effects. A personalized recommendation about the expected benefit of ECT could provide a valuable addition to the treating physician's clinical judgement and may increase its use in clinical practice.
Meta-analyses of studies that investigated predictors of ECT outcome have associated several clinical characteristics with beneficial ECT outcome, in particular no history of treatment resistance, older age, and presence of psychotic symptoms (Haq, Sitzmann, Goldman, Maixner, & Mickey, Reference Haq, Sitzmann, Goldman, Maixner and Mickey2015; van Diermen et al., Reference van Diermen, van den Ameele, Kamperman, Sabbe, Vermeulen, Schrijvers and Birkenhager2018). However, the effect sizes are small, limiting their use to guide individual patient selection. Recent studies have started using neuroimaging data to predict ECT outcome at the individual level using machine learning analysis, which can construct multivariate prediction models using all the available data. Initial small-scale studies have shown that both structural magnetic resonance imaging (MRI) and functional MRI findings can be used to predict ECT outcome with approximately 80% accuracy (Redlich et al., Reference Redlich, Opel, Grotegerd, Dohm, Zaremba, Burger and Dannlowski2016; van Waarde et al., Reference van Waarde, Scholte, van Oudheusden, Verwey, Denys and van Wingen2015). These initial results have been confirmed by subsequent studies, and a recent meta-analysis showed an average prediction accuracy of 82% and area under the receiver operator characteristic curve (AUC) of 83% (Cohen, Zantvoord, Wezenberg, Bockting, & van Wingen, Reference Cohen, Zantvoord, Wezenberg, Bockting and van Wingen2021), which is considered to be excellent discrimination between groups (Hosmer, Lemeshow, & Sturdivant, Reference Hosmer, Lemeshow and Sturdivant2013). Furthermore, a recent study using routine MRI data to predict ECT outcome in a relatively large sample of 71 patients reached an accuracy of 69% accuracy (Gartner et al., Reference Gartner, Ghisu, Herrera-Melendez, Koslowski, Aust, Asbach and Bajbouj2021).
Despite these promising results, the existing studies have been limited by small sample sizes and monocenter settings. This reduces the possibility for models to generalize to new patients across centers. Although machine learning models typically perform better when trained on large samples from the same center, classification accuracy of larger multicenter studies tends to decrease, presumably due to increased clinical (e.g. adults v. elderly) and technological (e.g. different MRI hardware and protocols) variability across centers (Schnack & Kahn, Reference Schnack and Kahn2016). In order to develop robust and generalizable neuroimaging biomarkers for ECT outcome, we used data from the Global ECT-MRI Research Collaboration (GEMRIC) and validated classification performance in a multicenter setting (Oltedal et al., Reference Oltedal, Bartsch, Sørhaug, Kessler, Abbott, Dols and Oedegaard2017). We used multimodal data (i.e. clinical, structural MRI [sMRI], and resting-state functional MRI [rs-fMRI]) and evaluated which data modalities or combinations thereof might provide the best predictions. Remission (17-item Hamilton Depression Rating Scale (HAM-D) score of ⩽7 after treatment) was used as the primary outcome criterion. Remission may provide a better outcome criterion than response (at least 50% HAM-D reduction compared to baseline) and has become the gold standard for depression treatment, because patients who do not remit have a poorer prognosis and greater chance of relapse and recurrence than those who do (McIntyre & O'Donovan, Reference McIntyre and O'Donovan2004; van Diermen et al., Reference van Diermen, van den Ameele, Kamperman, Sabbe, Vermeulen, Schrijvers and Birkenhager2018). Additionally, as most sites only contributed a small sample, we also evaluated model performance when only data from centers with ⩾20 patients were used to provide classifiers with a minimum of approximately 10 examples per class per center, which potentially could increase classification performance (Abraham et al., Reference Abraham, Milham, Di Martino, Craddock, Samaras, Thirion and Varoquaux2017). Finally, we visualized the brain regions that were most informative to the classifications, in order to gain insight into the brain regions predictive of ECT outcome. To adhere to guidelines on reporting of diagnostic studies, we report our findings based on TRIPOD guidelines (Moons et al., Reference Moons, Altman, Reitsma, Ioannidis, Macaskill, Steyerberg and Collins2015).
Methods
Participants
We performed a retrospective study using data from GEMRIC (v3.1, DOI:10.17605/OSF.IO/WD436), an international consortium that contains the largest multicenter database of neuroimaging scans of patients treated with ECT (Oltedal et al., Reference Oltedal, Bartsch, Sørhaug, Kessler, Abbott, Dols and Oedegaard2017). All contributing sites received ethics approval from their local ethics committee or institutional review board. In addition, the centralized mega-analysis was approved by the Regional Ethics Committee South-East in Norway (No. 2018/769) (Oltedal et al., Reference Oltedal, Narr, Abbott, Anand, Argyelan, Bartsch and Dale2018). Analyses contained a selection of sMRI and rs-fMRI data from seven centers across Europe and North America, recorded from 189 clinically depressed patients according to ICD-10 (167 unipolar, 22 bipolar; see online Supplementary Table S1 for diagnoses per center) who had received right unilateral or bilateral ECT (or both). Depressed patients were eligible for ECT, typically after failure to respond to first-line treatments with conventional psychotherapy and antidepressant medications. The patients were included because of the availability of both high quality sMRI and rs-fMRI data. ECT parameters varied between different centers, including electrode placement. A description of center-specific ECT procedures and image acquisition is provided elsewhere (Oltedal et al., Reference Oltedal, Bartsch, Sørhaug, Kessler, Abbott, Dols and Oedegaard2017). As GEMRIC consists of samples ranging from very small to relatively large (N = 14, 14, 15, 18, 19, 29, 38, 42), we performed all analyses on the entire cohort and on centers with ⩾20 patients available (three centers, N = 109) in order to ensure classifiers were provided with sufficient data per center.
Choice of primary measure
Treatment outcome was measured using the HAM-D or Montgomery-Åsberg Depression Rating Scale (MADRS) that was converted to HAM-D (online Supplementary Methods), which are gold standard ratings for depression severity. Remission (minimal symptoms) was used as the primary outcome criterion and defined as post-ECT HAM-D score ⩽7.
MRI data and preprocessing
MRI acquisition parameters are listed in online Supplementary Tables S2 and S3. Structural T1-weighted scans were acquired using 1.5 T and 3 T scanners with a minimum resolution of 1.33 mm3 and preprocessed using the CAT12 toolbox (v12.6; http://www.neuro.uni-jena.de/cat/) for voxel-based morphometry (VBM). Images were segmented into gray matter (GM), white matter (WM), and cerebrospinal fluid (CSF), normalized to MNI space using DARTEL registration, resampled to 1.5 mm3 isotropic and spatially smoothed with an 8 mm isotropic Gaussian kernel. GM volumes were masked at 0.2 to exclude WM.
150–266 rs-fMRI volumes were acquired with a TR of 1.7–3.0s, in-plane resolution of 2.4–3.75 mm, and slice thickness of 3–5 mm. Preprocessing was performed using ANTs (v2.2.0; https://github.com/ANTsX/ANTs) and FSL (v5.0.10; http://fsl.fmrib.ox.ac.uk/), including brain extraction, boundary-based co-registration, motion correction, spatial smoothing with a 5 mm isotropic Gaussian kernel, and normalization to a 2 mm MNI template. Denoising was performed using ICA-AROMA, and depending on the type of analysis, high-pass (f > 0.01) or bandpass filtering (0.009 < f < 0.08) was applied together with WM and CSF nuisance regression (Pruim et al., Reference Pruim, Mennes, van Rooij, Llera, Buitelaar and Beckmann2015). Denoised rs-fMRI data were resampled to 4 mm isotropic.
Only subjects that passed quality control for both rs-fMRI and sMRI were included for analysis, leading to a final sample of 189 patients (online Supplementary Fig. S1 for a flowchart). Further details on MRI preprocessing and quality control are provided in online Supplementary Methods.
Feature extraction
We extracted commonly used MRI features from the preprocessed data. For sMRI, we used voxel-wise modulated GM maps (VBM) and 142 cortical and subcortical parcellations using the Neuromorphometrics atlas (NMM; provided by Neuromorphometrics, Inc). For rs-fMRI, we used a high-dimensional resting-state networks template from the UK BioBank dataset to extract 100 independent spatial components that were derived using group independent component analysis (ICA) (Alfaro-Almagro et al., Reference Alfaro-Almagro, Jenkinson, Bangerter, Andersson, Griffanti, Douaud and Smith2018). 45 components reflecting non-neural signals and three components mainly located in cerebellar regions with insufficient EPI coverage were discarded, resulting in 52 components for analysis. Group information guided ICA was used to derive subject-specific time-series and spatial maps for each of the 52 signal components using the high-pass filtered preprocessed data (Du & Fan, Reference Du and Fan2013). Time-series were used to calculate individual functional connectivity (FC) matrices that described pairwise connectivity between signal components with Pearson correlations (ICA-FC). Additionally, we used an atlas-based approach from Power et al. and extracted time-series from 264 functional areas to compute FC matrices (Power FC) using the bandpass filtered preprocessed data (Power et al., Reference Power, Cohen, Nelson, Wig, Barnes, Church and Petersen2011). Correlations were converted to z-scores with Fisher r-to-z transformation before performing the classification. The total number of features used were: 406 929 for voxel-wise VBM maps, 142 for NMM parcellations, 37 401 for Power-based FC, 1378 for ICA-based FC, and 26 629 for each of the 52 ICA spatial components identified as signal. Further details on feature extraction are provided in online Supplementary Methods.
Machine learning
Machine learning classifications were performed using linear support vector machine classifiers [SVM; LIBSVM for Python (https://www.csie.ntu.edu.tw/~cjlin/libsvm/) implemented in scikit-learn (v0.23.1; https://scikit-learn.org/)] and validated using stratified shuffle-split cross-validation (CV) with 100 iterations. At each iteration, data were randomly divided into independent training (80%) and test (20%) sets while preserving the proportion of remitters and non-remitters from each center to obtain maximally homogeneous splits. The model was always trained only on the training set and evaluated on the test set. The entire procedure was then repeated 100 times and the test performance is averaged as the final performance evaluation. This CV procedure is further referred to as ‘internal validation’. In addition, we performed leave-one-site-out (LOSO) CV, in which all but one center was used to train the SVM while the remaining center was used to assess model performance (further referred to as ‘external validation’). This procedure was repeated so that each center was used once for testing. LOSO reduces the risk of overfitting to data from a single center but may result in large between-sample heterogeneity of training and test sets, which could result in lower classification performance compared to internal validation. Hyper-parameters for the linear SVM were optimized using nested CV: a grid-search was performed across different values of C (0.001, 0.01, 0.01, 01, 1, 10, 100) using 10 inner stratified shuffle splits (this was done for both ‘internal’ and ‘external’ validation). We assessed classification performance using different sets of MRI features (VBM, NMM, ICA-DR FC, Power FC, and ICA spatial components), as well as using clinical data only (i.e. age, sex, and pre-ECT HAM-D scores) for baseline classification. Clinical data were always included for each classification. The primary performance metric was the AUC and reported metrics were averaged across CV iterations. Balanced accuracy, sensitivity, specificity, positive predictive value (PPV), and negative predictive value (NPV) are reported in online Supplementary Tables S6–S13.
Statistical significance of classification performance relative to chance was assessed using label permutation testing with 1000 iterations (Ojala & Garriga, Reference Ojala and Garriga2010). Obtained p values were corrected for multiple comparisons using False Discovery Rate (FDR; two-stage [non-negative]; alpha = 0.05). 95% confidence intervals (CI) for AUC were computed using the modified Wald-method (Kottas, Kuss, & Zapf, Reference Kottas, Kuss and Zapf2014). To reduce the computational burden, only spatial ICA classifications that resulted in acceptable discrimination (>0.7 AUC) between groups were tested for significance (Hosmer et al., Reference Hosmer, Lemeshow and Sturdivant2013). Finally, we assessed classification performance for multimodal classifications combining anatomical and functional data using feature concatenation: regional neuromorphometrics GM volumes with either ICA or Power-atlas-based FC, and voxel-wise GM with either ICA or Power-atlas-based FC. FDR correction was applied separately for classification results obtained using either internal or external validation; the full dataset or three largest centers only; and for unimodal, multimodal, and individual ICA spatial components, leading to 12 distinct families with qFDR set to 0.05/12 = 0.00417. Details on classifier hyperparameter optimization and statistical significance testing are provided in online Supplementary Methods.
Anatomical localization
To investigate which regions contributed most to the classification, we employed a method to estimate p values for the weights of the SVM (Gaonkara, Shinohara, & Davatzikos, Reference Gaonkara, Shinohara and Davatzikos2016). A statistic was computed incorporating the SVM weight component value and the size of the margin, and an analytical approximation to the null-distribution obtained through permutation testing was used to calculate p values. We only report p value feature importances for our best performing unimodal and multimodal models.
Results
Demographic data
Demographic data are presented in Table 1. Of the 189 included patients, 76 were remitters and 113 non-remitters. In line with previous literature, remitting patients were older and showed more presence of psychotic symptoms (van Diermen et al., Reference van Diermen, van den Ameele, Kamperman, Sabbe, Vermeulen, Schrijvers and Birkenhager2018). No significant differences in sex, initial electrode placement, symptom severity at baseline, and total number of ECT sessions were observed.
Demographics of patients included in data analysis, with subject demographics and comparisons between ECT remitters and non-remitters
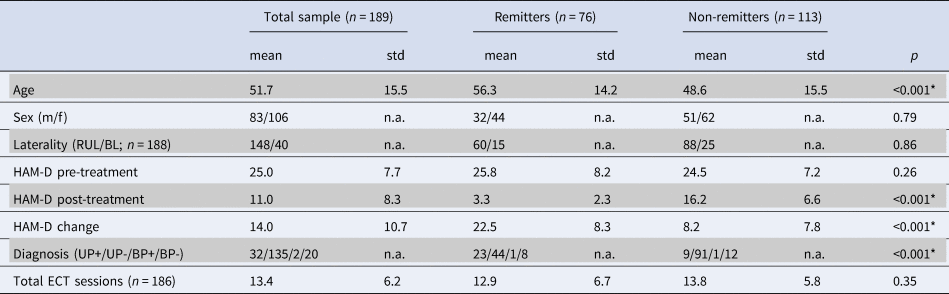
Abbreviations: BL, bilateral ECT initially; BP, bipolar depression with/without psychotic symptoms (BP+/−); f, female; HAM-D, Hamilton Rating scale for depression; m, male; n.a., not available; RUL, right unilateral ECT initially; UP, unipolar depression with/without psychotic symptoms (UP+/−). Asterisks depict significance using independent t test or χ2 test.
We assessed differences in sample demographics and clinical characteristics between different centers regardless of ECT outcome using one-way analysis of variance (ANOVA) and χ2. Age [F(7181) = 14.08, p < 0.001), pre-treatment HAM-D scores (F(7181) = 7.40, p < 0.001], post-treatment HAM-D scores [F(7181) = 5.24, p < 0.001], HAM-D change [F(7181) = 8.65, p < 0.001], number of ECT sessions [F(7178) = 10.78, p < 0.001], depression type [X2(21, N = 189) = 77.58, p < 0.001], and initial electrode placement [X2(7, N = 189) = 109.8, p < 0.001] differed significantly between centers. In contrast, sex did not differ between centers [X2(7, N = 189) = 3.84, p = 0.80]. Demographic data for the three largest centers (with N ⩾ 20) used for additional analyses are described in online Supplementary Tables S5 and S6. Differences in sample demographics and clinical characteristics between the three largest centers were similar to those seen in the entire sample. These findings highlight that there is considerable clinical heterogeneity between centers.
Remission prediction
All centers
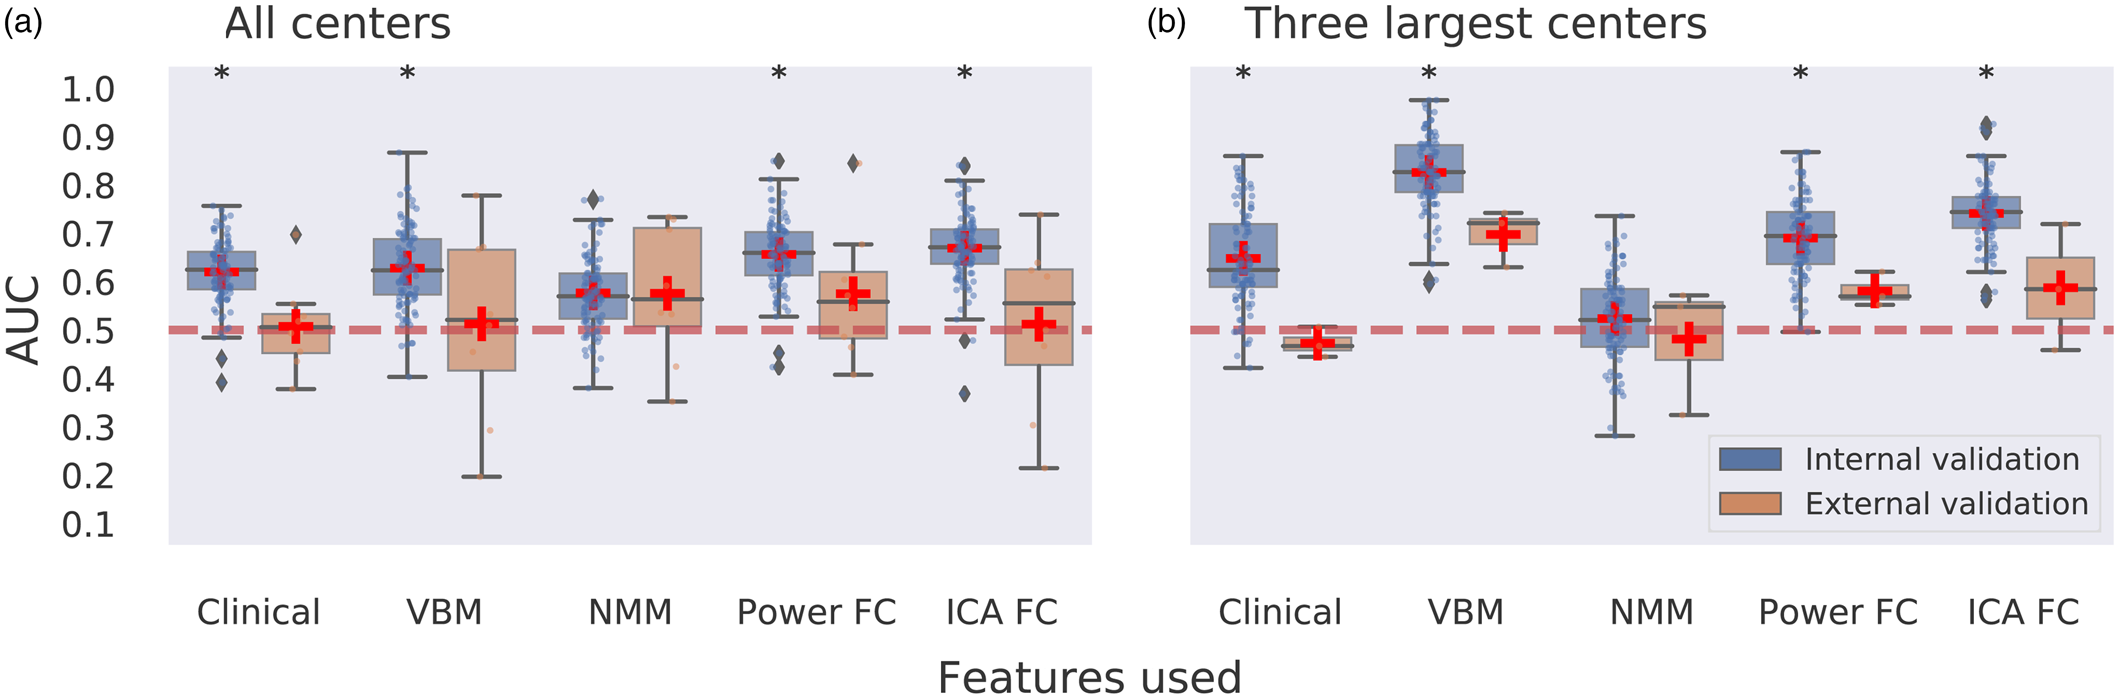
Unimodal neuroimaging: Performance for remission classification was evaluated with internal (site stratified shuffle splits) cross-validation across centers using all samples (N = 189). Remission classification performance was poor with AUCs (averaged across 100 CV iterations) ranging between 0.58 and 0.67 for clinical data only (i.e. age, sex, and pre-ECT HAM-D scores) and VBM, NMM, ICA-FC, and Power-FC feature sets that also included the clinical data in all analyses (Fig. 1a). Nonetheless, these AUCs—except for NMM—were statistically significant following permutation testing with multiple comparison correction. Classification using external (LOSO) cross-validation hardly exceeded chance-level performance, with AUCs (averaged across sites) ranging between 0.51 and 0.58 and none were statistically significant (Fig. 1a). Classification using ICA networks did not exceed AUC > 0.7 for either internal or external validation. Notably, one ICA component centered around the anterior temporal lobes that included the amygdala and hippocampus resulted in 0.70 AUC but did not obtain statistical significance following with multiple comparison correction (pFDRcorrected = 0.2078; puncorrected = 0.0019) (Fig. 2a). More comprehensive classification results, including balanced accuracy, sensitivity, specificity, PPV, and NPV, p values for AUC statistical significance and 95% CIs, are provided in online Supplementary Table S7.
Multicenter predictions for ECT treatment remission using unimodal MR data modalities. Panel a depicts classification performance using data from all centers and different MR modalities with internal validation (AUC is averaged over 100 stratified cross-validation splits) and external validation (leave-one-site-out cross-validation, scores are averaged across different centers left out for model testing). Panel b depicts classification performance using data from the three largest centers with internal and external validation. VBM, voxel-based morphometry; NMM, Neuromorphometrics atlas; FC, functional connectivity; ICA, group information guided independent component analysis. Red dashed line depicts chance-level performance (0.5 AUC). Asterisks indicate significant difference from chance level after permutation testing with false discovery rate correction for multiple comparisons (p < 0.05, corrected).
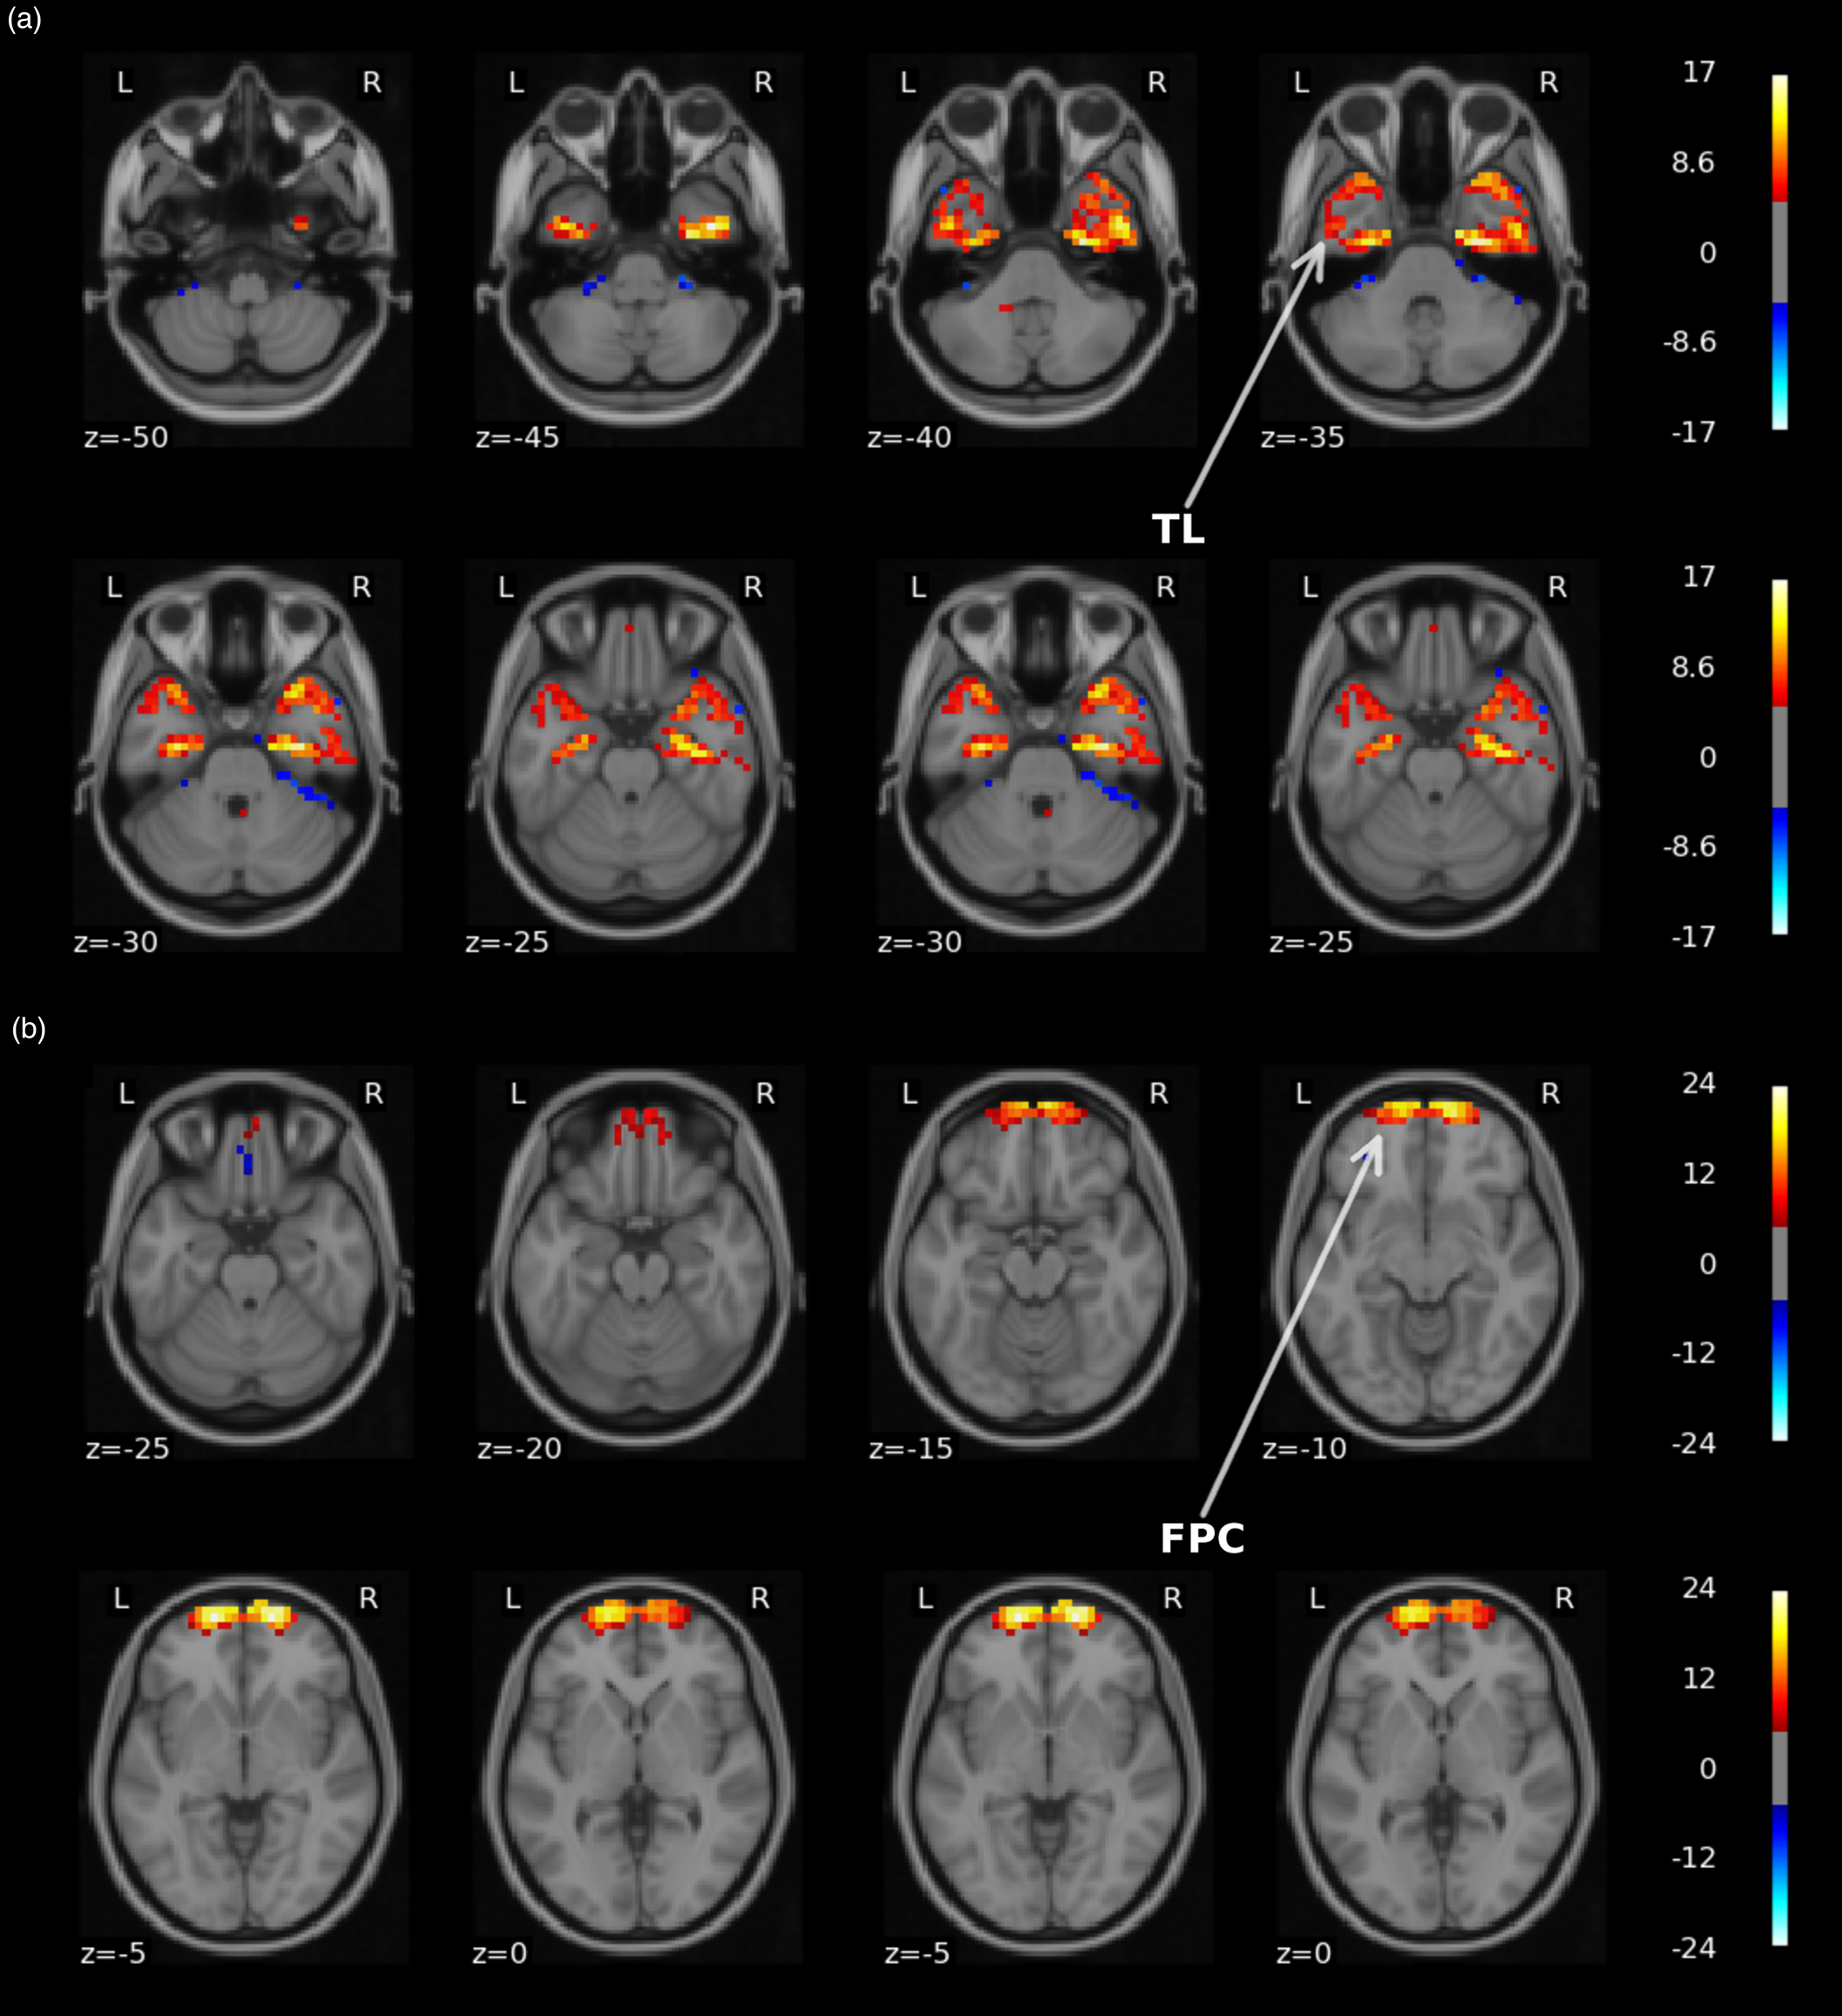
Visual representation of the two UK BioBank group ICA spatial components that led to AUC > 0.75 for either response or remission classification. Top panel a depicts a network (#42) centered around the temporal lobes (TL). The second panel b shows a network (#52) located in frontopolar cortex (FPC). Images are thresholded at Z ⩾ 5 and overlaid on a standard 2 mm MNI template. The figure was made with the nilearn package (http://nilearn.github.io).
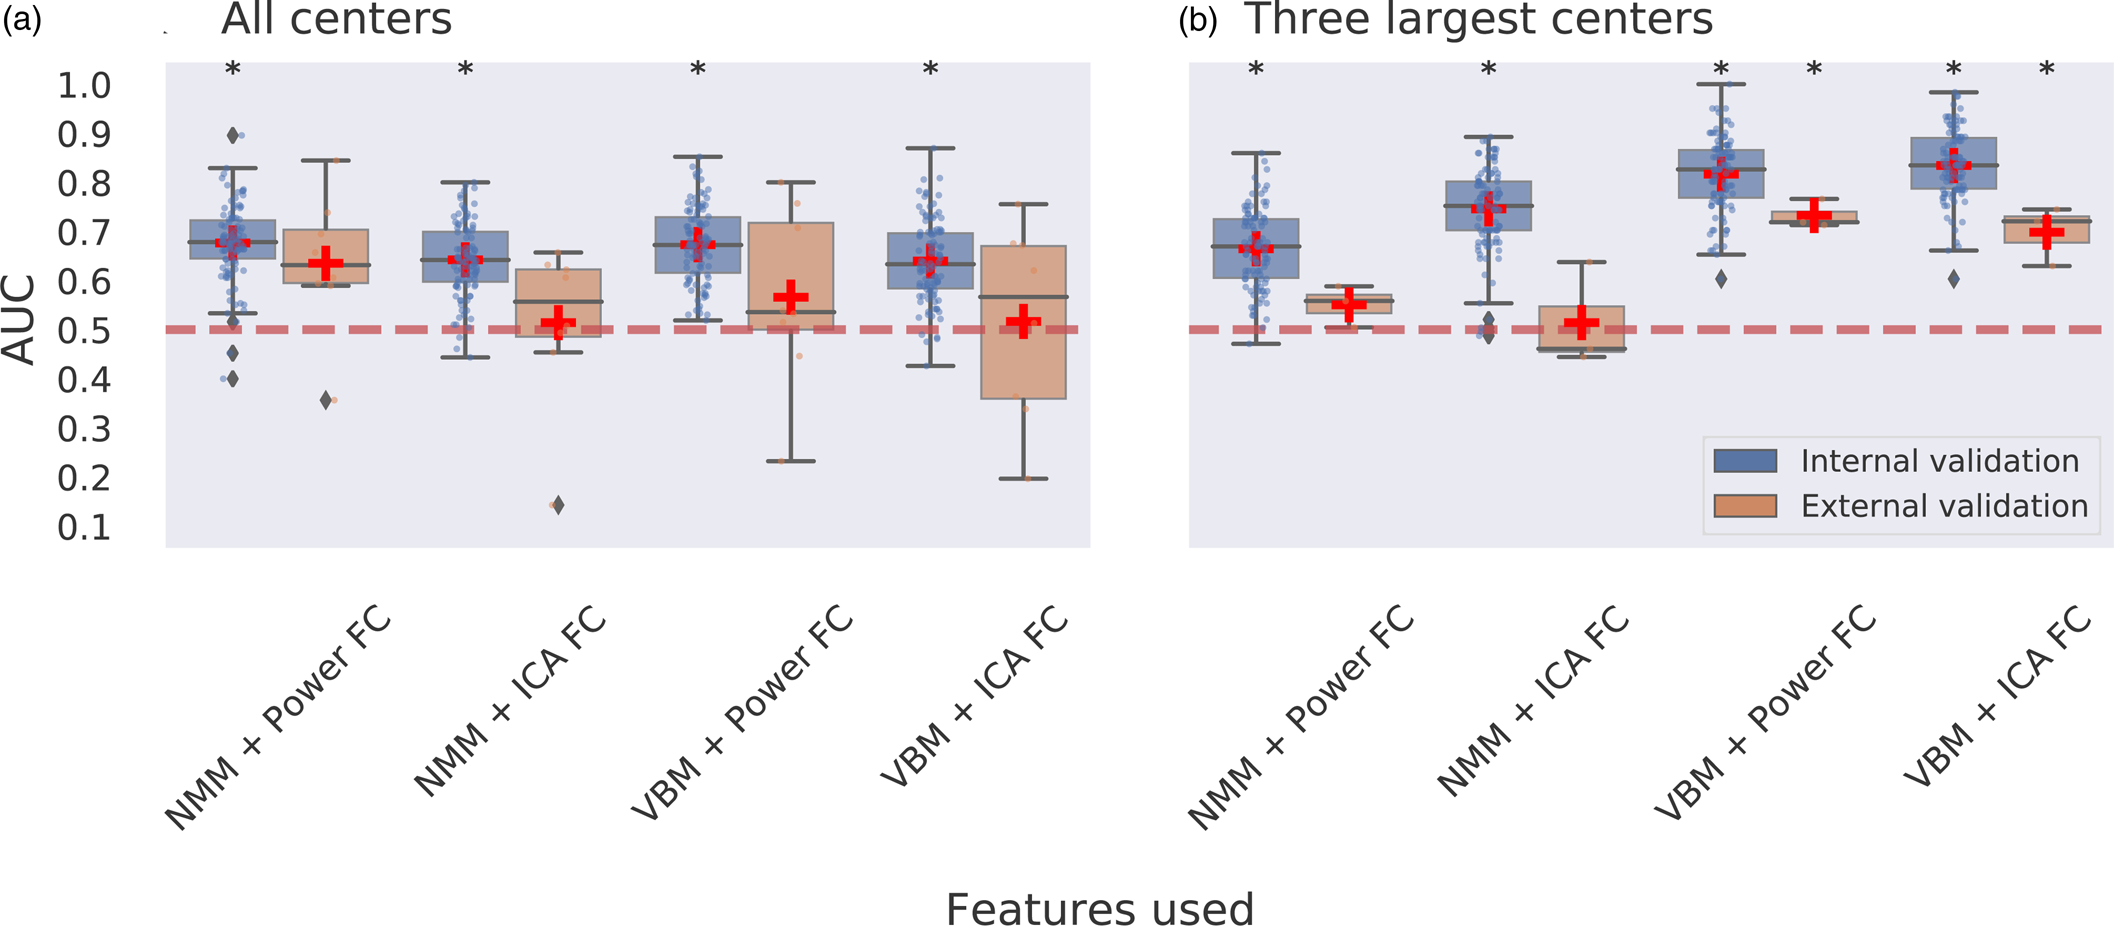
Multimodal neuroimaging: Classification using a combination of sMRI, fMRI, and clinical data led to a maximum of 0.68 AUC using internal validation which was significantly different from chance level and a maximum of 0.64 AUC for external validation which did not obtain significance (Fig. 3a; online Supplementary Table S8).
Multimodal multicenter predictions for ECT treatment remission. Panel a depicts classification performance using data from all centers and different combinations of features with internal validation (AUC is averaged over 100 stratified cross-validation splits) and external validation (leave-one-site-out cross-validation, scores are averaged across different centers left out for model testing). Panel b depicts classification performance using data from the three largest centers with internal and external validation. VBM, voxel-based morphometry; NMM, Neuromorphometrics atlas; FC, functional connectivity; ICA, group information guided independent component analysis. Red dashed line depicts chance-level performance (0.5 AUC). Asterisks indicate significant difference from chance level after permutation testing with false discovery rate correction for multiple comparisons (p < 0.05, corrected).
Three largest centers
Unimodal neuroimaging
We next assessed prediction performance only using data from three centers with N ⩾ 20 (N = 109) to provide the machine learning classifier with sufficient samples per center. Classification performance with internal validation ranged between 0.52 and 0.83 AUC across different features used, and 0.65 AUC was obtained for classifications using clinical variables only (Fig. 1b). All these AUCs, except for NMM, showed statistical significance. Notably, the highest performance was achieved using voxel-wise GM data with 0.83 AUC. Two out of 52 ICA networks resulted in AUC > 0.7 (Fig. 2). One component centered around the temporal lobes resulted in 0.75 AUC, and a frontopolar network resulted in 0.80 AUC, but neither obtained statistical significance after multiple comparison correction. Classifications performed with external validation ranged between 0.47 and 0.70 AUC (Fig. 1b). The performance obtained with voxel-wise GM data using internal validation was reduced from 0.83 AUC to 0.70 AUC with external validation and failed to obtain statistical significance following permutation testing with multiple comparison correction (pFDRcorrected = 0.0899; puncorrected = 0.0089). None of the ICA networks resulted in AUC > 0.7 with external validation (online Supplementary Table S9).
Multimodal neuroimaging
Classification combining voxel-wise GM with ICA-based FC led to the best performing model, with 0.83 AUC using internal validation and 0.70 AUC using external validation. Classifications for voxel-wise GM with the Power-atlas FC led to similar performances of 0.82 AUC for internal validation and 0.73 AUC for external validation. All of the aforementioned AUCs were statistically significant for both internal and external validation (Fig. 3b). Classification performance for regional NMM with ICA-based FC resulted in 0.75 AUC with internal validation and 0.51 AUC for external validation. Classifications for regional NMM with Power-atlas FC led to 0.67 AUC using internal validation and 0.55 AUC for external validation. AUCs obtained for classifications using regional neuromorphometrics and FC were statistically significant for internal validation but not for external validation (online Supplementary Table S10).
Response and post-ECT severity prediction
As previous predictive studies and clinical trials have used both remission (HAM-D score of ⩽7 after treatment) and response (at least 50% HAM-D score reduction compared to baseline) as outcome criterion, we additionally assessed response classification performance. Of the 189 included patients, 113 patients were ECT responders and 76 non-responders. Demographics of the included sample and results for response prediction are provided in online Supplementary Results (online Supplementary Figs. S2 and S3; online Supplementary Tables S2, S11–S14). To summarize, the majority of the classification models performed poorly with AUC < 0.7 with internal validation, and none of the models remained significant with external validation after permutation testing with FDR correction.
Additionally, we investigated whether regression could be used to directly predict post-ECT severity (i.e. HAM-D score) outcomes. To this end, we applied support vector regression (SVR) on data used for our best performing classification model (voxel-wise GM combined with ICA-based FC on the three largest samples with internal validation). The entire machine learning procedure, including nested grid-search for hyperparametrization, was performed identically as above. The results showed a positive significant correlation (r = 0.33, p < 0.001) between the predicted and post-ECT HAM-D scores (online Supplementary Fig. S4). However, other regression performance metrics like the R2 score (0.092) and mean absolute error (5.73 HAM-D scores) indicated poor overall performance.
Learning curves
To evaluate the relation between training sample size and classification performance, we examined learning curves for the best performing models (i.e. remission classification using data from the three largest centers) by using different proportions of training data. Classification accuracy reached 0.83–0.84 AUC for unimodal (voxel-wise GM) and multimodal (voxel-wise GM and ICA-based FC) classifiers, with averaged AUC > 0.75 for classifications using 50% of data for training (N = 55) and AUC > 0.8 for 70% of data used for training (N = 76). See online Supplementary Fig. S5 for full learning curves. Both learning curves did not appear saturated, suggesting that model performance could still increase when using larger training samples.
Anatomical localization
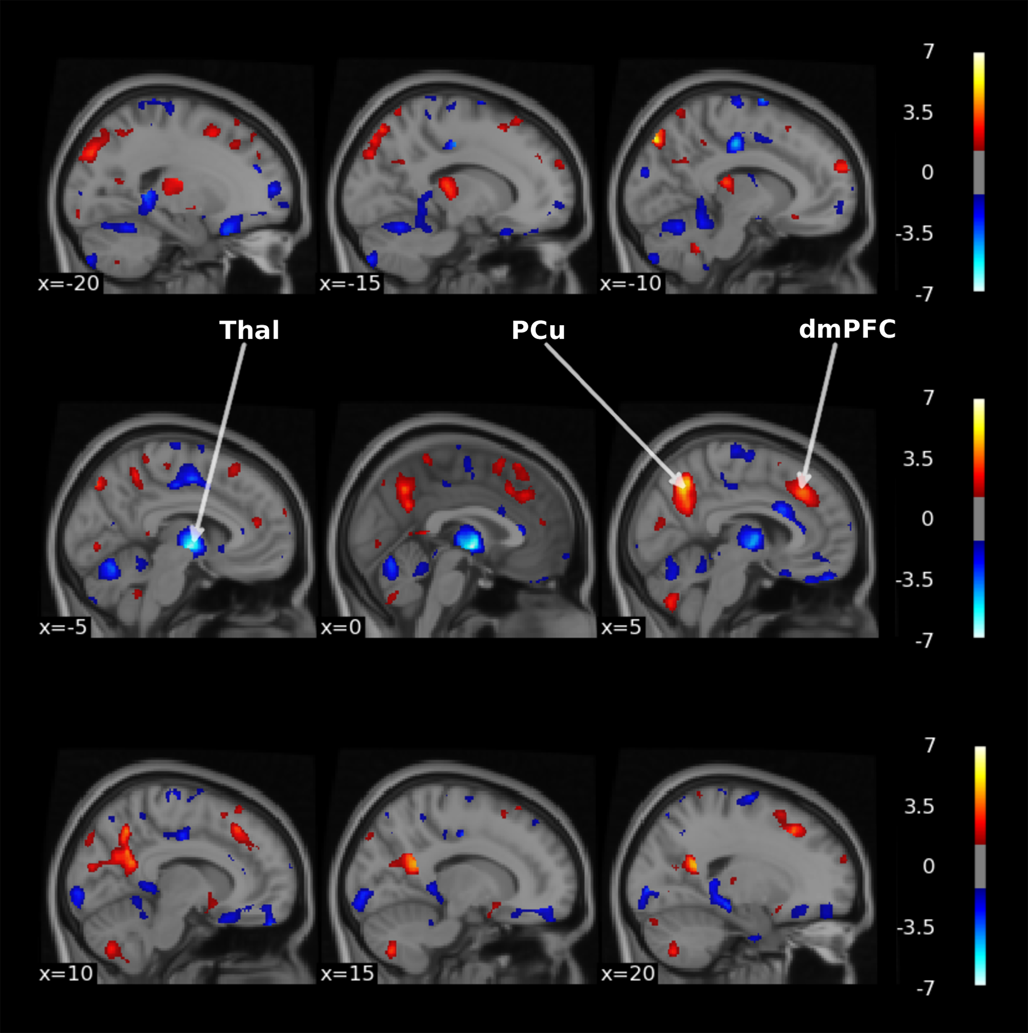
We investigated which brain regions contributed most to treatment classification for the best performing unimodal and multimodal models. Voxel-wise GM data from the three largest samples resulted in the best unimodal classification with an AUC of 0.83. The obtained feature importance p values were plotted for GM weights only as we were interested in brain regions rather than the influence of covariates. As shown in Fig. 4, regions located in dorsomedial prefrontal (dmPFC), precuneus and thalamus exhibited high contribution to the classification task. The sign of weights within thalamus was mostly negative, implying a high chance for non-remission classification, whereas signs of weights within dmPFC and precuneus were mostly positive, implying a high chance for remission classification. Note that these results reflected the contribution of these brain regions to the multivariate pattern used by the SVM classifier.
Thresholded-log(p) value maps characterizing the regions important for the treatment remission classification using voxel-wise GM data of the three largest centers (thresholded at p < 0.05 uncorrected). Hot colors indicate positive weights and cold colors indicate negative weights of the SVM. Thal, thalamus, PCu, Precuneus, dmPFC, dorsomedial prefrontal cortex. The figure was made with the nilearn package (http://nilearn.github.io).
Next, we investigated the most contributing brain regions in our best performing multimodal model (using a combination of voxel-wise GM and ICA-based FC). The resulting p values obtained for multimodal voxel-wise GM were visually identical to those obtained from the unimodal model described above (online Supplementary Fig. S6) and highly correlated to each other (r = 0.99, p < 0.001) with a dice similarity coefficient of 0.92. Similarly, the significant feature importances for ICA-based FC in both the unimodal (online Supplementary Fig. S7) and multimodal (online Supplementary Fig. S8) models were widespread, significantly correlated (r = 0.75, p < 0.001) but showed less similarity to each other (dice coefficient = 0.32). These findings seem to indicate that most of the GM features were retained in the multimodal approach, whereas the similarity between important features used for the ICA-based FC was lower.
Discussion
The presented results show that neuroimaging data can provide a good prediction of ECT remission for individual patients across different centers. In line with recent meta-analyses, older age and presence of psychotic symptoms at baseline were associated with better ECT outcome (van Diermen et al., Reference van Diermen, van den Ameele, Kamperman, Sabbe, Vermeulen, Schrijvers and Birkenhager2018). However, our classification results show that this information is not sufficient for making individual predictions, highlighting the relevance of obtaining neuroimaging data for accurate predictions. Remission classification using a combination of voxel-wise GM and clinical data with either ICA-based FC or Power-atlas-based FC led to models with excellent discrimination when trained and tested on samples coming from each center (internal validation AUC > 0.8) and remained acceptable when validated on completely new data from other centers (external validation AUC > 0.7) (Hosmer et al., Reference Hosmer, Lemeshow and Sturdivant2013). These results indicate that multimodal neuroimaging data may provide a biomarker that could be used to guide clinical decision making.
Feature importances obtained for voxel-wise GM in the unimodal and multimodal approach were visually identical and more similar compared to those obtained for unimodal and multimodal ICA-based FC, which could indicate that the multimodal classification was mainly driven by GM features. Although the best performing multimodal model showed higher performance compared to the best unimodal model using voxel-wise GM, the observed differences were small. Nonetheless, the multimodal models showed higher overall performance with external validation, which could translate into more clinical utility when deployed on entirely unseen sites. Future research should investigate whether more advanced data fusion approaches could further improve the performance of multimodal MRI data over GM only. Given the costs and human labor associated with MRI acquisition, the added value compared to conventional diagnostic tools (e.g. structured interviews and questionnaires) needs to be further evaluated. By providing patients and clinicians a patient-specific prognosis, this could ultimately increase the success rate of ECT, avoid ineffective treatments and accompanying adverse effects, and increase the use of the most effective antidepressive treatment available.
Our findings show that the prediction of treatment response was poor, while prediction of remission was good (see online Supplementary Results). This indicates that ECT outcome prediction is limited to remission and that the remission group can be best differentiated from the other patients. Remission may provide a better outcome criterion than response and has become the gold standard for depression treatment, because patients who do not remit have a poorer prognosis and greater chance of relapse and recurrence than those who do (McIntyre & O'Donovan, Reference McIntyre and O'Donovan2004; van Diermen et al., Reference van Diermen, van den Ameele, Kamperman, Sabbe, Vermeulen, Schrijvers and Birkenhager2018). Remission is also associated with a lower full symptomatic recurrence rate compared with achieving treatment response (McIntyre & O'Donovan, Reference McIntyre and O'Donovan2004). Furthermore, while unimodal and multimodal models performed comparable for remission classification using data from the largest centers with internal validation, only the multimodal classifications remained acceptable with external validation on different centers. We speculate that multimodal data may increase the probability that either the structural or functional MRI data overlaps across centers.
Previous monocenter studies using neuroimaging data to predict ECT outcome with either structural or functional MRI were able to obtain up to 0.83 AUC (Cohen et al., Reference Cohen, Zantvoord, Wezenberg, Bockting and van Wingen2021). Here, we achieved similar classification performance in a multicenter setting. Using data from different samples involves many additional sources of technological (e.g. different MR hardware and scanner protocols) and clinical (e.g. different ECT protocols, patient cohort, and recruitment procedures) variability (Schnack & Kahn, Reference Schnack and Kahn2016). These additional sources of variability may decrease prediction accuracy of MRI measurements for ECT outcome (Schnack & Kahn, Reference Schnack and Kahn2016). Conversely, a multicenter study avoids cohort-specific solutions and so helps test generalizability of the results across different samples, increasing the likelihood that features identified as discriminatory between remitters and non-remitters reflect generic properties related to treatment outcome across datasets. Our results showed that generalizability to new samples came at the cost of lower accuracy, as best performing classifications with internal validation (AUC ≈ 0.83) outperformed those using external validation (AUC ≈ 0.73). Additionally, we found that using a subsample of the data containing three centers with N ⩾ 20 each (N = 109) led to better model performance compared to using all seven centers (N = 189). This improvement could not be attributed solely to reduced clinical heterogeneity, as differences in sample demographics and clinical characteristics between the three largest centers were found to be similar to those seen in the entire sample (online Supplementary Tables S5 and S6). We therefore hypothesize that the exclusion of smaller centers ensured that the model had sufficient examples per center for training. With regard to clinical heterogeneity specifically, our sample included patients with unipolar (UP) and bipolar (BP) depression. We evaluated whether the classification performance was similar between UP and BP patients for our best performing model. Both patient groups showed good classification performance: metrics calculated for BP only resulted in a balanced accuracy of 0.64 and AUC of 0.74, whereas results for MDD showed a balanced accuracy of 0.74 and AUC of 0.84. We expect that the higher performance for MDD is due to a better representation of this group in the training set. As ECT is indicated for both mood disorders (Bayes & Parker, Reference Bayes and Parker2018; Parker, Graham, & Tavella, Reference Parker, Graham and Tavella2017), we chose to develop a predictive model that includes both indications.
Brain regions that contributed most to remission classification using sMRI data included the dmPFC, precuneus, and thalamus. The dmPFC is involved in the top-down process that regulates many emotional and cognitive functions (Bai et al., Reference Bai, Wei, Zu, Xie, Wang, Gong-Jun and Wang2019; Zhang et al., Reference Zhang, He, Bai, Lv, Xie, Nie and Tian2021). Clinical and preclinical studies on depression have consistently reported functional, structural, and system-level abnormalities that span many PFC regions (Pizzagalli & Roberts, Reference Pizzagalli and Roberts2022; Price & Drevets, Reference Price and Drevets2012). Interestingly, the dorsomedial part of the PFC is integrated in the three large scale functional networks that constitute the triple network model implicated in depression (i.e. central executive, default mode, and salience network) (Menon, Reference Menon2011; Sheline, Price, Yan, & Mintun, Reference Sheline, Price, Yan and Mintun2010; van Waarde et al., Reference van Waarde, Scholte, van Oudheusden, Verwey, Denys and van Wingen2015). The dmPFC cluster found important for remission classification (displayed in Fig. 4) partly overlaps with the salience network, and dysfunction in this network is associated with emotional dysregulation and negatively biased information processing in depression (Hamilton et al., Reference Hamilton, Glover, Bagarinao, Chang, Mackey, Sacchet and Gotlib2016; Menon, Reference Menon2011). Neuroimaging studies investigating changes in brain structure and connectivity following ECT have reported significant correlations between the dmPFC and an overall reduction in depressive symptom scores (Bai et al., Reference Bai, Wei, Zu, Xie, Wang, Gong-Jun and Wang2019; Dukart et al., Reference Dukart, Regen, Kherif, Colla, Bajbouj, Heuser and Draganski2014; Li et al., Reference Li, Yu, Ma, Su, Li, Zhu and Wang2022; Perrin et al., Reference Perrin, Merz, Bennett, Currie, Steele, Reid and Schwarzbauer2012; Zhang et al., Reference Zhang, He, Bai, Lv, Xie, Nie and Tian2021), as well as associations between the dmPFC and remission specifically, in line with our findings (Abbott et al., Reference Abbott, Lemke, Gopal, Thoma, Bustillo, Calhoun and Turner2013; van Waarde et al., Reference van Waarde, Scholte, van Oudheusden, Verwey, Denys and van Wingen2015). Our results also pointed to an important role of the precuneus for remission classification. The precuneus is a posterior region of the medial parietal cortex with widespread connections and is regarded as a major association area important for complex cognition and behavior including visuospatial imagery, episodic memory retrieval, and self-related processing (Cavanna & Trimble, Reference Cavanna and Trimble2006; Mulders et al., Reference Mulders, van Eijndhoven, Pluijmen, Schene, Tendolkar and Beckmann2016; Utevsky, Smith, & Huettel, Reference Utevsky, Smith and Huettel2014). Importantly, this region (together with the posterior cingulate cortex) is considered the core functional hub of the aforementioned default mode network, and dysregulations within this network have been associated with symptom severity, and in particularly with rumination, a core characteristic of depression (Bai et al., Reference Bai, Wei, Zu, Xie, Wang, Gong-Jun and Wang2019; Li et al., Reference Li, Yu, Ma, Su, Li, Zhu and Wang2022; Peng et al., Reference Peng, Liddle, Iwabuchi, Zhang, Wu, Liu and Fang2015; Utevsky et al., Reference Utevsky, Smith and Huettel2014; Zhong, Pu, & Yao, Reference Zhong, Pu and Yao2016). Preliminary evidence links changes in precuneus structure, network connectivity, and cerebral blood flow with ECT treatment outcome (Leaver et al., Reference Leaver, Vasavada, Joshi, Wade, Woods, Espinoza and Narr2019; Mulders et al., Reference Mulders, van Eijndhoven, Pluijmen, Schene, Tendolkar and Beckmann2016, Reference Mulders, Llera, Beckmann, Vandenbulcke, Stek, Sienaert and Tendolkar2020). Previous studies using structural or functional MRI to predict ECT outcome have also implicated the precuneus (Jiang et al., Reference Jiang, Abbott, Jiang, Du, Espinoza, Narr and Calhoun2018; Li et al., Reference Li, Yu, Ma, Su, Li, Zhu and Wang2022). Our results also pointed to the thalamus, which is a structure embedded within the cortico-striatal-thalamo-cortical (CSTC) pathways that mediate several cognitive, affective, and motivational processes (Sherman, Reference Sherman2016; Takamiya et al., Reference Takamiya, Kishimoto, Liang, Terasawa, Nishikata, Tarumi and Mimura2019). It acts as a central hub within the wider limbic-cortical-striatal-pallidal-thalamic circuit (overlapping with the salience network) that is thought to play an important role in emotion dysregulation (Drevets, Price, & Furey, Reference Drevets, Price and Furey2008) and shares direct anatomical connections with regions implicated in mood disorders like the hippocampus (also associated with the default mode network) (Hamilton, Farmer, Fogelman, & Gotlib, Reference Hamilton, Farmer, Fogelman and Gotlib2015; Leaver, Espinoza, Wade, & Narr, Reference Leaver, Espinoza, Wade and Narr2022; Price & Drevets, Reference Price and Drevets2012; Sherman, Reference Sherman2016). There is evidence of decreased thalamic volume and hyperactivity during rest and emotional processing in depression (Arnone et al., Reference Arnone, Job, Selvaraj, Abe, Amico, Cheng and McIntosh2016; Bora, Harrison, Davey, Yucel, & Pantelis, Reference Bora, Harrison, Davey, Yucel and Pantelis2012; Palmer, Crewther, Carey, & Team, Reference Palmer, Crewther, Carey and Team2014; Price & Drevets, Reference Price and Drevets2012), and it has been suggested that abnormal thalamic connectivity may lead to disruptions in higher-order cortico-cortical connectivity (Gallo et al., Reference Gallo, El-Gazzar, Zhutovsky, Thomas, Javaheripour, Li and van Wingen2023). The thalamus is also considered an important structure in seizure physiology, and several studies have associated pre- v. post-ECT changes in thalamic volume, functional connectivity and cerebral blood flow with ECT efficacy (Leaver et al., Reference Leaver, Espinoza, Pirnia, Joshi, Woods and Narr2016, Reference Leaver, Vasavada, Joshi, Wade, Woods, Espinoza and Narr2019; Sun et al., Reference Sun, Jiang, Qi, Narr, Wade, Upston and Sui2020; Takamiya et al., Reference Takamiya, Kishimoto, Liang, Terasawa, Nishikata, Tarumi and Mimura2019). A recent review proposes a circuit-level model for the mechanisms underlying ECT, in which repeated seizure therapy improves symptoms by correcting or resetting the disrupted limbic-cortical-striatal-pallidal-thalamic circuit in depression (Leaver et al., Reference Leaver, Espinoza, Wade and Narr2022). It is thought that seizure propagation between distant brain regions through cortical–thalamocortical and direct cortical–cortical connections is pivotal for ECT effectiveness (Fink & Ottosson, Reference Fink and Ottosson1980; Leaver et al., Reference Leaver, Espinoza, Pirnia, Joshi, Woods and Narr2016, Reference Leaver, Vasavada, Joshi, Wade, Woods, Espinoza and Narr2019; McNally & Blumenfeld, Reference McNally and Blumenfeld2004; Singh & Kar, Reference Singh and Kar2017; Takamiya et al., Reference Takamiya, Chung, Liang, Graff-Guerrero, Mimura and Kishimoto2018). Previous classification studies using pre-treatment rs-fMRI to predict ECT outcome have reported thalamic connectivity as an important predictor in line with these findings (Sun et al., Reference Sun, Jiang, Qi, Narr, Wade, Upston and Sui2020; Takamiya et al., Reference Takamiya, Kishimoto, Liang, Terasawa, Nishikata, Tarumi and Mimura2019). Notably, the systematic review of Enneking, Leehr, Dannlowski, and Redlich (Reference Enneking, Leehr, Dannlowski and Redlich2020) compared studies on biomarkers of response for the most common antidepressive treatments, namely antidepressive pharmacotherapy (AD), electroconvulsive therapy, and cognitive-behavioral therapy (CBT) (Enneking et al., Reference Enneking, Leehr, Dannlowski and Redlich2020). According to this review, pre-treatment GM volume in the thalamus is associated with ECT treatment outcome (in line with our findings) but not for AD and CBT. The precuneus, which was also found to be important for our GM classifications, was not associated with outcome for any of the treatments. However, the anterior cingulate cortex (ACC), which is closely located to dmPFC, emerged as a predictive region for outcome prediction in all three treatments (Enneking et al., Reference Enneking, Leehr, Dannlowski and Redlich2020). These findings suggest that GM volume in regions surrounding the ACC might indicate broader treatment responsiveness, while specific regions such as the thalamus may be more indicative of treatment outcome to ECT specifically.
Our results further indicated an important role for remission classification using ICA spatial resting-state components centered around the anterior temporal lobes and frontopolar cortex that both resulted in AUC > 0.7. It is important to acknowledge that although using these components for classification yielded acceptable discrimination with above chance-level performance (puncorrected < 0.05), they did not remain significant after applying multiple comparison correction. Consequently, these results should be interpreted with caution. The frontopolar cortex (Brodmann Area 10) plays an important role in integrating cognitive, social, and emotional processes. Its medial parts are mostly associated with affective processing such as emotional and social cognition and its lateral parts with working memory and perception. (Bludau et al., Reference Bludau, Eickhoff, Mohlberg, Caspers, Laird, Fox and Amunts2014; Gilbert et al., Reference Gilbert, Spengler, Simons, Steele, Lawrie, Frith and Burgess2006). Previous studies have reported that depression is associated to reduced medial frontal pole volume (Bludau et al., Reference Bludau, Bzdok, Gruber, Kohn, Riedl, Sorg and Eickhoff2016), and that decreased frontal pole volume and FC following ECT was related to therapeutic efficacy (Xu et al., Reference Xu, Wei, Xu, Hu, Tian, Wang and Wang2018). The medial temporal lobes have been consistently implicated in ECT neuroimaging research and include the hippocampus and amygdala, which have shown to undergo structural changes in volume, functional connectivity, and perfusion following ECT (Leaver et al., Reference Leaver, Espinoza, Pirnia, Joshi, Woods and Narr2016; Mulders et al., Reference Mulders, Llera, Beckmann, Vandenbulcke, Stek, Sienaert and Tendolkar2020; Ousdal et al., Reference Ousdal, Argyelan, Narr, Abbott, Wade, Vandenbulcke and Sienaert2020; Redlich et al., Reference Redlich, Opel, Grotegerd, Dohm, Zaremba, Burger and Dannlowski2016; Takamiya et al., Reference Takamiya, Chung, Liang, Graff-Guerrero, Mimura and Kishimoto2018; Wilkinson, Sanacora, & Bloch, Reference Wilkinson, Sanacora and Bloch2017). The temporal lobes also show the highest magnitude of electrical current in right unilateral stimulation (Fridgeirsson, Deng, Denys, van Waarde, & van Wingen, Reference Fridgeirsson, Deng, Denys, van Waarde and van Wingen2021), and increased electrical field strength has been associated with increased right hippocampal neuroplasticity and improved antidepressant outcomes (Deng et al., Reference Deng, Argyelan, Miller, Quinn, Lloyd, Jones and Abbott2021). Smaller hippocampal volumes, and to a lesser extend the amygdala, are apparent in MDD patients and support the current hypothesis that mood disorders consist of dysfunction in neural circuits important for processing and integrating emotional and cognitive events (Kempton et al., Reference Kempton, Salvador, Munafo, Geddes, Simmons, Frangou and Williams2011; Schmaal et al., Reference Schmaal, Veltman, van Erp, Samann, Frodl, Jahanshad and Hibar2016). Previous classification studies have also highlighted anterior lateral temporal lobe volume, hippocampal and amygdala gray matter (Abbott et al., Reference Abbott, Jones, Lemke, Gallegos, McClintock, Mayer and Calhoun2014; Jiang et al., Reference Jiang, Abbott, Jiang, Du, Espinoza, Narr and Calhoun2018; Takamiya et al., Reference Takamiya, Liang, Nishikata, Tarumi, Sawada, Kurokawa and Kishimoto2020), and temporal cortex functional connectivity (Leaver et al., Reference Leaver, Wade, Vasavada, Hellemann, Joshi, Espinoza and Narr2018) as important predictors for ECT outcome.
Altogether, these results provide evidence for the importance of dmPFC, thalamic and precuneus structure and fronto-temporal FC for both depression and ECT-related clinical response. Notably, the identification of brain regions contributing most to the classification resulted from a multivariate analysis, and the localization of these regions should therefore be interpreted with caution as these regions may not only be related to treatment outcome but also contribute to denoising during the classification process (Haufe et al., Reference Haufe, Meinecke, Gorgen, Dahne, Haynes, Blankertz and Biessmann2014).
Several limitations have to be taken into account when interpreting our findings. First, our models were trained on both medicated and unmedicated patients. Medication was usually tapered before ECT or kept stable during ECT, but was not consistently registered to enable medication-specific analyses. The current study design also did not include another treatment (as control condition), and therefore we do not know whether the predictive markers are specific for ECT. Future studies on ECT prediction may explore the effects of concurrent medication use and whether models do (not) share features with predictive models for other treatments for treatment resistant depression such as ketamine or deep brain stimulation. Second, although the sample size in this study is higher than those typically seen in previous neuroimaging studies predicting ECT outcome, it is likely that including more patients for classifier training would increase the robustness and performance of the models (see learning curve; online Supplementary Fig. S2). In addition, our classifiers were trained using a relatively high ratio of features to participants that could lead to potential model overfitting, referred to as the ‘curse of dimensionality’. We employed regularization to avoid overfitting by tuning the ‘C’ parameter of the SVM (through grid-search). However, it is possible that some overfitting might still occur, and only larger sample sizes can guarantee a lower bias towards overfitting. Nonetheless, our best performing model showed significant classification performance with external validation, indicating that the model performs above chance level when applied to data unseen centers and is unlikely to overfit on data from a single center. Future studies using even larger samples should further investigate the feasibility of using MRI data to predict ECT outcome. Next, we used a retrospectively pooled sample from existing data across the world, without harmonized protocols for scanning, inclusion criteria or demographic and clinical characteristics. Not surprisingly, we found significant differences in sample demographics and clinical characteristics between the different data collection centers. These sources of heterogeneity may limit classification performance but also provide an opportunity for model development using independent data sets and the discovery of generalizable biomarkers that are reproducible across centers. However, classification performance might be improved by using standardized acquisition parameters for possible future clinical utility. Finally, it should be mentioned that artificial dichotomization of post-ECT scores to remission and response rates leads to some loss of information. For example, patients that show partial remission or response (i.e. HAM-D scores of 7% or 49% reduction in symptoms) are considered the same as those patients that do not improve at all. From a clinical perspective, regression-based approaches that allow for continuous predictions of symptom reduction might provide more clinical utility in comparison to binary classification (Gartner et al., Reference Gartner, Ghisu, Herrera-Melendez, Koslowski, Aust, Asbach and Bajbouj2021). We investigated whether this was the case for the data in our study, and although we obtained a significant correlation between the predicted and true post-ECT HAM-D scores, other regression performance metrics like the R2 score and mean absolute error indicated poor overall performance. Future studies could further investigate the feasibility of using other models that provide continuous predictions (e.g. using deep learning) for ECT outcome in larger, multi-samples.
Taken together, this study suggests that ECT remission can be predicted with acceptable discrimination using MRI data in a large, ecologically valid, multicenter sample of patients receiving ECT, indicating that future development of a clinical decision support tool might be feasible. MRI could easily be incorporated during decision making, as ECT is typically provided in a hospital setting. And as MRI is inexpensive compared to ECT, the additional costs are expected to outweigh the costs of unsuccessful treatments.
Supplementary material
The supplementary material for this article can be found at https://doi.org/10.1017/S0033291723002040.
Acknowledgements
We would like to thank the logistic and academic support of the entire GEMRIC consortium. The full overview of the GEMRIC board members can be found here: https://mmiv.no/gemric/. In addition, we would like to acknowledge Louise Emsell for contributing data that was considered but not used for the final analysis.
Author contributions
W. B. B., G. A. v. W. & A. D. conceived the research question, contributed to the design, and wrote the first draft of the manuscript. W. B. B. performed data analysis and developed MRI processing pipelines. G. A. v. W. and P. Z. made substantial contributions to data analysis. L. O. coordinated the GEMRIC consortium. W. B. B., L. O., H. B., C. C. A., M. A., T. B., J. A. C., S. C., R. E., P. C. R. M., K. L. N., M. L. O., D. R., F. t. D., I. T., P. v. E., E. v. E., M. v. V., J. v. W., A. D. & G. A. v. W. contributed to data acquisition. W. B. B., P. Z., L. O., H. B., C. C. A., M. A., T. B., J. A. C., S. C., R. E., P. C. R. M., K. L. N., M. L. O., D. R., F. t. D., I. T., P. v. E., E. v. E., M. v. V., B. W., J. v. W., A. D., and G. A. v. W. substantially revised the manuscript. All authors critically revised the manuscript for important intellectual content, approved the final draft and had final responsibility for the decision to submit for publication.
Financial support
This work was supported by the Netherlands Organization for Scientific Research (NWO/ZonMW Vidi 917.15.318, Dr van Wingen), Western Norway Regional Health Authority (Grant No. 91223, Dr Oltedal), NARSAD Young Investigator Grant (No. 27786 to BW), a K99 Pathway to Independence Award (Grant No. MH119314 to BW), and the National Institute of Mental Health (Grant No. MH092301 and MH110008 for Dr Narr and Dr Espinoza; MH111826 and MH125126 for Dr Abbott; MH119616 for Dr Argyelan and R01MH112737 for Dr Camprodon).
Conflict of interest
Dr van Wingen has received research grant support from Philips. Dr Camprodon serves in the Scientific Advisory Board of Hyka Therapeutics and Feelmore Labs and has been a consultant for Neuronetics. All other individually named co-authors in the GEMRIC working group declared no biomedical financial interests or potential conflicts of interest. A preprint version of this manuscript has been posted on medRxiv (https://doi.org/10.1101/2021.07.29.21261206); ID: 2021.07.29.21261206).
Role of the funding source
The funders of this study had no role in study design, data collection, data analysis, data interpretation, or writing of the report.
Data sharing statement
Individual participant data cannot be made available publicly because there is no consent or ethical approval for this and the data cannot be anonymized. The data are stored on a secure centralized server at the University of Bergen, Norway. Participating GEMRIC sites have access to the raw data according to specific data policy and safety rules of the consortium and in accord with the approval from the ethical committee. The GEMRIC consortium welcomes new members who are interested in the neuroimaging research of ECT. For more about the application process, please visit https://mmiv.no/how-to-join-gemric/ or write to Leif Oltedal (leif.oltedal@uib.no). General information about the consortium can be found on the following website: https://mmiv.no/gemric/.
Code availability
The code that support the findings of this study are available from the corresponding authors upon reasonable request.


 Open access