

1. Introduction
Polythermal glaciers are widespread in the high latitudes, and contain ice that is both at and below the pressure-melting point (“warm” and “cold” ice, respectively). Liquid water exists where the ice is warm, and surface melt may gain access through cold surface layers to warm areas of the glacier bed via moulins and crevasses (Reference Skidmore and SharpSkidmore and Sharp, 1999). Borehole temperature measurements suggest that polythermal glaciers in the Canadian high Arctic consist predominantly of cold ice with a thin layer of warm basal ice beneath the centre of the ablation area (Reference BlatterBlatter, 1987; Reference Blatter and KappenbergerBlatter and Kappenberger, 1988). This differs greatly from the polythermal glaciers found in locations such as Svalbard and northern Scandinavia, where latent-heat release from refreezing in the accumulation area results in warm ice throughout most of the accumulation and lower ablation areas. In these glaciers cold ice is generally present only in a relatively thin layer close to the surface (Reference Holmlund and ErikssonHolmlund and Eriksson, 1989).
In the Canadian high Arctic, the glacier margins and terminus generally remain cold and frozen to the bed due to the steep englacial temperature gradient that conducts away geothermal heat where the ice is thin. Hydrological observations suggest that, in winter, spring and early summer, the cold margins create a thermal dam to the outflow of subglacial water, which may become ponded in the subglacial region behind the glacier terminus (Reference Skidmore and SharpSkidmore and Sharp, 1999). As meltwater inputs to the glacier bed increase in the early summer, subglacial water pressures rise, the thermal dam is breached and the reservoir releases as an outburst flood. This behaviour contrasts markedly with the hydrology of temperate glaciers and Svalbard-type polythermal glaciers, where water outflow can continue throughout the year as drainage conduits beneath the glacier terminus do not generally seal in winter (Reference Wadham, Tranter and DowdeswellWadham and others, 2000).
The objective of this study is to further our understanding of the hydrology and thermal regime of a polythermal glacier in the Canadian high Arctic by using high-resolution radio-echo sounding to image its internal and basal properties. We analyze the presence/absence of an internal reflecting horizon, and the spatial variability in residual bed reflection power (BRPr) (i.e. bed reflection power (BRP) corrected for variations in ice thickness), to identify the distribution of warm- and cold-based ice. We then evaluate the hypothesis that spatially contiguous areas of high BRPr within areas of warm basal ice represent regions of preferred subglacial drainage. We do this by making comparisons with independent reconstructions of the pattern of subglacial drainage that are based on the form of the subglacial hydraulic potential surface derived from digital elevation models (DEMs) of the glacier surface and glacier bed (Reference Copland, Sharp, Noon, Stickley and LongstaffCopland and Sharp, 2000).
Other studies have used returned power from radio-echo sounding to identify subglacial lakes (e.g. Reference Oswald and RobinOswald and Robin, 1973; Reference Robin, Drewry and MeldrumRobin and others, 1977; Reference Siegert and RidleySiegert and Ridley, 1998), and to distinguish between wet and frozen beds in the Antarctic (Reference Bentley, Lord and LiuBentley and others, 1998; Reference Gades, Raymond, Conway and JacobelGades and others, 2000). Reference Gades, Raymond, Conway and JacobelGades and others (2000) found low and nearly constant BRPr across Siple Dome. This is suggestive of ice frozen to bedrock, while high basal reflectivity under the adjacent Siple Ice Stream and Ice Stream C is indicative of a thin basal water layer or a thick thawed or frozen till layer. Reference GadesGades (1998) used temporal and spatial variations in BRP to monitor the subglacial conditions at Black Rapids Glacier, Alaska, U.S.A., during the time of annual spring speed-up. Glacier-wide changes were not detected during these measurements, although variations in returned power along the glacier margins suggested that changes in the subglacial hydrological system occurred in these areas.
2. Study Site
John Evans Glacier (79°40′ N, 74°30′ W) is located on the east coast of Ellesmere Island, Nunavut, Canada (Fig. 1). It terminates on land, and occupies a 220 km basin, of which approximately 75% is glacierized (Reference Skidmore and SharpSkidmore and Sharp, 1999). The glacier ranges in elevation from 100 to 1500 m a.s.l., with a mean ice thickness of ∼150 m in the terminus area and a maximum ice thickness of ∼400 m close to the equilibrium line at ∼750 m a.s.l. For the years 1997–99, mean annual air temperatures were −14.3°C at the terminus (200 m a.s.l.), −15.2°C close to the equilibrium line (850 m a.s.l.) and – 14.8°C in the upper accumulation area (1150 m a.s.l.). 15 m ice temperatures in the accumulation and upper ablation areas are in the range −7° to −15°C. The melt season normally extends from early June to early August. During this period, supraglacial meltwater enters the glacier interior via moulins and crevasses, and lakes form on the glacier surface and along the glacier margins.
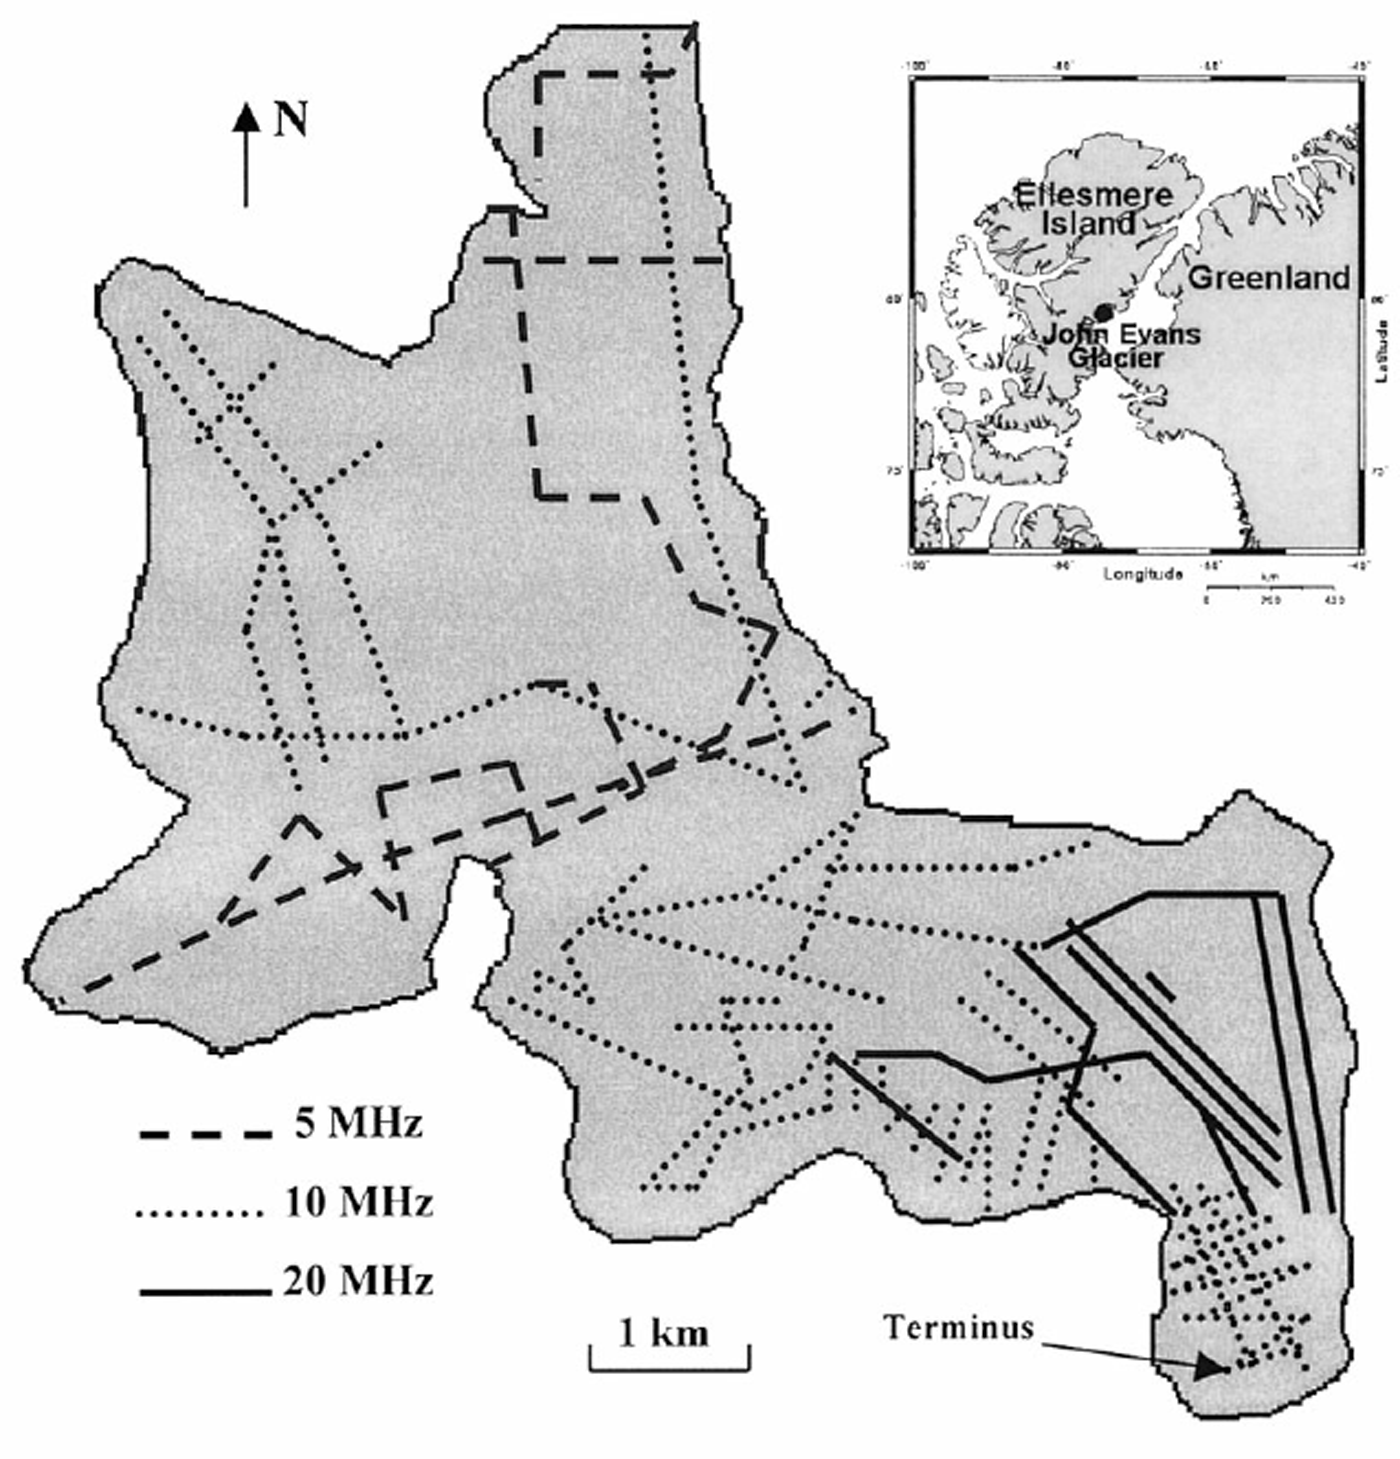
Map showing the location of John Evans Glacier and the distribution of radio-echo sounding measurements made for this study.
3. Data Collection
The radio-echo sounding system consists of a monopulse transmitter with a peak power of 24 kW (Reference Narod and ClarkeNarod and Clarke, 1994), and an airwave-triggered oscilloscope receiver connected to a palmtop computer for digital data recording. Receiver and transmitter arms are resistively loaded dipoles, and were oriented in-line (E-plane). Centre frequencies of 5, 10 or 20 MHz were used, and traces were recorded in the time domain. To reduce noise, the received signal was low-pass filtered (at 1.5 × the transmitted centre frequency) and aver aged at least 32 times before recording. The oscilloscope sampling interval was typically 9.8 ns (512 samples/trace with a 5000 ns time base), which equates to a Nyquist frequency (f n) of 51 MHz. Where the ice was particularly shallow or deep, sampling intervals of 3.9 ns (f n = 128 MHz) and 19.5 ns (f n = 26 MHz) were occasionally used for the surveys at 20 and 5 MHz, respectively. The Nyquist frequency defines the highest frequency that can be recorded, and was always well above the low-pass filter level for each centre frequency. This ensured that the traces measured the full spectrum of the received wave. A 2 MHz vertical high-pass finite-impulse response filter from Radan post-processing software (Geophysical Survey Systems, Inc.) was used to remove the slowly decaying low-frequency feature that is common at the start of traces when the transmitter and receiver are in-line. This processing did not affect the timing or characteristics of the high-frequency bed and internal reflections.
Traces were recorded at 3200 locations by towing the radio-echo sounding unit on two sleds behind a skidoo, skier or hiker (Fig. 1). Most soundings were made in May, before the start of the melt season, which ensured constant antenna–surface coupling (Reference Copland, Sharp, Noon, Stickley and LongstaffCopland and Sharp, 2000). This is an important consideration, as Reference Bogorodsky, Bentley and GudmandsenBogorodsky and others (1985) and Reference GadesGades (1998) argue that variable amounts of surface water influence the radar power that enters the glacier. Horizontal trace locations were determined with a hand-held global positioning system (GPS) to within ±50 m, with interpolation between occasional GPS points where the transects were straight. The horizontal GPS coordinates were used to determine surface elevation from a DEM of the glacier surface derived from 1959 stereo aerial photos (Reference Woodward, Sharp and ArendtWoodward and others, 1997). The surface DEM has a grid spacing of 25 m, and the derived elevations were verified against altimeter estimates. Recording traces in a regular network along straight and parallel transects was not possible due to the presence of obstacles such as large crevasses and deeply incised surface streams. To avoid such features, transects were generally completed in areas of flat surface topography, along the centre of 300–500 m wide interfluves. As discussed in section 3.2, measurements that included significant returns from crevasses were discarded.
3.1. Radar determination of bed topography
Ice thickness was determined at all trace locations by manually recording the time between the first peak of the surface wave and the first peak of the bed wave from “A-scopes” displayed in Radan (Fig. 2a). Phase inversion is rare, and there are few internal reflectors at John Evans Glacier, so the bed reflection was generally easily identifiable and simple to follow between traces. To convert travel time to ice thickness it was assumed that the radar wave travelled across the glacier surface at 0.300 m ns−1 (speed of light), and that it travelled through the ice at 0.171 m ns−1. The velocity through ice (0.1711 ± 0.0031 m ns−1) was determined from 12 common-midpoint surveys on John Evans Glacier in 1999, and equates to a real dielectric constant of 3.074 (Reference Copland, Sharp, Noon, Stickley and LongstaffCopland and Sharp, 2000). Since the oscilloscope was airwave-triggered, the time for the airwave to cross between the transmitter and receiver was added to the time between the peak of the surface and bed waves to determine the final ice thickness. The bed and surface peaks are identifiable to within ±2 samples (i.e. ±19.5 ns for most surveys), which equates to an ice thickness of ± 1.7 m for a two-way travel path. Errors in ice-depth measurements also arise from uncertainty in the location of a reflector (e.g. due to spatially variable radiowave velocity in ice), and are typically quoted as one-tenth of the transmitted wavelength (Reference Bogorodsky, Bentley and GudmandsenBogorodsky and others, 1985). This equates to ±1.7 m for the most commonly used centre frequency of 10 MHz, ±3.4 m for a centre frequency of 5 MHz, and ±0.85 m for a centre frequency of 20 MHz.
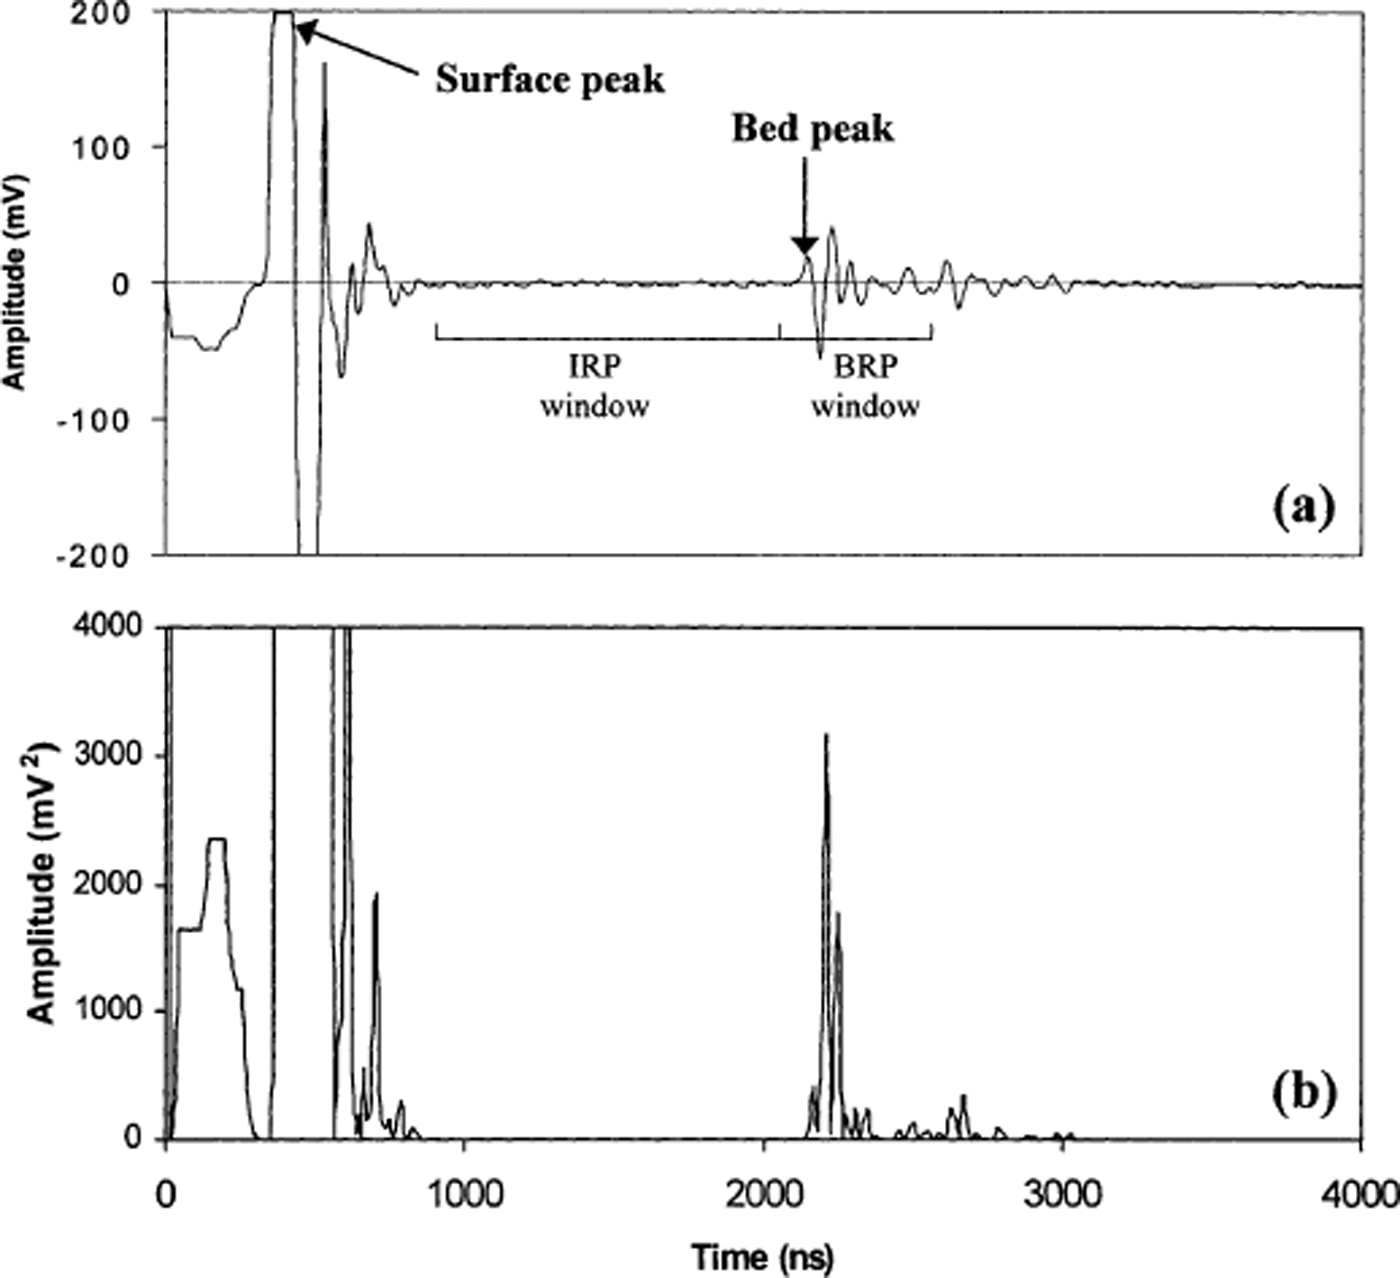
(a) A typical radio-echo sounding trace recorded at John Evans Glacier, (b) Returned power from the same trace. IRP, internal reflection power.
The bed topography was determined by subtracting the ice thickness from the surface elevation at each trace location. A DEM of the glacier bed, with the same 25 m grid spacing as the surface DEM, was produced by interpolating between the 3200 bed elevations derived from the radio-echo sounding traces, and 6700 bedrock elevations along the glacier edge derived from the surface DEM. The interpolation was completed with a triangulated irregular network for the surface and bed DEMs, which maintains the elevations of the original data points. These DEMs are used to calculate the subglacial hydraulic potentials and associated subglacial flow reconstructions that are discussed in section 4.3. The bed DEM is also used in the calculation of the bed slopes discussed in section 4.2. The estimated accuracy of the surface DEM is 6 m, while the accuracy of the bed DEM is dependent on both the accuracy of the surface DEM and the errors in the ice-thickness measurements.
In our ice-thickness calculations, we assumed that the bed reflection occurred from a point directly below the midpoint between the receiver and transmitter (which were separated by up to 20 m). Ice thickness was determined from the angular distance from the transmitter to the midpoint at the bed, which results in an overestimation of depth compared to the straight-line distance from the midpoint on the surface to the midpoint at the bed. This overestimation is small: <0.5 m when the ice is 100 m thick and <0.2 m when the ice is 250 m thick. In addition, the assumption that the bed reflection occurs from the midpoint at the bed is probably not always true, particularly in areas of steep topography where reflections from valley side-walls may occur before reflections from the underlying glacier bed. These effects are commonly reduced via migration, but this was not possible at John Evans Glacier due to the generally irregular spacing of measurement points. We estimated errors in the ice-thickness measurements by performing ray tracing along representative transects from the glacier terminus, upper ablation area and accumulation area. As outlined by Reference Rabus and EchelmeyerRabus and Echelmeyer (1997), the bed along a given profile is assumed to be the envelope of intersecting ellipses with the transmitter and receiver as focal points. Although ray tracing is a crude method (e.g. it assumes that reflections occur only from topography along the transect), it provides an estimate of the errors in our ice-thickness determinations. These errors are generally ±10%, although they occasionally reach ±20% in areas of very steep topography (approximately 5% of points are in this kind of terrain). These errors are not significant, as they do not affect the general location of subglacial valleys and ridges, and they do not change the location of spatially contiguous areas of high BRPr discussed later. Indeed, migration would only serve to increase the values of high BRPr as it would have the effect of increasing ice thickness in areas of steep basal topography.
3.2. Returned power from radio-echo sounding
Following the work of Reference GadesGades (1998) and Reference Gades, Raymond, Conway and JacobelGades and others (2000), the internal reflection power (IRP) and BRP were calculated for all the traces recorded at John Evans Glacier from (Fig. 2):

where s is the amplitude of the signal and t is time. For BRP, t 1 is taken as 100 ns before the bed peak and t 2 as 400 ns after the bed peak. This time window encompasses all the power returned from the glacier bed. For IRP, a variable time window extending from 600 ns after the surface peak to 100 ns before the bed peak was used (Fig. 2a). This excluded the noise from the air and ground waves at the start of each trace, as well as returns from the glacier bed.
The use of a variable time window differs from the approach of Reference GadesGades (1998) and Reference Gades, Raymond, Conway and JacobelGades and others (2000), who used a fixed time window to calculate IRP. This approach could not be used at John Evans Glacier because the window between the surface and bed waves approaches zero at small ice thicknesses (a problem never encountered by Reference GadesGades (1998) or Reference Gades, Raymond, Conway and JacobelGades and others (2000)). To standardize our measurements, the total IRP was therefore divided by the length of the specified time window. This approach was also applied to calculations of BRP. Unfortunately, because dielectric loss increases with depth, this may result in a systematic bias in the standardized IRP values, which will tend to be relatively low where the ice is very thick, and relatively high where it is thin.
Features such as crevasses produce large englacial reflections and are readily identifiable as regions of high IRP even in thick ice. Such large englacial reflections could cause a reduction in the amount of energy that reaches the glacier bed. Because our goal is to map spatial variations in BRP that may be associated with variations in the properties of the glacier bed, we rejected all traces that displayed the presence of strong englacial reflectors. This was done by defining a threshold IRP value (2 mV2 ns−1) that identified all locations where crevasses were known to exist (Reference Copland, Sharp, Noon, Stickley and LongstaffCopland and Sharp, 2000). By this criterion, approximately 7.5% of the original traces were excluded from further analysis. Tests with IRP threshold values between 1 and 10 mV2 ns−1 made no significant difference to the final results.
Elsewhere the IRP was uniformly low without a clear spatial pattern. This makes it unlikely that IRP affects the patterns in BRPr in the remaining traces, particularly since the BRP was typically more than an order of magnitude greater than the IRP in these traces (Fig. 3). Variability in bed power in the remaining traces is assumed to be due to differences in ice thickness and bed properties, rather than to the presence of englacial features or englacial scattering.
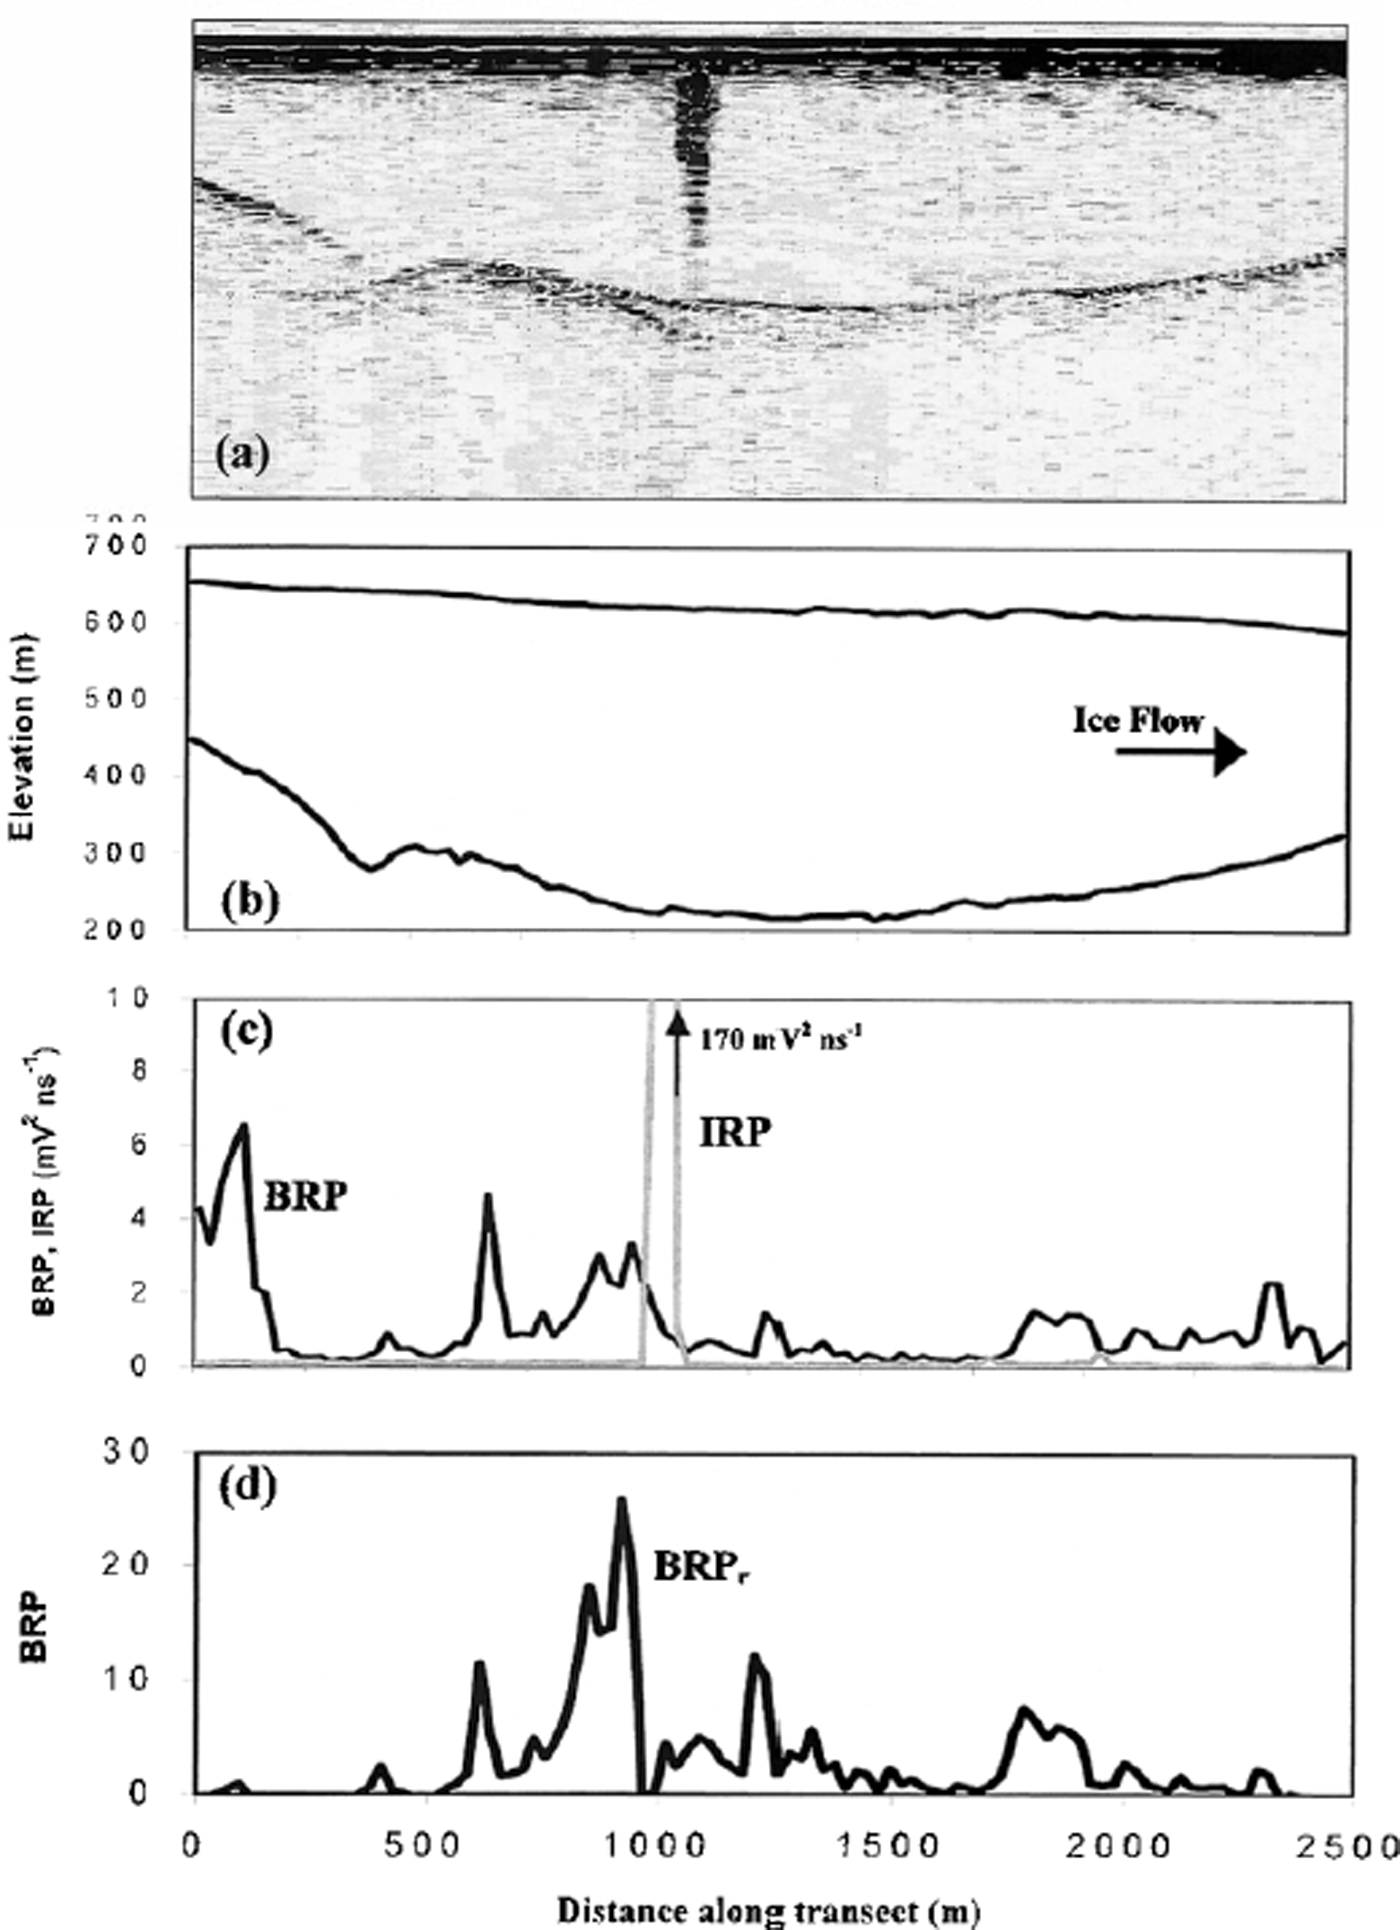
(a) Raw radio-echo sounding data for a transect through the centre of area A in Figure 6 (uncorrected for surface topography). Area of high englacial reflections towards the centre of the transect is probably caused by a crevasse. (b) True surface and bed topography, (c) BRP and IRP standardized to mV2 ns−1 Note the high IRP where the crevasse is located; traces with an IRP >2 mV2 ns−1 were removed from further analysis. (d) BRPr: highest values occur over the overdeepening.
For a flat, homogeneous ice sheet resting on a smooth horizontal rock bed, the main controls on received power are described by the radar equation (Reference Bogorodsky, Bentley and GudmandsenBogorodsky and others, 1985):

where P r and P t are the received and transmitted power, G t is the transmitter gain, A r is the effective area of the receiving antenna, q is the refraction gain, and L is loss due to two-way propagation through the ice and the strength of the basal reflection. Although the conditions at John Evans Glacier do not meet many of the assumptions associated with this equation, and P r is not numerically equivalent to BRP, Equation (2) nevertheless illustrates the main controls on BRP. We assume that losses due to polarization and scattering at the ice/bed interface are minimal and/or constant (Reference GadesGades, 1998), and that the antenna characteristics and surface coupling were constant for all traces recorded at a particular frequency. The remaining controls on BRP are then h and L. Therefore, if we can determine the magnitude of dielectric loss with depth as the radar wave passes through the glacier, the remaining variability in BRP will be a function of variability in bed conditions.
3.3. Rate of dielectric loss with depth
To determine the rate of dielectric loss with depth for John Evans Glacier, BRP was plotted against ice thickness for all traces with IRP <2 mV2 ns−1 (Fig. 4a). Individual plots were produced for the different centre frequencies, because lower frequencies are less strongly attenuated in ice and therefore produce different reflection characteristics. These plots contained 2140 points for the 10 MHz traces, 525 points for the 5 MHz traces, and 303 points for the 20 MHz traces. Most of the discussion in this paper focuses on the results from the 10 MHz traces due to the large number of records at this frequency, and the fact that similar spatial patterns in BRP were displayed in the 5 and 20 MHz records. The 10 MHz traces recorded over the glacier terminus were also isolated and analyzed independently to provide detailed information for a small area where the englacial temperature distribution is likely quite uniform (>450 traces within an area of < 1 km2; Figs 4b and 5b). Attenuation rate increases with ice temperature, so spatial differences in englacial thermal structure will likely cause variability in the rate of dielectric loss with depth.
(a) Relationship between ice thickness and BRP for all 10 MHz traces with an IRP <2 mV2 ns−1. (b) Relationship between ice thickness and BRP for all 10 MHz traces completed over the glacier terminus with an IRP <2 mV2 ns−1. Best-fit lines represent the attenuation of radar power with ice thickness.

(a) An example of a radio-echo sounding transect across the terminus of John Evans Glacier (uncorrected for surface topography). The internal reflector is interpreted as the boundary between cold ice above and warm ice below. (b) Thickness and distribution of internal reflecting horizon across the terminus of John Evans Glacier. White dots indicate trace locations; black dots indicate glacier boundary. X and T mark the ends of the transect displayed in (a).

A least-squares best-fit line through each plot provides the predicted BRP for a given ice thickness and transmitter frequency. Both exponential and power best-fit lines described the attenuation rate with depth, although exponential fits were chosen for our final calculations as they had slightly higher r 2 values. The r 2 value of 0.842 for the glacier terminus plot was particularly high (Fig. 4b), and provides a solid base for the interpretations of variability in BRPr from this area. The best-fit lines for the glacier-wide plots had lower r 2 values (0.689 and 0.691), which is consistent with the suggestion that variability in englacial temperatures is greater over the entire glacier than over the terminus area alone. It is therefore necessary to determine whether the scatter of data points about the best-fit line for the whole glacier arises because the line does not adequately describe the relationship between BRP and ice thickness, or because there are spatial variations in ice temperature, bed properties or both.
To compare measured to predicted BRP in areas with different ice thicknesses, the BRPr was calculated from (Reference GadesGades, 1998):

To evaluate whether the observed spatial patterns in BRPr (Figs 6a and 7) are due to the failure of the best-fit line to adequately describe the relationship between BRP and ice thickness, we plotted BRPr against ice thickness for the whole glacier (Fig. 8). It is clear that there is no systematic relationship between the two variables, so we conclude that BRPr is determined by the ice temperature and/or the bed properties. If ice temperature is the dominant control, we expect low BRPr in areas where glacier ice is relatively warm, and high BRPr in areas with relatively cold ice. If bed properties are the dominant control, we expect high BRPr in areas where the bed is especially reflective, and low BRPr where bed reflectivity is low.
(a) A composite map of spatial variability in BRPr across John Evans Glacier for surveys at 10 and 20 MHz (black dots mark survey locations). The data from the 20 MHz surveys encompass the area to the northeast of the bedrock ridge shown in Figure 6b (see Fig 1 for details). Areas A–C display particularly high BPRr values and are discussed in the text. (b) Basal topography of John Evans Glacier. Mote correlation between valleys/overdeepenings and areas A and B of high BRPr.

Variability in BRPr over the glacier terminus and predicted subglacial water-flow routing (marked by heavy black lines). Letters refer to features discussed in the text. Inflow indicates the location where a large marginal stream disappears beneath the glacier; outflow indicates the location of streams which exit from beneath the glacier terminus. Dashed white lines mark elongated areas D and E of high BRPr. Black triangle marks the location where the elongated area of high BRPr (area E) crosses an area of low BRPr.

Variability in BRPr with ice thickness for positive (a) and negative (b) values of BRPr. Positive and negative values are plotted separately because there is no upper limit to the range of positive values, while negative values cannot be less than −1.

4. Results and Discussion
4.1. Distribution of warm and cold ice
On a glacier-wide scale, there is a marked contrast between the generally negative BRPr over the upper half of the glacier, and the generally positive BRPr over the lower half of the glacier (Fig. 6a). The division between the two areas correlates closely with the location of the equilibrium line at ∼750 m a.s.l. An important question is whether these patterns are due to differences in englacial conditions (i.e. attenuation-related) or basal conditions (i.e. reflection-related). If they are attenuation-related, we would expect to see negative BRPr where the englacial ice is relatively warm, and positive BRPr where it is relatively cold (due to the increase in attenuation rate with ice temperature). This would suggest that ice in the ablation area is generally colder than ice in the accumulation area. This suggestion directly contradicts the results of measurements of the englacial temperature distribution within nearby White Glacier, Axel Heiberg Island (Reference BlatterBlatter, 1987), and Laika Ice Cap, Coburg Island (Reference Blatter and KappenbergerBlatter and Kappenberger, 1988), which show that warm ice is found only in the ablation areas of these two glaciers. It is also inconsistent with hydrochemical evidence for subglacial drainage of supraglacially derived meltwaters beneath the lower ablation area of John Evans Glacier (Reference Skidmore and SharpSkidmore and Sharp, 1999).
Consequently, a more likely explanation is that the BRPr patterns are related to changes in basal conditions. Since water has a very high dielectric constant relative to both ice and rock, and water can only exist at the bed where the ice is warm, the BRPr patterns are consistent with the suggestion that there is cold basal ice in the accumulation area (negative BRPr), and warm basal ice in the ablation area (positive BRPr) (Fig. 6a). In the ablation area, exceptions to this pattern occur along the glacier margin and in the vicinity of a pronounced bedrock ridge, where the ice is thin and BRPr values are low. The ice is likely cold in these locations due to the high englacial temperature gradient that would effectively remove geothermal heat.
A faint but continuous internal reflector that is present over much of the glacier terminus (Fig. 5a) provides further information about the thermal structure of the glacier. This reflector occurs approximately 20 m above the glacier bed in all traces over the centre of the terminus region. Close to the glacier margin, however, it rapidly approaches the bed and then disappears altogether (Fig. 5b). Since the internal reflector is present only in areas with high BRPr, we interpret it as the boundary between cold ice above and warm ice below. A faint reflector is expected at this boundary because warm ice has a slightly higher dielectric constant (ε 1 ∼ 3.3) than cold ice (ε 1 ∼ 3.1) (Reference Macheret, Moskalevsky and VasilenkoMacheret and others, 1993). Similar internal reflecting horizons have been identified in radio-echo sounding records from many other polythermal glaciers. These have also been interpreted as the boundary between warm and cold ice (e.g. Reference Dowdeswell, Drewry, Liestøl and OrheimDowdeswell and others, 1984; Reference BamberBamber, 1987; Reference Kotlyakov and MacheretKotlyakov and Macheret, 1987; Reference Holmlund and ErikssonHolmlund and Eriksson, 1989; Reference BjörnssonBjörnsson and others, 1996; Reference Hamran, Aarholt, Hagen and MoHamran and others, 1996; Reference Moorman and MichelMoorman and Michel, 2000). On White Glacier a warm ice layer up to 40 m thick was identified from temperature measurements in 32 boreholes (Reference BlatterBlatter, 1987). As at John Evans Glacier, this layer occurred in the centre of the ablation zone, and its upper surface was generally parallel to the basal topography, except where the layer decreased in thickness close to the glacier margins. Similar ice-temperature measurements (or thermal modelling) would be necessary to confirm that the internal reflector at John Evans Glacier marks the boundary between warm and cold ice.
It is possible that the presence of the internal reflecting horizon in the glacier terminus region could affect the strength of the bed returns in this area, but we think this is unlikely for two reasons. First, the power of this reflection is always at least two orders of magnitude less than the BRP. Second, if the internal reflector significantly reduced the BRP, one would expect the BRPr to be low over the centre of the terminus, but it is in fact high in this region. The internal reflecting horizon was not observed in the upper part of the ablation area, even though BRPr is high there. This is probably because the 0°C isotherm is at the glacier bed in this area. Flow acceleration and channelling around the bedrock ridge are likely to play a role in generating the warm layer over the terminus.
4.2. Variations in BRPr within areas of warm ice
In this section we investigate the hypothesis that variations in BRPr within the warm-based areas of the ablation zone are a reflection of variations in subglacial hydrology. Figure 6 shows the large-scale variations in BRPr calculated from the exponential best-fit line for the entire glacier (Fig. 4a), while Figure 7 plots BRPr within the inferred area of warm-based ice near the terminus. In this plot, BRPr is derived from the exponential best-fit line to data collected in the terminus area only (Fig. 4b). The terminus plot (Fig. 7) shows differences in BRPr in an area where there is little variability in ice thickness, englacial properties, thermal structure and bed slope. This homogeneity gives us confidence that spatial variations in BRPr over the terminus are caused by changes in the nature of the ice/bed interface.
On the glacier-wide scale, BRPr is particularly high in three areas (A and B in Fig. 6a, C in Figs 6a and 7). Area A is defined by at least 100 individual traces, and extends from near the western glacier margin to the upstream edge of the bedrock ridge. Topographically, this area encompasses a valley bottom, with highest BRPr values (up to 30) in the overdeepened eastern end of the valley. The overdeepening contains ice up to 300–400 m thick, and its base is up to 150 m lower than the lowest point of the subglacial bedrock ridge directly downstream.
The high BRPr in area B occurs in a subglacial valley to the south of the bedrock ridge (Fig. 6b). Values of BRPr are not as high as in area A, but BRP is still up to 10 times greater than predicted. High BRPr values in this area are seen in surveys at both 10 and 20 MHz, and are defined by more than 50 individual traces. This area is also overdeepened by up to 50 m in a location where ice thicknesses are ∼250 m, with the overdeepening in close proximity to the area of highest BRPr.
In area C, BRPr becomes increasingly positive towards the glacier terminus, with values of BRP up to 10 times higher than predicted in the areas furthest downstream. Once again, these values are well defined by more than 100 traces over different transects. In contrast to areas A and B, however, the glacier terminus is not overdeepened.
Within the glacier terminus region there are two narrow, elongated areas with high BRPr (D and E in Fig. 7). These areas are also well defined by traces over several different transects, and have BRP values up to 10 times higher than predicted. The downstream end of area D is close to the location of a large artesian fountain observed on the glacier surface in 1998. The fountain reached heights of up to 5 m, and brought large quantities of solute-rich, turbid subglacial water to the glacier surface. The fountain developed at the onset of the annual outburst flood on 29 June, and was active for 13 days. Outflow of turbid, solute-rich water at the ice/bed interface also began on 29 June (at Outflow1 in Fig. 7) and continued throughout the melt season.
The upstream end of area E coincides with an area where a large marginal stream with low solute concentrations disappears beneath the glacier, and is unusual because it cuts across an area of low BRPr, where the ice is inferred to be cold-based (marked by a triangle in Fig. 7). This elongated area of high BRPr follows the western edge of the study area and is virtually continuous to the downstream edge of the area surveyed. The stream that emerges at Outflow2 (Fig. 7) lies directly down-glacier from this location, and is much less solute-rich than the stream at Outflow1. This implies less time for contact between the water and glacier bed at Outflow2, and is consistent with the suggestion the ice-marginal stream that enters the glacier at the upstream end of area E provides at least some of the water to this outlet.
There are several potential explanations for these high-BRPr areas. One possibility is that we have overestimated the rate of attenuation of the radar energy with depth (which would make the BRPr values too high). This explanation is unlikely, however, as ice thicknesses similar to those found in areas A–C occur in other parts of the glacier, yet high BRPr values are not seen in these regions. In addition, our entire range of estimates of dielectric absorption produce essentially the same patterns. We experimented with a power best-fit line (Fig. 4a) for plotting Figure 6a, as well as applying the terminus best-fit line (Fig. 4b) to the data plotted in Figure 6a, but no significant differences in the BRPr patterns were found. Spatial variations in the thermal structure of the ice may also cause errors when calculating the attenuation rate based on values from different parts of the glacier. The inclusion of data points collected in cold ice would result in the underestimation of radar attenuation in warm ice. This would underestimate BRPr in warm-ice areas, which means that correction for this effect would only serve to accentuate the areas of high BRPr that are the focus of our discussion.
A second possibility is that high BRPr is the result of multiple reflections (e.g. from off-nadir locations) that are included within the window over which BRP is calculated, and which therefore increase the apparent power returned from the glacier bed. This could be a particular problem in overdeepened areas where there is much surrounding topography. Indeed, the largest peak in BRPr in Figure 3d is close to a multiple reflection at the glacier bed in Figure 3a. The BRPr remains high well away from areas of multiple reflections, however, and in general there are very few multiple reflections in the areas of high BRPr. For example, the bed is virtually flat across the glacier terminus, giving little potential for multiple reflections in an area where large variations in BRPr are observed.
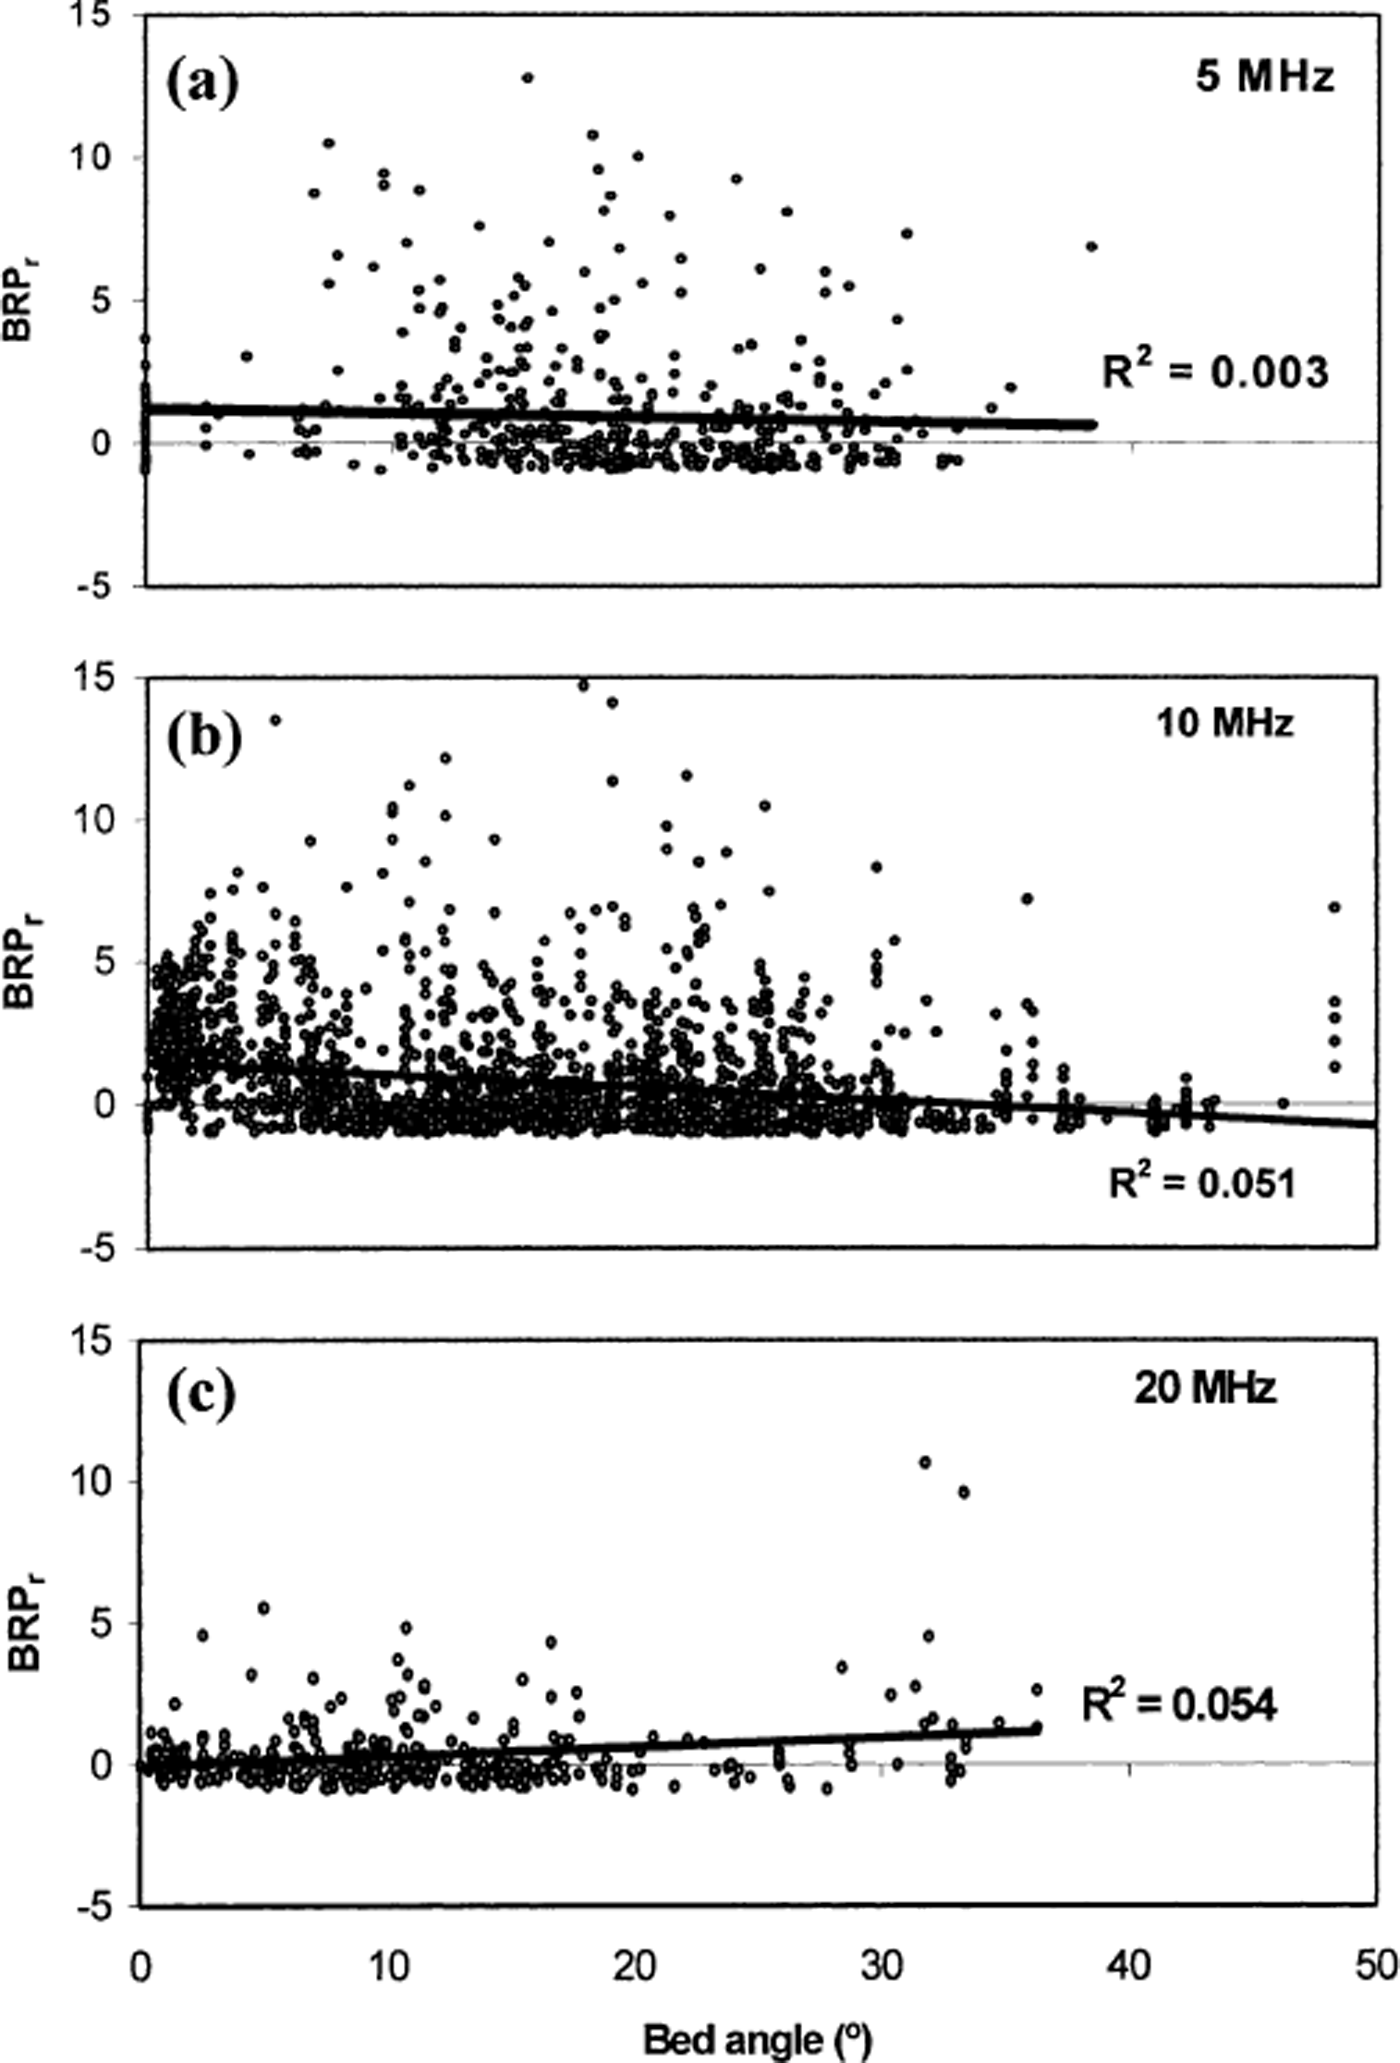
Another possibility is that BRPr is influenced by the incidence angle of the returned bed wave, with lower powers where bed slopes are steep. This could provide an explanation for the high BRPr values in the base of valleys and overdeepenings. To quantify the influence of bed slope on BRPr, we calculated the mean bed slope over a 200 m × 200 m area centred on gridpoints with 100 m spacing across the glacier (Reference Zevenbergen and ThorneZevenbergen and Thorne, 1987). This area encompasses the region from which most bed returns are expected to occur. For each radio-echo sounding measurement, the bed slope of the nearest gridpoint was plotted against BRPr for every point with IRP <2 mV2 ns−1 (Fig. 9). The best-fit lines show no significant or consistent correlation between BRPr and bed slope at any frequency. The r 2 values are 0.003 at 5 MHz, 0.051 at 10 MHz and 0.054 at 20 MHz. Similar results were obtained when BRP was plotted against bed slope (i.e. when ice thickness was not taken into account). In addition, large changes in BRPr occur across the glacier terminus where there is little change in bed slope. From these observations, we conclude that although bed slope may affect individual BRPr values, it does not affect the spatially contiguous BRPr patterns that are the focus of our discussion.
Relationship between bed angle and BRPr for surveys with IRP <2 mV2 ns−1 at: (a) 5 MHz, (b) 10 MHz, (c) 20 MHz. Black line shows best-fit line for each plot.
Having eliminated these explanations, we argue that the observed variations in BRPr are real and are related to differences in conditions at the ice/bed interface. This argument is based upon the following observations: (i) the major variations in BRPr appear to occur within an area of warm-based ice, and (ii) the regions of highest BRPr in the glacier terminus area are found in close proximity to the observed and predicted locations of drainage elements. Since subglacial hydrology is often cited as an influence on BRP (Reference Hamran, Aarholt, Hagen and MoHamran and others, 1996; Reference Bentley, Lord and LiuBentley and others, 1998; Reference GadesGades, 1998; Reference Gades, Raymond, Conway and JacobelGades and others, 2000), we now evaluate the hypothesis that the BRPr patterns are related to spatial variations in the amount or distribution of water at the glacier bed.
4.3. Subglacial drainage reconstruction
We determined likely subglacial water routing at John Evans Glacier by calculating flow-accumulation patterns from gridded values of subglacial hydraulic potential (Φ) (Reference ShreveShreve, 1972; see Reference Copland, Sharp, Noon, Stickley and LongstaffCopland and Sharp, 2000, for details):
where ρ w and ρ i are the densities of water and ice, g is gravity, B is the bed elevation (Fig. 6b), f is the subglacial water pressure as a fraction of ice-overburden pressure, and H is the surface elevation. Water flows from areas of high to areas of low hydraulic potential, and normal to the equipotential contours. Drainage reconstructions were made using values of f from 0 to 1 (i.e. from flow under atmospheric pressure to flow under pressures as high as ice overburden), but no significant differences were found in the predicted flow routing. This is due to the strong topographic control on subglacial water flow beneath John Evans Glacier, particularly around the subglacial bedrock ridge.
Figure 10 shows the subglacial drainage reconstruction. Drainage pathways are shown only for those areas of the glacier where ice is inferred to be warm-based, because water cannot exist where the basal ice is cold. Figure 7 shows the relationship between the predicted pattern of water flow over the glacier terminus and the distribution of BRPr. The drainage reconstruction does not take into account the location of point water inputs to the glacier bed such as crevasses and moulins, but it nevertheless provides a general idea of the likely flow routing.
Subglacial hydraulic potential and predicted subglacial hydrological flow paths for the ablation area of John Evans Glacier for f = 1. Flow is not shown for the accumulation area because the bed is inferred to be cold there.

For areas A and B in Figure 6a, there is a strong correlation between the areas of highest BRPr and areas where water is predicted to flow along valley bottoms and accumulate in overdeepenings (Fig. 10). These overdeepenings are natural sinks for water originating from upstream areas, and provide a focus for water flow across the glacier bed. Reference Hooke and PohjolaHooke and Pohjola (1994) proposed that most water flows englacially across overdeepenings, but this seems unlikely at John Evans Glacier due to the dominance of cold ice throughout most of the ice thickness, and the lack of deep englacial reflectors in the radio-echo sounding returns.
Lower in the ablation area, high BRPr in area C (Figs 6a and 7) may reflect the accumulation of water behind the glacier terminus, where ice is frozen to the bed. Outburst floods occur on an annual basis from the terminus of John Evans Glacier, and can last from days to weeks. The first water to be released during these floods is highly turbid and solute-rich (electrical conductivity (EC) >400 μs cm−1), and contains relatively high concentrations of ionic species that are products of silicate mineral weathering (Reference Skidmore and SharpSkidmore and Sharp, 1999). After the initial release, there is a rapid decrease in EC, which suggests that water which has been stored at the glacier bed for long periods is driven out of the subglacial drainage system at the onset of the annual outburst event, and that more dilute water derived from recent surface melting is flushed through the system later in the summer.
Beneath the glacier terminus, subglacial water flow is predicted to occur along two main pathways that correlate closely with the narrow, elongated areas of high BRPr (D and E; Fig. 7). As discussed in section 4.2, field observations also suggest that subglacial flow occurs in these areas. During the melt season water enters the glacier in close proximity to the upstream end of area E, and exits it near to the downstream ends of areas D and E.
Based on the close correlation between areas of high BRPr and the observed and predicted locations of subglacial drainage pathways, it seems likely that there is a relationship between spatial variations in BRPr and some parameter that describes the distribution of water at the glacier bed. Possible parameters could include the presence/absence of water, the thickness of a basal water layer, the location of major drainage channels or the volume of water contained within basal sediment. This relationship between BRPr and water distribution at the glacier bed most likely arises because the dielectric constant of water (88 at 0°C) is much higher than that of any other naturally occurring subglacial material. For example, common-midpoint surveys show that John Evans Glacier ice has a mean dielectric constant of 3.1 (Reference Copland, Sharp, Noon, Stickley and LongstaffCopland and Sharp, 2000), while the dielectric constant of carbonates, the dominant bedrock in the John Evans Glacier catchment (Reference KerrKerr, 1972), is 6. A wet bed will therefore produce a higher BRPr than a dry frozen bed for the same subglacial material. Spatial variability in BRPr can also be altered by factors such as basal roughness and the electrical conductivity of basal materials. However, we do not believe that spatial variations in the solute content (i.e. electrical conductivity) of subglacial water are a major control on the observed patterns of BRPr In general, we would expect an inverse relationship between the flux of water in subglacial drainage systems and the solute content of the water. Thus, if solute content were the dominant control on BRPr, one would expect to see an association between areas of low BRPr and the observed and predicted locations of major drainage pathways. This is the opposite of what is observed (Fig. 7).
5. Conclusions
It appears that it may be possible to infer the thermal conditions and subglacial water distribution beneath a polythermal glacier from the occurrence of an internal reflecting horizon and the spatial pattern of BRPr. Our results suggest that the pattern of BRPr is influenced by the distribution of warm and cold areas of the glacier bed, and by the location of individual drainage pathways and areas where water accumulates at the glacier bed. The occurrence of an internal reflector likely reflects the transition between cold ice and warm ice below.
Data collection by radio-echo sounding is relatively rapid and inexpensive, and can provide detailed information about subglacial properties over a large area. The method is ideally suited to polythermal glaciers due to their low englacial water content and low englacial scattering compared to temperate glaciers. We expect that the method will work best on glaciers where there are marked variations in hydrology and thermal regime, and where an intensive fieldwork program can be undertaken to fully sample these conditions.
Acknowledgements
Funding and field logistics were provided by the University of Alberta Izaak Walton Killam Memorial Scholarship, Natural Sciences and Engineering Research Council of Canada, Polar Continental Shelf Project (contribution No. 00900), Geological Society of America, and the Canadian Circum-polar Institute of the University of Alberta. We would like to thank the Nunavut Research Institute and the communities of Resolute Bay and Grise Fiord for permission to work at John Evans Glacier, and W. Davis, D. Glowacki, A. Arendt, T. Wohlleben, J. Davis and P.W. Nienow for help in the field. T. Wohlleben, R. LeB. Hooke, A. M. Gades, N. A. Nereson and an anonymous reviewer provided helpful comments on the manuscript.


